Geotechnical Investigation Report · SANDERS & ASSOCIATES GEOSTRUCTURAL ENGINEERING ... results .of...
52
SANDERS & ASSOCIATE S GEO S TRUCTURAL ENGINEERING saGe INTEGRATING EARTH & STRUCTURE Geotechnical Investigation Report Dry Creek Habitat Enhancement Demonstration Projects - Phase 3 Sonoma County, California SAGE Project No. 07-082.02 Prepared for: Inter-fluve Inc. 1020 Wasco Street, Suite 1 Hood River, OR 97031 October 13, 2011
Transcript of Geotechnical Investigation Report · SANDERS & ASSOCIATES GEOSTRUCTURAL ENGINEERING ... results .of...

SANDERS & ASSOCIATES GEOSTRUCTURAL ENGINEERING
saGe INTEGRATING EARTH & STRUCTURE
Geotechnical Investigation Report
Dry Creek Habitat Enhancement Demonstration Projects - Phase 3
Sonoma County, California
SAGE Project No. 07-082.02
Prepared for:
Inter-fluve Inc. 1020 Wasco Street, Suite 1
Hood River, OR 97031
October 13, 2011

INTEGRATING EARTH" STRUCTURE
October 13,2011 Project No. 07-082.02 Task 3.02
Mt:. Michael Burke Inter-F1uve, Inc. 1020 Wasco St., Ste. 1 Ilood Rivet:, OR 97031
RE: Final Geotechnical Investigation Report Dry Creek Habitat Enhancement Demonstration P:tojects Station 325+00 to 383+00 Sonoma County ,California
Dear J\fJ:. Burke:
Sanders & Associates Geost1:uct\lral Engineering, Inc. (SAGE) is pleased to submit this final rcp01't p.resenting the. results .of our geotechnical investigation for the proposed habitat enhancements in Dry Creek, a major tributary to the Russian River in Sonoma County, Cauforrria. Specifically, this investigation was focused on mefust phase of enhancements along anapptoximately 1.1 mile length of Dry Creek, referred to as the Demonstration Reach, which extends from the mc)umof Grape Creek downstream to the mouth of Crane Creek (station 325+00 to 383+(0).
\YJe explored the subsurface conditions at selected off channel enhance11.1.ent sites and a bank. stabilization site by excavating eight (8) test pits and drillinghVO (2) small-diameter borings (Figure 2). In addition, NORCAL Geophysical Consultants performed a geophysical survey at an off channel enhatlcement site '-vhich could not be accessed by conventional mechanized equipment.
In general, we encountered a1lmrial soils consisting .of mi'{tures of gravel and sand Yv-ith interbedded layers of finer materia1. The material .ranged fmm 100se to dense, \;,7ith the least dense materials genet:aHy near the ground surface. Saturated materials were very loose upon excavation and could not maintain excavation cut." or slopes. .
Based on the results of the geophysical survey, the depth to bedrock at Off-Channel Enhancement A.rea D is estimated between 2 and 9 feet on the l10rthwestand southeast ends of a seismic refraction line performed at this site, respectively. The recorded velocities suggest the rock is rippable to moderately rippable with a CAT 91. bulldozer. Bedrock waS not encountered in any of the test pits excavated .at d1e site.
The report submitted herewith contains recommendations regarding site grading, temporary and permanent slopes, slope stability, and bearing capacity. These recommendations a.re based on limited
4180 Douglas Blvd., Ste. 100, Granite Bay. eA 95746 P: (916) 729-8050 F: (916) 729-7706
www.sageengineers.com

i\fr. l\l1chael Burke Project No. 07-082.02 Task 3.02 October 13, 2011 Page 2 of2
subsurface exploration and laboratory testing. Consequently, variations between expected and actual soil conditions m.ay be found dru:ing construction. SAGE should be retained to observe the earthwork to evaluate actual conditions encountered for confonnance with the geotechnical aspects of the plans and specifications.
Please call us should you have questions.
Sincerely yours, Sanders & Associates Geostructural Engineering, Inc.
Darren A. Mack Geotechnical Engineer
Jerry S. Pascoe Geotechnical Engineer.

TABLE OF CONTENTS
1.0 INTRO·DUCTION ................................................................................................................................. 1 2.0 SCOPE OF SERVICES ........................................................................................................................ 2 3.0 SITE CONDITIONS ............................................................................................................................. 2 4.0 GEOLC)CrIC CONDI~rIONS ............................................................................................................... 2
4.1 Regional G·eol.ogic Setting ............................................................................................................ 2 4.2 Site C;.eology ........................................................................................ , .......................................... 3
5.0 SUHSlTRF.ACE CONDITIONS .......................................................................................................... 3 6.0 SEISlYfICrIY ........................................................................................................................................... 5
6.1 Regional Seisto.i.city ....................................................................................................................... 5 6.2 Seismic 11:azards .................................................................................... , ......................................... 6 6.3 Fault Ruptu1::e ................................................................................................................................... 6
7.0 R.F;CO:[vfivIE:NDA~rIO:NS ......................................................................................................................... 6 7.1 Demolition &,C.leating ................................................................................................................. 6 7.2 Fill ivIate.rial and Compaction Requirements ............................................................................ 7 7.3 ./ieration .............................................................................................................................................. 8 7.4 Excavatability .................................................................................................................................. 8 7.5 TelTIpOtru.:y Sl.opes ........................................................................................................................... 9 7.6 Pennane.nt Slopes .......................................................................................................................... 10 7.7 Sl.ope Stability ............................................................................................................................... 10 7.8 Bearing Capacity ............................................................................................................................... 1.0 7.9 De\,vatering ..... , ................................ , ............................................................................................. 11
8.0 SERVICES DURING CONSTRUCTION ...................................................................................... 11 9.0 LItvlrr.A:TIC)NS .......................................... : ........................................................................................... 12 10.0 REFERENCES. ....................................................................................................................................... 13
FIGURES
Figure 1 Figure 2
APPENDICES
Site Location I\'fap Subsurface ExplomtionMap
Appendix A - Field Exploration Program
Figure /\.-1 Soil Classification Chart
.Figures .Ac2 Logs of Soil Bm:i.ngs H1 and 132 throughA··3
FigureAA Logs of Test Pits TPl through TP8
Appendix B - Laboratory Test Results
Appendix C - Geophysical Survey Report

iNTEGRATING EARTH & STRUCTURE
FINAL GEOTECHNICAL INVESTIGATION REPORT Dry Creek Habitat Enhancement Demonstration Projects
Station 325+00 to 385+00 Sonoma County, California
1.0 INTRODUCTION
Sanders & Associates Geostructutal :Engineering, Inc. (SAGE) is pleased to subllut this final report presenting the results of our geotechnical investigation for habitat enhancements in Dty Creek, a major tributary to the Russian River in Sonoma County, California. Specifically, tIus investigation was focused on tile fu:st phase of enharicements along an approximately 1.1 mile length of Dty Creek, referred to as the Demonstration Reach, which extends from tile mouth of Grape Creek downst1:eamto tile mouth of Crane Creek (STA 325+00 to 383+00).1
The purpose of llie proposed habitat enhancements is to develop summer rearing and winter refugia habitat for local fish species, specifically coho salmon and steelhead trout. Based on our review of the 60ryo Dty Creek Habitat Enhancement Demonstration Projects plans, we understand this wi11 be achieved using a combination of enhancement approaches, including backwater ponds and channels for the fish to inhabit. The back:water ponds and channels'iv:illrequire excavation in stream terraces adjacent to the active stream channel. Slope inclinations for channel regrading are e~'Pected to be on the order of 2H:1V or flatter, willi cuts up to 15 vertical feet. In channel enhancemenT measures ~--in include new riffle areas, deepening of existing pools, and consth1ction of artificial log jams.
In addition, stabilization of the creek banks 'will be 10ca1ly required to retain property and to enhance the habitat characteristics along the edge of Dry Creek. Anticipatep. bank sta.bilization measures will include: (1) flattening the existing slopes and c'ovet-ing WitI1 hiodegmdable fabrics; (2) bank reconstt'1lCtion using log cribs wim live willow cuttings; and (3) bank reconsth1ction using fabtic encapsulated soil (FES) with live willow cuttings. The log cribs will have nonlinal widths (petpendicular to slope) of 10 to 17 feet, and will be tlnderlain at the toe by 3-foot-wide by 5-footdeep pads of 18-inch-minus rock. Backcuts for taller stabilizatioli effurts are expected to consist of temporary slopes, although shoring may be required locally where layback space is limited by the presence of existing vineyards.
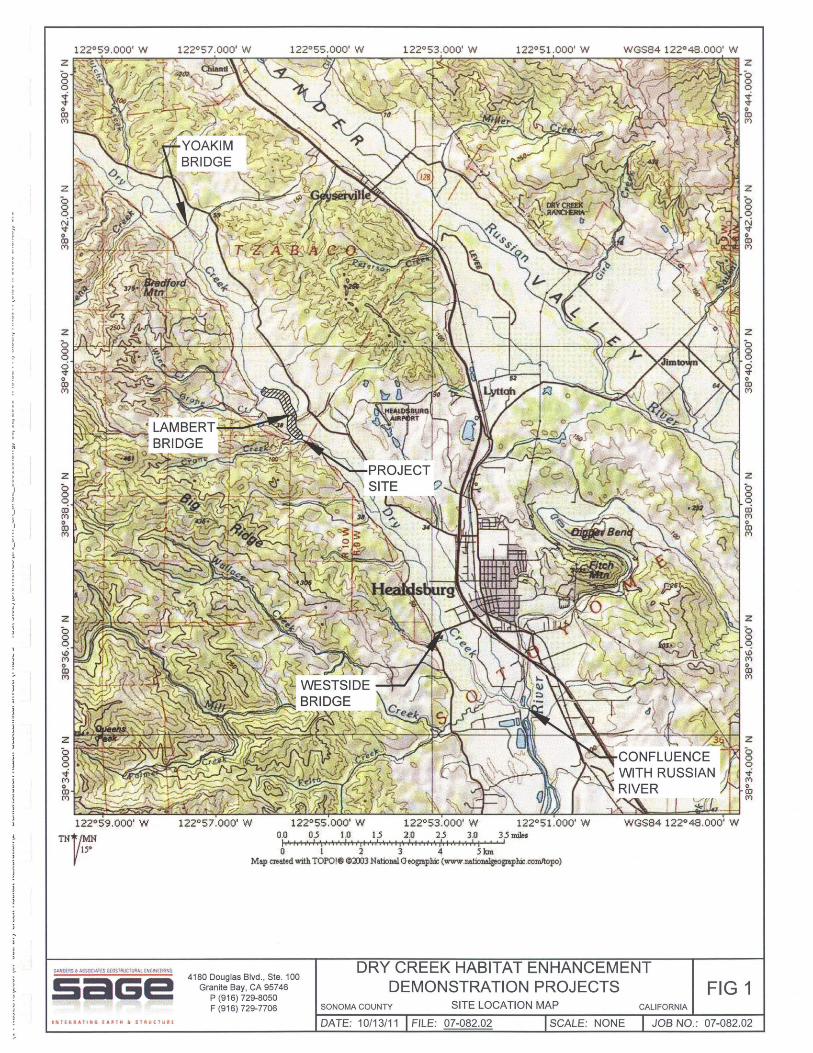
The approximate project location is ShO\\711 on the Site Location Map (Figure 1). The important project featrn:es ate shown on the Subsurface Exploration Map (Figure 2).
Project stations (STA) are based 011 the 60% Dry Creek Habitat Enhancement Demonstration Projects plans pt:epared by Inter-Fluve, dated .[\pril1.5, 2011.
Sanders 8. Associates Geostructural
4180 Douglas Blvd., Ste. 100, Granite Bay. CA 95746 P: (916) 729-8050 F: (9i6) 729-7706
vi,w/.sageerlgineers.com

Geot.echnicallnvesrigatioIl Report Dry Creek Habitat Enhancement Demonstration Projects l'roject No. 07-082.02 T:lsk 3.02 October 13, 2011 p.2
2.0 SCOPE OF SERVICES
\ve perfom1.ed a subsurface investigation ill support of the proposed habit.at enhancements for the Demonstration Reach. We have summarized the observations and feS1..uts of ou.r illiTe,stigation in this geotechnical report, which provides recommendations and conclusions for developing the habitat enhancement design. Specifically, our investigation consisted of:
.. Conducting a site reconnaissance to review seleCted locations for subsurface exploration;
.. Obtaining the necessary drilling per:r111ts and coo.rdinating our subsurface exploration program;
.. Retaining the services of a private utility locator to dear in\"estigation locations for possible underground utiliti.es and/or buried objects;
.. PerfOr11'llng a subsurface exploration program including eight (8) test pits and two (2) soil borings;
.. Pe.rforming a geophysical sm-vey at an off channel enhancement site which could not be accessed by conventional mechanized equipment;
.. Collecting representative samples of the soil encountered in the test pits and soil boti.ngs; ® Perfonning laboratory testing on selected soil sa11.1ples; and .. Preparing this .geotech:r:ricalreport.
3.0 SITE CONDITIONS
Dry Creek is an incised stream. with flows regulated by the upstre-an1 Warm Springs Dam. Flow regulation has reduced the frequency and severity of major floods while providing a continuous base flow during the summer months. ]'his has resulted in the rapid growth of dense riparian vegetation and shrubs along the channel banks and fOl111.e:t1y active bar surfaces since the dam '.vas putinto service in 1.984. Where visible thmugh the dense vegetation, the channel banks are generally steep to very steep and locally subject to erosion. Alluvial terraces are locally preserved along the Demonstration Reach, and are positioned above the active stream channel. These terrace surfaces, including a pm:minent terrace at Off Channel Enhancement Area C (Figure 2), ate .re1atively flat benches with areas of dense vegetation to open grassy meadows.
4.0 GEOLOGIC CONDITIONS
4.1 Regional Geqlogic Setting
The Demonstration Reach is located in the Dry Creek drainage valley within the Coast Ranges geomorphic province of Califor:r:ria. The Coast Ranges province is generaUy characterized by northwest-trendino- mountain ranoes and interveninG' valle,'s that are controlled bv right-lateral b 0 .,0 J ..! 4..
strike-slip faulting along the San Andreas fault system.
Review of available geologic mapping and literature sources indicate that the Dry Creek drainage valley is a structurally-controlled valley that generally lies 011 the boundary bet\veen sedimentary units

Geotechnical Investigation Report Dry Cl'eek Habitat Enhancement Demonstration Projects Project No. 07-082.02 Task 3.02 October 13,2011 p.3
of the Great Valley Complex to the east and various fault bounded lenses of the Coast Range ophiolite and met.amorphic rock units of the Franciscan Comple..x t.o the west (Blake, C:n:aymer, and Stamski, 2002). However, sandstone, siltstone, and shale units belongirtg to tile Great Valley Complex are also lllapped along the western margin of tile valley adjacent to the Demonstration Reach. The valley is filled ",,1.t11 stream channel and floodplain deposits associated with Dty Creek and include up to tiuee terrace deposits, the oldest of which appears to be approximately 1,000 yeats old (Harvey and Schumm, 1985).
4.2 Site Geology
Geologic conditions at the site are generally similar to those depicted by Huffmail and A1:1TIstrong (1980) and Blal{e, Graymer, and Stanlski (2002). In general, the DCll1onst.ration Reach is underlain by alluvial deposits of varying age. The deposits are comprised of clay, silt, sand, gravel, and cobble mixtutes of varying rod: types derived from tributaries extending into the adjacent Coast Range ophiolite, Great Valley Complex, and Franciscan Complex. The YOUllgest alluvium is found within the active stream cllannel and low-lying gtavcl bars that are seasonally inundated .
.Alluvial terraces are presel'ved along the length of the Demonstration Reach, and are comprised of older alluvial deposits. The position of these terraces relative to the active streatrt channel varies along the reach. In general, te:rraces positioned higher than the active stream channel are well vegetated, particularly the prominent terrace at Off Channel Enhance1nent Area C (Figure 2). ShaUow slope failures ate locally present along the active channel and tel1:aCe banks in areas where the banks are actively being undercut.
Bedrock outcrops observed along the active stream channel are generally limited to Grape and Crane Creeks near tile confluence with Dry Creek, and within the Dly Creek channel below and inunediately downstream of Lambeti: Bridge. The exposures are comprised of interbedded layers of weak siltstone and somewhat stronger, thicker beds of sandstone that appear to be consistent \\>1th descriptions of the silts tOlle, sandstone, and shale units of the Great Valley Complex. In general, the siltstone and sandstone exposures can easily be broken \"vith a rock hammer, and are expected to be excavatable using conventional grading equipment. At Grape Creek, the bedrock is locally folded along a west-southwest plunging axis approximately parallel to the apparent sy"ncline evident in the mapped Great V alley Complex units exposed on the westem flank of the valley.
5.0 SUBSURFACE CONDITIONS
We ex-plored the subsurface conditions at selected off channel enhancement sites and bank stabilizutic)U site by excavating eight (8) test pits and dt.iJling two (2) small-diameter b01'ings (Figure 2). In addition, NORCAL Geophysical Consultants (NORCA .. L) perfonned a geophysical sUlveyat an off channel enhancement site which could not be accessed by COllventional mechanized equipment. Table 1 summarizes the subsurface exploration performed. A description of our field exploration ptogranl, as well as tile test pit and borings logs, is presented in Appendi.'( A. 'I11e results of labomtoty testing are presented in Appendix B.

Geotechtucal Investigation Report Dry Creek Habitat Enhancement Demonstration Projects Project No. 07-032.02 Task 3.02 October 13, 2011 p.4
TABLE 1. SU1EvL-\RY OF EXPJ.oRA.TION LOCATIONS
Off Channel Enhancement Area A Bank Stabilization fSTA 334+00 - 337+(0)
Off Channel Enhancement Area C Bank Stabilization CSTA 360+00 - 363+55,
STA 365+10 - 365+80) Off Channel Enhancei'n.ent Area D
groPert )' . ·O-i.vner(s) .' Wallace &
Farrow Van Alvea Maschel1.n1
Seghesio
i Subsurface Exploration.
Test pits (TPS to TP8)
Test its (Tr1 thm TP4) Soil borings (Bl, B2)
Creo hysical survey
TPl through TP4 were excavated at Off Channel Enhancement Area C The upper 6 to 12 indles of TP1 through TP3 Were composed of loose to medium dense gravelly silt and silty gravel with organic material. TP4 exposed four feet of medium stiff gravelly day at the surface of the excavation. Below rIle surficial layer, we encountered easily excavatable loose to medium dense sand and gravel l11ixtures. (;'round\vater was encountered around Elevation 122 feet in each test pit.
Soi1s encountered in TP5 throughIP9 generally comptised sandy gravel ,:vith trace fines and cobbles up to '10 inches in dimension. Localized laye.t~ of sal1dand dayey sand were also encountered. '111.('; subsurface mater.ial was loose to medium dense and could be easily excavated. Gr.oundwaterwas encounter.ed between Elevation 115 and n 8 feet.
The soils encounter.ed in Bl and B2 indicate that the upper 13 to 1.5 feet of the cl:eek bank is variable. In I51, we encounter.ed loose to medium dense silty sand and sand. In H2, we encountered medium stiff to stiff day with some silty sand. Below 15 feet,we encountered sand and gravel w';th val'yingsilt and day content. Groundwater was between 21 and 23 feet below existing grade, which corresponds to elevations of 121 to 122 feet.
The water level in Dry Cr.eek was measured adjacent to 11)-1 and TP-5. At these two locations, the measured groundwater elevations in the test pits were approximately the same as the adjacent water surface elevation i.n Dry Creek. Although not measu.red in the field, we would e:ll.-pect simUar results for the remaining test pits.
The test pit side slopes were marginally stable in dry to moist conditions. However, rapid caving or sloughing generallyoccur.red below the water table, particularly where active seepage was encountered, ,vroch limited the depth of the test pits.
Altl1(mgh bedrock of the Great Valley Complex is visible in Grape and Crane Creeks near the confluence with Dry Creek, and within Dry Creek below and llnmediatdy downstream of Lambert Bridge, hedrock was not encountered in the test pits and borings. At Off Channel Enhancement .Area D, the. results of the NORCAL survey suggest the depth to sedimentary bedrock is bet'iveen 2 and 9 feet below existing grades on the northwest and southeast ends of me seismic refraction1ine,

Geotechnical Investigation Report DlY Creek Habitat Enhancement Demonstration Projects Project No. 07-082.02 Task 3.02 October 13, 2011 p.5
respectively. The recorded velocities suggest the rock is rippable to moderately l':ippable \vith a CAT 9L bulldozer. The approximate location of the seismic line is shown on Figure 2, and the full geophysical report is presented in Appendix C.
6.0 SEISMICITY
6.1 Regional Seismicity
Seismicity is defined as the geographical and historical distribution of earthquakes, or more sitnply, earth'luake activity. The potential for ground shaking at the site is related to earthq"uake activity that might occur along nearby or distant faults. Based on historical earthquake activity and fault hazard mapping, the Sonoma County region is considered to have a relatively high potential for seismic activity related to the San Andreas fault system.
The 2002 Working Group 011 Califomia Earthquake Probabilities (\'\VGCEP) suggests the ove1"all l)robability of one or mote JVIw2:6.7 earthquakes occurring in the San Francisco Bay region during the period from 2002 to 2032 is 62 percent (\VGCEP, 2003). The highest probability of 27 percent was assigned to the Hayward/Rodgers Creek fault zone.
The closest active faults in this system are the Maacama and Rodgers Creek faults, which are mapped approximately 6 lillles northeast and 8 miles southeast of the site, respectively. The San Andreas fault is mapped approxi11.1ately 20 nllles southwest of the site.
Regional fault maps and <i'ttabases (Jenningset al., 2010; USGS, 2010) and a fault evaluation report (Biyant, 1982) show several strands of the Healdsburg fault within and adjacent to the Diy Creek drainage valley. No strands are mapped as crossing or projecting towards the Demonstration Reach. Seismically, the Healdsburg fault comprises an approximately one mile wide system of northwest trending, right-lateral strike-slip fault strands. Illese si:l:ands appear to be a northwest extension of the Rodgers Creek fault and define part of a complex seismic stepover with the Maacama fault to the north (tvIcLaughlin and Sarna-Wojcicki, 2003). Both the Rodgets Creek and Maacama fault systems arc zoned as activc2 lU1der the State of Califol'rua Alquist-Priolo (AP) Earthquake Fault Zoning Act (BiJant and Hart, 20(7).
Although not currently zoned as active under the AP Act, workers mapping in the surrounding l:egion considered S0111e traces of die Healdsburg fuult to be "recently active" (fluff man and Annstrong, 1980) or "Quaternary active" (Blake, Graymer, and Stamski, 2002). Based on available paleoseismic studies for the region and dIe snuctura11:elationship of the Healdsburg fault with. the active Rodgers Creek and Maaca.lllil fault systems, the Healdsburg fault should be considered potentiallyactive3
•
2 Active faults are defined as those exhibiting either surface ruptures, topographic features created by faulting, surface displacements of Holocene (younger than about 11,000 years old) deposits, tectonic creep along fault lines, and/or close proximity to linear corlcentratiolls or trends of earulquake epicenters.
Potentially active faults displace geologic deposits of Pleistocene age (about 2 milliOll to 11,000 years old).
Geotechnical Inve_stigationReport Dry Creek Habitat Enhancement Demonstration Projects Project Ko. 07-082_02 Task 3_02 October 13, 2011 p.G
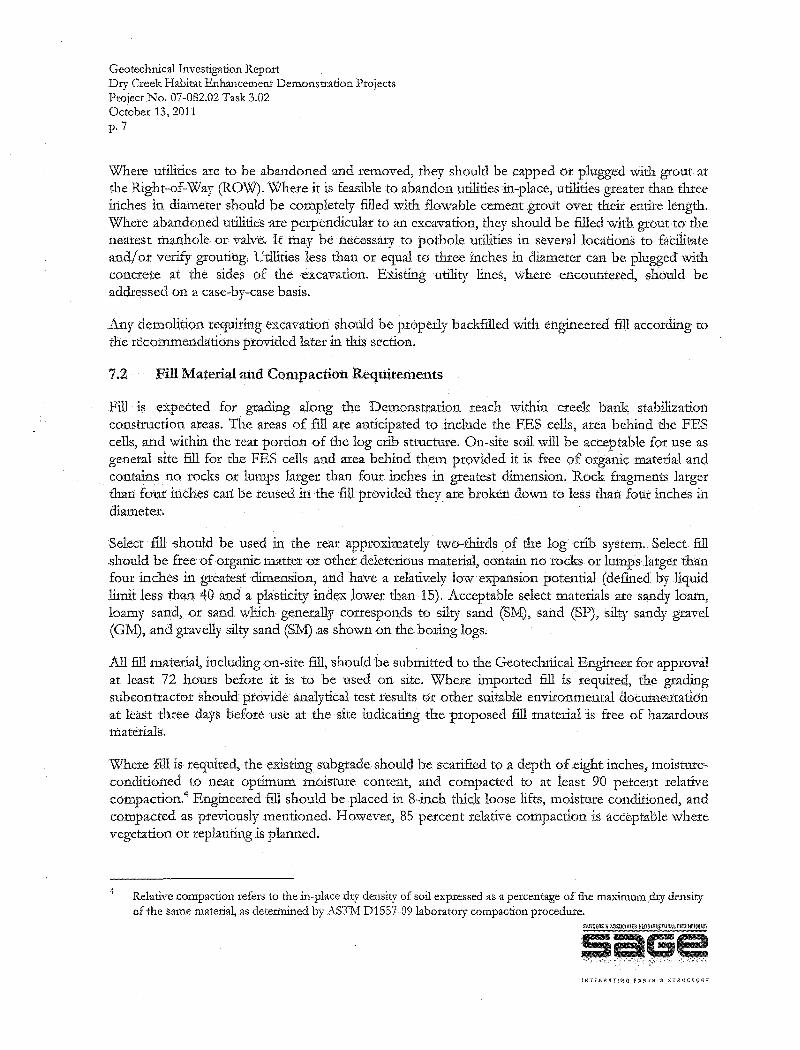
6.2 Seismic Hazards
Based on the close proxi11uty of the site to the Maacama, Rodgers Creek, and other major active faults in the area, there is a high potential for the site to experience moderate to very strong ground shaking dming a major earthtJuake on one of these faults. -n1e intensity of eattbquake ground motion at the sit<:: will depend on the charactel'istics of the generating fault, the distance to the earthquake epicenter, the magnitude and dmation of the earthquake, and specific site geologic conditions.
In addition, given the sandy nature of the materials and high elevation of the groundwater table encountered during the subsmface excavation, liquefaction may occm. It is possible that liquefaction or ground shaking may damage the bank stabilization structures due to lateral spreading. However, damage caused by ]~teral spr.eading should .no: cause a safety hazar.d for. the local population since the improvements are for the remediation of an existing habitat and ru:e not lnfrast1'Ucture related. Therefore, recommendations regaxding liquefaction and liquefaction mitigation were not included in om scope of work. .
6.3 Fault Rupture
Given the structural relationship of the l-Iealdsburg fault with the active Rodgers Creek and Maacama faults, there is a reasonable chance of ground surface rupture along traces of the Healdsburg fault during a major earthquake on either of the active faults. Stereoscopic analysis of aerial photos and digital imagery suggests that one. or mote low sinuosity reaches of Dry Creek upst.ream/ downstream of the Demonstration Reach fnay be st1'Ucrurally controlled along unmapped traces of the Healdsburg fault or other lineaments that may be associated with the fault. However, the Demonstration Reach is a higher sinuosity reach that does appear to be structura1 controlled. In addition, given the nature of tl1e proposed habitat enhancements, any potential fault offset would be unlikely to have any significant impacts to the long tenn performance.
7.0 RECOMMENDATIONS
We believe the ptoposed construction is feasible from a geotechnical standpoint provided om geotechnicall:ecommendations are incorporated into project design and construction. The primary geotechnical considerations for the site ar.e the excavatability of the native s1.1bsru:face .111.aterial and stability of temporary and permanent slopes. In accordiUlce with our scope of sel"v-1ces, the following subsections present our r.ecommendations for site grading, temporary and permanent slopes, and excavations.
7.1 Demolition & Clearing
Site demolition is expected to be minimal, but could include the removal of existing below-grade improvements, if any, that will inter.fere wlth the proposed construction. 111ese could include utilities, culverts, and abandoned auto bodies.
Geotechnical Investigation Report Dry Creek Habitat Enhancement Demonstration Ptojects Pmject No. 07-0S2.02 Task 3'()2 October 13, 2011 p. 7
Where utilities arc to be abandoned and removed, they should be capped o.r plugged with grout at the Right-of-Way (ROW). Where it is feasible to abandon utilities in-place, utilities greater than three inches 1n dia111.eter should be completely filled with .flowable cement grout over theirent1re length. \X7here abandoned utilities are perpendicular to an excavation, they should be filled with groutt() the ne~lrest manhole or valve. It may be necessaq to pothole utiliuesin sevetallocauons to facilitate and/ot verify grouting. "Utilities less tilan or equal to wee inches In diameter can be plugged witi1. concrete at the sides of tile excavation. Existing utility lines, where encountered, should be addressed on a case-by-case basis.
Any demoliuonrequiring excavauotl should be properly backfilled witil engitlecred fill according to the retotnmendauons provided later in this section.
7.2 Fill Material and Compaction Requirements
Fill is e..~pected for grading along the D(;!monsttation reach within creek bank stabilization construction areas. 'nle areas of fill are anucipated to include the FES cells, area behind the FES cells, and within the rear portion of the log crib st.mcture. On-site soil will be acceptable for use as genetal site fill for the FES cells and area behind them provided it is free of organic material and contains no rocks or lumps larger than four inches in greatest dinlension. Rock fragments larger tilan four i11dies tali be reused in the fill provided they are broken dCfWl1 to less than fout inches in diameter.
Select fill shotlld be used in the rear approximately t\vo-tilitds .of the log crib system. Select fill should be free of organic matter or other deleterious material, contain no rocks or lumps larger than four inches ill greatestdlmension, and have a relatively low expansion potelltial (defined by liquid limit less than 40 and a plastitityindex lower than 15). Acceptable select materials are sandy loam, loamy sand, or sand which generally corresponds to silty sand (S1vI), sand (SP), silty sandy gravel (G11), and gravelly silty sand (Sl\t1) as shawn 011 the boring logs.
All fi1lmaterial, including on~site fill, should be submitted to the Geotechnical Engineer for approval at least 72 hours before it is to be used on site. Where imp01'ted fill is required, the grading suhcont.ractor should l)tovide ~'tnalyucal test results c:>r other suitable environmental documentation at least three days before use at the site indicating the proposed fill material is free of hazardons tuateri.als.
Where fill is required, the existing subgradeshould be scarified to a deptil of eight inches, moistnreconditioned to near optimum moisture content, and compacted to at least 90 percent relative compaction.4 Engineered fill should be placed in 8-inch thick loose lifts, moisture conditioned, and compacted as previously mentioned. However, 85 percent relative compaction is acceptable where vegetation or replanung is planned.
RelutiYe compaction refers to the in-place dry density of soil e};.-pressed as a percentage of the maximumd.l), density of the same material., as determined by A<)'111-1 D1SS7··09 laboratory compaction procedure.

Geoteclmical Investigation Report Dry Creek Habitat Enhancement Demonstration Projects Project No. 07-082.02 Tas.k 3.02 October 13, 2011 p,B
Prior to compaction, each layer should be spread evenly and mi.xed to obt.1.in unifonnity of material In each layer. The fill should be brought to a water content that ",rill permit proper. compaction by either (a) aerating the material if it is too wet, or (b) spraying the material "vi.th water if it is too dry. Compaction should be performed by footed rollers or other types of approved compaction equipment and methods. Backfill behind the log crib stmctures should be compacted using light (hand-operated) compaction equipment, unless larger equipment is approved by the designer. Compaction e(luipment should be of such design that they win be able to compact the fill to the specified density. Rolling of each layer should be continuous over its entire area and the equipment should make sufficient passes to ensure that the required density has been obtained. Flooding or jetting is not pcnnitted with the exception of the 18-inch 11.1lnUS matel'ial within the crib structure.
'fhe standard test used to define maximum densities and optimum moisture content of all compaction work sha.n be the Laboratory Test procedure ASTM D iSS7.Field tests shall be e:h"Ptcssed as a .relative compaction in terms of the maximum dry density and optimum moisture content obtained.in the laboratory by the foregoing standard procedure. Field density and moisture tests should be made in each compattedlayer by the Geotechnical Engineer in accordance w-ith Labotatory Test Procedure .ASTM D6938. \X7hen footed roners are used for compaction, the density and moisture tests sha.ll be taken in the compacted material below the surface disturbed by the roller. W11en these tests indicate that the compaction requirements on any lay(.>t' of fill, or portion thereof, h2.V-C not been met, the particular layer, or portion thereof, shall be reworked until the compaction requiren1.ents have been met.
7.3 Aeration
If wet subgrade conditions are encountered at the site, or the base of excavations or backfJll areas become soft, unstable and/or disturbed by construction equipment, it may be necessary to stabilize the base of the excavation prior to fill place,ment. For granular soils, particularly gravels, installation of sumps to locally lower the water level will likely be sufficient to stabilize the material provided the pumps are large enough to keep up with infiltration. For clayey soils, the least costly stabilization measure typically consists of aeration (drying) of the wet soil to reduce its moisture content to a compactable leveL However; depending on climatic conditions, several days to several weeks of relatively warm, dry weather may be re(luircd to dry the soil to an acceptable lcv-e!. In addition, it is often necessary to tm:n the material sevcral times a day to promote uniform drying. The soil will be deemed sufficiel1tly aerated when the required degree of compaction can be achieved and/or the resulting subgrade surface is fum and unyielding.
7.4 Excavatability
Based on the results of our borings and test pits, we believe standard c011Stmction equipment, such as a hydraulic excavator, should be able to complete the excavations required for the proposed habitat improv-ements. The encountered materials were generally loose to medium dense and were easily excavated. No cemented soils or bedrock: 'was encountered in our borings or test pits.
Geotechnicallnvestigatiol1 Report Dry Creek Habitat Enhancement Demonstration Projects Project No. 07-082.02 Task 3.02 October 13, 2011 p. 9
Based on the prelimina:tT results of the seismic refraction line performed at .A.rea D; bedrock appears to be about 2 to 9 feet below existing grade, The repmted seismic velocities range fJ:Omabout 1,000 feet per second ill overburden n'laterials to over 6,800 feet per second in bedrock, which suggests the bedrock is rippable to marginally rippable using a CAT D9L bulldozer. We ex-pect bedrock encountered at Crane Creek'; Grape Creek, .and Lambert Bridge '\-v-ill be sllnilar.
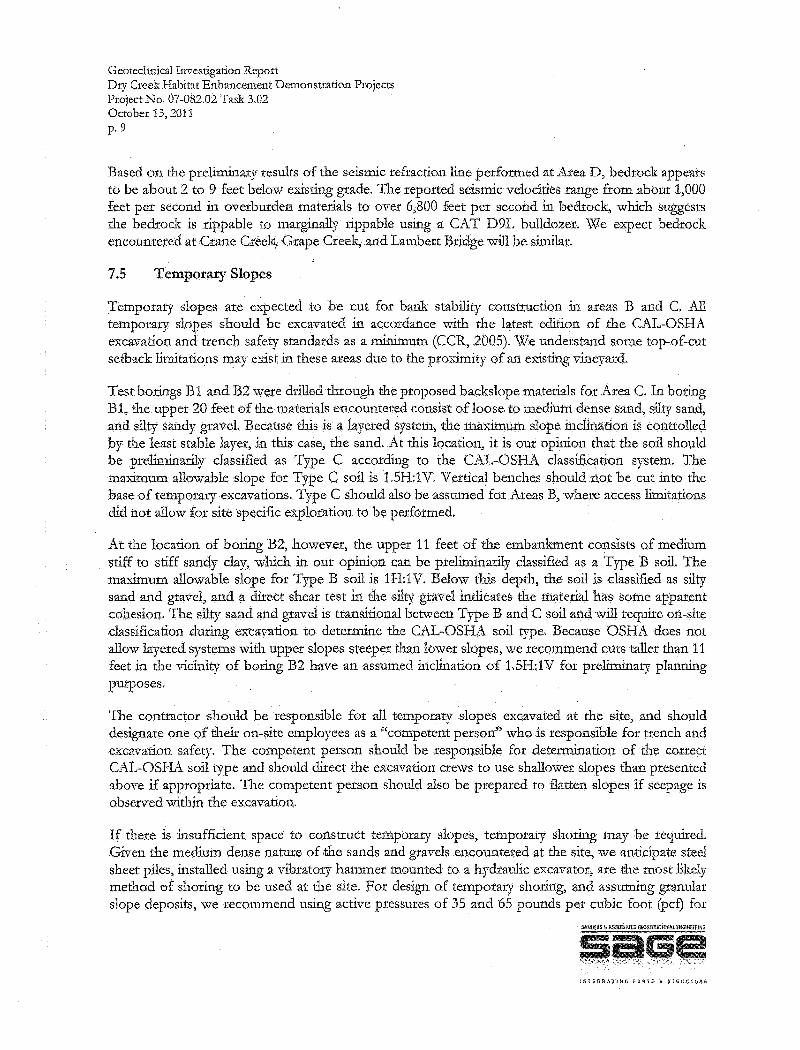
7.5 Te1ilporary Slopes
Temporary slopes are expected to be cut for bank stability constluction in areas Band C. All temp01:ary sl.opesshould be excavated in accordance with the latest edition of the CAL-OSHA excavation and trench safety standards as a minimum (CCR, 2(05). We understand some top-of-cut setback limitations may exist in these areas due to the proximity of an existing vineyard.
Test borings Bland B2 were drilled through the proposed backslope materials for Area C. In boring Bl, the upper 20 feet of the materials encountered consist of loose to l'nediu1:Ii dense sand, silty saIid, and silty sandy gravel. Because this is a layered system, the 1'l'laxllnum slope inclination is contto.l1ed by the least stable layer, .in this case, the sa:nd .. At dus location, it is our opinion that the soil should be preliminarily classified as Type C according to the CAL-OSl-L.l\ classification system. The maxllnU11l allowable slope for Type C soil is 1.5H:1V. Vertical benches should not be cut into the base of temporary excavations. Type C should also be assumed for Areas B, where access limitations did not allow for site specific exploration to be performed.
At the location of boring B2, however, the upper 11 feet of the embankment consists of medium stiff to stiff sandy clay, wluch III our oplluon can be preliminarily classified as a Type B soil. The maxllnum allowable slope for Type B soil is 1H;lV. Below tins deptIl, the soil is classified as silty sand and gravel" and a direct shear test III the silty gravel indicates the tnaterial has sotne apparent cohesion. Th(;~ silty sand and gravel is transitional between Type Band. C soil and will require on-site classification during excavation to deterrcine the CAL-OSHA soil type. Because OSHA does not allow layered systems witll upper slopes steeper than lower slopes, we recommend cuts taller than 11 feet in the vldnity of boring B2 hilve a11 assumed lllclination of 1.5H:1V for preliminaty planning putposes.
'£11e contractor should be responsible for all temporal, slopes excavated at the site, and should designate one of their on-site employees as a «competent person" who is responsible for trench and excavation safety. The c0111petent person should be responsible for determinatiOl.l of tile correct CAL-OSHA soil type and should direct the excavation ctews to use shallower slopes than presented above if appropriate. The competent person should also be prepared to flatten slopes if seepage is observed "rit11in the excavation.
If thel:e is insufficient space to construct temporary slopes, tempora11 shorlllg may be required. Given the medium dense nature of ,tile sands and gtavelsencounteted at the site, we anticipate steel sheet piles, lllsta.l1ed using a vibratmy hammer mounted to a hydraulic excavator, are the most likely method of shoring to be used at dle site. For design of temporary shoxing, and assuming granular slope deposits, we recommend using active pressures of 35 and 65 pounds per cubic foot (pcf) for
Geotechnical Investigation Report Dr] Creek Habitat Enhancement Demonstration Projects Project ~o. 07-082.02 Task 3.02 October 13,2011 p. 10
level ba.ckslope conditions and a maximum backslope of 1.SH:IV, respectively. Passive resi<;tance should be computed using allowable passive pressures of 300 and 145 pcf above and below the groundwater table, respectively. These passive pressures include a factor of safety of 1..5 to limit sheet pile deflections.
7.6 Permanent Slopes
Permanent slopes are e:h'Pected to be cut for channel regrading and also filled as part of FES bank stabilization construction. Cut slopes will generally be excavated in gravelly sands and sandy gravels ,vith no appreciable cohesion. Fill slopes \vill likely consist of predominately granular soils or fine grained soils with little cohesion. Therefore, an permanent slopes should have a maximum finished slope of 2H:1V. Permanent slopes should be revegetated and/ or be covered in. biodegradable fabrics as shown in the finalconsttuction plan set.
7.7 Slope Stability
\'VTe understand bank stabilization will be perfonued at Off Channel Enhancement Area Band C. For slope stability evaluation at these locations, .a cohesion of 250 psf and a friction angle of 24 degrees is applicable for intact native soils or recorrlpacted native soils within the upper 15 feet of the creek bank slopes. Wnere imported soil meeting the requirements presented in section 7.2 is used, or for intact native soils 'below 15 feet, a friction angle of 32 degrees (no cohesion) can be used.
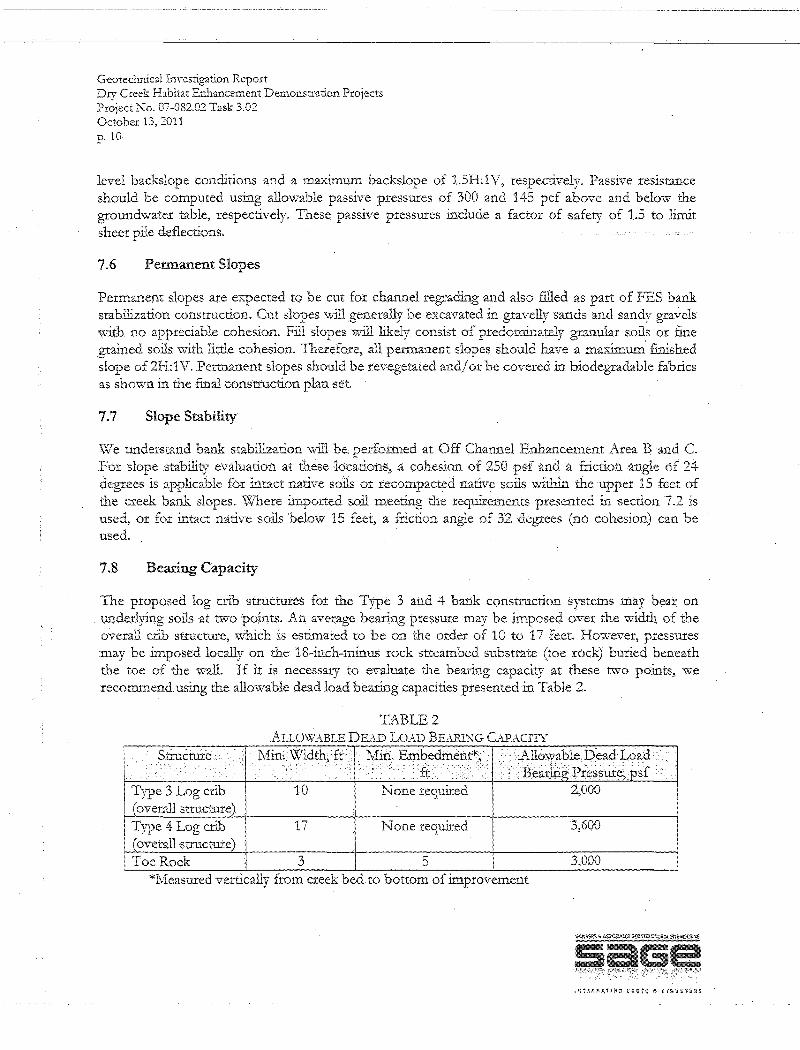
7.8 Bearing Capacity
The proposed log crib sttuctures for the Type 3 and 4 bank construction systems may bear on undetlyingsoils at nvopoints .. An average bearing pressul:e may be imposed over the width of the overall crib sttucture, '\vhich is estimated to be on the order of 10 to 17 feet. However, pressures may be :imposed locally on the 18-1nch-ctmnus rock streambed substr.ate (toe rock) buried beneath the toe of the wall. If it is necessary to evaluate the beari.ng capacity at these two points, we recommend using the allowable dead load bearing capacities presented in Table 2.
TABLE 2 ALLOw.,mLE DEAD LO,\1.) BEARING CAPACITY .. ---.-.. ~.
. Structure l'vf:in .. Width,'fi . Mhi., Embedment*', Allowable. Dead Load , ......
ft . Bearirig: P;essme, psf· ..... Tn)e 3 Log crib 10 None tequired 2,000
I (overall structure) Type 4 Log crib 17 N one required 3,600
(overall structure) Toe Rock 3 5 3,000
*Measured vertlcally from creek bed to bottom of tmprovement

Geotechnical Investigation Report Dry Creci{ Habitat Enhancement Demonstration Projects Project No. 0.7-0.82.02 Task 3.02 October 13, 20.11 p.11
These values assume fully saturated (sub111.erged) soil conditions and a factor of safety of at least 3 for dead load conditions. The toe pressures are provided asa check to ensure that excessive toe pressures at not imposed, which could cause the bank stabilization system to settle and/or rot.ate toward the channel.
7.9 Dewatering
Many of the proposed improvements will be constructed within the active creek channel. While construction of improvements outside of and above the water line of the active creek is feasible with flow in the channel, many of the proposed improvements will reqnire work below the water line. W01:king within areas of active creek: flow has severallirnitations which include, but are not limited to:
lit the presence of soft/saturated soils and an unstable working base;
lit difficulty in obtaining proper compaction;
., increased turbidity in the water due to disturbance of saturated soils, especially silty sand; and
.. the potential for introduction of hydrocarbons into the water from construction equipment.
Therefore, where fill is to be placed and/or where improvements are to be const.1ucted below the water line, the work areas must be dewatered. The water level must be lowered to at least 2 feet below the bottom of the excavations. Due to the extent of the proposed inlprovements, it is snggested to consider diversion of water around the entire construction zone.
W'here new sidecharulels are to be excavated, it may be feasible to excavate the channels without dewatering prov-ided it is not necessary t(:) place new fill soils. However, if dewatering is not performed, it should be (:,.},.-pected that disturbed granular soils may slump at the water line and flattening of slopes may be necessary. Trus behavior was observed in our test pit excavations where flO\v-ing sands were encountered at the water table. As a result, we recommend that dewatering be performed for all grading (cut or fill) perfol111ed below the water table.
8.0 SERVICES DURING CONSTRUCTION
The recommendations provided i11 this report are based on the assumption that SAGE will be retained to prov-ide' plan review and observation and testing services during construction in order to evaluate compliance with our recommendations. Pl1.0r to construction, we should re,,-iew the excavation and! or shoring plans prepared by the contractor. Dw:ing construction, we should periodically check the materials exposed due to excavation of tempormy and permanent slopes. These observations ",,"ill allow us compare the subsurface conditions obs.crved duting construction with those encountered during our investigation and allow us to assess the contractor's work with respect to the project pJans and specifications and the recommendations presented herein. If SAGl:':
Georechnical Im-estigation Report DIY Creek Habitat Enhancement Demonstration Projects Pr~ject .No. 07-082.02 Task 3.02 . October 13, 2011 p.12
is not retained for these services, we cannot assume responsibility for any and all potential claims that may arise during or after construction as a result of misuse or misinterpretation of SAGE's report by others.
9.0 LIMITATIONS
This report has been prepared for the sole use of Sonoma County Water Agency and their agents specifically for the desigt'1 of the Dry Creek Habitat Enhancement Demonstration Projects described herein. The opiruons, conclusions, and recommendations contained in this tepmt are based upon the information obtained from OUT. site subsurface explmation, out engineering studies, experience, and engineering judgment, and have been fmtnuhted in accordance with generaUy accepted geotechnical engineering practices that exist at the tirne this :l:eport was prepared. No otherwatranty, expressed or implied, is made or should be inferred. In ll.ddition, the recommendations presented in this report are based on the subsurface conditions encountered in a limited number of test pits and borings. A.ctual conditions may vary. If subsurface conditions encountered in the fiel.d differ from those described in this report, we should be consulted to detenn1ne if changes to our conclusions or supplemental recommendations axe required.
The. opinions presented in this xeport are valid as of the date of tins report for the property being evaluated. Changes in the condition of a property can occw: Witil the passage of time, whether due to natural processes or the ,yorks of man. If site conditions vary from those described hercm, we should be consulte.d to evaluate the impact of the changes, if any. In addition, changes in applicable standard of practice can ()Ccur., whether from legislation or tile hroadening of knowledge . . Accordingly, the opinions presented in this report may be inyalidated, wholly or partially, by changes outside of SAGE's control. In any case, this report should not be relied upon after a period of three years without prior re",;,ew and approval by Si\GE.

GeotecJ.l1:Uc:a] Investigation Report Dry Creek Habitat Enhancement Demonstration Projects Project No. 07-082.02 Task 3.02 October 13, 2011 p.13
10.0 REFERENCES
Blake, M.C., Graym.er,R.W., and Stamski, R.E., 2002, Gcologic Map and Map Database qf IVeJtem S OHoma, NOJthJJJesterl/ }Vlari!!, and S oU/Demmos! Aiel/docillo Coullties, California: US. Geological Survey IYfisceIlaneous Field Studies Map MF-2402, Version 1, 1 sheet, scale 1:100,000.
B1J'ant, \Y!.A., 1982, Cbitl11ti, Healdsburg, Alexander, A1aa(:aJ7Ja alld related jattlts, SOl1oma COIIlZty: California Div:lsion of Mines and Geology Fault Evaluation Report 135, 18 p., scale 1:24,000, patts of 5 quadtangles, scale 1:24.000.
Bxyant, \V.A.:, and Harr, E.W., 2007, Fmtlt-lliIptlitY1 Hazard Zm1eJ ill Cal!fomia, Alquirt-Priolo Barthqliake llault Zomn...g Act with Index 10 Earthqliake Fattlt Z01te.f lv.lap.r. California Geological Survey, Special Publication 42, Inte1:1m Revision 2007.
California Code of Regulations (CCR), 2005, Regzjter 2005, No. 17, Title 8, Divirioll 1 - Departl1Je7zt oj Incltlsttiaf Relations, Chapter 4 - Divijio!l qf 1mlustrial Safe!y, Subcbapflfr 4 - COl1s/ructi(}JZ Sqflty Orders, Article 6 - Excavatio11J, SectioJZJ 1.539 through 1.547, April 29.
Harvey, 1--1.0., and Schumm, S.A., 1985, Geomophic Ana!ysis f!l D~y Creek, SOlZoilza CO{l12ry, Cal!fomia front TVarllt Spril{f,s Dtl1Jt to R;.mia12 River COJrflJlcnce: Department of the Army Sacramento District COl'pS of Engineers, Conttact No. DACW05-85-P-0064
Huffn1.an, M.E., and Annstrong, G.F., 1980, Geology jorp!a11lzing in S01l0Tlia COlf11ry: California Division of Mines and Geology SpedalReport 120, 31 p., 5 pIs., scale 1:62,500.
Inter-Fluve, Inc., 201Oa, 60% COl1tplete Design Repm-0 Dry Creek Habitat E,zham'f711IlJZt DelJJOllstratiolt P1Y!ject.r:RilJer Miles 6.2 to 7.3, Aptil15, 2011.
Intet-Fluve, Inc., 2010b, 60% Dry Creek Habitat EllhalZcemmt Dem012stratioll PrfljectJ Plal1 Set, April 15, 2011.
Jennings, C.W., Bryant, \y/'A., and Saucedo, GJ, 2010, remit Activity iV1ap r!l Califomia: California Geological Sunrey, California Geologic Data Map Series, Map No.6, scale 1:750,000.
McLaughlin, R.J., and 'Sa111a-Wojcicki, A, 2003, Geology qftheR{~ht Ste/)(}!Jer Region belween the Rodger.r Creek, Healdrb14rg, and A1aacama FaultJ,Northem Stl1l FralJ(:is(;o Bq} Region - A COlltributir}JZ t() N()r/hent Cal!fo17lia CeoloJl/cal Sode!y Field Trip Guide, }tme 6-8, 2003: U.S. Geological Survey Open-File Repott 03-502.
U.S. Geological Survey (USGS) and California Geological database for tbe United States, accessed October http/ / earthquakes. usgs.gov I regional! qfaults /
Sutvey, 2010, ,Ql1atertlaCJ fmtlt and jOld 2010, from USGS web site:
Working Group on California Earthquake Probabilities, 2003, EaJthqliake ProbtlbilitioJ ill tbe Jail Fnmcist() Btf.! R~giol1: 2002 to 2031: U.S. Geological Smyey Open-File Report 03-214.

FIGURES
122°55.000' W
z 0 0 ~ co (Y)
° co (Y,)
z '0 0 0 Ii) (Y)
° co (Y,)
WGS84 122°48.000' W
~~~'i:l-1 Z
"0 o o N '<t
° co ~~~ii.lil (Y)
z ~~~~----~~+-----~~~~~--~~--~ g
o
~ ° co (Y)
z 0 0 ~ co (Y)
° co (Y)
z 0 0 ~
z ~~~~~~~~~~~~~~~~~==~fI~~~~~~~~~~ z
122°59.000' W
TNf/,MN V15
"
SIJro'F.S , A>SOC14H'S G(CSTRUCTUR4l WGINf[RlNG
saGe
'0 '" 0 o
-i (Y)
° co (Y)
122°55.000' W 122°53.000' W WGS84 122°48.000' W 0.0 0.5 1.0 1.5 2.0 2.5 3.0 3.5 miles I,'"',,,,,,,,,,, '''I'i',I".' ..... I,' '''''',,'''' ,"'d ' o 1 2 3 4 5kni
Map created with TOPO!® ©2003 National Geographic (www.l.iAtioIl8lgeographic .comltopo)
4180 Douglas Blvd., Ste. 100 Granite Bay, CA 95746
P (916) 729-8050
DRY CREEK HABITAT ENHANCEMENT DEMONSTRATION PROJECTS FIG 1
F (916) 729-7706 SONOMA COUNTY SITE LOCATION MAP CALIFORNIA
DATE: 10/13/11 FILE: 07-082.02 SCALE: NONE JOB NO.: 07-082.02

KEY
BOR1NG COt ... PLETED BY SAGE ON 8120/10
TEST P1T COMPLETED 8Y SAGE::. ON BIlellO AND Br9no

APPENDIX A Field Exploration Program
,/\.1 Field Exploration Program
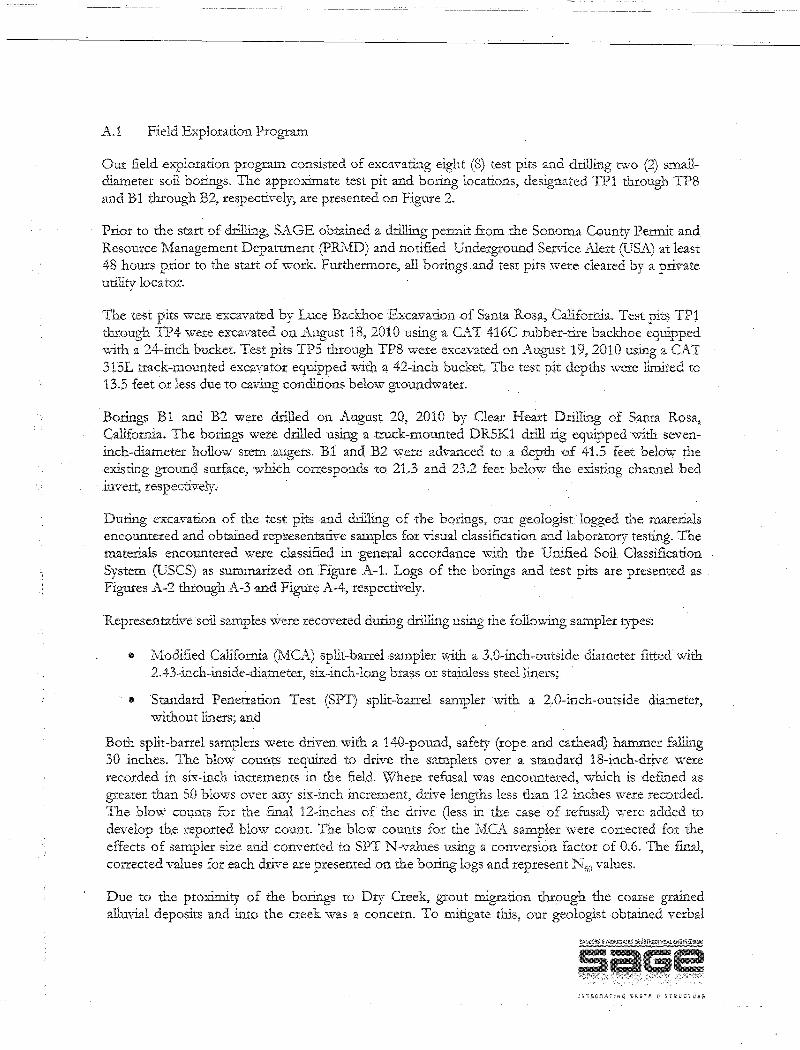
Ow: field exploration program consisted of excavating eight (8) test pits and drilling two (2) smalldiameter sOll borings. The approximate test pit and boring locations, designated TP1 through TP8 and B 1 through B2, respectively; are presented on Figure 2.
Prior to the 8t2.1:t of drilling, SJ .. GE obtained a drilling pcrmitfrom me Sonoma County Permit and. Resource Management Department (PRMD) and notified Underground Sctvice .Alert (USA) at least 48 hours prior to the start of ,-vork. Furthermore, all bor.ingsand test pits wete cleated by a private utility locator.
The test pits were excavated by Luce Backhoe Excavation of Santa Rosa, California. Test pits TPl through TP4 were excavated on August 18, 2010 using a CAT 416C rubber-tite backhoe C(luipped ,,71th a 24-inch bucket. Test pits TPS through TPS wete excavated on August 19, 2010 using a CAT 31SL track-mounted excavator equipped with a 42-inch bucket. 'The test pit depths \vere limited to 13.5 feet O,t less due to caving conditionsbe1ow groundwatet.
Borings B1 and B2 were dtilled on August 20, 2010 by Clear Heart Dt:i1lillg of Sant.a Rosa, CaJifotnia. The botings were drilled using a !:tuck-mounted DRSKl drill rig equipped '\,v;'th seven-11lch-dialnetct hollow stem .augers. B 1 andB2 were advanced to a dept.h of 41.5 feet below the existing ground surface, which corresponds to 21.3 and 23.2 feet below the existing channel bed invelt, respectively.
During excavation of the test pits and drilling of the borings, our geologist logged the matexials encountered and obtained representative samples fox visual classification and laboratory testing. The materials encountered wel'e classified .1n general accordance with the Unified Soil. Classification Syst.em (USCS) as su.:rnma..1.'.ize.d on Figure .A-1. Logs of the borings and test pits are presented as Figures i\. .. ,2 through ,A~3 and Figure A-4,respectively.
Representative soil. samples \vere recovered during d1:illing using the following s2.1npler types:
• Modified California (Iv1CA) split-barrel sampler with a 3.0-inch-outside diamet.er fitted 'With 2A3-inch-inside-diameter, si:ic-inch-long bl'2.SS or stainless steel liners;
• Standatd Penetration Test (SPT) split":harrd sampler wit.h a 2.0-ioch-outside diameter, without liners; and
Both split.-barrel sam.plers were driven with a 140-pound, safety (rope and cathead) hammet falling 30 inches. 111e blow count-'> required t.o drive the sam.plers over a standard 18 .. inch-dtive were recorded in six-inch increments .1n the field. Where refusal was encountered, \V'hich isdefillcd as greater than 50 blows ove.t any six-inch increment, drlye lengths less than 12 inches were recnrded. The blow counts for the final 12-inches of the drive (less in the case of refusal) were added to develop the reported blow count. 'I11e blow counts for the MCA sample.t wete corrected fot the effects of sampler size and converted to SPT N .. yalues using a conversion factot of 0.6. The tinal, corrected values for each d.tive are presented on the boring logs and represent N m values.
Due to the proximity of the b01mgs to Dq Cteek, grout migration d1.tough the coarse grained alluvial deposits and into the creek was a concern. To mitigate tIllS, our geologist obtained verbal

approval from the on-site Sonoma County PRMD inspector to backfill the borings with soil cuttings to 15 feet, and top off with neat cement grout. The remaining cuttings. were spread out on the ground surface adjacent to the boring.

UNIFIED SOIL CLASSIFICATION SYSTEM
Major Divisions Symbols Typical Names
GW Well-graded gravels or gravel-sand mixtures, little or no fines Gravels
€I) " (More than half of GP Poorly-graded gravels or gravel-sand mixtures, little or no fines :g~<D coarse fraction> GM Silty gravels, gravel-sand-silt mixtures en €I).~ -oOCll No.4 sieve size) <D_ <D GC Clayey gravels, gravel-sand-clay mixtures c: - > 'E ~.~
SW Well-graded sands or gravelly sands, little or no fines 9~o Sands ~Q).c 0
(More than half of Poorly-graded sands or gravelly sands, Httle or no fines ",_('>.I SP '- Q) • <1:1 ~ 0 coarse fraction> ooz SM Silty sands, sand-silt mixtures 0$ No.4 sieve size)
SC Clayey sands, sand-clay mixtures v ML Inorganic silts and clayey silts of low plasticity, sandy silts, gravelly slits en.:': -.
=g2 Silts and Clays CL Inorganic clays of low to medium plasticity, gravelly clays, sandy clays, lean clays J5 'O'w LL=<50
-0 "- <D OL Organic silts and organic silt-clays of low plasticity <1)'06
.S .r:. 'ti) ~c:o MH InorganiC siits of high plasticity 0<1:10 Silts and Clays d,:SN CH InorganiC clays of high plasticity, fat clays c: <l) • LL = > 50 ._ ),..,. 0 u.oz
OH Organic silts and clays of high plasticity $ Highly Organlc Soils PT Peat and other highly organic soils
GRAIN SIZE CHART TYPES OF STRENGTH TESTS
Classification
Boulders
coarse medium fine
Silt and Clay
Core barrel
Range of Grain. Sizes
U.S. Standard Sieve Size
Above '12"
No.4 to No. 200 No.4 to No. 10 No.10 to No. 40 No. 40 to No. 200
Below No. 200
--=:---:----1
.4.76 to 0.074 4.76 to 2.00 2.00 to 0.420
0.420 to 0.074
Below 0.074
SAMPLER TYPE
BULK
PP
TV
LVS
UC
TXUU
DS
Pocket Penetrometer
Field TOMme
Laboratory Vane Shear
Unconfined Compression
Triaxial, unconsolidated, undrained
Direct Shear
sz: Unstabilized (initial) groundwater level
Y Stabilized groundwater level
Disturbed grab sample
.
ern orn PTrn STrn
Osterberg piston sampler using 3.0-inch outside diameter, thin-walled Shelby tube CA California split-barrel sampler with 2.5-inch outside
diameter and 1.93-inch inside diameter
Pitcher tube sampler using 3.0-inch outside diameter, thin-walled Shelby tube
Shelby tube (3.0-inch outside diameter, thin-wailed tube) advanced with hydraulic pressure
DRY CREEK HABITAT ENHANCEMENT Demonstration Reach
MCA
SPT
Modified California split-barrel sampler with S.O-inch outside diameter and 2.S-inch inside diameter
Standard Penetration Test (3PT) split-barrel sampler with a 2.0-inch outside diameter and a 1.5-inch inside diameter
Sampling attempted without recovery
Sonoma County California SOIL CLASSIFICATION CHART
4180 Douglas Bhtd .. Sie. 100 Granite 8ay, CA 95746
P (916) 729-8050 F (Sle) 729-7706
Project No. 07·082,02 Task 3.02
Date 10113/11 Figure A-1

PROJECT: Dry Creek Demonstration Reach LOG OF BORING 81 Sonoma County, CA Sheet 1 of2 BORING LOCATION: See Figure 2 DRiLUNG SUBCONTRACTOR: Clear Heart Drilling
DATE STARTED: 8/20/2010 I DATE FINISHED: 8/20/2010 DRILL RIG: DR5KI Truck Mounted
LOGGED BY: D.Kennedy DRiLUNG METHOD:
ELEVATION (FT): 144.2 I DATUM: NAVDBa 7-inch hollow stem auger
GW DEPTH (FT): 22.7 I GWDATE: 8/20/2010 HAMMER TYPE: Rope and cathead (safety)
CASING NOTES: NIA HAMMER WT (LBS): 140 I HAMMER DROP (IN): 30
BACKFILL MATERIAL: Soil cuttings & neat cement SAMPLERS: MCA, SPT
i=' [ >- LABORATORY TEST DATA
!:!::. w w gw (!) ~ '" PLASTICITY -Jw -J g ~ LU:I: :I:
:r: ~
a. a. a. Z~ DESCRIPTION z iii en LU ~ z~ ~~e I- :2~ :2 I--J 0 LU~ ze w~ a.-CI) u:C!)c-
a.~ !z~ LU" 3:~ Bin£. a. ~ ~ :r: ",.e, ~0l=! :I:~~ Ll. PI W -J C/J C/J C/J !::: 0
~ L1. u!!=
0 w U en~ -J
C sen en
" " SIL TV SAND (SM) ::" :':,: .~::: yellow brown, loose, moist, fine grained sand
1 143.2 o' • · . .. . .
:.:.:-.:.: · . ..
· .'
2 142.2 " ~. '::, :', -:. ',,',
MCAI
.,' -,
3 141.2 ::'5""':: ......
7 · ,,:.
:. (:.:':: 4 140.2 l- · . · :. · .
5 139.2 '::. ~:.(:
· . · ::-'::
MCA
ill 12 .::.) .. ::~::. SAND (SP)
6 138.2 brown, medium dense, moist, fine grained sand, 0:· ...
)./>:{; trace silt, locally grades to medium grained sand
7 137.2 ::. ::,,:':-,:':'
8 136.2 ':'.:/.::'::.~
MCA 8 ::':SP::: loose, with SIL TV SAND (SM) interbeds :';'::", " ," . ..
9 135.2 ....... ...... : .. : .. :.::: .... ..
" .:. ",
10 134.2 ........ ...... :: '.::-~:: :',:'
MCA 12 ::":::':',::' 11 133.2
°JJt SIL TV SAND (SM)
:;:~D~: brown, medium dense, moist, fine grained sand,
12 132.2 approximately 25% fines
" .' ::!
13 131.2 .:-:: .:.. gravel at 13.5 based on change in drilling · ,.:.
Po f\;- SIL TV SANDY GRAVEL (GM) 14 130.2 brown, medium dense, moist, fine gravel with some
pc ) coarse gravel, medium to coarse sand, trace fines
15 129.2 I--c Po ~;-SPT ~ 25
pc) )< 16 128.2 P :-
I-<GM<
pc ) 17 127.2
Po ~;-18 126.2
pCh
)<
P :-o 0
19 125.2 pc . <
I-~GRAVE[WlfHsiI.TANDSAND(GW-GM)-----
~J~ brown, medium dense, moist, primarily fine gravel with ~n::lrnA !'l::lnrl m ... rlh 1m n~inAri !'l::lnri IAn;:;" .. "
MCA and SPT blow counts converted to SPT N60 values using conversion factors of 0.6 SaGe Project No:
and 1.0, respectively. 07-082.02 Figure:
INTEGRATING EARTH & STRUCTURE A-2

PROJECT: Dry Creek Demonstration Reach I LOG OF BORING 81 Sonoma County, CA Sheet 2 of2
i=" >- LABORATORY TeST DATA !:S I=' w w gw C!)
~ Cl PLASllCI1Y !:S -'w -' 0 ~!z w:I: :I: J: c..c.. c.. z::> -' DESCRIPTION CI)
C/J zl- o::f-
I- ~ ~~ :E 1--' 0 ::>w_ ifi'i3 w- W f- u:C!>c- ..:Cl_ c..~ ~!z~ ;!l;e O--CI) zz .. wZ1D c.. ;]i J: 0.& ~o~ o~"'- :I: W ">< LL PI W -' (I'J I- 00 >- u.. 0::-
C w ::::i ::;;0 0:: 01- <Ilf-z", CI)
0 ::>
21t~' ~ locally
MCA 18 Approximate elevation of channel bed invert • GRAVEL WITH SILT AND SAND (GW-GM) ~4 ~ (Con't) 6.6
"" .. t c:> _ .. -!::!
~r' c:>
~~ N
iii; Groundwater Encountered ~ softer drilling below 22.7', groundwater
23 121.2 .; encountered GW-~GM
24 120.2 i' 25 119.2
MCAI
~~ gragvel size increases, fine to coarse gravel,
It. decreased sand content locally, wet
17 ~~ 26 118.2
f- It. 27 117.2 ~~ 28 116.2
i~·i -------------------------
f • GRAVELLY SIL TV SAND (SW) • brown gray, medium dense, wet, medium to coarse : grained sand, fine to coarse gravel (1/4" to 1"), 29 f15.2 • some silt
30 114.2
·~i 16 ... 31 113.2 ...
. . . .. . 32 112.2
.. . ... . . . .. . 33 111.2
34 110.2
35 109.2
MCAI
dense, coarse grained sand, gravels up to 2.5"
36 108.2 31
I-
37 107.2 i>;
§ 38 106.2 I-
Cl Cl u.i (!) 39 105.2 ..: CIJ .., 0-Cl
40 104.2 medium to coarse grained sand, reduced gravel en f-(!)
SPT ~ content, with some clay locally 0
...J
36 (!)
41 z 103.2
" 0
'" -I-z 42 102.2 (3
'" CD 'i' "" 43 101.2 0
(!) z
Project No: cr: Boring terminated at a depth of 41.5 feet below existing ground surface. SaGe 0 07-082.02 '" MCA and SPT blow counts converted to SPT N6D values using conversion factors of 0.6 u..
0 and 1.0, respectively. Figure: Cl 0
INTEGRATING EARTH & STRUCTURE A-2 ...J

~ W Q
2
3
4
5
6
7
8
9
10
11
12
13
14
15
16
17
18
19
MCA
Dry Creek Demonstration Reach Sonoma County; CA
to stiff, moist, fine grained
silty sand lense
F*'f<t~-==-=;-=-=....-------_____ -=l20.8 88
brown, medium dense to dense, moist, medium to coarse sand, fine gravel, trace fines, weakly cemented locally
: Approximate elevation of channel bed invert ',' ~
.'" ..... 'C;
. ~ • CD
Groundwater Encountered
MCA and SPT blow counts converted to SPT N60 values using conversion factors of 0.6 and 1.0, respectively.
Sheet1of2
PI
64.6

PROJECT:
t=' lJJ
Dry Creek Demonstration Reach Sonoma County, CA I LOG OF BORING B2
Sheet 2 of2
LABORATORY TEST DATA ~ lJJ glJJ !:!::. ....IlJJ ....I
Z::::l
>C!)
g Wf- ~ fil:r: :r: PLASnCITY ::c 0-0- 0-1-- '> ~~ :::2: 1--....1 0- lJJ <l; O-~ UJ ....I CJl CJl CJl Cl UJ
SPT ~ 24 21 121.3
-
22 120.3
23 119.3
24 118.3
25 117.3
I MCA 6 26 116.3
I-
27 115.3 SPT ~ 28
28 114.3
29 113.3
30 112.3
I MCA 17 31 111.3
l-
32 110.3
33 109.3
34 108.3
35 107.3
"~i 30 36 106.3
37 105.3
38 104.3
39 103.3
40 102.3 :-
41 101.3 SPT
~ 25
42 100.3
43 99.3
o I 1-::::;
':.:.:'1.::. :::: :::!::.:
" ','
.:: .; I:: ' ..
..
.'.
DESCRIPTION
some clay GRAVELLY SILTY SAND (SM) (Con't)
vS. CLAYEY SAND (SC) ~9~ gray, loose, wet~ fine grained sand, marsh or ~ overbank depOSit ::tJ: GRAVELLY SILTY SAND (SM)
.'. Lt:· brown, medium dense to dense, wet, medium to ::SM: coarse sand, fine gravel with some coarse gravel, I:T.r: with thin clay lenses
W.-%.- -SAND(SP) - - - - - - -- - - - - - - - - --
.'.: Sp:.:. gray, loose to medium dense, wet, medium grained " sand, trace fines
,,'," , . . ....
:.: 1:.(: -..:. \": .' " :.: :. (.'"
::5";:· '1:':
:: :.J: "
.-
o f-'I~
ih :' pf-' 0 0
pCh
.)'
~~o pc ~( Po~o p~l-. ( p1=l
~I- :< pRo 01- (
pCh
.)
GRAVELLY SILTY SAND (SM) brown, medium dense, wet, medium to coarse grained sand, fine gravel with some coarse gravel
SILTY SANDY GRAVEL (GM) brown to yellow brown, dense, wet, with locally clean gravel lenses
little to no coarse gravel
O:z 1ii CIl W f-zf- o:f-::lw_ zc w- tl.-CIl u:(!)~ iIj(!)C::-
~~c W" ~~ zZ .. z'" Ll PI Q£!, ~o~ o~:::. ~~~ 00 ~
u.. Uf-::<<..> §i'" CIl Q
~~~~~~~~~~~~~~~~~----~~--------------~~~~~~~~~Pr;~~~~ ~ Boring terminated at a depth of 41.5 feet below existing ground surface. ~ iii G E! Project No: ~ MCA and SPT blow counts converted to SPT N60 values using conversion factors of 0.6 ..... 07-082.02 g and 1.0, respectively. Figure: g~ ______________________________________________________________ ~'~N~T'~G~R'~T~IN~.~'A~R~TH~&~S~TR~u~c~Tu~R~E~ ___ A_-_3 ____ ~

FIGURE A-4 - LOGS OF TEST PITS TPl THROUGH TP8 Test Pit Depth . Soil Soil Description Number (feet) Classification
SILlY brown, loose to medium dense, dry with some sand,
0' -1' GRAVEL (GM)
fine to coarse gravel, with organics
TPl SANDY brown, loose, moist to 3.5', wet below 3.5', primarily (El. 126.0) GRAVEL fine gravel with some coarse gravel, medium to coarse
l' - 6' (GW) sand, with fines; Laboratory Gradation: 64.3% gravel, 35.4% sand, 0.3% fines
Groundwater encountered at El. 122.8' SILlY
brown, loose to medium dense, dry, with some sand, 0' - 0.5' GRAVEL
(GM) fine to coarse gravel, with organics
SANDY broWn, loose~ dry to moist, primarily fine gravel with
0.5' - 3.5' GRAVEL some coarse gravel, medium to coarse sand, trace fines,
TP2 (GW-GM) clean gravel interbeds locally, estimate 50% gravel (El. 128.3) (40% fine, 10% coarse), 45% sand, 5% fines .'
GRAVELLY brown gray, medium dense, moist to 6.5', ~et below SAND 6.5', medium to coarse grained sand, gravel primarily
3.5' -10' (SW) fine with some coarse, trace fines; Laboratory Gradation: 37;7% gravels, 61.7% sand, 0.6% fines
Groundwater encountered at El. 121.W
0' - 0.5' GRAVELLY brown, soft to medium stiff, dry, with some sand, fine
SILT (ML) to coarse gravel, with organics SANDY brown, loose to medium dense, dry, primarily fine
0' - 3.0' GRAVEL gravel with some coarse gravel, medium to coarse sand,
(GW-GM) trace fines, clean gravel interbeds locally ,estimate 60% gravel (50% fine, 10% coarse), 35% sand, 5% fines
TP3 SAND WITH brown, loose, dry to moist, medium grained sand, with (El.131.1) 3.0' - 4.5' GRAVEL (SP) fine to coarse gravel, some organics/roots, estimate
70% sand, 30% gravel GRAVELLY brown gray, medium dense, moist to 8.5', wet below
- SAND (SW) 8.5', medium to coarse grained sand, fine to coarse 4.5' -12' gravel, trace fines, estimate 60% sand, 35% gravel (25%
fine, 10% coarse), 5% fines Groundwater encountered at El. 122.6'

0' -4' GRAVEllY brown, medium stiff, ch:y to moist, with some sand, CLAY (CL) fine to coarse gravel, with organics
SANDY brown gray, medium dense, moist to 4.4', wet below TP4 GRAVEL 4.4', primarily coarse grained sand with medium
(El. 126.6) 4' - 11'
(GW-GM) grained sand, fine to coarse gravel, trace fines, estimate 35% sand, 55% gravel (35% fine, 20% coarse), 10%
fines, trace cobble Gr01Uldwater encountered at El. 122.2'
SANDY brown gray, loose to medium dense, moist, wet below GRAVEL 2.5', fine to coarse gravel, medium to coarse sand, trace
TPS 0' -10' (GW-GM) cobbles (up to 6"), traces fines, estimate 60% gravel (El. 119.2) (40% fine, 20% coarse), 30% sand, 5% cobbles, 5%
fines Groundwater encountered at EL 117.6'
SANDY brown gray, loose to medium dense, moist, wet below GRAVEL 2.4', fine to coarse gravel, medium to coarse sand, trace
(GW-GM) cobbles (up to 10"), trace fines; Laboratory Gradation: TP6 0' -10.5'
64.4% gravel, 35.1 % sand, 0.5% fines (El. 118.5) CLAYEY SAND (SC) interbed at -10', medium
grained, increased clay content locally, estimate interbed is less than 0.5' thick
Groundwater encountered at El. 115.9' SANDY brown gray, loose to medium dense, moist, fine to
0' -3.S' GRAVEL coarse gravel, medium to coarse sand, trace fines,
',""",,,, • ~I d (4901O-fin M'" -, ,.,.-" \'JVV) ~"LU.U,,"U TO grav .~, .<..v IV .... u ..... ,,~., -J-J IV ",,"u\.!,
5% fines
3.S' - 5.5' SAND (SP) olive brown, loose to medium dense, moist, medium
TP7 grained sand, trace coarse grained sand and fine gravel (El. 121.4) SANDY brown gray, loose to medium dense, moist, wet below
GRAVEL 6', fine to coarse gravel, medium to coarse sand, trace
5.5' -13.5' (GW-GM) fines, trace cobbles, cobbles up to 6", estimate: 50%
gravel (30% fine, 20%), 40% sand, 5% cobbles, 5% fines
Groundwater encountered at El. 115.5' SANDY brown gray, loose to medium dense, ch:y in upper 1.5',
GRAVEL moist 1.5' - 3.1', wet below 3.1', fine to coarse gravel, (GW) medium to coarse sand, trace fines «5%), no cobbles
TPS 0'-9'
observed, thin (-3") clean gravel (fine) lenses visible in (El. 11S.0) upper 3' where pit can be safely accessed, increased
sand content locally, estimate 50% gravel (30% fine, 20% coarse), 45+% sand, <5% fines
Groundwater encountered at El. 114.9'

APPENDIXB Laboratoty Test Results

- - - - - - - --" ---- -------------------------------------------------------- --- --- --- - --- --------- - -- -----=---------------------- -------.:- ---------------------------------=----~--=---~--=--.:
B.1 Laboratory Testing
Representative soil samples obtained from the borings were reviewed in our office to confmn field classifications. Representative samples were selected and suhmitted for laboratory testing. Samples were selected based on how representative they were of surrounding 11.1.aterials. Laboratory testing was performed to determine the following properties:
,. PercemPassing the No. 200 sieve (r:ines Content) per ASTt\:1 D1140;
$ Consolidated-Drained Direct Shear (DSCD) per ASTM D3080;
& Particle Size Analysis per ASTM D422;
L\BORr\ TORY TESTIN G SurvrNLl.RY
Boring/TesfPit r . Laboratory'I'estjAppwximateSamp
' ....••. t ... .' . . .....•..•... ,:,:;1. . . Depth (ft) '.
B1 I Percent Passing No, 200 I 21 B2 I Percent Passing No. 200 I 5.5
.-------1 I Direct Shear . 11 B2 TPl l'article Size Analysis 3 TP2 Patticle Size Analysis 5.5 TP6 Particle Size .. Analysis 6.5
The laborato.ry xepotting sheets for the laboratory testing follow. Note that there ate two Direct Shear resu1t sheets because tile test was 1"Un nV1ce 'ilith two different normalloads onthe sample .. A minim;llm oftwo different normal1oads are required in order to calculate cohesion and internal ftictiol1.

· .. ~ I .. GEOTECHNiCAl ENGINEERS· SPECIAL I NSPECTOAS
GEOLOGICAL AND ENVIRONMENTAL CONSULTANTS
GRAIN SIZE ANAL YSIS - WASH
Sage Project No. 07-082.02 Job No. 110033 Project Project Name Tested By Reviewed By
----------------------------Dry Creek Phase 3 Boring No. Bl Sample No. --~-------------- -------- 6
RD Depth of Sample 2 LOft ------------------ --~---------------PF Date of Testing 9/10110 ------------------ --------------------
Before Wash ,
After Wash Ii W1. of dry sample + 941.6
, Wt. of dry sample + 889.3
Container (g) Container (g) \Vt. of Container (g) 143.6 Wi. of Container (g) 143.6
Wt. of dry sample (g) 798.0 Wt. of dry sample(g) 745.7
Sieve analysis and grain shape Sieve No. Diam. (mm) wt. Retained % Retained % Passing
#200 0.075 745.7 93.4 6.6
1830 Vernon Street Suite 7· Roseville, CA 95678' (916) 786-5262' Fax {916} 786-5263 • E-mail: [email protected]
Project Project Name Tested By Reviewed By
,1 . GEOTEOiNICAl ENGINEERS-SPECIAllNSPECTOAS
GEOLOGICAL AND ENVIRONMENTAL CONSULTANTS
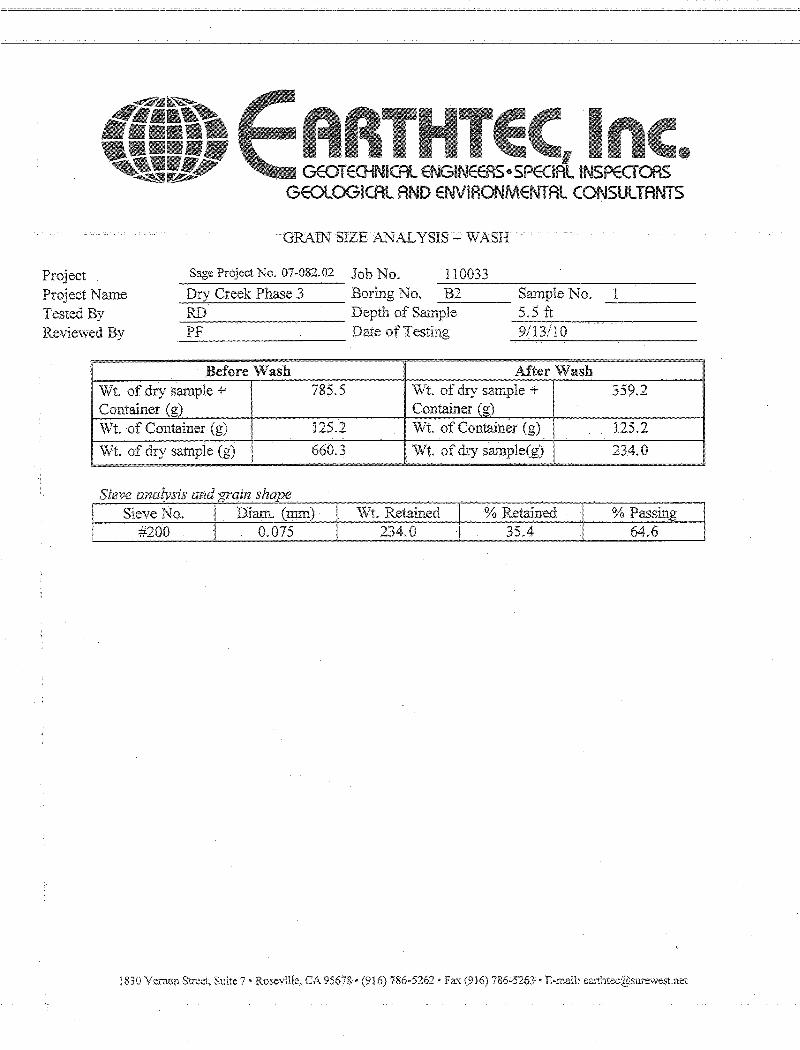
GRAIN SIZE .i\..1\lALYSIS - WASI-I .
Sage Project No. 07~082.02 Job No. 11 0033 Dry Creek Phase 3 Boring No. B2 Sample No.
-RD--"--------- Depth of Sam-p-le--- 5.5 ft ---------------
1
PF Date of Testing 9/13/1 0 --~----------- ------------------
Before Wash After \Vash Wt. of dry sample + 785.5 Wt. of dry sample + 359.2 Container (g) Container (g) Wt.of Container (g) 125.2 Wt of Container (g) 125.2
Wt. of dry sample (g) 660.3 wt. of dry sample(g) 234.0 I
Sieve analysis and grain shape.
Sieve ~~~~)~k~W~7t~. ~R~e~ta~in~. e~d!.-.+-~%~R~et~a~in!5:e~d __ + __ o~/o:..:P~as~si~l1~g_~ #200 0.075 234.0 35.4 64.6
1830 Vernon Street~ Suite 7' Roseville. CA 95678' (916) 786·5262' Fax (916) 786-5263' E-mail: earthtec@surewestnet

Horizontal
Displacement (inches)
0 0.03 0.04 0;06 0.08
0.1 0.12 0.14 0.16 0.18 0.2
I • GEOTECHNICAL ENGINEEAS"S INSPECTORS GEOLOGICAL AND ENVIRONMENTAL CONSULTANTS
DIRECT SHEAR TEST RESULT (ASTM D3080)
Shear Stress
(psf)
0 663 873
1117 1326
1396 .1501 1536 1571 1571 1536
Client: SAGE P.N. 110033 Date: 9-15-10 Sample No: B2-2 @ 11 ft. InitIal water content: 20.8 % Final water content: 24.6 % Dry density: 87 pcf
Sample sheared at strain rate = 0.031 in/min
Sample submerged, unconsolidated
Maximum Vert. Displacement: 0.173 inches Normal Load:: 3000 psf
1800
1600
1400
lji 1200 E: III 1000 III QJ ... .... VI 800 ... ctl (J)
600 .c VI
400
200
0
~
~ , I
I /
1I o 0.05 Horizon~a1 Displaceme0ritVnches) 0.2 0.25
©2010 Earthtec, Inc.
1830 Vernon Street, Suite 7· Roseville, CA 95678' (916) 786-5262 • Fax (916) 786-5263· E-mail: [email protected]

~=-=~ ~--------
Horizontal Displacement (inches)
0 0.01 0.04 0.05 0.06 0;08
0.1 0.14 0.16 0.18 0.2
, I . GEOTECHNICAl ENGINEERS"SPECIAlINSPEOORS
GEOlOGICAL AND ENVIRONMENTAL CONSULTANTS
DIRECT SHEAR TEST RESULTS (ASTM D3080)
Shear Stress (psf)
0 349 454 523 558 611 663 698 698 698
698
Client: SAGE P.N.110033 Date: 9-15-10 Sample No: B2-2 @ 11 ft. Initia! water content: 20.8 % .
Final water content: 27.7%
Dry density: 88 pcf
Sample sheared at strain rate = 0.031 in/min Sample submerged, unconsolidated
Maximum Vert. Displacement: 0.12 inches Normal load = 1000 psf
800
700
600 :;.:-'" .e: 500 '" !.II (U
400 .... ~ .... t'I.! 300 (U
..c::
172: I
/ ( B
VI
200 ,
100
a ;
a 0.2 0.25
© 20 I 0 Earthtec, Inc. 1830 Vernon Street, Suite 7 • Roseville, CA 95678 • (916) 786-5262 • Fax (916) 786-5263 • E-mail: earthtec@surewestnet

I • GEOTECHNICAL ENGINEERS· SP INSPECTORS GEOLOGICAL AND ENVIRONMENTAL CONSULTANTS
GRAIN SIZE ANALYSIS - MECHANICAL
Sage Project No. 07-082.02 Job No. 11'0'033 Project Project Name Tested By Reviewed By
--------------------------Dry Creek Phase 3 Boring No. TP1 Samp. Ie No. --~------------- ------- 1
RD Depth of Sample 3 ft ----------------- ------------------PF Date of Testing 9/911 '0 ----------------- ---------~----~~
Wt. of dry sample + Container (g) Wt. of Container (g)
Wt. of dry sample (g)
Sieve analysis and grain shape Sieve No. Diam. (mm)
3" 75.'0 2" 5'0.'0
1 ~" 37.5 1" 25.'0 %" 19.'0 Yz" 12.7
3/8" 9.5 #4 4.75 #1'0 I 2.'0 #2'0 '0.85'0 #4'0 I '0.425 #6'0 '0.25'0 #14'0 '0.1'06 #2'0'0 '0.'075 PAN .
% passing = 1 '0'0 - 2;>10 retamed
% Cobbles % Gravel >3" <3" to >#4
0 64.3
2329.'0·
363.'0
1966.'0
Wt. Retained % Retained % PassIng· '0 '0 10'0.'0 '0 '0 10'0,'0 , '0 '0 10'0.'0
1'03 5.2 94.8 356 18.1 81.9 645 32.8 67.2 838 42.6 57.4 1265 64.3 35.7 1628 82.8 17.2 1836 93.4 6.6 1896 96.4 3.6 1934 98.4 1.6 1957 99.5 '0.5 196'0 99.7 I '0.3 1966 10'0 '0.0
% Sand % Silt & Clay <#4 to >#200 <#200
35.4 0.3
1830 Vernon Street, Suite 7 • Roseville, CA 95678 • (916) 786·5262 • Fax (916) 786-5263 • E-mail: [email protected]

~~~. ------=-=---=-------------.::----------
-
,..... o o
o o ,.....
o N o
w o
Percent Finer (%) V1 o
O"l o
00 o
I-" a o
J 830 Vernon Street, Suite 7' Roseville, ell. 95678' (916) 786-5262' Fax (916) 786-5263' E-mail: earthtec@surewestnet

I • GEOTEOiNICAL ENGINEEAS.SPE INSPEcrOAS GEOLOGICAL AND ENVIRONMENTAL CONSULTANTS
GRAIN SIZE ANALYSIS - MECHANICAL
Sage Project No. 07-082.02 Job No. 110033 Dry Creek Phase 3 Boring No. TP2 Sample No. --~------------- -------
1 Project Project Name Tested By Reviewed By
RD Depth of Sample 5.5 ft ------------~--~ ---~-------------PF Date of Testing 9/911 0 ----~~~~~--- ------------------
\Vt of dry sample + Container (g) Wt. of Container (g)
Wi. of dry sample (g)
!eve analYSTS an gram S 1ape l' d 1 Sieve No. Diam. (rom)
..... " j 75.0 2" 50.0
1 Yz" 37.5 1" 25.0
%" 19.0 Yz" 12.7 3/8" 9.5 #4 4.75
#10 2.0 #20 0.850 #40 0.425· #60 0.250
#140 0.106 #200 0.075 PAN
% passing = 100 - 10/0 retained
% Cobbles % Gravel >3" <3" to >#4
0 37.7
3156.0
363.0
2793.0
Wt. Retained % Retained % Passing 0 0 100.0 0 0 100.0 0 0 I 100.0 0 0 100.0
145 5.2 I 94.8 320 11.4 88.5 519 18.6 81.4 1052 37.7 62.3 1743 62.8 37.2 2225 79.7 20.3 2458 88.0 12.0 2617 93.7 6.3 2758 98.7 1.3 2776 99.4 0.6 2792 100.0 0.0
% Sand % Silt & Clay <#4 to >#200 <#200
61.7 0.6
1830 Vernon Street, Suite 7' Roseville. CA 95678' (916) 786-5262 * Fax (916) 786-5263· E-mail: [email protected]
I
i I I

Percent Finer (%) I-' N W ,.J::::. lr1 m "'-.,J 00
0 0 0 0 0 0 0 0 0 I-' 0 0
W -t
VI ." _.
~ N .(%;l N - .~ 3 ~ 3 • - U1
III
U1 ~li
0 , I-'
1830 Vernon Street, Suite 7 ' Roseville, CA 95678' (9l6) 786-5262' Fax (916) 786-5263' E-mail: earthtec@surewestnet

I • GEOTECHNICAL ENGINEERS e S INSPECTORS GEOLOGICAL AND ENVIRONMENTAL CONSULTANTS
GRAIN SIZE ANALYSIS - MECHAl'JICAL
Project Project Name Tested By Reviewed By
Sage Project No. 07-082.02 Job No. 110033 --~~------------~-------
Dry Creek Phase 3 Boring No. TP6 Sample No. --~~----~~--- ------- 1
RD Depth of Sample 6.5 ft ----------------- -------------------PF Date of Testing 9/8110 ------------~~- -------------------
Wt. of dry sample + Container (g) Wt of Container (g)
Wt. of dry sample (g)
Sieve analys[" and grain shape Sieve No. Diam. (mm)
3" 75.0 2" 50.0
1 Yz" 37.5 1" 25.0
3/4 " 19.0 Yz" 12.7
3/8" 9.5 #4 4.75
#10 2.0 #20 0.850 #40 0.425 #60 0.250
#140 0.106 #200 0.075 PAN
% passing = 1 00 - I,Yo retained
% Cobbles % Gravel >3" <3" to >#4
0 64.4
3339.0
947.0
2392.0
Wt. Retained % Retained % Passing 0 0.0 100.0 0 0.0 100.0
159 6.6 93.4 303 12.7 87.3 497 20.8 79.2 807 33.7 66.3 1044 43.6 56.4 1540 64.4 35.6 1957 81.8 18.2 2174 90.9 9.1 2285 95.5 4.5 2342 97.9 2.1 2372 99.2 0.8 2379 99.5 0.5 2392 100.0 0.0
% Sand % Silt & Clay <#4 to >#200 <#200
35.1 0.5
1830 Vernon Street, Suite 7, Roseville, CA 95678· (916) 786-5262' Fax (916) 786-5263' E-mail: [email protected]

G) ""'f W ->,
::s tn N~
~ -3 3 -
i-" a o
i-"
o . i-"
o i-" o
tv o
w o
Percent Finer (%) 00 o
i-" o o
..... 0 0 W W --I -0 ~ ~
~ • Cl'
* U1
1.830 Vernon: Street, Suite 7' RoseviHe, CA 95678 ~ (916) 786-5262' Fax (916) 786-5263' E-mail: [email protected]

APPENDIXC Geophysical Survey Report

NORCAL GEOPHYSICAL
CONSULTANTS, INC.
November 09, 2010
Mr. Drew G. Kennedy Sanders & Associates Geostructural Engineering 4180 Douglas Blvd., Ste. 100 Granite Bay, CA 95746
Subject Seismic Refraction Survey Dry Creek Habitat Enhancement Demonsbation Project Off Channel Enhancement Area D, Demonstration Reach Sonoma County, California NORCAL Job # 10-916.04
Dear Mr. Kennedy:
This report presents the findings of a seismic refraction (SR) survey performed by NORCAL Geophysical Consultants, Inc. along Dry Creek in Sonoma County, CA. The survey was perfonned on October 20, 2010 by NORCAL Professional Geophysicists William E. Black and Donald J. Kirker, and geophysical technician David Spaulding. Logistical support was provided by Drew Kennedy of Sanders & Associates Geostructural Engineering (SAGE). .
1.0 SITE DESCRIPnON AND PURPOSE
The geophysical survey was conducted in the "Off Channel Enhancement Area 0- of the Demonstration Reach of Dry Creek. It is located approximately 6 miles downstream of the Warm Springs Dam on the Seghesio Parcel. The site comprises a relatively flat river cut terrace that is heavily vegetated. The parcel Is accessed by a graveVdirt road from an adjacent vineyard north of the creek.
The local geology. as indicated by SAGE, consists of alluvium (interbedded clays, silt, sand, and gravel) over Great Valley Complex sedimentary bedrock (sandstone, siltstone, and shale}
The seismic refraction survey was conducted along one line, as shown on Plate 1. It is deSignated as Line 1-1 and trends along the north bank of Dry Creek. Surface elevations along Line 1-1 range from 127- to 131-ft above mean sea level {msl}.
The purpose of the SR survey was to obtain seismic refraction data to aid in evaluating the thickness of overburden and the depth and excavation characteristics (rippability) of the bedrock. We understand that this information will be used in conjunction with other geotechnical investigations to plan for the construction of backwater ponds and channels associated with habi1at enhancements along the creek.
321A BLODGETT STREET, COTATI. CA 94931 • TELEPHONE (707) 796-7170' FAX (707) 796-7175
www.norcalaeoohvsical.com
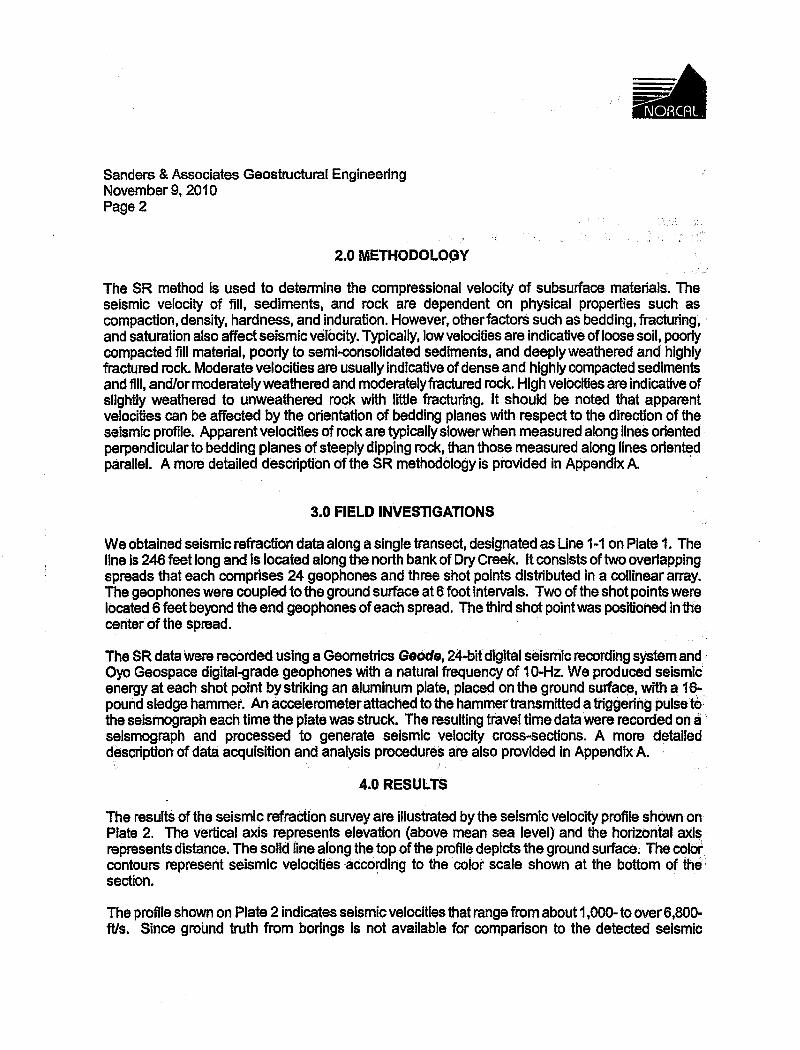
Sanders & Associates Geostructural Engineering November 9,2010 Page 2
2.0 METHODOLO~Y
The SR method is used to determine the compressional velocity of subsurface materials. The seismic velocity of fill, sediments, and rock are dependent on physical properties such as compaction, density, hardness, and induration. However, other factors such as bedding, fracturing, ' and saturation also affect seismic velocity. Typically, low velocities are indicative of loose soil, poorty compacted fill material, poorly to semi-eonsolldated sediments, and deeply weathered and highly fractured rock. Moderate velocities are usually Indicative of dense and highly compacted sediments and fill, and/or moderately weathered and moderately fractured rock. High velocities are Indicative of Slightly weathered to unweathered rock with little fracturing. It should be noted that apparent velocities can be affected by the orientation of bedding planes with respect to the direction of the seismic profile. Apparent velocities of rock are typlcalfy slower when measured along lines oriented perpendicular to bedding planes of steeply dipping rock, than those measured along lines oriented parallel. A more detailed description of the SR methodology is provided in Appendix A.
3.0 FIELD INVESnGATIONS
We obtained seismic refraction data along a single transect, designated as Line 1-1 on Plate 1. The line is 246 feet long and is located along the north bank of Dry Creek. It consists of two overlapping spreads that each comprises 24 geophones and three shot points distributed in a collinear array. The geophones were coupled to the ground surface at 6 foot intervals. Two of the shot points were located 6 feet beyond the end geophones of each spread. The third shot point was positioned in the center of the spread.
The SR data were recorded using a Geometries Geode, 24-bit digital seismic recording system and Oyo Geospace digital-grade geophones with a natural frequency of 10-Hz. We produced seismic energy at each shot point by striking an aluminum plate, placed on the ground surface, with a 16-. pOUnd sledge hammer. An accelerometer attached to the hammer transmitted a triggerh1g pulse to· the seismograph each time the plate was struck. The resulting travel time data were recorded on a . seismograph and processed to generate seismic velocity cross-sections. A more detailed description of data acquisition and analysis procedures are also provided In AppendlxA.
4.0 RESULTS
The results of the seismic refraction survey are illustrated by the seismic velocity profile shown on Plate 2. The vertical axis represents elevation (above mean sea level) and the horizonlalaxls represents distance. The solid line along the top of the profile depicts the ground surface. The color contours represent seismic velocities according to the color scale shown at the bottom of the' section. .
The profile shown on Plate 2 indicates seismic velocities that range from about 1,000- to over 6,800-ftIs. Since groiJnd truth from borings Is not available for comparison to the detected seismic

Sanders & Associates Geostructural Engineering November 9, 2010 Page 3
velocities shown along Line 1 , our interpretation of these velocities is based on our observations of local geological conditions evident from nearby rock outcrops and our experience from past seismic surveys. Therefore, we interpret velocities ranging from 1,000 to about 3,000 ftls (purple to dark blue) as representing surficial soilS and unconsolidated sediments. Velocities ranging from 3,000 to 5,000 Ws (green) are consistent with semi-consolidated sediments, saturated alluvium, and/or highly weatheredlfractured bedrock. Velocities of over 5,000 ftls represent moderately weathered and/or fractured rock. Plate 2 shows that the bedroCk is very shallow at the northwest end (less than 2 ft deep) and increases to a depth of about 9-ft at the southeast end.
5.0 EXCAVATION CHARACTERISTICS (Rlppabllity)
The interpreted bedrock exhibits velocities that range from 5,000 to over 6,800 ftls. Seismic velocity charts relating seismic velocity and excavation characteristics have been developed from field tests by others. These charts list the seismic velocity of various types of rock and their relative ease of excavation using different types of rippers. Caterpillar Tractor Company publishes a performance manual that lists ripper performance charts for the D8l; D9l, and D11 L tractors. The following information in Table A was obtained from a performance chart for a D9l Ripper.
1 bl A D9lR' a e Ipper Pr11 e ormance Chart
fliBEQBMANg ROCK TYPE ~I.OCITY RANi~ mLll
Rippable Sedimentary < 6,400 to 7,800
Igneous < 6,700 to 7,600
Metamorphic < 7,200 to 7,300
Marginally Rlppable Sedimentary 6,400 to 9,700
Igneous 6,700 to 8,600
Metamorphic 7,200 to 9,200
Non-rlppable SedImentary > 8,600 to 9,700
Igneous > 8,000 to 8,700
Metamorphic > 9,000 to 9,200
According to the D9l Ripper Performance chart above, velocities of 5,000 to 6,800 ftls are consistent with rock that is rippable to marginally nppable. This information should only be used as a general guide, however, as many other factors should also be considered. These factors include rock jointing and fracture patterns, the experience of the equipment operator, and the equipment and excavation methods selected. Also, the computed velocities measured along each profile are an average for each layer, and that the data analysis routine assumes that the velocity of subsurface

Sanders & Associates Geostructural Engineering November 9, 2010 Page 4
materials increase with depth. Therefore, there may be localized zones within each layer where the velocities may be higher or lower than indicated. this is especially true in areas where bedrock is .. highly bedded and steeply dipping. Also, if a layer has velocities that are slower than those of the.; material above it, the slower layer will not be resolved. Since the accuracy of our findings Is subject to these limitations, it should be noted that subsurface conditions may vary slightly from .those' depicted In the final results. A more detailed discussion of the limitations with regard to the selsmlc~J refraction method is presented In Appendix A. ..
6.0 STANDARD OF CARE
The scope of NORCAL's services for this project consisted of using geophysical methods to characterize the subsurface. The accuracy of our findings is subject to specIfic site conditions ana limitations inherent to the techniques used. We performed our services in a manner consistent with . the standard of care ordinarily exercised by members of the profession currently employing similar' methods. No warranty, with respect to the performance of services or products delivered under thisk
•
agreement, expressed or Implied, is made by NORCAL.
We appreciate having the opportunity to provide you with this information.
Respectfully,
NORCAL Geophysical Consultants, Inc.
h<MM~d' ~. Donald J. Kirker Professional GeophysiCist, PGp,-997c;
DJKltt
Enclosures: Plates 1 and 2 Appendix A . Seismic Refraction Survey
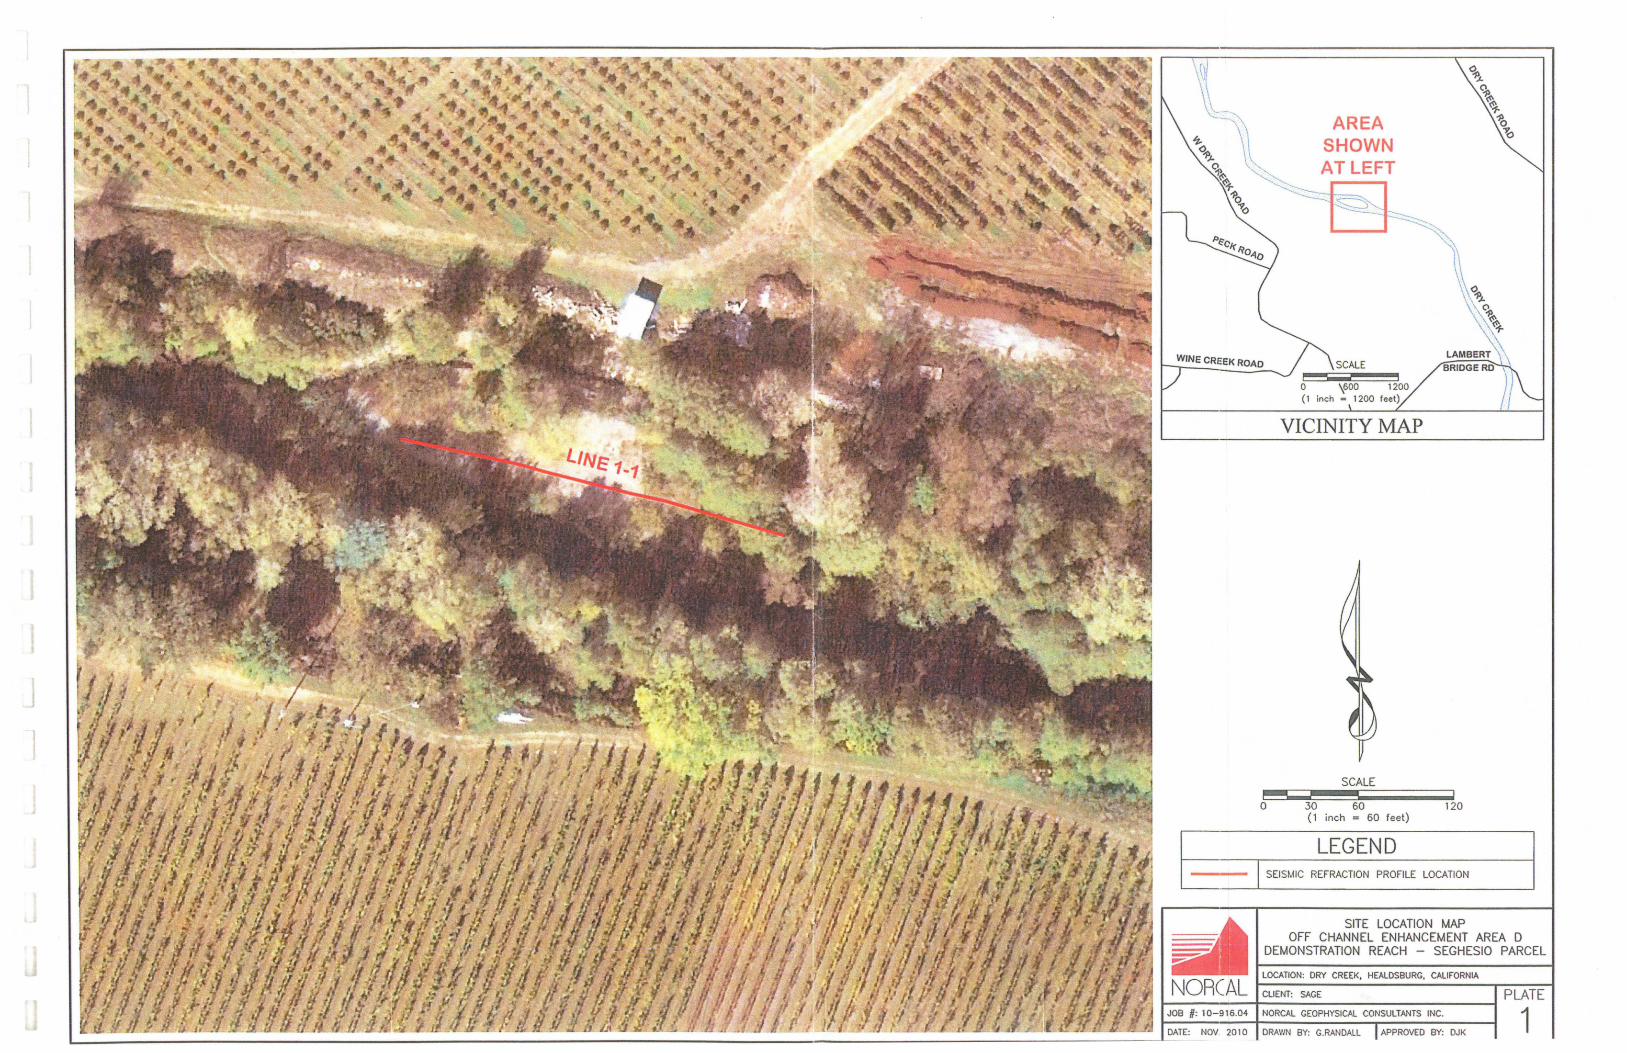
I • o \600 1200 (1 inch = 1200 feel)
VICINITY MAP
SCALE
o 30 60 120 (1 inch = 60 feet)
LEGEND --- I SEISMIC REFRACTION PROFILE LOCATION
SITE LOCATION MAP OFF CHANNEL ENHANCEMENT AREA 0
DEMONSTRATION REACH - SEGHESIO PARCEL

150
,-....
CD ~ 120 Z o
~ ..J W
90
NW
o 30 60 90
1000 2000
o
LINE 1-1 SE 150
~
- - "~~"-"':'- ."'=., ... " -=-.,~.Lm=~~ '--_- ---;::::;::::::-c·- --;;'::::::::-.- . .::::::::;::;:..
120
DISTANCE (feet)
SEISMIC VELOCITY
3000 4000 5000
(feet/second)
SCALE
30 (1 inch = 30 feet)
-~ .....
150
6000
60
180
7000
------.------ .~--- .,. 120
210
90
240
SEISMIC REFRACTION PROFILE - LINE 1-1 OFF CHANNEL ENHANCEMENT AREA D
DEMONSTRATION REACH - SEGHESIO PARCEL
LOCATION: DRY CREEK, HEALDSBURG, CALIFORNIA
CLIENT: SAGE PLATE JOB #: 10-916.04 NORCAL GEOPHYSICAL CONSULTANTS INC. 2 DATE: NOV. 2010 DRAWN BY: G.RANDAU APPROVED BY: DJK

Appendix A
SEISMIC REFRACTION SURVEY

Appendix A
SEISMIC REFRACTION (SR)
Methodology
The seismic refraction method provides information regarding the seismic velocity structure of the subsurface. An Impulsive (mechanical or explosive) source Is used to produce compressional (P) wave seismic energy. The P-waves propagate into tlie earth and are refracted along interfaces caused by an increase in velocity. A portion of the P-wave energy is refracted back to the surface where it is detected by sensors (geophones) that are coupled to the ground surface in a collinear array (spread). The detected signals are recorded on a multl-channel· seismograph and are analyzed to determine the shot point-to-geophone travel times. These data can be used along with the corresponding shot point-to-geophone distances to determine the depth. thickness, and velocity of subsurface seismic layers.
The seismic refraction technique is based on several assumptions. Paramount among these are:
1) that seismic velocity increases with depth. and. 2) that the velocity of each seismic layer is uniform over the length ofthe given spread.
In cases where these assumptions do not hold, the accuracy of the technique decreases. For example, if a low velocity layer occurs between two layers of higher velocity. the low velocity layer will not be detected and the depth to the underlying high velocity layer will be erroneously large. Also, if the velocity of a seismic layer varies laterally within a spread. those variations will be interpreted as fluctuations in the el~vation of the underlying seismic layer.
Instrumentation
Data acquisition is Initiated along each SR line by producing seismic energy using a mechanical source. Mechanical sources produce energy by impacting a metal strike plate on the ground surface with either a 12-16 pound sledge hammer or an elastic-band driven weight drop. The resulting seismic ·wave forms are recorded using a Geometries 24-channel engineering seismograph and Mark Products geophones with a natural frequency of 10Hz. The data are recorded on hard copy records (seismograms) as well as on computer disks for future processing. The seismograms display the amount of time it takes fbr a compression (P) wave to travel from a given shot point to each geophone in a spread.
Data Analysis
The seismic data are downloaded to a computer and processed using the program Seis/magerby Geometries, Inc. This is an interactive program that is used to determine the shot point to geophone travel times, and to compute a 20 model based on those times. Once the tlavel times for a given line are determined, the programs time-term algorithm is used to compute a preliminary 20 seismic model. This model is then used as input for the programs tomographic routine. Using this procedure, the program divides the starting model into a network of cells and assigns velocities to those cells based on the starting model. The program then traces the refracted seismic travel paths through
1

those cells and computes the associated travel times. It then compares the computed travel times with the measured times and adjusts the velocities of the appropriate cells to improve the fit. The software is programmed to continue this procedure for twenty iterations. Typically, at the end of the twenty iterations the travel times associated with the computed model match the observed travel times to an accuracy of one milli-second (mS) or better. Once a satisfactory model is computed, the software contours the model velocities to produce seismic velocity vs. depth and distance crosssections (profiles).
Limitations
In general, there are limitations unique to the SR method. These limitations are primarily based on assumptions that are made by the data analysis routine. First, the data analysis routine assumes that the velocities along the length of each spread are uniform. If there are localized zories wjthin each layer where the velocities are higher or lower than indicated, the analysis routine will interpret these zones as changes in the surface topography of the underlying layer. A zone of higher velocity material would be interpreted as a low in the surface of the underlying layer. Zones of lower velocity material would be interpreted as a high in the undedying layer.
Second, the data analYSis routine assumes that the velocity of subsurface materials increase with depth. Therefore, if a layer exhibits velocities that are slower than those of the material above It, the slower layer will not be resolved. Also, a velocity layer may simply be too thin to be detected. Due to these and other limitations inherent to the SR method, the results of the SR survey should be considered only as approximations of the subsurface conditions. The actual conditions may vary locally.
2