GEOSS Architecture for the Use of Satellites for Disaster...
22
1 GEOSS Architecture for the Use of Satellites for Disaster Management and Risk Assessment GA.4.Disasters Practitioner Case Studies John Evans / GST, Inc. Karen Moe / NASA Earth Science Technology Office Presented at CEOS-WGISS-33 Tokyo, Japan – April 25, 2012
Transcript of GEOSS Architecture for the Use of Satellites for Disaster...
1
GEOSS Architecture for the Use of Satellites for
Disaster Management and Risk Assessment
GA.4.Disasters
Practitioner Case Studies
John Evans / GST, Inc.
Karen Moe / NASA Earth Science Technology Office
Presented at CEOS-WGISS-33
Tokyo, Japan – April 25, 2012
2
Case Studies
• Disaster response scenarios and lessons: - China: Sichuan / Wenchuan earthquake 2008
- Japan: Tōhoku / Sendai earthquake & tsunami 2011
- Thailand monsoon floods 2011
• Technology pilots: - Namibia flood sensor web / dashboard
- NASU / NSAU Wide Area Grid Testbed for Flood Monitoring
- Caribbean disasters task for CEOS
- Thailand wildfire sensor web
- Virtual Mission Operation Center support to USGS HDDS
• Experiences with the International Charter: - USGS member view
- NOAA member view
- UK commercial provider view
- NASA EO-1 provider view
- Namibia end user view
- Japan earthquake data for E-DECIDER
3
Case Studies (continued)
• Other data brokers - Disaster Management Constellation (DMC)
• Satellites built by Surrey Ltd. SSTL & operated by DMC International Imaging for Spain, Turkey, China, Algeria, United Kingdom (x2 : UK-DMC), and Nigeria (x3)
- Sentinel Asia for Environment (SAFE) • Satellite tasking / data requests from Aqua, Terra, MTSAT
- GEONETCAST • RF broadcast of data products from NOAA, WMO, EUMETSAT, NASA EOS
• Value-added services / Decision support - NASA SERVIR
- Earthquake Data Enhanced Cyberinfrastructure for Disaster Evaluation and Response (E-DECIDER)
• Earthquake-related UAVSAR and InSAR interferograms, optical imagery; via WMS
- NASA Land Atmosphere Near real-time Capability for EOS (LANCE) • Rapid dissemination of MODIS products via WMS
- SErvice Régional de Traitement d'Image et de Télédétection (SERTIT) / U. Strasbourg
• Rapid Mapping Service serving Int'l Charter, DMCii
- EU Global Monitoring for Environment and Security (GMES) Emergency Response / powered by Seismic eArly warning For EuRope (SAFER)
- EU ORCHESTRA project (Open Architecture and Spatial Data Infrastructure for Risk Management)
- UN Platform for Space-based Information for Disaster Management and Emergency Response (SPIDER)
4
Case study questionnaire
1. Overview: Please summarize the disaster event in a few
sentences
(Refer if possible to published or online articles from news media, published
articles, Wikipedia, or other sources.)
2. Please indicate which organizations or individuals participated
in
• Responding to the disaster
• Forecasting the disaster, or identifying high-risk times or places
(if forecasting was possible)
• Reducing the risk or impact of the disaster
(e.g., evacuating populations, operating alert systems; setting building codes; operating
sensor networks)
3. How did these organizations or individuals interact or
collaborate with each other?
4. Who was involved in supplying satellite information to these
activities?
5
Case study questionnaire
5. What satellite information was used (or needed) to support
these activities? In particular:
• What types of observations?
(e.g., meteorology / atmosphere; hydrology; seismic changes; vegetation...)
• What other observations might have been useful?
• How frequent were the observations? Were they frequent enough?
• How much detail did these data show? (pixel size, spectral bands)
Was it enough?
6. What processing was performed on the data before users
obtained it?
(e.g., reformatting files; clipping / joining image scenes; contrast
stretching; georectification; interpreting or classifying multispectral
pixels, extracting graphics, etc.)
7. How could the information support to these activities been
streamlined? Or, how could these activities have taken
better advantage of available information?
6
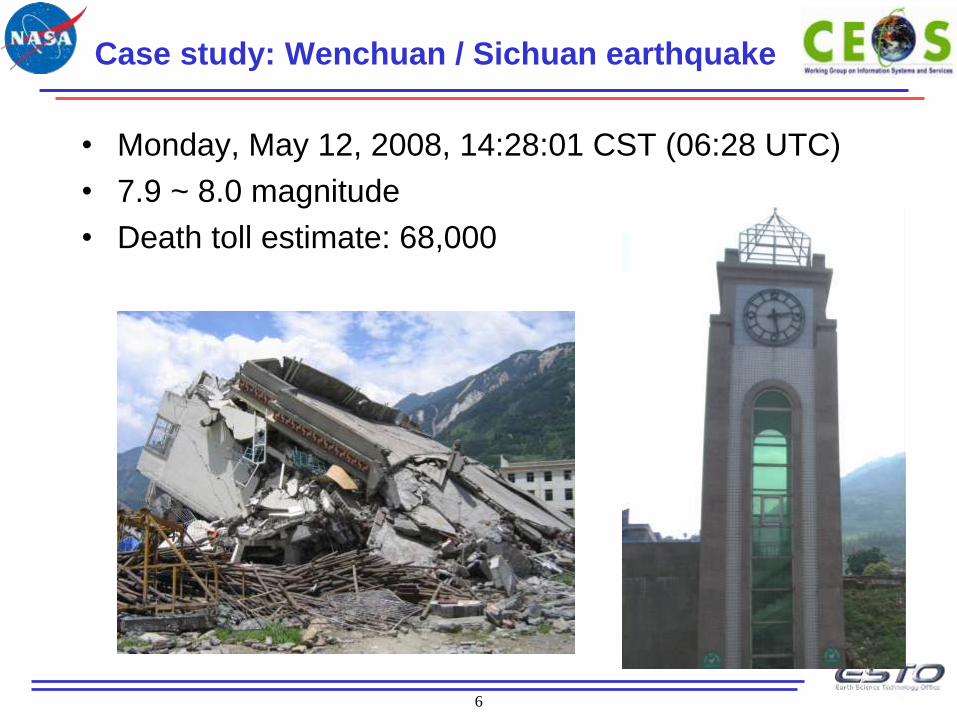
Case study: Wenchuan / Sichuan earthquake
• Monday, May 12, 2008, 14:28:01 CST (06:28 UTC)
• 7.9 ~ 8.0 magnitude
• Death toll estimate: 68,000
7
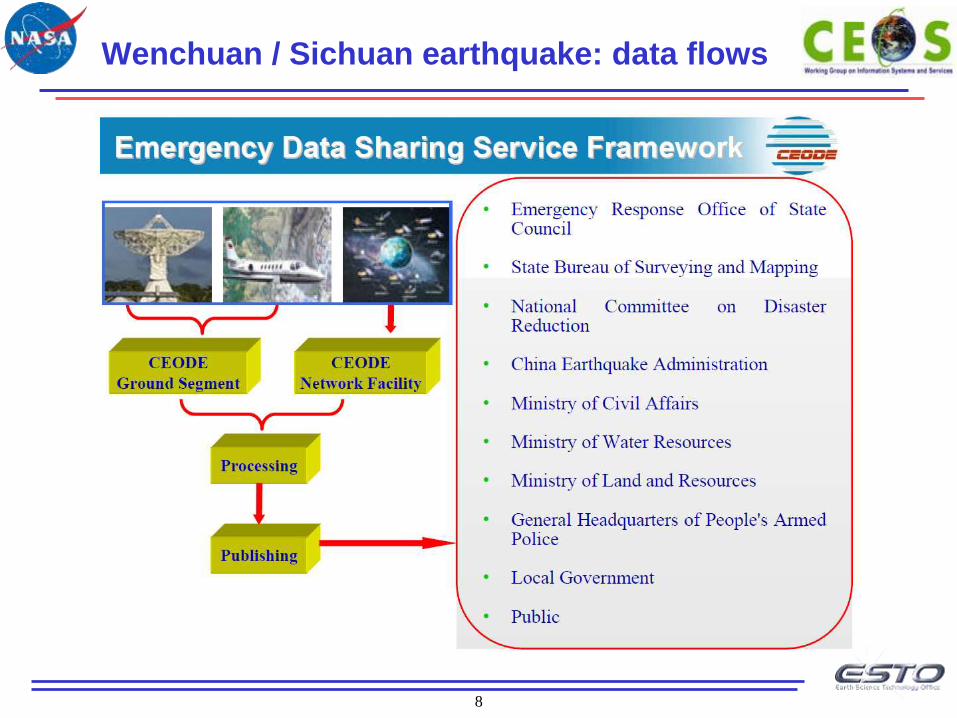
Wenchuan / Sichuan earthquake: data sharing
• Earthquake data sharing mechanism set up by Ministry
Of Science and Technology (MOST) and Chinese
Academy of Sciences
• Data sharing bodies include 13 Ministries such as
MLR, MWR, etc.
• Data sharing “pool” was appointed, implemented by
Center for Earth Observation and Digital Earth
(CEODE)
8
Wenchuan / Sichuan earthquake: data flows

9
Wenchuan / Sichuan earthquake: Phases
1. Rescuing survivors (May 12-18, 2008) • Priorities: Rapidly locating worst-hit areas; Routing rescue teams and
disaster relief dispatch; Timely decision support.
• Chief inputs: High-resolution aerial and satellite images (to locate collapsed buildings); local population distributions (to plan and manage rescue efforts).
2. Prevention of secondary disasters (May 19 - June 12, 2008) • Priorities: Preventing landslides and mudslides; evacuating settlements
threatened by “quake lakes” (due to blocked rivers).
• Chief inputs: Airborne and space-borne optical imagery and radar data (to identify, assess, and make decisions regarding locations prone to secondary disasters).
3. Disaster assessment and reconstruction • Expected to span 5 to 10 years
10
Case study: Wenchuan / Sichuan earthquake
• Data Acquired: • Pre-Disaster: IRS-P6, LANDSAT-5, SPOT-5, RADARSAT-1,
SPOT2/4,IKONOS,etc.
• Post-disaster: • LANDSAT-5, SPOT-5, RADARSAT-1, RADARSAT-2, SPOT2/4,
TERRASAR-X,EROS-B, QUICKBIRD, ALOS, etc.
• Airborne optical, SAR remote sensing data
• Via International Charter: ASTER, Landsat (TM, ETM), IKONOS, WorldView, ALOS, TERRASAR-X, EROS-B, COSMOS, etc.
• Data processing operations: • Georectification
• Contrast stretch
• Joining image scenes
• Image interpretation
• Extracting graphics especially DEM data
• Needed resolution: <=1m (rescue); 5-30m (surveys)
• Most useful data: Airborne remote sensing
11
Wenchuan / Sichuan earthquake: Lessons
• Importance of high-resolution airborne optical remote sensing
• SAR offered all-weather data acquisition
• Multi-mode SAR especially useful
• Three-dimensional computing & simulation
• for assessing secondary geological risks; and
• for collaboration, auxiliary mitigation, and analysis
• Secondary monitoring relied heavily on traditional man-machine
interactive visual interpretation technology
• Automated algorithms inadequate for high-resolution observations
• 3D interactive analysis technology immature
(From Huadong Guo et al. (2012), Earth Observation for Earthquake Disaster Monitoring and
Assessment. In Earthquake Research and Analysis - Statistical Studies, Observations and Planning,
Dr Sebastiano D'Amico (Ed.). InTech: http://www.intechopen.com/books/earthquake-research-and-analysis-
statistical-studies-observations-and-planning/earth-observation-for-earthquake-disaster-monitoring-and-assessment)
12
Wenchuan / Sichuan earthquake: Lessons
• High-resolution airborne and space-borne remote sensing data were
effective and timely. However:
• Need improved earth observations:
• Satellite imagery at 0.5~1.0 m; Aerial imagery at 0.1~0.5 m
• At least daily revisit over disaster-struck areas
• Improved image geometric and radiometric quality
• Need improved processing / interpretation capabilities:
• Automated, near-real-time methods for data processing and reduction
• Cannot rely on ground control after major earthquakes
• Fast, accurate, automated methods for processing optical and multi-band and multi-
polarization radar data
• Need a network unifying all high-resolution earth observations
• Need more international cooperation in geospatial technology; and
participation in (e.g.,) GEO, GEOSS
(From Deren Li (2009), Earth Observation for Earthquake Disaster Monitoring and Assessment,
Photogrammetric Engineering & Remote Sensing, May 2009
http://www.asprs.org/a/publications/pers/2009journal/may/highlight1.pdf)
13
Case study: 2011 Namibia Flood Pilot
14
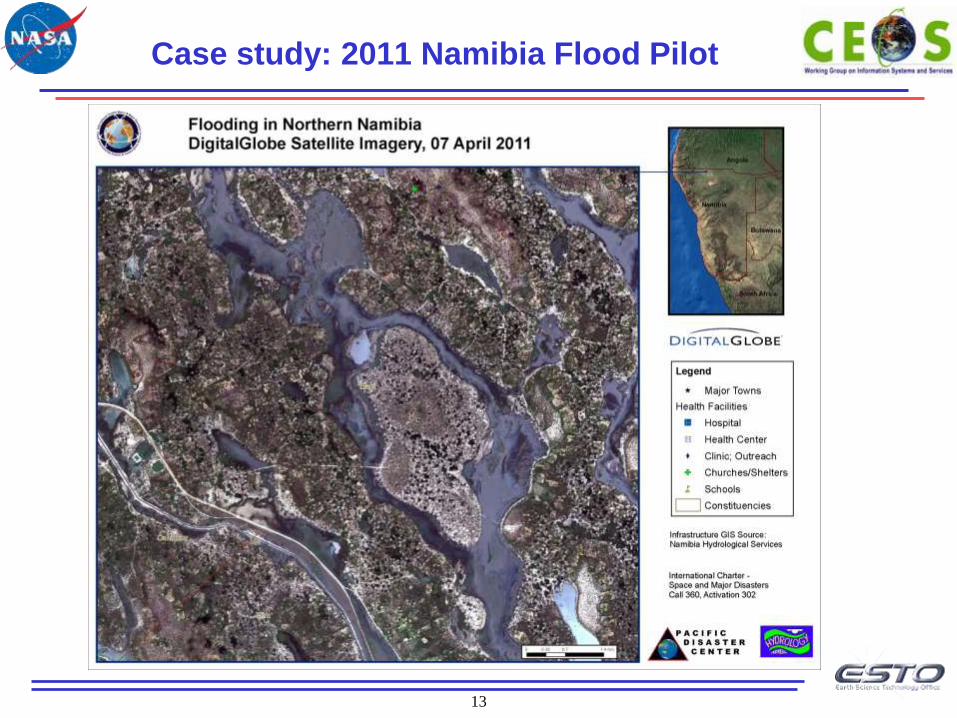
Case study: 2011 Namibia Flood Pilot
• Northern Namibia, March 25-April 10, 2011
• Highest known flood in the country’s history
• State of emergency after severe flooding in the north
claimed 62 lives. Flood waves peaked on 28 March
2011 and the first week of April
• Participants in disaster mitigation & response:
• United Nations (UNDP, UNOOSA)
• Namibia Dept. of Hydrology (Guido L.)
• Int’l Charter (=> CSA, Pacific Disaster Ctr.)
• NASA
15
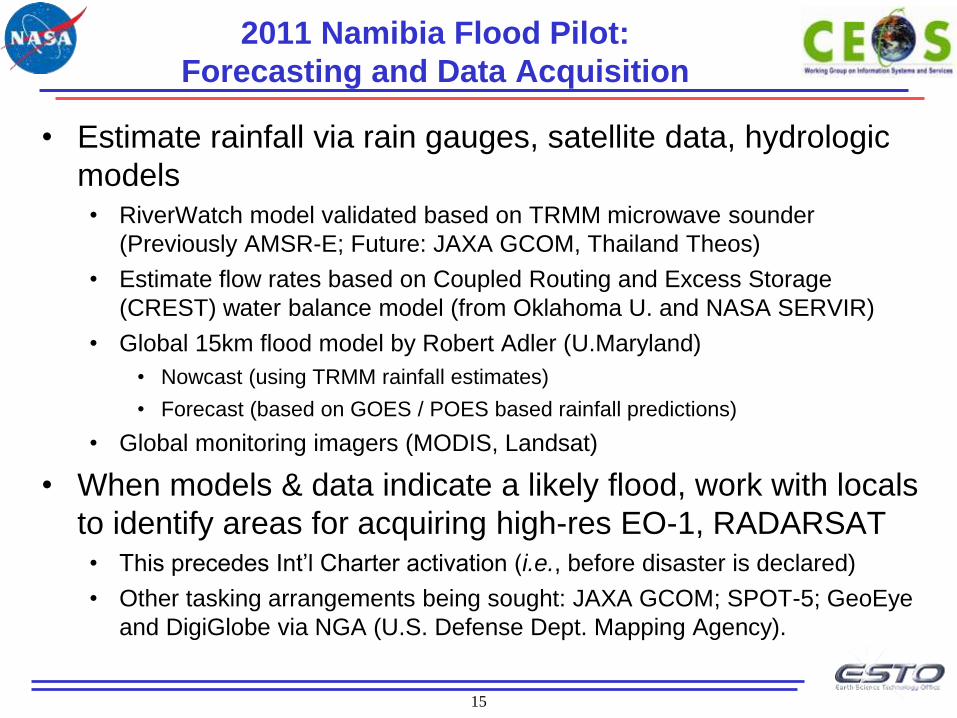
2011 Namibia Flood Pilot:
Forecasting and Data Acquisition
• Estimate rainfall via rain gauges, satellite data, hydrologic
models • RiverWatch model validated based on TRMM microwave sounder
(Previously AMSR-E; Future: JAXA GCOM, Thailand Theos)
• Estimate flow rates based on Coupled Routing and Excess Storage
(CREST) water balance model (from Oklahoma U. and NASA SERVIR)
• Global 15km flood model by Robert Adler (U.Maryland)
• Nowcast (using TRMM rainfall estimates)
• Forecast (based on GOES / POES based rainfall predictions)
• Global monitoring imagers (MODIS, Landsat)
• When models & data indicate a likely flood, work with locals
to identify areas for acquiring high-res EO-1, RADARSAT • This precedes Int’l Charter activation (i.e., before disaster is declared)
• Other tasking arrangements being sought: JAXA GCOM; SPOT-5; GeoEye
and DigiGlobe via NGA (U.S. Defense Dept. Mapping Agency).
16
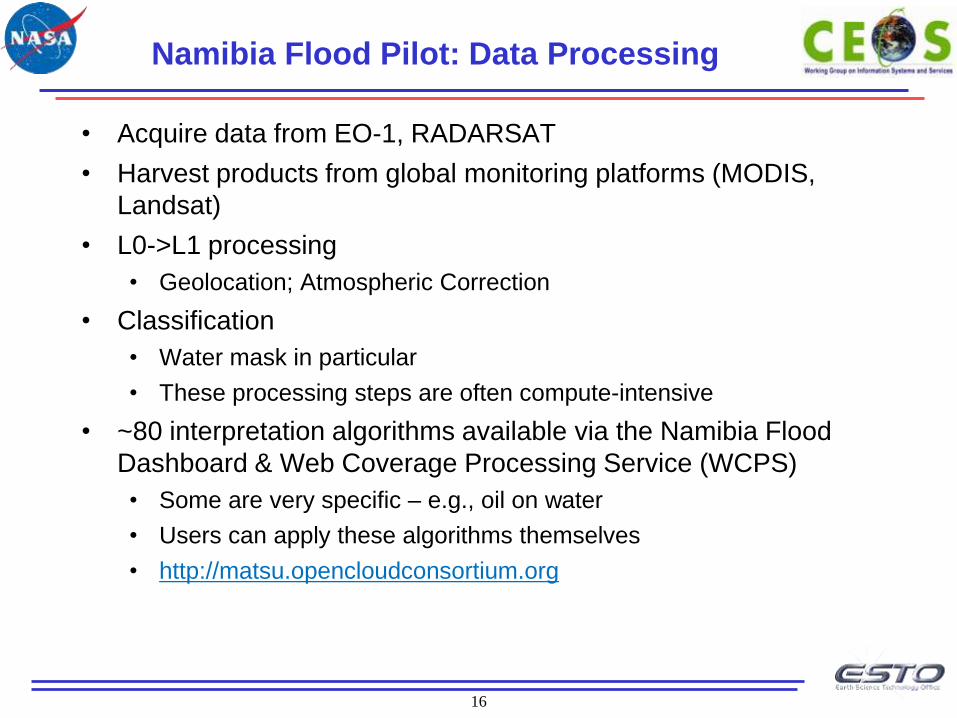
Namibia Flood Pilot: Data Processing
• Acquire data from EO-1, RADARSAT
• Harvest products from global monitoring platforms (MODIS,
Landsat)
• L0->L1 processing
• Geolocation; Atmospheric Correction
• Classification
• Water mask in particular
• These processing steps are often compute-intensive
• ~80 interpretation algorithms available via the Namibia Flood
Dashboard & Web Coverage Processing Service (WCPS)
• Some are very specific – e.g., oil on water
• Users can apply these algorithms themselves
• http://matsu.opencloudconsortium.org
17
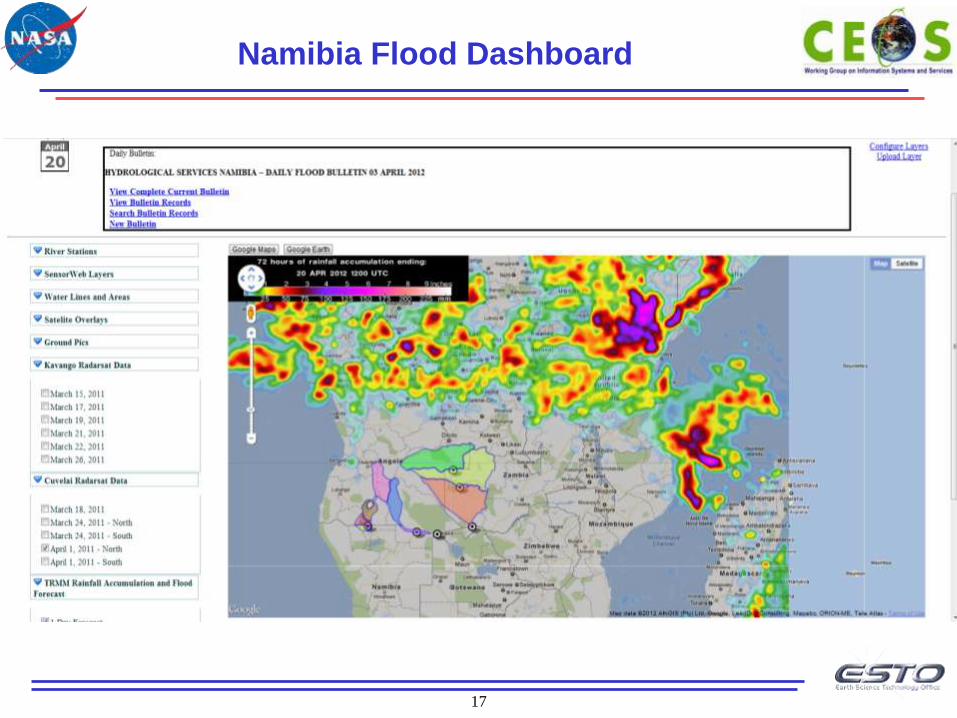
Namibia Flood Dashboard
18
Namibia Flood Pilot: Lessons
• Technical challenge: identifying water with vegetation
(reeds) growing • Use of detailed DEMs would help
• Coordination challenges: • Identifying areas of interest by lon/lat rather than placenames
• Obtaining data (not pictures) from the Int’l Charter in a timely fashion
• Data release policies not clear
• New approaches this year: • New software interface (API) for RADARSAT tasking & data access (via
CSA)
19
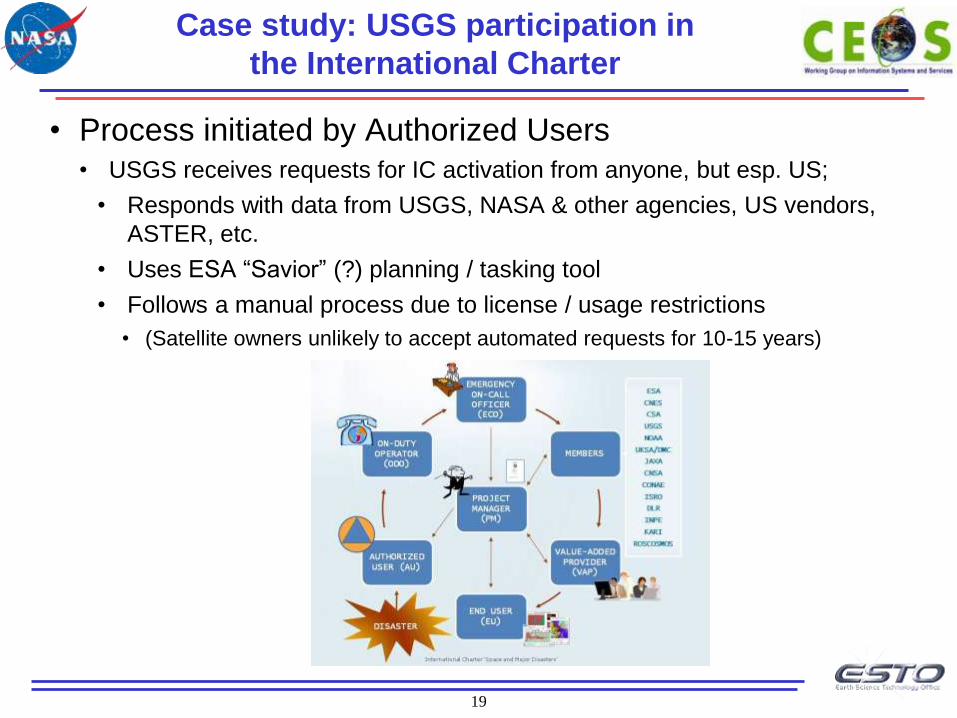
Case study: USGS participation in
the International Charter
• Process initiated by Authorized Users • USGS receives requests for IC activation from anyone, but esp. US;
• Responds with data from USGS, NASA & other agencies, US vendors,
ASTER, etc.
• Uses ESA “Savior” (?) planning / tasking tool
• Follows a manual process due to license / usage restrictions
• (Satellite owners unlikely to accept automated requests for 10-15 years)
20
Case study: USGS participation in
the International Charter
• Lessons • Easing data restrictions would help – e.g.,
• Allowing use by entire end user communities, not just the individual
requester;
• Open access to post-event products for recovery and research
• Major effort involved in getting just the right data coverage
• Risk of data overload (e.g., in March 2011 JAXA got ‘too much data’ for the
tsunami and damage assessment)
• End users often under pressure in a crisis situation; and products are
complex. Need to work with end users in advance of the crisis.
• Need tools to help end users get (only) the information they need; to match
products to audiences; and to facilitate rapid use of products.
21
Case study: NASA providing data
to Disaster Response efforts
• Interagency Remote Sensing Coordination Cell (IRSCC)
• Chaired by DHS; Members include Homeland Security and Defense
agencies (FEMA, NGA) + NOAA, NASA, USGS, others
• Respond to emergency operation needs, incl. International Charter
• NASA-IRSCC interface: HQ Applied Sciences Program
• Program has a full time Disaster Management lead (finally)
• Hurricane Irene (2011) experience
• Key liaison role: B. Jones (USGS Hazards Data Distribution System,
IRSCC, Int’l Charter)
• NASA provided MODIS flood product, EO-1, ASTER (link)
• Several NASA specialists formulated ASTER, EO-1 requests (bounding
boxes) based on cloud cover, imagery swaths, etc.
• Lessons
• First responders need both simple images and real data for analysis
• Better tools / methods for choosing data would enable faster support
22
GA.4.Disasters Agenda
• GA.4.Disasters – GEOSS Architecture for the Use of Satellites
for Disaster Management and Risk Assessment
• Project Accomplishments
• WGISS-33 Expected Outcomes
• GA.4.Disasters Architecture draft report – John Evans
• Disaster – Risk Assessment Vision – Serhiy Skakun
• Case Study: Questionnaire and Interviews – John Evans
• Case Study: Namibian Flood Pilot – Dan Mandl
• Next Steps