GEORGIA The Peach State -...
34
GEORGIA The Peach State Prepared by: The Center for Agribusiness and Economic Development • The University of Georgia • Athens, GA
Transcript of GEORGIA The Peach State -...

GEORGIA The Peach State
Prepared by: The Center for Agribusiness and Economic Development • The University of Georgia •
Athens, GA

Leadership and Knowledge • Empower Leaders to Lead Perception is reality? Accountability? • Statistics don’t lie, BUT liars use statistics!
What’s relevant? Average vs. average county, percent change vs. totals, SO WHAT!
• Not everything of interest can be measured, and not everything that can be measured is of interest!
• How much do you know about Georgia, your district, or your county?
Center for Agribusiness & Economic Development, UGA

Go to www.caed.uga.edu and click on “Resources” in left menu panel, then select “Georgia Statistics System”. Find published reports
by clicking on “Publications”

Click on “demographic”
and “agricultural” to print or view
county/state fact sheets.
2,908,506
3,123,723
3,444,578
3,943,116
4,589,575
5,463,105
6,478,149
8,186,453
9,687,653
9,992,167
11,326,787
0 3,000,000 6,000,000 9,000,000 12,000,000
1930
1940
1950
1960
1970
1980
1990
2000
2010
2013 Estimate
2020 OPB Proj.
Primary data sources: Decennial censuses and estimate, U.S. Census Bureau; State of Georgia Office of Planning & Budget, Projections.
Georgia Total Population
From 2010-2013 Georgia increased its population
by 3.1% and was the 5th fastest growing
numerically of any US state. -----
Avg. State increase = 2.2%

Total Population: 2013
Northwest Avg. Co. 161,191 Total 6,286,478
Southwest Avg. Co. 22,858
Total 937,206 Southeast Avg. Co. 30,980 Total 1,208,220
Northeast Avg. Co. 39,006 Total 1,560,263
Georgia Avg. Co. 62,843 Total 9,992,167
Primary data source: U.S. Census Bureau Population estimates
Graphic by Center for Agribusiness & Economic Development, UGA

Population Change: 2000-2010
Primary data source: U.S. Census Bureau
Northeast Avg. Co. 17.0%
Georgia Avg. Co. 14.2%
Total 18.3% ---------------
US 9.7%
Northwest Avg. Co. 20.9%
Southeast Avg. Co. 12.6%
Southwest Avg. Co. 6.4%
Graphic by Center for Agribusiness & Economic Development, UGA

Population Composition by Age State of Georgia
10.0
31.1
38.5
15.3
5.1
12.3
27.8
37.2
16.3
6.4
12.0
30.0
32.6
18.1
7.4
9.2
30.4
33.5
18.9
8.0
7.6
26.5
38.3
18.1
9.4
7.7
22.4
41.9
18.0
10.1
7.3
22.2
39.6
21.3
9.6
7.1
21.6
35.2
25.4
10.7
0%
100%
1940 1950 1960 1970 1980 1990 2000 2010
65 + 45-64 20-44 5-19 < 5
2013 Median Age = 35.9 yrs.
Primary data source: U.S. Census Bureau

Georgia Population by Race and Ethnicity: 2013
Hispanic/Latino –persons – 9.2% Persons of Hispanic Origin may be of any race
so are not included in the pie chart. Primary data source: U.S. Census Bureau
White Alone62.5%
Two or more Races1.9%
Other Races Alone4.3%
Black Alone31.3%

Percentage Black Population: 2013
Northwest Avg. Co. 24.4%
Southwest Avg. Co. 38.7%
Southeast Avg. Co. 29.9%
Northeast Avg. Co. 20.0%
Georgia Avg. Co. 28.3%
Total 31.4% --------------- US 13.1%
Primary data source: U.S. Census Bureau http://www.census.gov/popest/data/national/asrh/2013/index.html
Graphic by Center for Agribusiness & Economic Development, UGA
Screven
Brantley
Bulloch
Wayne
Evans
Effingham
Long
Liberty
Bryan
Camden
Glynn
McIntosh
Chatham
Gordon
Bartow
Murray
Polk
Haralson
Dade
Walker
Chattooga
Catoosa
Carroll
Paulding
Union
Lumpkin
Douglas
Cobb
Pickens
Cherokee
Fannin
Gilmer
Dawson
DeKalb
Forsyth
Gwinnett
Henry
Rabun
Newton
Towns
Hall
White
Walton
Barrow
Jackson
Franklin
Madison
Hart
Elbert
Oconee
Morgan
Banks
Stephens
Clarke
Putnam
Greene
Oglethorpe
Baldwin
Hancock
LamarMonroe
Bibb
Jones
Butts Jasper
WilkinsonHarris
Muscogee
Talbot
Heard
Troup
Coweta
Meriwether
Fayette
Spalding
Pike
Upson
Taylor
Crawford
Peach
Houston
Twiggs
Bleckley
Pulaski
Sumter
Crisp
Schley
Macon
Dooly
Turner
Wilcox
Ben HillRandolph
Calhoun
Quitman
Stewart
Marion
Webster
Terrell
Dougherty
Lee
Worth
Tift
Colquitt
Seminole
Decatur
Early
Miller
Baker
Mitchell
Grady Thomas Brooks
Irwin
Cook
Dodge
Berrien
Lowndes
Laurens
Wilkes
Taliaferro
Johnson
Telfair
Washington
Warren
Coffee
Atkinson
Lanier
Lincoln
Wheeler
Echols
Jefferson
Clinch
Jeff Davis
Treutlen
Emanuel
Columbia
Toombs
Burke
Bacon
Ware
Richmond
Appling
Pierce
Candler
Tattnall
Jenkins
Charlton
Clayton
Whitfield
Fulton
Habers
ham
Glascock
Mon
tgom
ery
McDuffie
Chatta
hooc
hee
Clay
Rockd
ale
Floyd

Percentage Hispanic/Latino Origin Population: 2013
Northwest Avg. Co. 7.5%
Southwest Avg. Co. 5.8%
Southeast Avg. Co. 6.4%
Northeast Avg. Co. 5.0%
Georgia Avg. Co. 6.2%
Total 9.2% ---------------
US 16.1% Primary data source: U.S. Census Bureau Graphic by Center for Agribusiness &
Economic Development, UGA
Note: persons of Hispanic/Latino origin may
be of any race.
Screven
Brantley
Bulloch
Wayne
Evans
Effingham
Long
Liberty
Bryan
Camden
Glynn
McIntosh
Chatham
Gordon
Bartow
Murray
Polk
Haralson
Dade
Walker
Chattooga
Catoosa
Carroll
Paulding
Union
Lumpkin
Douglas
Cobb
Pickens
Cherokee
Fannin
Gilmer
Dawson
DeKalb
Forsyth
Gwinnett
Henry
Rabun
Newton
Towns
Hall
White
Walton
Barrow
Jackson
Franklin
Madison
Hart
Elbert
Oconee
Morgan
Banks
Stephens
Clarke
Putnam
Greene
Oglethorpe
Baldwin
Hancock
LamarMonroe
Bibb
Jones
Butts Jasper
WilkinsonHarris
Muscogee
Talbot
Heard
Troup
Coweta
Meriwether
Fayette
Spalding
Pike
Upson
Taylor
Crawford
Peach
Houston
Twiggs
Bleckley
Pulaski
Sumter
Crisp
Schley
Macon
Dooly
Turner
Wilcox
Ben HillRandolph
Calhoun
Quitman
Stewart
Marion
Webster
Terrell
Dougherty
Lee
Worth
Tift
Colquitt
Seminole
Decatur
Early
Miller
Baker
Mitchell
Grady Thomas Brooks
Irwin
Cook
Dodge
Berrien
Lowndes
Laurens
Wilkes
Taliaferro
Johnson
Telfair
Washington
Warren
Coffee
Atkinson
Lanier
Lincoln
Wheeler
Echols
Jefferson
Clinch
Jeff Davis
Treutlen
Emanuel
Columbia
Toombs
Burke
Bacon
Ware
Richmond
Appling
Pierce
Candler
Tattnall
Jenkins
Charlton
Clayton
Whitfield
Fulton
Habers
ham
Glascock
Mon
tgom
ery
McDuffieCha
ttaho
oche
e
Clay
Rockd
ale
Floyd

Components of Population Change: 2010-2013 Natural Increase & Net Migration
Numerical change includes “residual” not represented in either NI or NM. Average annual estimates of annual rates per 1,000 population.
Primary data source: U. S. Census Bureau, 2015 County Guide
Until 1960, natural increase (an excess of births over deaths) accounted for virtually all of Georgia's growth. Georgia is expected to rank 4th among 50 states in the number of persons gained through net internal migration during the 30-yr. period of 1995 and 2025.
Graphic by Center for Agribusiness & Economic
Development, UGA
Area 2010-2013 Numerical
Change
2010-2013 # Natural Increase
(Births-Deaths)
2010-2013 # Net
Migration
2012-2013 1-yr Natural
Increase (avg.) Rate
2012-2013 1 yr. Net
Migration (avg.) Rate
NE District 31,781 19,495 11,033 1.22 2.81 NW District 247,142 143,361 100,462 4.08 -0.30 SE District 23,618 20,754 1,463 3.60 -3.27 SW District 1,963 13,931 -12,640 2.67 -8.66 GA Avg. Co. 1,915 1,242 630 2.88 -2.4 GEORGIA 304,504 197,541 100,318 5.9 1.6

Percentage of Youth Ages 0-17, 2013
Northwest Avg. Co. 24.8%
Total 25.6%
Southwest Avg. Co. 23.3%
Total 24.4% Southeast Avg. Co. 23.9%
Total 23.9%
Northeast Avg. Co. 22.0%
Total 23.3%
Georgia Avg Co. 23.5%
Total 24.9% ---------------
US 24.5% Primary data source: U.S. Census Bureau
Graphic by Center for Agribusiness & Economic Development, UGA
Q5
Screven
Brantley
Bulloch
Wayne
Evans
Effingham
Long
Liberty
Bryan
Camden
Glynn
McIntosh
Chatham
Gordon
Bartow
Murray
Polk
Haralson
Dade
Walker
Chattooga
Catoosa
Carroll
Paulding
Union
Lumpkin
Douglas
Cobb
Pickens
Cherokee
Fannin
Gilmer
Dawson
DeKalb
Forsyth
Gwinnett
Henry
Rabun
Newton
Towns
Hall
White
Walton
Barrow
Jackson
Franklin
Madison
Hart
Elbert
Oconee
Morgan
Banks
Stephens
Clarke
Putnam
Greene
Oglethorpe
Baldwin
Hancock
LamarMonroe
Bibb
Jones
Butts Jasper
WilkinsonHarris
Muscogee
Talbot
Heard
Troup
Coweta
Meriwether
Fayette
Spalding
Pike
Upson
Taylor
Crawford
Peach
Houston
Twiggs
Bleckley
Pulaski
Sumter
Crisp
Schley
Macon
Dooly
Turner
Wilcox
Ben HillRandolph
Calhoun
Quitman
Stewart
Marion
Webster
Terrell
Dougherty
Lee
Worth
Tift
Colquitt
Seminole
Decatur
Early
Miller
Baker
Mitchell
Grady Thomas Brooks
Irwin
Cook
Dodge
Berrien
Lowndes
Laurens
Wilkes
Taliaferro
Johnson
Telfair
Washington
Warren
Coffee
Atkinson
Lanier
Lincoln
Wheeler
Echols
Jefferson
Clinch
Jeff Davis
Treutlen
Emanuel
Columbia
Toombs
Burke
Bacon
Ware
Richmond
Appling
Pierce
Candler
Tattnall
Jenkins
Charlton
Clayton
Whitfield
Fulton
Habers
ham
Glascock
Mon
tgom
ery
McDuffieCha
ttaho
oche
e
Clay
Rockd
ale
Floyd

Number of Youth Ages 0-17, 2013
Northwest Avg. Co. 41,188 Total 1,606,336
Southwest Avg. Co. 5,733 Total 230,210
Southeast Avg. Co. 7,414 Total 289,159
Northeast Avg. Co. 9,100 Total 364,004
Georgia Avg. Co. 15,658 Total 2,489,709
---- US 73.9 million
Primary data source: U.S. Census Bureau
Graphic by Center for Agribusiness & Economic Development, UGA
Screven
Brantley
Bulloch
Wayne
Evans
Effingham
Long
Liberty
Bryan
Camden
Glynn
McIntosh
Chatham
Gordon
Bartow
Murray
Polk
Haralson
Dade
Walker
Chattooga
Catoosa
Carroll
Paulding
Union
Lumpkin
Douglas
Cobb
Pickens
Cherokee
Fannin
Gilmer
Dawson
DeKalb
Forsyth
Gwinnett
Henry
Rabun
Newton
Towns
Hall
White
Walton
Barrow
Jackson
Franklin
Madison
Hart
Elbert
Oconee
Morgan
Banks
Stephens
Clarke
Putnam
Greene
Oglethorpe
Baldwin
Hancock
LamarMonroe
Bibb
Jones
Butts Jasper
WilkinsonHarris
Muscogee
Talbot
Heard
Troup
Coweta
Meriwether
Fayette
Spalding
Pike
Upson
Taylor
Crawford
Peach
Houston
Twiggs
Bleckley
Pulaski
Sumter
Crisp
Schley
Macon
Dooly
Turner
Wilcox
Ben HillRandolph
Calhoun
Quitman
Stewart
Marion
Webster
Terrell
Dougherty
Lee
Worth
Tift
Colquitt
Seminole
Decatur
Early
Miller
Baker
Mitchell
Grady Thomas Brooks
Irwin
Cook
Dodge
Berrien
Lowndes
Laurens
Wilkes
Taliaferro
Johnson
Telfair
Washington
Warren
Coffee
Atkinson
Lanier
Lincoln
Wheeler
Echols
Jefferson
Clinch
Jeff Davis
Treutlen
Emanuel
Columbia
Toombs
Burke
Bacon
Ware
Richmond
Appling
Pierce
Candler
Tattnall
Jenkins
Charlton
Clayton
Whitfield
Fulton
Habers
ham
Glascock
Mon
tgom
ery
McDuffie
Chatta
hooc
hee
Clay
Rockd
ale
Floyd

12.812.210.710.2
22.320.6
18.716.9
31.034.7
37.742.3
70.973.3
76.379.8
46.949.850.2
53.7
0 10 20 30 40 50 60 70 80
Percent of Total FAMILIES
Fem Hd-No Husband-w/chilren
Fem Hd-No husband
Husband-wife-children
Husband-wife
Families w/children
1980199020002008-2012
Georgia Families by Structure
Primary data source: U.S. Census Bureau Graphic by Center for Agribusiness & Economic Development, UGA

Female/Male Head Families, No Husband/Wife Present, w/Related Children <18
Northwest Avg. Co. 15.3%
Total 17.0%
Southwest Avg. Co. 21.4%
Total 21.4% Southeast
Avg. Co. 18.9% Total 18.9%
Northeast Avg. Co. 14.8%
Total 15.7%
Georgia Avg. Co. 17.6%
Total 17.5% ---------------
US 15.4% Primary data source: U.S. Census Bureau
6.3 – 12.8% 12.8 – 15.4% 15.4 – 19.4% 19.4 – 22.1% 22.1 – 30.6%
Graphic by Center for Agribusiness & Economic Development, UGA
Q6

Selected Public School Statistics
0 20 40 60 80
HS Dropout rate
Absent >15 days
Econ. Disadvantaged
Special Ed
Gifted
Class '14 Grad Rate
HOPE Eligible
Teachers w/adv…
3.6
9.6
60.0
10.6
11.3
72.5
46.0
68.1
3.4
10.3
68.0
11.3
8.6
75.9
45.5
67.1
Percentage
Avg GA Co Georgia
Primary data source: Governor’s Office of Student Achievement, 2012-2014
Georgia K12 enrollment = 1,837,279
HS dropouts = 19,103 General Fund Expenditures per FTE = $8,486

-5 5 15 25 35
< 9th grade
9th-12th no diploma
HS Grad
Some college, no degree
Associate degree
Bachelor's degree
Grad or Prof Degree
5.8
9.5
28.7
21.1
6.9
17.7
10.2
7.3
13.4
36.2
19.8
6.6
10.4
6.3
Percent of Persons Age 25+ Avg. GACountyGeorgia
Highest Level of Educational Attainment: 2009-2013 5 Yr. Avg. – American Community Survey
Primary data source: U.S. Census Bureau
State of Georgia Not completing HS = 15.3% With a bachelor’s + degree = 28.0%

$33,675
$37,062
$48,716
$42,299
$40,365
$49,179
$53,046
$0 $10,000 $20,000 $30,000 $40,000 $50,000
US
GEORGIA
GA Avg Co
NE Avg Co
NW Avg Co
SE Avg Co
SW Avg Co
Primary data source: U. S. Census Bureau
Median Household Income 2009-2013
Graphic by Center for Agribusiness & Economic Development, UGA

Per Capita Income: 2013
Southwest Avg. Co. $31,823
Northwest Avg. Co. $34,381
Southeast Avg. Co. $29,020
Northeast Avg. Co. $33,343
Georgia Avg. Co. $32,145
Total $37,845
---------------
US $44,765 Primary data source: U.S. Bureau of Economic Analysis
Graphic by Center for Agribusiness & Economic Development, UGA
Screven
Brantley
Bulloch
Wayne
Evans
Effingham
Long
Liberty
Bryan
Camden
Glynn
McIntosh
Chatham
Gordon
Bartow
Murray
Polk
Haralson
Dade
Walker
Chattooga
Catoosa
Carroll
Paulding
Union
Lumpkin
Douglas
Cobb
Pickens
Cherokee
Fannin
Gilmer
Dawson
DeKalb
Forsyth
Gwinnett
Henry
Rabun
Newton
Towns
Hall
White
Walton
Barrow
Jackson
Franklin
Madison
Hart
Elbert
Oconee
Morgan
Banks
Stephens
Clarke
Putnam
Greene
Oglethorpe
Baldwin
Hancock
LamarMonroe
Bibb
Jones
Butts Jasper
WilkinsonHarris
Muscogee
Talbot
Heard
Troup
Coweta
Meriwether
Fayette
Spalding
Pike
Upson
Taylor
Crawford
Peach
Houston
Twiggs
Bleckley
Pulaski
Sumter
Crisp
Schley
Macon
Dooly
Turner
Wilcox
Ben HillRandolph
Calhoun
Quitman
Stewart
Marion
Webster
Terrell
Dougherty
Lee
Worth
Tift
Colquitt
Seminole
Decatur
Early
Miller
Baker
Mitchell
Grady Thomas Brooks
Irwin
Cook
Dodge
Berrien
Lowndes
Laurens
Wilkes
Taliaferro
Johnson
Telfair
Washington
Warren
Coffee
Atkinson
Lanier
Lincoln
Wheeler
Echols
Jefferson
Clinch
Jeff Davis
Treutlen
Emanuel
Columbia
Toombs
Burke
Bacon
Ware
Richmond
Appling
Pierce
Candler
Tattnall
Jenkins
Charlton
Clayton
Whitfield
Fulton
Habers
ham
Glascock
Mon
tgom
ery
McDuffie
Chatta
hooc
hee
Clay
Rockd
ale
Floyd

Pct. Persons Below Poverty Level: 2013 Model-Based Estimates Poverty threshold for a family of four = $23,550
Northwest Avg. Co. 17.5%
Southwest Avg. Co. 26.8%
Southeast Avg. Co. 24%
Northeast Avg. Co. 19.8%
Georgia Avg. Co. 22.0%
Total 18.2% --------------- US 15.4% Source: U.S. Census Bureau
Screven
Brantley
Bulloch
Wayne
Evans
Effingham
Long
Liberty
Bryan
Camden
Glynn
McIntosh
Chatham
Gordon
Bartow
Murray
Polk
Haralson
Dade
Walker
Chattooga
Catoosa
Carroll
Paulding
Union
Lumpkin
Douglas
Cobb
Pickens
Cherokee
Fannin
Gilmer
Dawson
DeKalb
Forsyth
Gwinnett
Henry
Rabun
Newton
Towns
Hall
White
Walton
Barrow
Jackson
Franklin
Madison
Hart
Elbert
Oconee
Morgan
Banks
Stephens
Clarke
Putnam
Greene
Oglethorpe
Baldwin
Hancock
LamarMonroe
Bibb
Jones
Butts Jasper
WilkinsonHarris
Muscogee
Talbot
Heard
Troup
Coweta
Meriwether
Fayette
Spalding
Pike
Upson
Taylor
Crawford
Peach
Houston
Twiggs
Bleckley
Pulaski
Sumter
Crisp
Schley
Macon
Dooly
Turner
Wilcox
Ben HillRandolph
Calhoun
Quitman
Stewart
Marion
Webster
Terrell
Dougherty
Lee
Worth
Tift
Colquitt
Seminole
Decatur
Early
Miller
Baker
Mitchell
Grady Thomas Brooks
Irwin
Cook
Dodge
Berrien
Lowndes
Laurens
Wilkes
Taliaferro
Johnson
Telfair
Washington
Warren
Coffee
Atkinson
Lanier
Lincoln
Wheeler
Echols
Jefferson
Clinch
Jeff Davis
Treutlen
Emanuel
Columbia
Toombs
Burke
Bacon
Ware
Richmond
Appling
Pierce
Candler
Tattnall
Jenkins
Charlton
Clayton
Whitfield
Fulton
Habers
ham
Glascock
Mon
tgom
ery
McDuffie
Chatta
hooc
hee
Clay
Rockd
ale
Floyd

Pct. Ages 0-17 Below Poverty Level 2013 Model-Based Estimates
Northwest Avg. Co. 24.3%
Southwest Avg. Co. 38.4%
Southeast Avg. Co. 33.3%
Northeast Avg. Co. 28.6%
Georgia Avg. Co. 31.3%
Total 25.3% --------------- US 21.6%
Source: U.S. Census Bureau
Screven
Brantley
Bulloch
Wayne
Evans
Effingham
Long
Liberty
Bryan
Camden
Glynn
McIntosh
Chatham
Gordon
Bartow
Murray
Polk
Haralson
Dade
Walker
Chattooga
Catoosa
Carroll
Paulding
Union
Lumpkin
Douglas
Cobb
Pickens
Cherokee
Fannin
Gilmer
Dawson
DeKalb
Forsyth
Gwinnett
Henry
Rabun
Newton
Towns
Hall
White
Walton
Barrow
Jackson
Franklin
Madison
Hart
Elbert
Oconee
Morgan
Banks
Stephens
Clarke
Putnam
Greene
Oglethorpe
Baldwin
Hancock
LamarMonroe
Bibb
Jones
Butts Jasper
WilkinsonHarris
Muscogee
Talbot
Heard
Troup
Coweta
Meriwether
Fayette
Spalding
Pike
Upson
Taylor
Crawford
Peach
Houston
Twiggs
Bleckley
Pulaski
Sumter
Crisp
Schley
Macon
Dooly
Turner
Wilcox
Ben HillRandolph
Calhoun
Quitman
Stewart
Marion
Webster
Terrell
Dougherty
Lee
Worth
Tift
Colquitt
Seminole
Decatur
Early
Miller
Baker
Mitchell
Grady Thomas Brooks
Irwin
Cook
Dodge
Berrien
Lowndes
Laurens
Wilkes
Taliaferro
Johnson
Telfair
Washington
Warren
Coffee
Atkinson
Lanier
Lincoln
Wheeler
Echols
Jefferson
Clinch
Jeff Davis
Treutlen
Emanuel
Columbia
Toombs
Burke
Bacon
Ware
Richmond
Appling
Pierce
Candler
Tattnall
Jenkins
Charlton
Clayton
Whitfield
Fulton
Habers
ham
Glascock
Mon
tgom
ery
McDuffie
Chatta
hooc
hee
Clay
Rockd
ale
Floyd

Births to Unmarried Females 2012
Northwest Avg. Co. 42.2%
Southwest Avg. Co. 58.8%
Southeast Avg. Co. 51.0%
Northeast Avg. Co. 44.0%
Georgia Avg. Co. 49.1%
Total 44.5% US 40.6%
Primary data source: GA Dept. of Public Health Graphic by Center for Agribusiness &
Economic Development, UGA
Screven
Brantley
Bulloch
Wayne
Evans
Effingham
Long
Liberty
Bryan
Camden
Glynn
McIntosh
Chatham
Gordon
Bartow
Murray
Polk
Haralson
Dade
Walker
Chattooga
Catoosa
Carroll
Paulding
Union
Lumpkin
Douglas
Cobb
Pickens
Cherokee
Fannin
Gilmer
Dawson
DeKalb
Forsyth
Gwinnett
Henry
Rabun
Newton
Towns
Hall
White
Walton
Barrow
Jackson
Franklin
Madison
Hart
Elbert
Oconee
Morgan
Banks
Stephens
Clarke
Putnam
Greene
Oglethorpe
Baldwin
Hancock
LamarMonroe
Bibb
Jones
Butts Jasper
WilkinsonHarris
Muscogee
Talbot
Heard
Troup
Coweta
Meriwether
Fayette
Spalding
Pike
Upson
Taylor
Crawford
Peach
Houston
Twiggs
Bleckley
Pulaski
Sumter
Crisp
Schley
Macon
Dooly
Turner
Wilcox
Ben HillRandolph
Calhoun
Quitman
Stewart
Marion
Webster
Terrell
Dougherty
Lee
Worth
Tift
Colquitt
Seminole
Decatur
Early
Miller
Baker
Mitchell
Grady Thomas Brooks
Irwin
Cook
Dodge
Berrien
Lowndes
Laurens
Wilkes
Taliaferro
Johnson
Telfair
Washington
Warren
Coffee
Atkinson
Lanier
Lincoln
Wheeler
Echols
Jefferson
Clinch
Jeff Davis
Treutlen
Emanuel
Columbia
Toombs
Burke
Bacon
Ware
Richmond
Appling
Pierce
Candler
Tattnall
Jenkins
Charlton
Clayton
Whitfield
Fulton
Habers
ham
Glascock
Mon
tgom
ery
McDuffie
Chatta
hooc
hee
Clay
Rockd
ale
Floyd

Transfer Receipts as a Percentage of Total Personal Income: 2008-2012
10
15
20
25
30
2008 2009 2010 2011 2012
Perc
enta
ge
Avg.GA County Georgia Southeast U.S.Primary data source: U.S. Bureau of Economic Analysis (3/14)
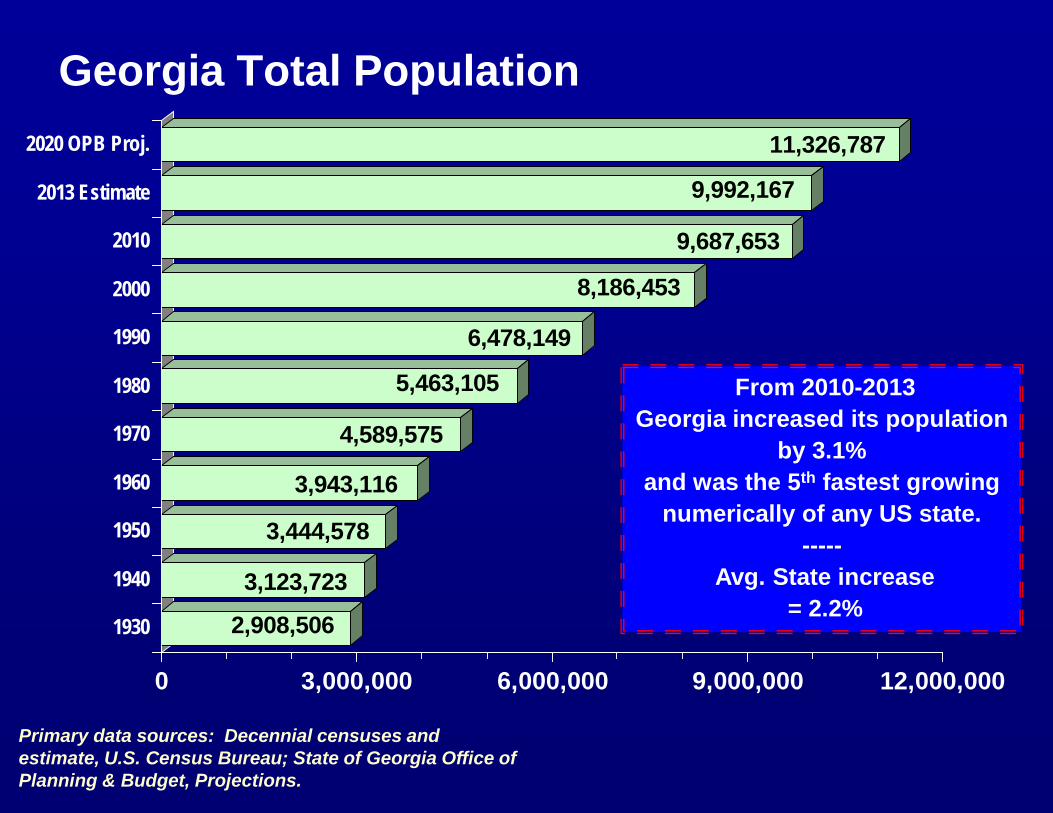
Civilian Labor Force Average Annual Unemployment Rates
0
2
4
6
8
10
12
2006 2007 2008 2009 2010 2011 2012 2013 2014
Rat
e pe
r 100
in L
abor
For
ce
Georgia U. S.
2015 Rates(02/15) GA = 6.3 US = 5.5
Primary data source: GA Dept. of Labor

Employment Comparisons by Industry Group(%): 2013
22.0
52.0
25.7
13.5
69.7
16.3
Goods Producing
Service Providing
Government
Avg. GA County Georgia
Primary data source: GA Dept. of Labor

58.6
38.6
79.4
10.6
4.7
Residents working in county
Residents working out of county
Residents driving to work alone
Residents carpooling
Residents working at home
Percentage of:
Commuting to Work: 2009-2013 5 Yr. Georgia Average – American Community Survey
Resident workers 16+ = 4,011,866
Primary data source: U.S. Census Bureau
Travel time to work for residents not working at home:
< 20 min. = 39.7% 45+ min. = 18.3%
Mean travel time to work
= 27 minutes

Georgia Leading Deaths by Cause
Alzheimer's2.7%
Nephritis/Nephrotic Syndrome/Nephrosis
2.4%
Septicemia2.1%
Suicide1.3%
Homicide1.0%
HIV1.0%
All Other23.1%
Heart Disease24.2%
Diabetes Mellitus2.4%
Influenza-Pneumonia2.2%
Chronic Lower Respir. Dis.
5.0%Accidents
5.5%
Cerebrovascular Disease
5.7%
Cancer21.4%
Selected GA Total Rates per 100,000 Heart Disease = 173.6
Cancer = 152.9 Cerebrovascular Disease (Stroke) = 40.9
Accidents = 39.2 Chronic Lower Respiratory Disease = 35.7
Diabetes Mellitus = 17.4 Influenza/Pneumonia = 15.5
Suicide = 9.6 Homicide = 7.1
Primary data source: GA Dept. of Public Health Vital Statistics Report
Graphic by Center for Agribusiness & Economic
Development, UGA
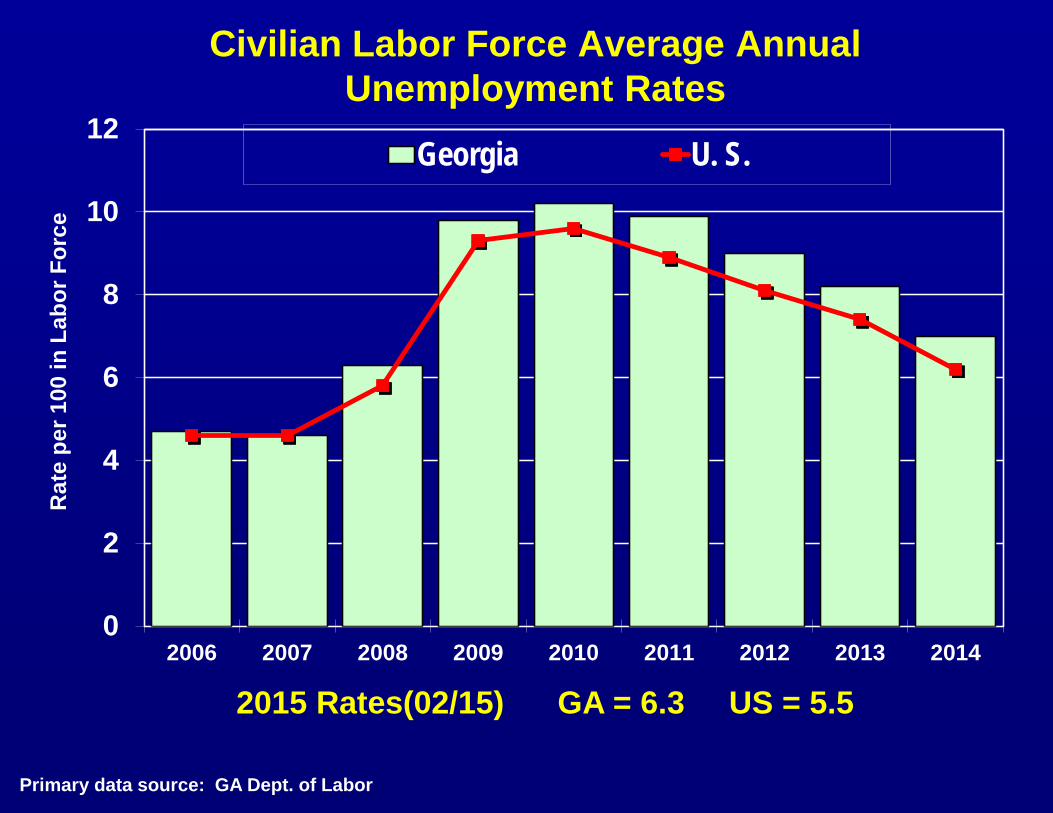
14.6
38.4
9.2
8.6
9.5
9.4
15.8
42.4
34.5
7.2
15.3
8.4
46.7
9.0
Total births per 1,000 pop
Unwed per 100 total births
Teen pregnancy per 1,000females age 10-19
Deaths per 1,000 pop
Induced terminations per1,000 females age 15-44
Low birth weight per 100births
Infant deaths per 1,000 births
Avg. GA Co.Georgia
Selected Vital Statistics Rates
Georgia Natality Data 148,403 total births – 62,887 unwed
27,642 induced terminations 22,561 teen pregnancies
14,209 low-birth-weight babies
Georgia Mortality Data 67,079 total deaths 1,198 infant deaths
Primary data source: GA Dept. Public Health OASIS web server
10-yrs.
Graphic by Center for Agribusiness & Economic Development, UGA

Number of Farms: 2012
Primary data sources: U.S. Census of Agriculture and Georgia Statistics System
Northeast
No. of Farms 11,803
Acres in Farms 1,480,631
Southwest
No. of Farms 10,058
Acres in Farms 3,982,422
Northwest
No. of Farms 9,999
Acres in Farms 1,253,893
Southeast
No. of Farms 10,097
Acres in Farms 2,803,890
GEORGIA
No of Farms 42,257
Acres in Farms 9,620,836
Average Farm Size 228 acres
Harvested Cropland 3,609,788
Screven
Brantley
Bulloch
Wayne
Evans
Effingham
Long
Liberty
Bryan
Camden
Glynn
McIntosh
Chatham
Gordon
Bartow
Murray
Polk
Haralson
Dade
Walker
Chattooga
Floyd
Catoosa
Carroll
Paulding
Union
Lumpkin
Douglas
Cobb
Pickens
Cherokee
Fannin
Gilmer
Dawson
DeKalb
Forsyth
Gwinnett
Henry
Rabun
Newton
Towns
Hall
White
Walton
Barrow
Jackson
Franklin
Madison
Hart
Elbert
Oconee
Morgan
Banks
Stephens
Clarke
Putnam
Greene
Oglethorpe
Baldwin
Hancock
LamarMonroe
Bibb
Jones
Butts Jasper
WilkinsonHarris
Muscogee
Talbot
Heard
Troup
Coweta
Meriwether
Fayette
Spalding
Pike
Upson
Taylor
Crawford
Peach
Houston
Twiggs
Bleckley
Pulaski
Sumter
Crisp
Schley
Macon
Dooly
Turner
Wilcox
Ben HillRandolph
Calhoun
Quitman
Stewart
Marion
Webster
Terrell
Dougherty
Lee
Worth
Tift
Colquitt
Seminole
Decatur
Early
Miller
Baker
Mitchell
Grady Thomas Brooks
Irwin
Cook
Dodge
Berrien
Lowndes
Laurens
Wilkes
Taliaferro
Johnson
Telfair
Washington
Warren
Coffee
Atkinson
Lanier
Lincoln
Wheeler
Echols
Jefferson
Clinch
Jeff Davis
Treutlen
Emanuel
Columbia
Toombs
Burke
Bacon
Ware
Richmond
Appling
Pierce
Candler
Tattnall
Jenkins
Charlton
Clayton
Whitfield
Fulton
Habers
ham
Glascock
Mon
tgom
ery
McDuffieCha
ttaho
oche
e
Clay
Rockd
ale
Legend
No. of Farms
118 to 194
13 to 117
195 to 278
279 to 379
380 to 909

Georgia Farms: 1945-2012
Primary data source: U.S. Census of Agriculture
42.3
228
9.6
0
50
100
150
200
250
300
19451949
19541959
19641969
19741978
19821987
19921997
20022007
2012
Number of farms (thousands)Average farm size in acresLand in farms (millions of acres)

2013 Total Farm Gate Value
GA = $13.59 billion
Northwest $1,725,646,356
Southwest $4,878,379,756
Southeast $2,798,237,315
Northeast $4,189,672,825
Screven
Brantley
Bulloch
Wayne
Evans
Effingham
Long
Liberty
Bryan
Camden
Glynn
McIntosh
Chatham
Gordon
Bartow
Murray
Polk
Haralson
Dade
Walker
Chattooga
Floyd
Catoosa
Carroll
Paulding
Union
Lumpkin
Douglas
Cobb
Pickens
Cherokee
Fannin
Gilmer
Dawson
DeKalb
Forsyth
Gwinnett
Henry
Rabun
Newton
Towns
Hall
White
Walton
Barrow
Jackson
Franklin
Madison
Hart
Elbert
Oconee
Morgan
Banks
Stephens
Clarke
Putnam
Greene
Oglethorpe
Baldwin
Hancock
LamarMonroe
Bibb
Jones
Butts Jasper
WilkinsonHarris
Muscogee
Talbot
Heard
Troup
Coweta
Meriwether
Fayette
Spalding
Pike
Upson
Taylor
Crawford
Peach
Houston
Twiggs
Bleckley
Pulaski
Sumter
Crisp
Schley
Macon
Dooly
Turner
Wilcox
Ben HillRandolph
Calhoun
Quitman
Stewart
Marion
Webster
Terrell
Dougherty
Lee
Worth
Tift
Colquitt
Seminole
Decatur
Early
Miller
Baker
Mitchell
Grady Thomas Brooks
Irwin
Cook
Dodge
Berrien
Lowndes
Laurens
Wilkes
Taliaferro
Johnson
Telfair
Washington
Warren
Coffee
Atkinson
Lanier
Lincoln
Wheeler
Echols
Jefferson
Clinch
Jeff Davis
Treutlen
Emanuel
Columbia
Toombs
Burke
Bacon
Ware
Richmond
Appling
Pierce
Candler
Tattnall
Jenkins
Charlton
Clayton
Whitfield
Fulton
Habers
ham
Glascock
Mon
tgom
ery
McDuffieCha
ttaho
oche
e
Clay
Rockd
ale
Legend
Total FGV
$0 - $20 million
$20 to $45 million
$200 to $515 million
$45 to $80 million
$80 to $200 million

2013 Georgia Farm Gate Value by Commodity Group Poultry-Egg
40.0%
Row-Forage crops 21.2%
Livestock 12.4%
Forestry 4.5%
Vegetables 7.30%
Ornamental Horticulture
4.1%
Fruits-Nuts 5.40%
Ag Tourism 1.00%
Other 4.1%
Primary data source: Center for Agribusiness & Economic Development, UGA
Total Farm Gate Value = $13.59 Billion

Prepared by: Dr. Kent Wolfe, Sharon P. Kane, Susan R. Boatright,
and Karen Stubbs Center for Agribusiness and Economic Development College of Agricultural and Environmental Sciences
The University of Georgia • Athens, GA Georgia Cooperative Extension
706-542-0760 • 706-542-8938 To learn more about your county, click on
“Georgia Statistics System” at our website: www.caed.uga.edu
This study was developed to assist community leadership with their future
planning and decision making.
Special Area Report April 2015