Georgia Medicaid and PeachCare for Kids · Georgia Medicaid and PeachCare for Kids® 1 Mission The...
43
0 Presentation to: 2013 Joint Study Committee on Medicaid Reform Presented by: Commissioner Clyde L. Reese III, Esq., Commissioner Jerry Dubberly, Chief Medicaid Division Date: August 28, 2013 Georgia Medicaid and PeachCare for Kids ®
Transcript of Georgia Medicaid and PeachCare for Kids · Georgia Medicaid and PeachCare for Kids® 1 Mission The...

0
Presentation to: 2013 Joint Study Committee on Medicaid Reform
Presented by: Commissioner Clyde L. Reese III, Esq., Commissioner
Jerry Dubberly, Chief Medicaid Division
Date: August 28, 2013
Georgia Medicaid and
PeachCare for Kids®
1
Mission The Georgia Department of Community Health
We will provide Georgians with access to
affordable, quality health care through
effective planning, purchasing and oversight.
We are dedicated to A Healthy Georgia.
2
Medicaid and PeachCare in Georgia
Topics for Discussion:
• Medicaid Trends
• Georgia Compared to Other States
• Historical Program Changes
• Affordable Care Act Impact
• Highlighted Current Projects
3
Medicaid Trends
4
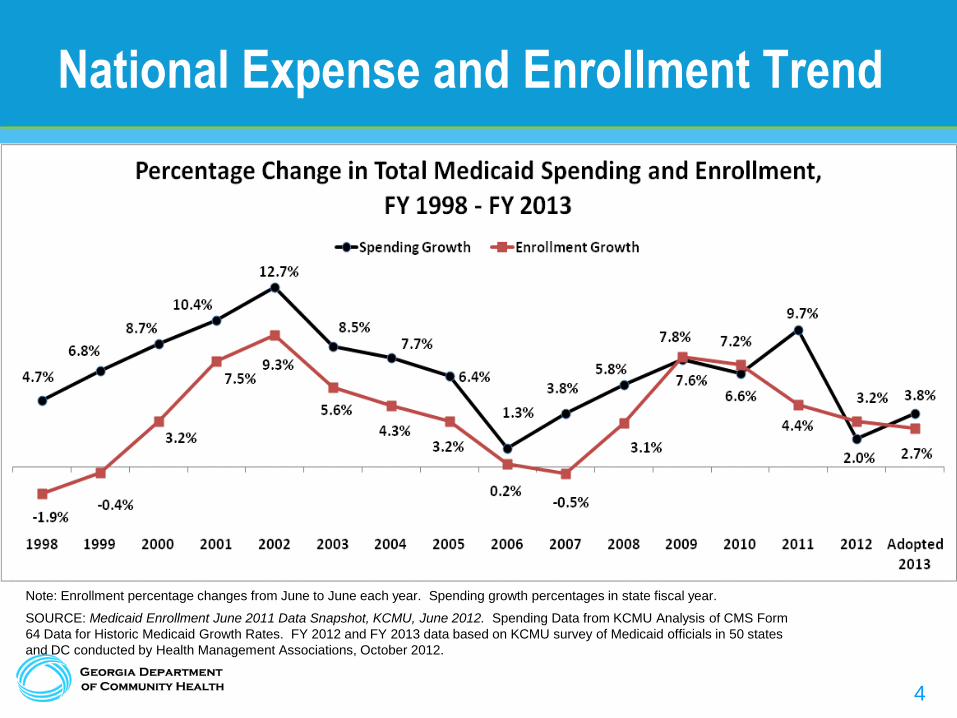
National Expense and Enrollment Trend
Note: Enrollment percentage changes from June to June each year. Spending growth percentages in state fiscal year.
SOURCE: Medicaid Enrollment June 2011 Data Snapshot, KCMU, June 2012. Spending Data from KCMU Analysis of CMS Form
64 Data for Historic Medicaid Growth Rates. FY 2012 and FY 2013 data based on KCMU survey of Medicaid officials in 50 states
and DC conducted by Health Management Associations, October 2012.

5 5
Medicaid Growth Trends – National View
1966 2000 2010 2020
Enrollees (millions) 4 34 54 85
% of Population 2% 12.5% 17.47% 26.1%
Total Cost (billions) $1.3 $206 $401 $871
% of GDP <1/2% 2.1% 2.7% 3.7%
6
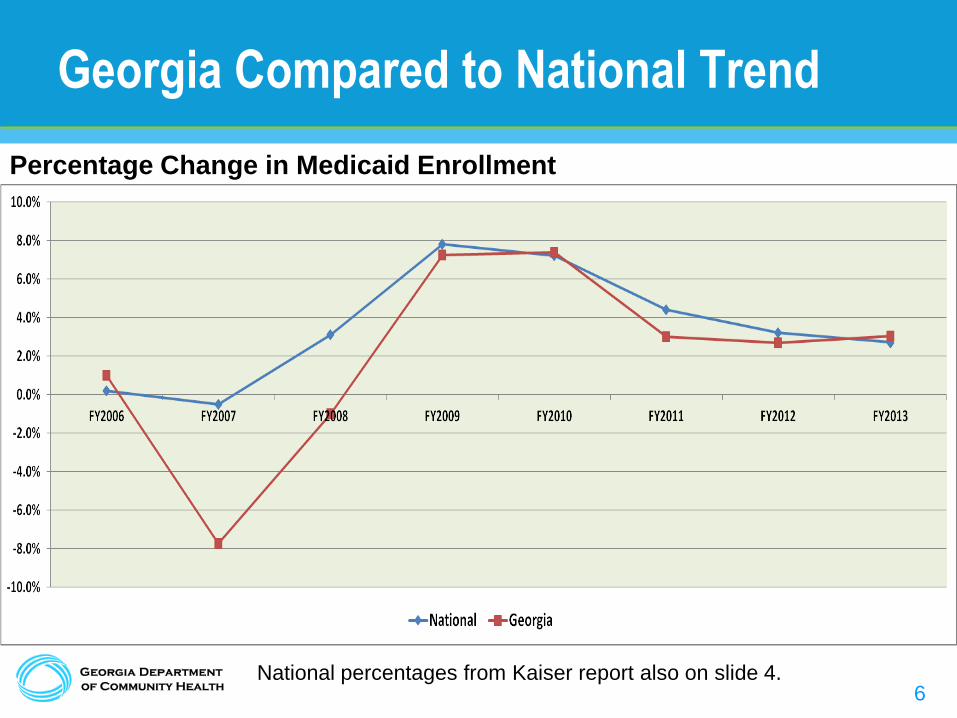
Georgia Compared to National Trend
Percentage Change in Medicaid Enrollment
National percentages from Kaiser report also on slide 4.
7
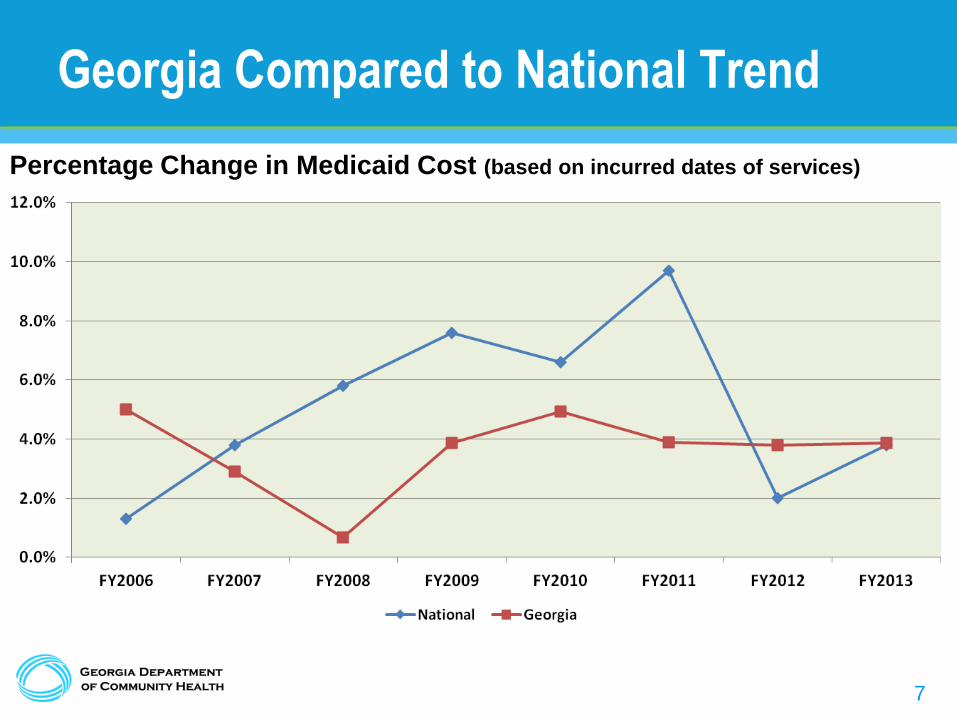
Georgia Compared to National Trend
Percentage Change in Medicaid Cost (based on incurred dates of services)
8
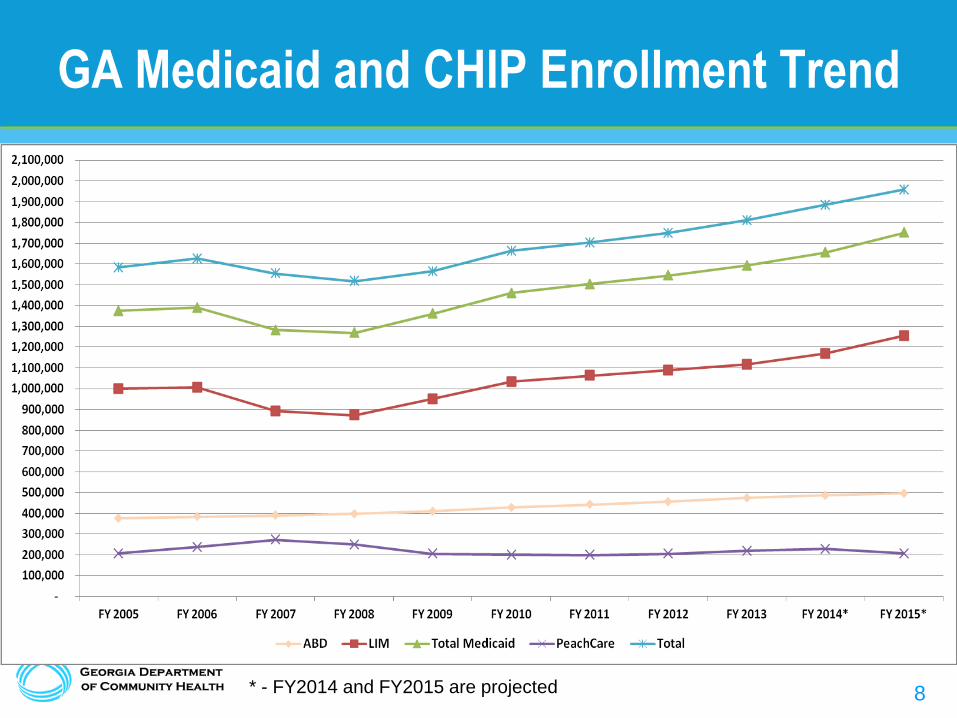
GA Medicaid and CHIP Enrollment Trend
* - FY2014 and FY2015 are projected
9
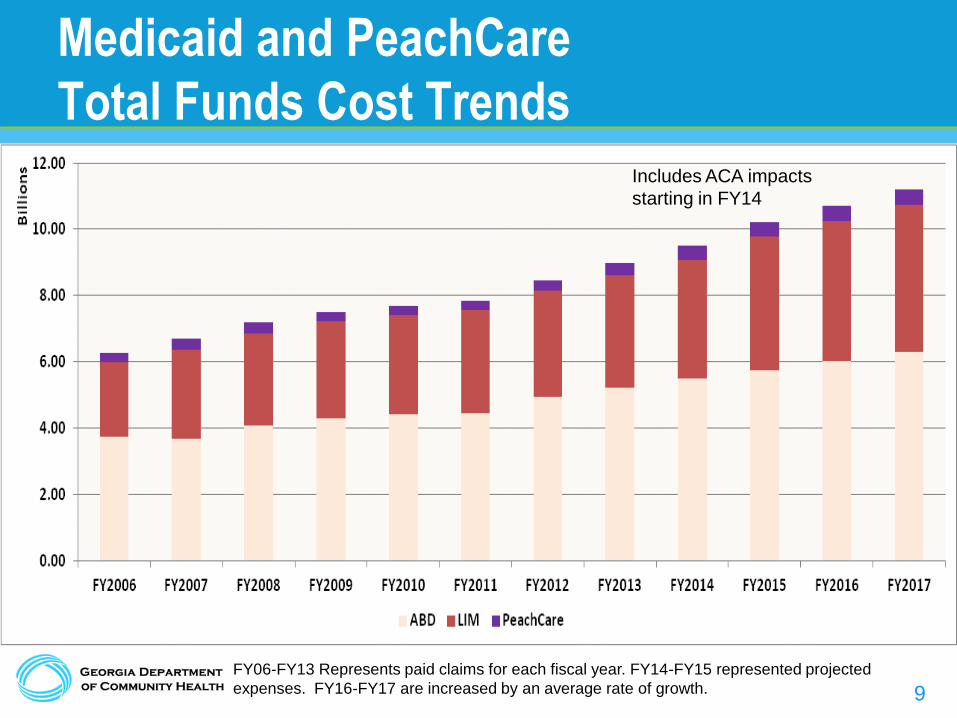
Medicaid and PeachCare
Total Funds Cost Trends
FY06-FY13 Represents paid claims for each fiscal year. FY14-FY15 represented projected
expenses. FY16-FY17 are increased by an average rate of growth.
Includes ACA impacts
starting in FY14

10
Medicaid and PeachCare
State Cost Trends
FY06-FY13 Represents paid claims for each fiscal year. FY14-FY15 represented projected
expenses. FY16-FY17 are increased by an average rate of growth.
Includes ACA impacts
starting in FY14
11
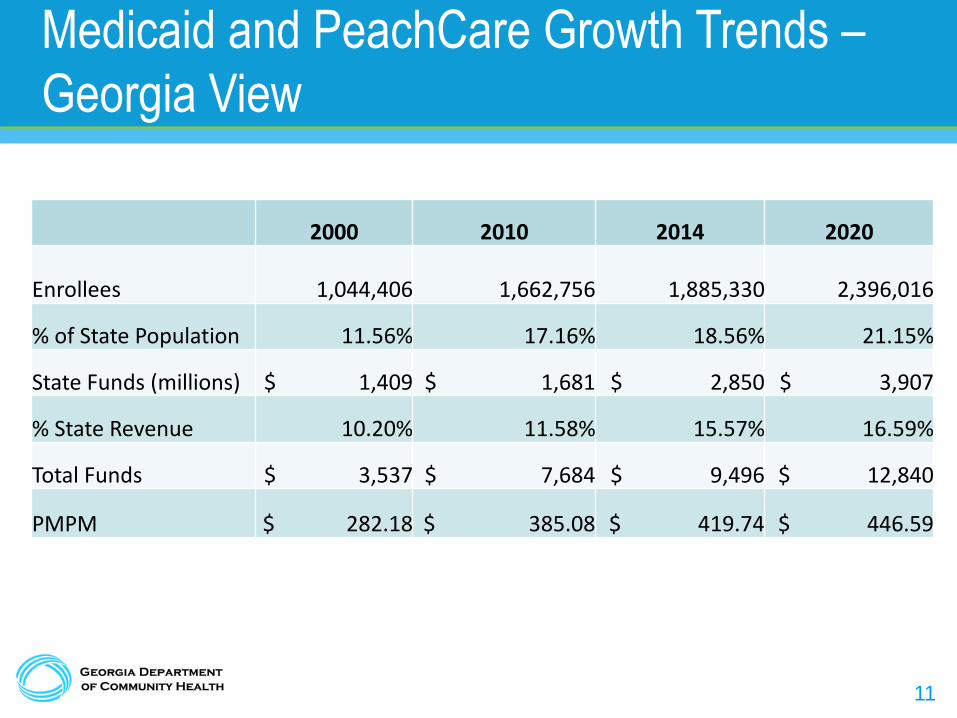
Medicaid and PeachCare Growth Trends –
Georgia View
2000 2010 2014 2020
Enrollees
1,044,406 1,662,756 1,885,330 2,396,016
% of State Population 11.56% 17.16% 18.56% 21.15%
State Funds (millions) $ 1,409 $ 1,681 $ 2,850 $ 3,907
% State Revenue 10.20% 11.58% 15.57% 16.59%
Total Funds $ 3,537 $ 7,684 $ 9,496 $ 12,840
PMPM $ 282.18 $ 385.08 $ 419.74 $ 446.59

12
Georgia Compared to
Other Southern States

13
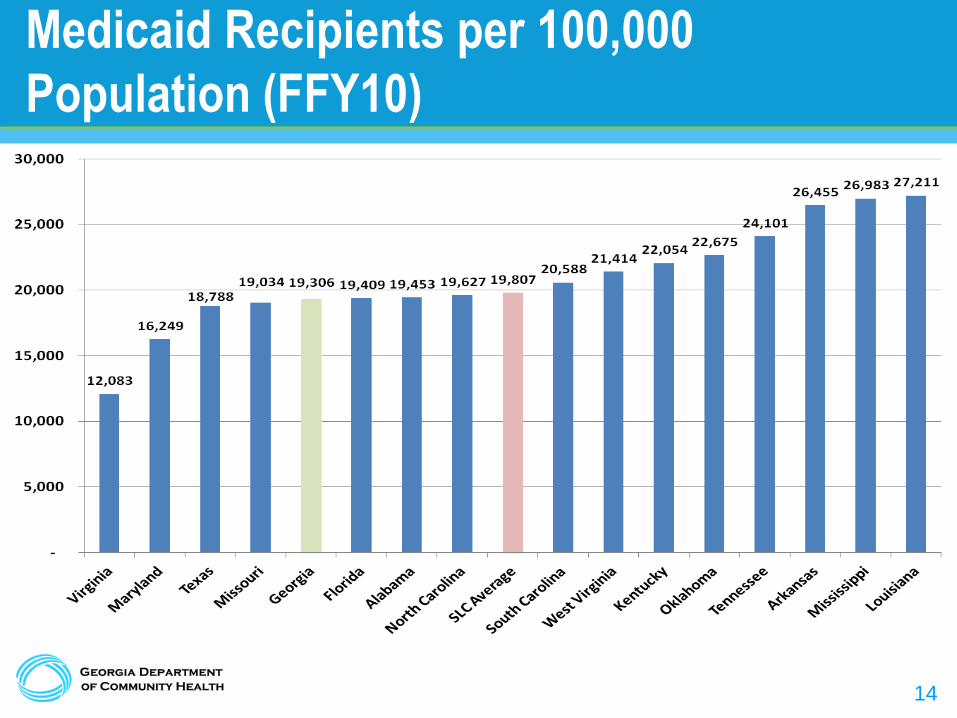
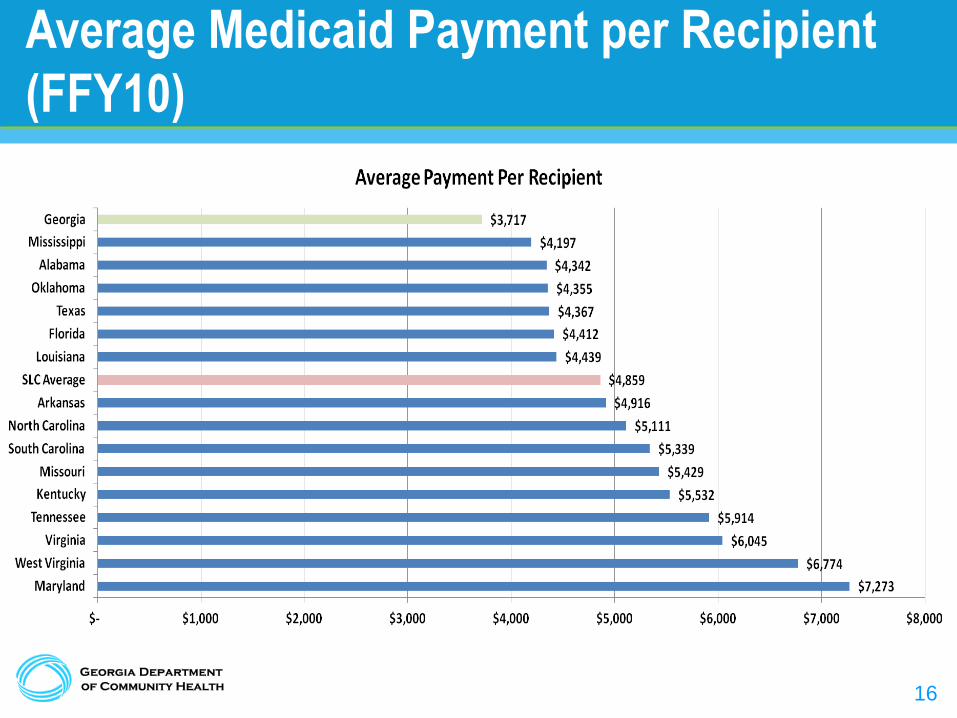
Georgia Comparison
• Comparison is based on information from the
Comparative Data Report on Medicaid 2010 from the
Southern Legislative Conference.
• Data is from Federal Fiscal Year 2010 and represents
only Medicaid.
• Southern Legislative Conference includes: Alabama,
Arkansas, Florida, Georgia, Kentucky, Louisiana,
Maryland, Mississippi, Missouri, North Carolina,
Oklahoma, South Carolina, Tennessee, Texas,
Virginia, and West Virginia.
14
Medicaid Recipients per 100,000
Population (FFY10)

15
Medicaid Expenditure per Capita (FFY10)
16
Average Medicaid Payment per Recipient
(FFY10)

17
Historical Program Changes

18
Managing Cost in Medicaid
• There are four main categories the State can use to
control Medicaid spending growth:
– Eligibility
– Scope of Benefits
– Utilization
– Price

19
Medicaid Cost Control Initiatives
FY 2004 - 2005
• Pharmacy Program Management
– Preferred Drug List
– Supplemental Rebates
– Quantity Limits
• Outpatient hospital reimbursement reduced
FY 2006
• Care Management Organizations Statewide capitated program for Low Income Medicaid and PeachCare for Kids - June 2006
• Disease Management for select Aged, Blind, and Disabled members
• Eligibility Criteria more stringently applied
– Emergency Medical Assistance
– Katie Beckett (FY 2005)
– Proof of Citizenship and Income
– Asset Transfer for Long Term Care
• Medicare Part D implementation
FY 2007 • Administrative Services for non-CMO members
– Level of Care Determination – Clinical Reviews – Fraud and Abuse
FY 2008 – FY 2010
• Review and Removal of duplicate Medicaid ID’s
• Focus on community-based long term care services to delay/avoid institutional care
• Medicaid Program Integrity
– Fraud and Abuse Detection
– False Claims Act
• Drug Company National Settlements
• CMO rates set at the low end of the actuarially sound rate range
• Transition to a PASRR provider delivery system versus a vendor delivery system
• Conversion to new MMIS resulting in further clean up of eligibility files and enhanced ability to control the medical benefit.
• Modifications to drug rebate program and dispute resolution process increase drug rebates
• Realignment of DME pricing methodology
• Hospital Provider Fee

20
Medicaid Cost Control Initiatives
FY2012 – Present
– Home and Community Based Services
– Eliminated payment for elective births prior to the 39th gestational week
– Reduced the number of narcotic prescriptions without prior authorization to 4 per month
– Eliminated reimbursement for preventable admissions and hospital acquired conditions
– Implemented the National Correct Coding Initiative (NCCI) procedure to procedure code edits
– Better enforcement of level of care qualifications analysis for long term care and home and community based services
– Moved from Consultation Codes to E&M Codes for Physician Services
– Tightened Level of Care enforcement for waiver programs
– Modified payment methodology for certain Medicare crossover payments
– Established a specialty pharmacy reimbursement rate

21
Affordable Care Act (ACA) Impact
22
Affordable Care Act Impact
• The items below represent required changes to Medicaid
even with Georgia opting out of the expansion:
1. Woodwork Effect
2. Federal Premium Tax
3. Transfer of kids aged 6-18 year old with a federal poverty level
of 100%-138% from PeachCare to Medicaid
4. Primary Care Physician provider rate increases to match
Medicare rates (January 1, 2013 – December 31, 2014)
5. Change from six month to twelve month eligibility reviews

23
Woodwork Effect
• DCH is planning on an additional 46,000 Georgians in FY14 and
65,000 in FY15 who meet current Georgia requirements for
Medicaid.
• These are members who have not been previously enrolled in the
program. DCH expects these members to qualify for Medicaid and
PeachCare for three reasons:
– Through the federal mandate on individuals required to have health coverage or
face a financial penalty,
– Use of the Exchange to identify additional Medicaid and PeachCare members,
– And the increase in advertising of ACA.
• State cost – for FY14 $14.3 million and $40.9 million in FY15
24
Federal Premium Tax
• Part of ACA funding mechanisms is a new federal premium tax on all managed care companies including those who provide Medicaid services.
• The tax is based on the total book of business not just the work in Medicaid.
• This new tax will increase the capitation rates paid to the three CMOS participating in the traditional Georgia Families program and the new Foster Care and Adoption Assistance managed care program.
• These additional tax funds are due annually in September.
• Estimated State Cost for FY15 = $29,300,000
25
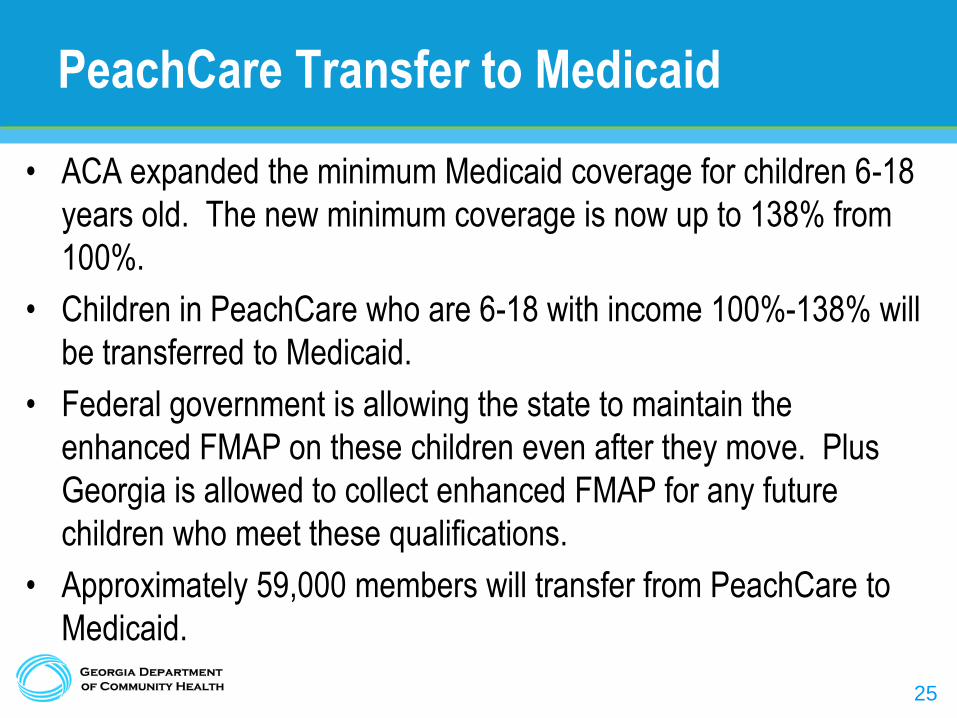
PeachCare Transfer to Medicaid
• ACA expanded the minimum Medicaid coverage for children 6-18
years old. The new minimum coverage is now up to 138% from
100%.
• Children in PeachCare who are 6-18 with income 100%-138% will
be transferred to Medicaid.
• Federal government is allowing the state to maintain the
enhanced FMAP on these children even after they move. Plus
Georgia is allowed to collect enhanced FMAP for any future
children who meet these qualifications.
• Approximately 59,000 members will transfer from PeachCare to
Medicaid.
26
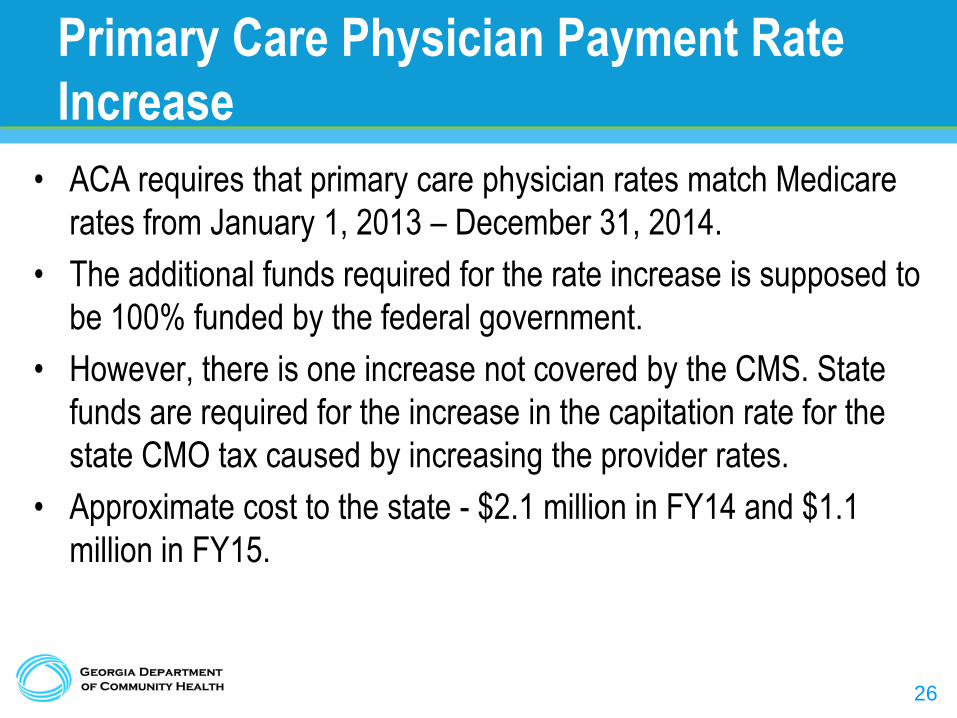
Primary Care Physician Payment Rate
Increase
• ACA requires that primary care physician rates match Medicare
rates from January 1, 2013 – December 31, 2014.
• The additional funds required for the rate increase is supposed to
be 100% funded by the federal government.
• However, there is one increase not covered by the CMS. State
funds are required for the increase in the capitation rate for the
state CMO tax caused by increasing the provider rates.
• Approximate cost to the state - $2.1 million in FY14 and $1.1
million in FY15.

27
Six to Twelve Month Eligibility Reviews
• ACA requires that eligibility for Medicaid recipients be reviewed
on a 12 month basis. Not to be confused with 12 month
continuous eligibility which is still not required.
• This requirement changes DCH’s current policy of eligibility
reviews every 6 months for adults and children in LIM. ABD
members are already reviewed every 12 months.
• This requirement begins January 1, 2014.
• State costs - $9.7 million in FY14 and $28.7 million in FY15
28
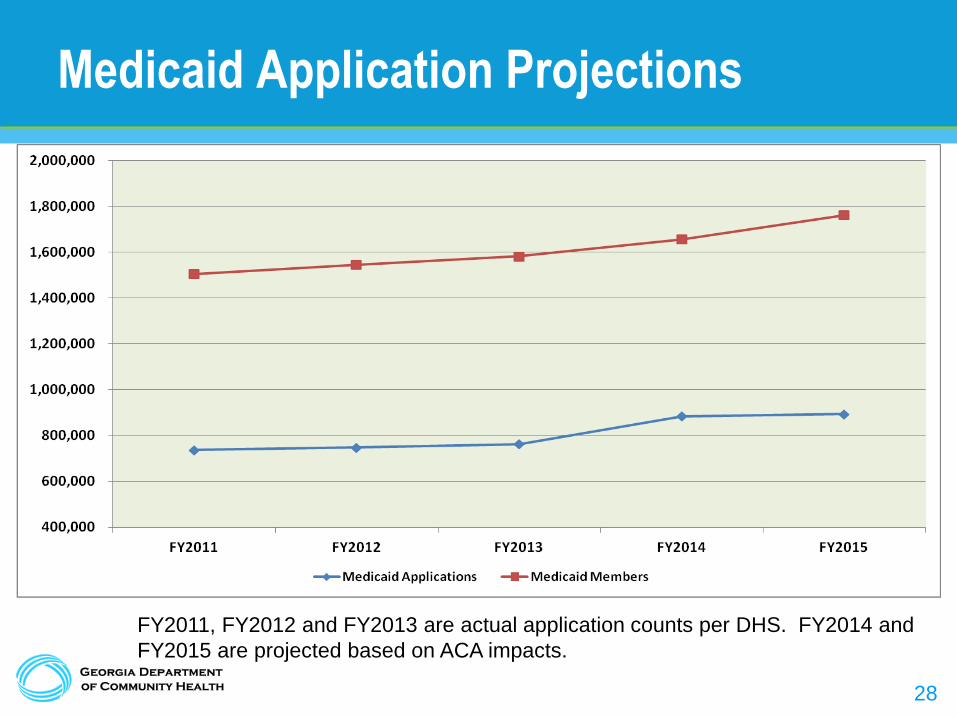
Medicaid Application Projections
FY2011, FY2012 and FY2013 are actual application counts per DHS. FY2014 and
FY2015 are projected based on ACA impacts.
29
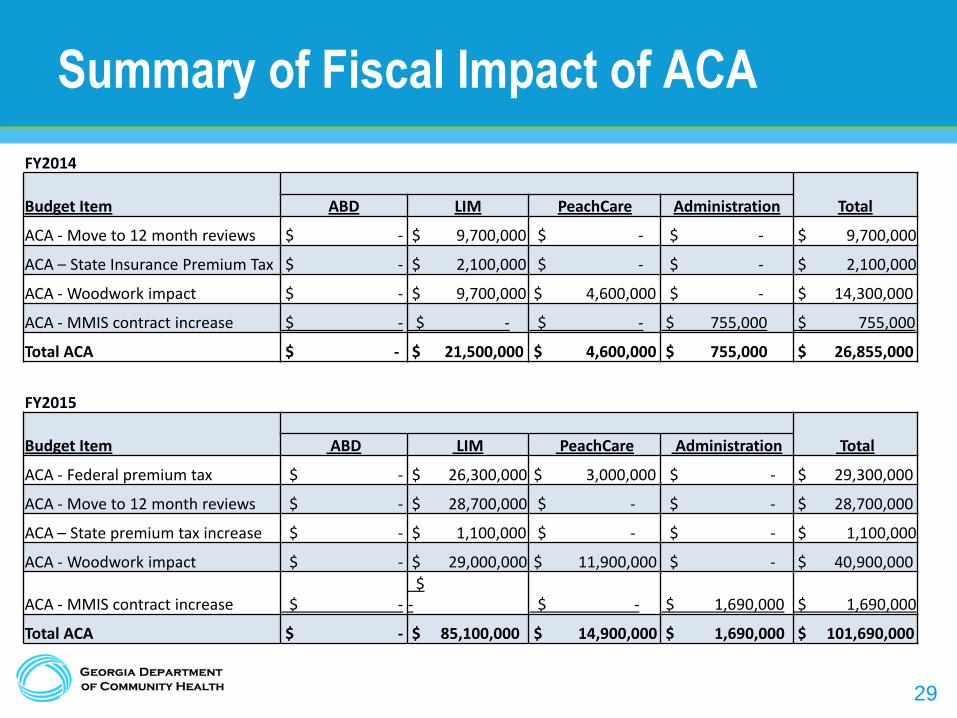
Summary of Fiscal Impact of ACA
FY2014
Budget Item
Total ABD LIM PeachCare Administration
ACA - Move to 12 month reviews $ - $ 9,700,000 $ - $ - $ 9,700,000
ACA – State Insurance Premium Tax $ - $ 2,100,000 $ - $ - $ 2,100,000
ACA - Woodwork impact $ - $ 9,700,000 $ 4,600,000 $ - $ 14,300,000
ACA - MMIS contract increase $ - $ - $ - $ 755,000 $ 755,000
Total ACA $ - $ 21,500,000 $ 4,600,000 $ 755,000 $ 26,855,000
FY2015
Budget Item
Total ABD LIM PeachCare Administration
ACA - Federal premium tax $ - $ 26,300,000 $ 3,000,000 $ - $ 29,300,000
ACA - Move to 12 month reviews $ - $ 28,700,000 $ - $ - $ 28,700,000
ACA – State premium tax increase $ - $ 1,100,000 $ - $ - $ 1,100,000
ACA - Woodwork impact $ - $ 29,000,000 $ 11,900,000 $ - $ 40,900,000
ACA - MMIS contract increase $ - $ - $ - $ 1,690,000 $ 1,690,000
Total ACA $ - $ 85,100,000 $ 14,900,000 $ 1,690,000 $ 101,690,000

30
Highlighted Current Projects

31
Foster Care and Adoption Assistance
• Transition ~27K Children to a single, state-wide CMO
• Targeted implementation: January 2014
• Develop a portable health record
• Improve medical oversight
• Better coordinated care
• Increase preventive screening rates
• Appropriate treatment of behavioral health conditions
• Enhance coordination across sister agencies

32
Multi-Agency/Partner Effort
Child
DFCS
DCH
DECAL
DPH
DBHDD
DJJ
DOE
Stakeholders

33
Aged, Blind and Disabled versus Low
Income Medicaid
0%
10%
20%
30%
40%
50%
60%
70%
80%
% of Medicaid Enrollment % of Medicaid Expenses
29%
58%
71%
42%
ABD LIM
34
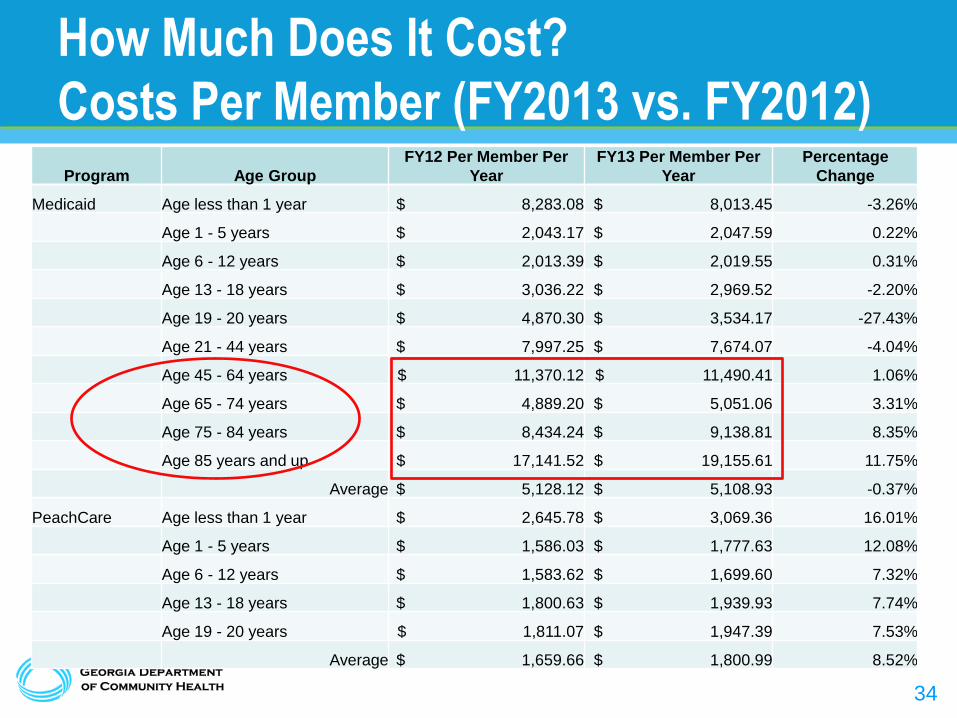
How Much Does It Cost?
Costs Per Member (FY2013 vs. FY2012) Program Age Group
FY12 Per Member Per
Year
FY13 Per Member Per
Year
Percentage
Change
Medicaid Age less than 1 year $ 8,283.08 $ 8,013.45 -3.26%
Age 1 - 5 years $ 2,043.17 $ 2,047.59 0.22%
Age 6 - 12 years $ 2,013.39 $ 2,019.55 0.31%
Age 13 - 18 years $ 3,036.22 $ 2,969.52 -2.20%
Age 19 - 20 years $ 4,870.30 $ 3,534.17 -27.43%
Age 21 - 44 years $ 7,997.25 $ 7,674.07 -4.04%
Age 45 - 64 years $ 11,370.12 $ 11,490.41 1.06%
Age 65 - 74 years $ 4,889.20 $ 5,051.06 3.31%
Age 75 - 84 years $ 8,434.24 $ 9,138.81 8.35%
Age 85 years and up $ 17,141.52 $ 19,155.61 11.75%
Average $ 5,128.12 $ 5,108.93 -0.37%
PeachCare Age less than 1 year $ 2,645.78 $ 3,069.36 16.01%
Age 1 - 5 years $ 1,586.03 $ 1,777.63 12.08%
Age 6 - 12 years $ 1,583.62 $ 1,699.60 7.32%
Age 13 - 18 years $ 1,800.63 $ 1,939.93 7.74%
Age 19 - 20 years $ 1,811.07 $ 1,947.39 7.53%
Average $ 1,659.66 $ 1,800.99 8.52%

35
ABD Care Coordination Model
What we heard from stakeholders:
• Segments of ABD population would significantly benefit from
intensive care management
• Use navigators to help members obtain timely needed services
• Use a person-centered model with a holistic view of an
individual’s needs
• Improve care coordination for Medicaid/Medicare dual eligibles
• Contractor monitoring and oversight must be DCH priority

36
ABD Approach
• Designing Care Coordination model for all ABD populations
• Features:
– Single statewide vendor
– Fee-for-Service environment
– Care coordination, case management, disease management
– Patient Centered Medical Home
– Primary Care Case Management Model
– Provider Engagement
– Value Based Purchasing
37
Integrated Eligibility System
(IES)
38
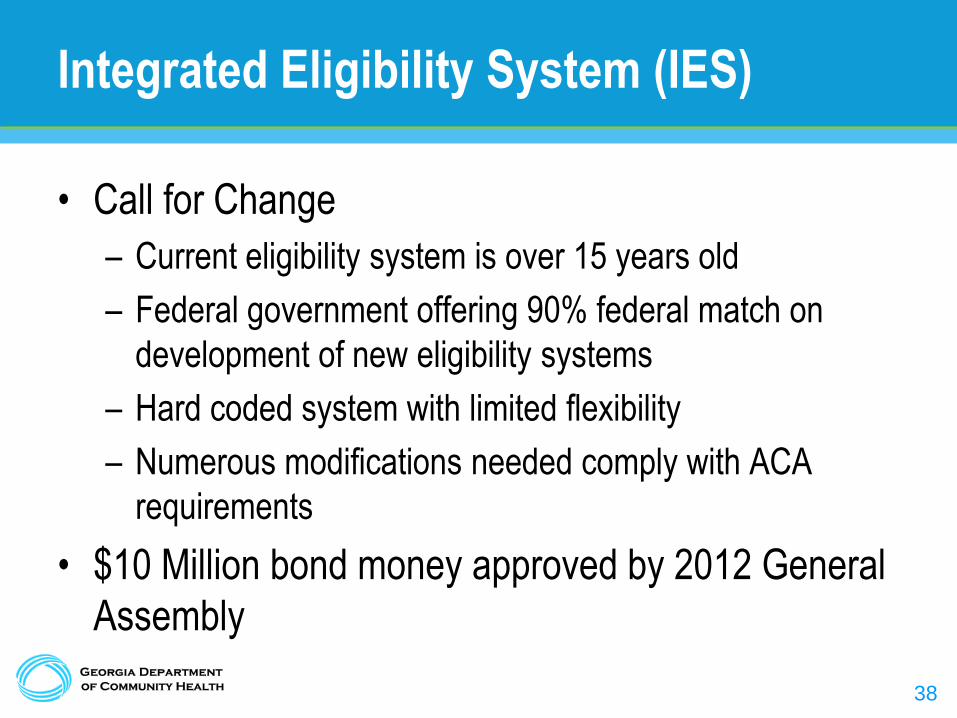
Integrated Eligibility System (IES)
• Call for Change
– Current eligibility system is over 15 years old
– Federal government offering 90% federal match on
development of new eligibility systems
– Hard coded system with limited flexibility
– Numerous modifications needed comply with ACA
requirements
• $10 Million bond money approved by 2012 General
Assembly
39
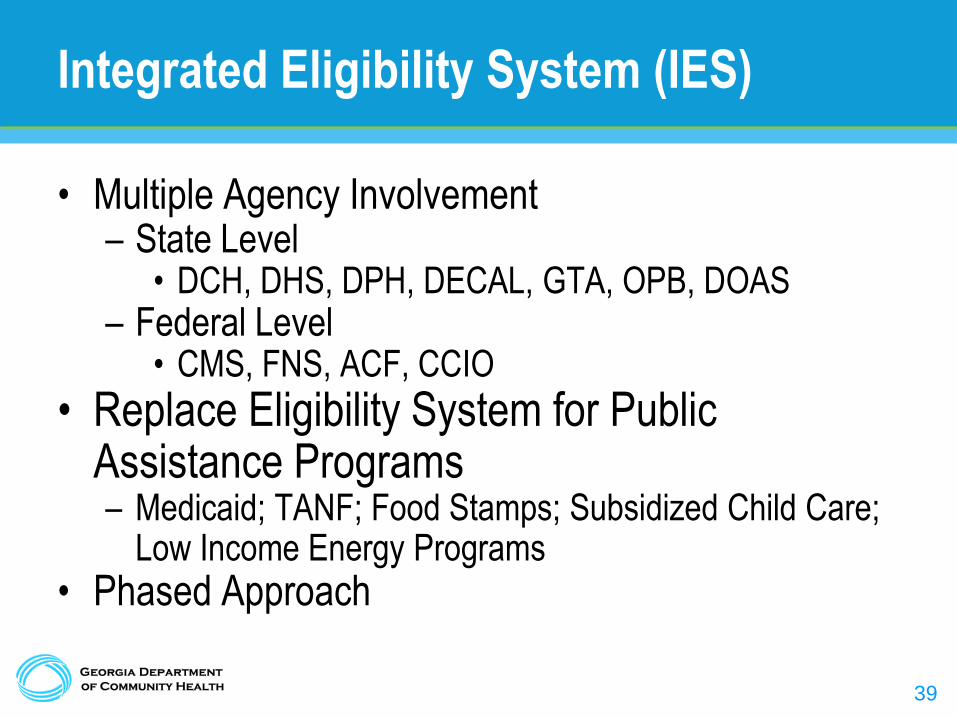
Integrated Eligibility System (IES)
• Multiple Agency Involvement – State Level
• DCH, DHS, DPH, DECAL, GTA, OPB, DOAS – Federal Level
• CMS, FNS, ACF, CCIO
• Replace Eligibility System for Public Assistance Programs – Medicaid; TANF; Food Stamps; Subsidized Child Care;
Low Income Energy Programs
• Phased Approach
40
Phased Approach
• IES implementation is in two phases:
– Phase 1 – compliance with Affordable Care Act
Medicaid Changes
– Phase 2 – full replacement of current Eligibility System
incorporating multi-agency programs

41
~

42
Questions & Answers