George Street ETRO Visitor Research Quarter 1 Findings September to November 2014 Key Findings...
35
George Street ETRO Visitor Research Quarter 1 Findings September to November 2014 Key Findings Presentation December 2014
-
Upload
shawn-glenn -
Category
Documents
-
view
213 -
download
0
Transcript of George Street ETRO Visitor Research Quarter 1 Findings September to November 2014 Key Findings...

George Street ETROVisitor Research
Quarter 1 Findings September to November 2014
Key Findings PresentationDecember 2014

What are we doing?
2
• To understand visitors to George Street:• Profile and reason for visit• Attitudes towards George Street generally• Their views on the ETRO changes specifically• Perceptions of the future of George Street
Aim
• 100 interviews completed each month• Interviews spread across days of the week (including weekends), times of the day
(including evenings) and across all 4 blocks of George Street• Respondents stopped on a ‘next to pass’ sampling methodology• Minimum target quotas set for New Town residents, cyclists and drivers
Survey
• 300 interviews carried out between September and November 2014
Output

Respondent profile (September – November, n=300)
3
New Town resident – 37 Cyclist – 33
Car driver (in city centre today) - 43
Male 43%
Female 57%
Respondent Gender
Yes 6%
No 94%
Disability
16-24 25-34 35-44 45-54 55-64 65-74 75+
11%
26% 26%
17%
11%
7%
2%
Respondent age

Home location of respondent
4
12%
47%
11%20%
9%1%
Location of home address
Base: Respondents Sept-Nov 14, n=300

Profile of visits
5

Almost half visit at least once per week
6
Daily/ most days
5-6 days a week
2-4 days a week
Weekly Fortnightly Monthly Less than once a month
5%
14% 16%13%
10%
15%
28%
Q1 On average, how often do you visit George Street?
Base: Respondents Sept-Nov 14, n=300
New town residents visit most frequently (92% at least once per
week)
Elsewhere in Scotland (72%)
and Outside Scotland (68%)

Browsing and dining are the main reasons for visiting George Street
7
Other
Sightseeing
Personal business (e.g. Bank / doctors)
Food shopping
Passing through
Drink in a café/bar/restaurant
Work related
Non-food shopping
Meet friends / family
Dine/eat in a restaurant/bar
Browsing / window shopping
1%
4%
4%
4%
4%
17%
18%
20%
25%
33%
38%
Q3 What is the purpose of your visit to George Street today?
Base: Respondents Sept-Nov 14, n=300

Almost two thirds of visitors stay between 1 and 5 hours
8
I am just passing
through
Up to an hour
1 - 3 hours 3-5 hours 5-7 hours 8+ hours Don’t know
11% 9%
37%
24%
13%
2% 4%
Q4 How long do you intend to spend in George Street today?
Base: Respondents Sept-Nov 14, n=300
Browsing/ window shopping (49%)
Dining in bar/ restaur-ant (68%)Meet friends/family (47%)

Visitors most likely to travel by train or foot
9
Train Foot Bus Car / light vehicle
Bicycle Tram Taxi
28%26%
17%14%
11%
3%1%
Q5 What was the main form of transport you used to get to George Street today?
Base: Respondents Sept-Nov 14, n=300
Parking mainly on George Street (33%), St James Centre (23%) and
Charlotte Square (21%)

Perceptions and Experience of George Street
10

Feeling of safety and Quality/ range of businesses most likely to be very important
11
Amount of parking available
Ease of parking
The ability to be/ sit outside i.e. ‘café culture’
Accessibility and ease of movement for buggies/ prams
Clarity of segregation between cycle and pedestrian areas
Cleanliness
How easy it is to walk about on George Street
Feeling of safety
19%19%20%20%
54%57%59%
64%66%
69%71%
73%73%
78%78%
Q6 When thinking about your decision to come to George Street today, how important were the following?
% very important (excl DK)

What is important varies for different groups
Amount of parking available• 19% VI overall• 67% VI for drivers
Ease of parking• 20% VI overall• 74% VI for drivers
Ease of cycling on George Street• 19% VI overall• 75% VI for cyclists
Availability of bike parking• 20% VI overall• 70% VI for cyclists
Clarity of segregation between cycle and pedestrian areas• 66% VI overall• 95% VI for cyclists• 46% VI for those who came on foot
Accessibility and ease of movement for people with disabilities/ mobility problems• 64% VI overall• 78% VI those with a disability
12

Overall appearance, cleanliness and quality of businesses most highly rated
13
Amount of parking available
Accessibility and ease of movement for people with disabilities/ mobility problems
How easy it is to walk about on George Street
Ease of access to shops/ businesses
The ability to be/ sit outside i.e. ‘café culture’
Availability of bike parking facilities
Quality/ range of shops/ businesses available
Overall appearance/ attractiveness
35%36%
59%61%
64%67%67%68%68%70%70%70%
78%81%83%
Q7 Can you now tell me how good or poor you think of each of these are in George Street?
% very good (excl DK)

How visitors rate aspects also varies
Amount of parking available• 35% VG overall• 13% VG for drivers
Ease of parking• 36% VG overall• 13% VG for drivers
Ease of cycling on George Street• 67% VG overall• 34% VG for cyclists
Availability of bike parking• 70% VG overall• 41% VG for cyclists
Clarity of segregation between cycle and pedestrian areas• 68% VG overall• 55% VG for cyclists• 54% VG for those who came on foot
Accessibility and ease of movement for people with disabilities/ mobility problems• 59% VG overall• 62% VG those with a disability
14

GAP Analysis of George Street
Priority for action
Ease of walking about
Feeling of safety
Ease of access to shops/ businessesAccessibility and ease of movement for people with disabilities
Consider for action
Clarity of segregation between cycle and pedestrian areas (cyclists)Availability of bike parking facilities (cyclists)
Ease of cycling (cyclists)
Amount of parking available (drivers)
Ease of parking (drivers)
Maintain
Overall appearance/ attractiveness
Ability to be/ sit outside
Cleanliness
15

Cyclist Experience
16

Cyclists tend to cycle in George Street regularly – 87% at least once per week
17
Daily 4 - 6 times pw
2- 3 times pw
Once pw Fortnightly Every 2 - 3 months
First time
3%
39%
24%21%
3%6%
3%
Q8 On average, how often do you cycle in George Street?
Base: Cyclists Sept-Nov 14, n=33
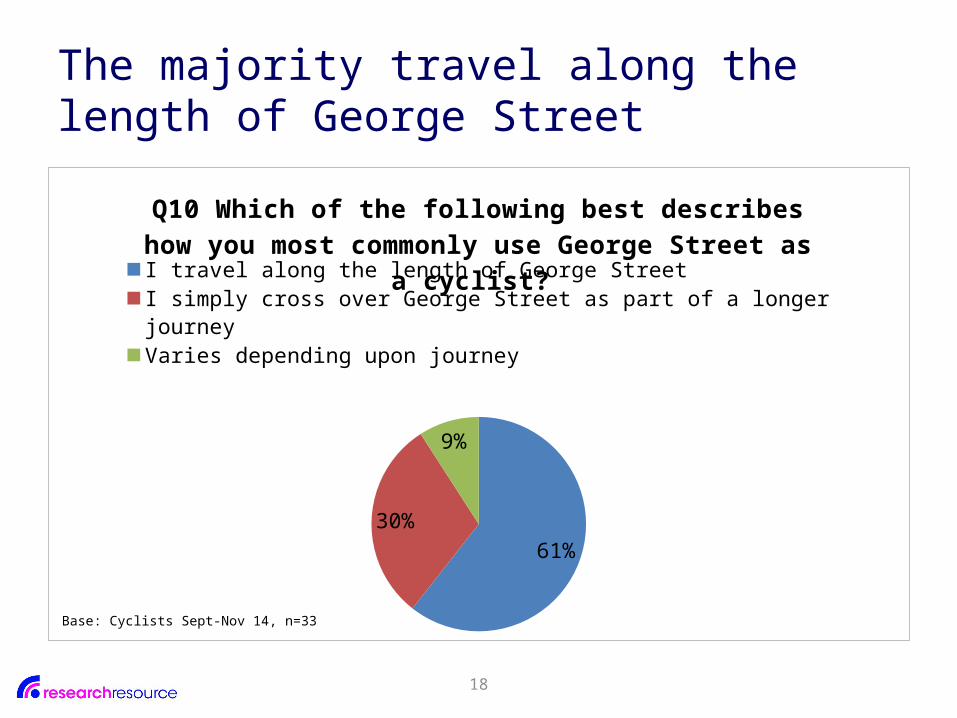
The majority travel along the length of George Street
18
61%
30%
9%
Q10 Which of the following best describes how you most commonly use George Street as a cyclist?
I travel along the length of George Street
I simply cross over George Street as part of a longer journey
Varies depending upon journey
Base: Cyclists Sept-Nov 14, n=33

Just over one quarter now cycle more
19
27%
73%
Q9 Has this changed since the introduction of cycle lanes?
Yes, I now cycle more Yes, I now cycle less It has not changed
Base: Cyclists Sept-Nov 14, n=33

20
Clarity of segregation of cycle and parking areas
Feeling of safety when cycling along George Street - ie interaction with pedestrians and cafes during the length of each block & with traffic & people at junctions
Safety of the 2 way cycle lane
Feeling of safety at junctions/ intersections along George Street
Feeling of safety at the change from one side of the street to another (at Frederick Street) for the 2 way cycle lane
Clarity for cyclists at junctions/ intersections along George Street
Clarity for cyclists of the change from one side of the street to another (at Frederick Street) for the 2 way cycle lane
13
10
8
8
8
8
8
15
15
17
17
16
15
15
1
2
3
5
6
4
7
1
5
4
3
3
6
3
2
1
Q11 How good or poor are the following for cyclists in George Street?
Very good Good Neither / nor Poor Very Poor
Base: cyclists, n=33

Cyclist comments
Lanes are not big enough, pedestrians keep walking
on them. Having to change sides is silly, hasn't been thought through enough.
Pedestrians stray to cycle lanes, oblivious of our
presence. Have had several near misses
Regular cyclists can follow the signs with ease but I don't know about novice cyclists - I think it may be
difficult for them changing from one side of the street to
the other.
Roads are improving everywhere for cyclists and Edinburgh as a whole have
great improvements.
Not sure how to access from Charlotte Square, this
can be confusing
Cycle lanes are welcome and I think they've done a good job to accommodate
everybody.
21

Suggestions for improvement
Make it on both sides and pedestrianise whole area.
Stop pedestrians moving into cycle lanes by
keeping separate e.g. barriers.
Signs stating rules for cycle lanes. Cycle lane all on one side. Keep lanes
clean.
More signage and cycle lane all on one side
No, I think they've done the best they can.
22

Perceptions of Change in George Street
23

The majority think George Street’s appearance has improved
24
Improved Stayed the Same Got worse Don’t know
74%
7%2%
17%
Do you think the overall appearance of George Street has improved or worsened since the changes or is it no
different?
Base: Respondents Sept-Nov 14, n=300

Respondents gave a range of reasons for perception of improvement
Q14 If improved, why do you say this is the case? No of comments
Area looking nicer/ more attractive 91Relaxed atmosphere 39More space to walk/ cycle 38More people/ more of a buzz 33Not as much traffic/ less congestion 22Great facilities available e.g. shopping/ restaurants/ bars 20Cosmopolitan atmosphere/ cultured 16Like being able to sit outside 16Can cycle safely/ easier to cycle/ good cycle lanes 13Like the information boards 12Less fumes/ pollution/ cleaner 8Looks cleaner/ tidier 7 More families/ more child friendly 4Traffic noise reduced 3Due to the one way traffic system 2
25

Just 7 respondents felt the overall appearance had worsened
Total nightmare for drivers, as well as trams
takes longer to get anywhere. Although, area
does look nicer.
Not as much parking, nightmare to drive to.
Parking/ driving is difficult and longer to get
there. Not enough parking facilities.
I like to park in George Street because I'm staying close by and if
you park after a certain time at night, you can stay there to a
Sunday. It influences my decision of where to stay and where to come when I'm in Edinburgh.
Parking is worse - far too expensive. Really should reduce the costs or have day passes for visitors.
Not enough parking - makes journey longer and
more stressful.
Traffic disruptions.
26

The vast majority of respondents feel that the changes have met their objectives
27
The area is more attractive
An improved pedestrian experience
An improved experience for cyclists
Encourages people to walk more
Encourages people to cycle more
Encourages people to spend more time in George Street
87%
79%
37%
67%
28%
69%
2%
4%
3%
3%
4%
3%
11%
17%
60%
31%
68%
27%
Q15 Do you think the changes to George Street have achieved any of the following?
Yes No Don't know
73% for cyclists
70% for cyclists

94% of visitors say they are at least as likely to visit George Street (32% more likely)
28
More likely Makes no difference Less likely Don’t know
32%
62%
2% 4%
Q16 Do you think the changes to George Street make you more or less likely to visit or does it make no dif-
ference?
Base: Respondents Sept-Nov 14, n=300
New town (46%) and Edinburgh (44%) residents
and cyclists (55%) most likely

Almost three quarters of respondents felt their trip was more enjoyable as a result
29
More enjoyable Makes no difference Less enjoyable Don’t know
72%
24%
1% 3%
Q17 Do you think the changes to George Street have made your visit today more or less enjoyable or has it
made no difference?
Base: Respondents Sept-Nov 14, n=300

The future of George Street
30
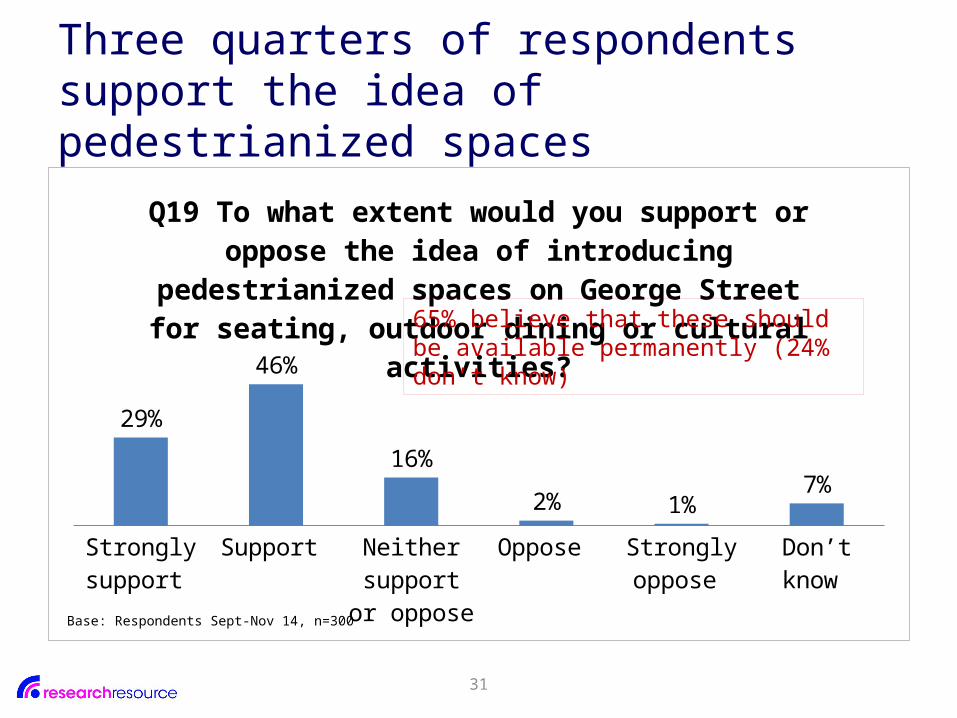
Three quarters of respondents support the idea of pedestrianized spaces
31
Strongly support
Support Neither support or
oppose
Oppose Strongly oppose
Don’t know
29%
46%
16%
2% 1%7%
Q19 To what extent would you support or oppose the idea of introducing pedestrianized spaces on George
Street for seating, outdoor dining or cultural activities?
Base: Respondents Sept-Nov 14, n=300
65% believe that these should be available permanently (24% don’t know)

Car drivers much more likely to feel it is important that car parking continues to be available on George Street
32
19% 23%15%
9%4%
30%
65%
23%
2% 0% 0%9%
Q21 How important do you think it is that car parking con-tinues to be available on George Street?
All respondents (n=300) Car drivers (n=43)

Car drivers preference is that parking remains as it is
33
Car parking should stay as it is just now
Don't know/ no opinion
Car parking should be reduced with replacement provided on Castle St and Frederick St nearby
Car parking should be removed with replacement parking provided on Castle St and Frederick St nearby
Car parking on George Street should be reduced with no replacement parking provided
Car parking on George Street should be removed with no replacement parking provided
43%
37%
11%
6%
3%
1%
69%
15%
12%
4%
0%
0%
Q22 Thinking about parking in more detail, which of the following comes closest to describing your view?
Car drivers (n=26) All responents (n=300)

Suggestions for improvement 67% had no suggestions for improvement Of those that did, the most common comments were:
34
Make changes permanent/ maintain the changes (30%)
More street entertainment e.g. street artists/ stalls
(15%)
Keep clean/ clear up litter
(10%)
Improve landscaping e.g. trees/ flowers
(4%)
More seating areas (3%)
More cafes selling coffee/
cakes (5%)
More/ affordable
parking (12%)
Ban cars altogether/ pedestrian area
only (13%)
Cycle lane changes e.g. both sides or down centre
(6%)
Base: number of respondents who made comment, n=101

Any questions?
35