
GeoPlace - Cost Benefit Analysis Address Data
47
Cost Benefit Analysis of Address and Street Data for Local Authorities and Emergency Services in England and Wales Final Report Prepared by: Andrew Coote Director ConsultingWhere Ltd Version: 1.0 Dated: 23/05/2016
Transcript of GeoPlace - Cost Benefit Analysis Address Data
Cost Benefit Analysis of Address and
Street Data for Local Authorities and
Emergency Services in England and Wales
Final Report
Prepared by: Andrew Coote
Director
ConsultingWhere Ltd
Version: 1.0
Dated: 23/05/2016

GeoPlace - Cost Benefit Analysis Address Data
i
Disclaimer Statement
This document contains information of a commercially sensitive nature such that any
unauthorised disclosure may harm or prejudice the commercial interests or provide knowledge
of an advantage to competitors of ConsultingWhere Ltd and ACIL Allen. This document may
contain personal data that is protected by Data Protection legislation. This document has been
prepared by ConsultingWhere Limited exclusively for the benefit of GeoPlace and is not to be
relied upon by any third party to whom its content may be disclosed in whole or in part.
ConsultingWhere Limited disclaims any and all responsibility or liability to such third parties.
In conducting the analysis in this report ConsultingWhere and ACIL Allen have endeavoured to
use what they consider is the best information available at the date of publication, including
information supplied by GeoPlace. ConsultingWhere and ACIL Allen do not warrant the accuracy
of any forecast or prediction in the report. Although ConsultingWhere and ACIL Allen exercise
reasonable care when making forecasts or predictions, factors in the process, such as future
market behaviour, are inherently uncertain and cannot be forecast or predicted reliably.
Specifically, ConsultingWhere and ACIL Allen shall not be liable in respect of any claim arising
out of the failure of an investment to perform to the advantage of the client or to the advantage
of the client to the degree suggested or assumed in any advice or forecast given by
ConsultingWhere and ACIL Allen.
Document history
Version Date History Author
V1.0 23/05/2016 Final (following QA) AMC, LR,EW
ConsultingWhere Ltd
Heath End
The Common
Chipperfield
Kings Langley
WD4 9BL
Telephone: +44 (0)1923 291000
e-mail: [email protected]

Introduction
ii
web: www.consultingwhere.com
© ConsultingWhere Ltd 2016.

GeoPlace - Cost Benefit Analysis Address Data
iii
Contents
Executive Summary
1 Introduction ...................................................................................................... 2
1.1 The Purpose ......................................................................................................... 2
1.2 Scope ................................................................................................................... 2
1.3 Cost benefit analysis ............................................................................................ 2
2 Study methodology ........................................................................................... 4
2.1 Approach ............................................................................................................. 4
2.2 Literature review ................................................................................................. 4
2.3 Compilation of a database of existing case studies ................................................ 4
2.4 Questionnaire ...................................................................................................... 5
2.5 Training course .................................................................................................... 5
2.6 Interviews ............................................................................................................ 5
2.7 Construction of the CBA Model ............................................................................. 6
2.7.1 Principles ............................................................................................................... 6
2.7.2 Process .................................................................................................................. 6
2.8 Validation Workshop............................................................................................ 7
2.9 Economist Review ................................................................................................ 7
2.10 Final Report ......................................................................................................... 7
3 Literature Review .............................................................................................. 8
3.1 Economics ............................................................................................................ 8
3.1.1 Value of Information principles ............................................................................ 8
3.1.2 Public Information Value (European Union POPSIS study), .................................. 9
3.2 Previous Studies ................................................................................................... 9
3.2.1 CEBR Report .......................................................................................................... 9
3.2.2 LGA Economic Value Study (2010) ...................................................................... 10
3.3 International comparative studies ...................................................................... 10
3.3.1 Australia: National Address Management Framework (NAMF) ....................... 10
3.3.2 Denmark: the value of address data ................................................................... 13
4 Key Findings .................................................................................................... 17
4.1 External factors .................................................................................................. 17
4.1.1 Political ................................................................................................................ 17
4.1.2 Economic ............................................................................................................. 17
4.1.3 Social ................................................................................................................... 17
4.1.4 Technology .......................................................................................................... 18
4.1.5 Legislative ............................................................................................................ 18
4.1.6 Environment ........................................................................................................ 18
4.2 Internal factors .................................................................................................. 19
4.3 Key current government policy initiatives ........................................................... 19
4.4 Value survey (questionnaire) results ................................................................... 20
4.4.1 Respondents ........................................................................................................ 21
4.4.2 Most important users.......................................................................................... 21
Introduction
iv
4.4.3 Benefits assessment ............................................................................................ 23
4.4.4 Costs .................................................................................................................... 24
4.4.5 Barriers to entry .................................................................................................. 24
4.5 State of the market analysis by business function ............................................... 25
4.5.1 Planning and development ................................................................................. 25
4.5.2 Highways and transport ...................................................................................... 25
4.5.3 Revenue and benefits ......................................................................................... 25
4.5.4 Corporate services .............................................................................................. 25
4.5.5 Social services...................................................................................................... 26
4.5.6 Street scene ......................................................................................................... 26
4.5.7 Property services ................................................................................................. 26
4.5.8 Environmental services ....................................................................................... 26
4.5.9 Customer services ............................................................................................... 26
4.5.10 Waste management ............................................................................................ 26
4.5.11 Public safety ........................................................................................................ 27
4.5.12 Education ............................................................................................................ 27
4.5.13 Electoral management ........................................................................................ 27
4.5.14 Public health ........................................................................................................ 27
4.5.15 Emergency services ............................................................................................. 28
5 GeoPlace cost benefit analysis ......................................................................... 29
5.1 Quantification approach ..................................................................................... 29
5.2 Costs summary ................................................................................................... 29
5.3 Quantified use cases .......................................................................................... 30
5.4 Data sharing and integration savings .................................................................. 30
5.5 Regression analysis example: council tax ............................................................ 30
5.6 Emerging use cases: not quantified ..................................................................... 31
5.6.1 Social services example: Troubled Families ........................................................ 32
5.6.2 Education example: London Grid for Learning ................................................... 32
5.6.3 National Fraud Initiative ...................................................................................... 33
6 Cost Benefit Analysis results ............................................................................ 34
6.1.1 Base Case ............................................................................................................. 34
6.1.2 Sensitivity analysis ............................................................................................... 35
6.2 Validation: LGA Study 2010 ................................................................................ 36
6.2.1 Denmark .............................................................................................................. 36
6.2.2 Australia .............................................................................................................. 36
6.2.3 England and Wales: Geospatial Value Study ....................................................... 36
6.3 Limitations of the financial analysis .................................................................... 37
6.4 Economist review ............................................................................................... 37
6.5 Benefits realisation ............................................................................................ 38
7 Barriers to adoption ........................................................................................ 39
7.1 Survey Analysis .................................................................................................. 39
7.2 Analysis ............................................................................................................. 40

Introduction
v
8 Conclusions and recommendations ................................................................. 41

GeoPlace - Cost Benefit Analysis Address Data
1
Executive Summary
Government investment in the Local Land and Property Gazetteers (LLPG) and Local Street
Gazetteers (LSG) over the period 2010-5 has yielded a net benefit of approximately £86m in
savings from reduced data duplication and integration, improved tax revenues, channel shift
and route optimisation in waste management.
Future net benefits from the same applications are likely to be in the region of £200m over the
next 5 years. Based on the current rates of adoption, this represents a Return on Investment
(RoI) or cost benefit ratio after discounting of 4:1.
The return could be significantly higher if barriers to adoption, particularly access to funds, staff
retention and improved national collaboration are addressed. We estimate this could be worth
additional benefits of £20m over the next 5 years.
National collaboration initiatives with potential to emulate the Department for Communities
and Local Government (DCLG) waste partnership include shared gazetteer maintenance
services, enhanced analysis for education, social services, public health and emergency services.

Introduction
2
1 Introduction
1.1 The Purpose
The purpose of this research study is to provide a cost benefit evaluation of the impact of
address and street data that GeoPlace collates across England and Wales1.
This study is timely since the last study of its kind by the Centre for Economics and Business
Research (CEBR)2 is now a decade old and the applications of address and street data has
expanded significantly in that time, both internally within local authorities and externally.
Furthermore, there is now an opportunity to establish the extent of the benefits that have been
realised since the National Address Gazetteer and the National Street Gazetteer for England and
Wales were introduced, rather than being a prediction for the future. This is what economists
refer to as an “ex-post” study i.e. after the event, rather than “ex-ante” predictions. As such they
are much more powerful in terms of use for advocacy and more general marketing. The forward
predictions (to 2020) are also given more credence by extrapolating from a strong base of
historical information.
1.2 Scope
The study examines the financial costs and benefits of address and street data for local
authorities in England and Wales that create the data and use it. The analysis also assessed the
benefits to local authorities in their work with emergency services.
Costs are included where they relate directly to the use cases used to calculate the benefits.
They do not represent the total costs of running GeoPlace.
1.3 Cost benefit analysis
Cost benefit analysis (CBA) is the most appropriate technique for deriving an estimate of Return
on Investment (RoI) which can be expressed as “for each £1 Invested the return is £xx” (in
accordance with the GeoPlace Project Brief). Treasury Green Book3 advice is that CBA is the most
robust approach for projects where results are as real and tangible, as is the case here.
CBA attempts to collate all of the costs and the quantifiable benefits, adjusted for the time value
of money i.e. returns achieved at some future date are discounted to take into account the
opportunity cost of having made an alternative investment.
1 See GeoPlace project brief. 2 CEBR, ‘“It makes life easier…”A study to evaluate the benefit of the local and national land and property gazetteer, final report’, 2006. Available at: https://www.geoplace.co.uk 3 HM Treasury, ‘The Green Book: Appraisal and Evaluation in Central Government’, 2003 (updated 2011)
Available at:
https://www.gov.uk/government/uploads/system/uploads/attachment_data/file/220541/green_book_
complete.pdf

Introduction
3
The CBA is expressed in financial terms. However, associated qualitative benefits discovered
during the study are also reported under the section entitled non-financial benefits. These
qualitative benefits, although difficult to express in financial terms, may be politically, socially or
environmentally significant.
We have developed a structured segmentation of benefit types that recognises a number of
generic sources, as illustrated below.
Figure 1: Benefit sources
Our analysts use real world examples of each of these types of benefits to help organisations
think through what type of benefits they have, or will, realise.
Outputs
Raise
Revenues
Meet
Legis-
lation Standards
conform-
ance
Increase
satisfaction
Improve
Quality
Lower
Costs
Increase
Productivity
Increase
Capacity Decrease
Risk
Increase
efficiency
Financial
Production
Process improvement
Customer
Regulation
Types of
benefit

GeoPlace - Cost Benefit Analysis Address Data
4
2 Study methodology
2.1 Approach
The study adopts the widely used methodology of cost benefit analysis as outlined above. The
international perspectives from case studies, and insight gained from ConsultingWhere’s access
to international case studies from its contacts globally, further strengthen the analysis.
2.2 Literature review
The literature review forms an important background and context to the study. From an
economic standpoint, we have reviewed the Value of Information4 principles as well as the
Public Information Value (European Union POPSIS study)5. Two previous studies that have
considered the value of addressing have informed the analysis undertaken in this report: the
CEBR report6 and the LGA Economic Value Study7. In addition to this, examples of international
best practice from Australia and Denmark have provided valuable additional insight.
2.3 Compilation of a database of existing case studies
GeoPlace already has a good selection of case studies from its annual conference and the
organisation’s very successful promotional activities. Unusually, many of these include
estimates of financial benefits and therefore provided an excellent starting point for the cost
benefit analysis. In addition, we used our own database of case studies drawn from our work
with local authorities and from other sources to supplement this information.
We have previously analysed the CEBR study as part of some work that we did on the value of
geographic information to local public service delivery in England and Wales for the Local
Government Association. We used this previous work to help “triangulate” the current findings
to build confidence in the results of the current work.
The case study database we compiled will be a useful resource for future use.
4 Molly K. Macauley, ‘The Value of Information: A Background Paper on Measuring the Contribution of
Space-Derived Earth Science Data to National Resource Management’, Resources for the Future, 2005. Available at: http://www.rff.org/files/sharepoint/WorkImages/Download/RFF-DP-05-26.pdf 5 Mark de Vries et al, ‘Pricing of Public Sector Information Study (POPSIS)’, European Commission, 2011.
Available at: https://ec.europa.eu/digital-single-market/en/news/pricing-public-sector-information-study-popsis-models-supply-and-charging-public-sector 6 CEBR, ‘“It makes life easier…”A study to evaluate the benefit of the local and national land and
property gazetteer, final report’, 2006. Available at: https://www.geoplace.co.uk/documents/10181/127517/A%20study%20to%20evaluate%20the%20benefit%20of%20the%20local%20and%20national%20land%20and%20property%20gazetteers 7 Andrew Coote and Alan Smart, ‘The value of geospatial information in local public service delivery in
England and Wales’, Local Government Association, 2010. Available at:
http://www.local.gov.uk/c/document_library/get_file?uuid=b6875678-4150-4d74-8b16-
bdd9653f774d&groupId=10180

Study methodology
5
2.4 Questionnaire
ConsultingWhere worked with GeoPlace to design a suitable online questionnaire using a
market survey tool called Survey Monkey.
The most important element of questionnaire design is to keep it short and relevant. For
instance, providing a range of possible responses in percentage terms for time savings is much
more effective than trying to directly elicit financial values. Allowing for descriptive additional
remarks was useful as it provided information that we were later able to follow up by phone and
email.
Getting responses to questionnaires is notoriously difficult and responses are unlikely to be
randomly distributed – if you have a good story to tell you may respond but otherwise not.
However, we were able to collect 178 responses out of 800 invitations sent.
2.5 Training course
We gave a one-day training course for potential contributors to new case studies in Birmingham
in December.
The course was based on the ConsultingWhere training on ‘Assessing the Business Case for
Investment in Geospatial Projects’ that has now been delivered successfully on four continents
over the last five years. The course, which was adapted to focus on applications of address
covered:
• Aligning applications to key business drivers.
• Business process modelling to break down workflows and identify where benefits occur.
• Identifying the cost components.
• Techniques for the evaluation of practical benefits and for the measuring of intangible
benefits.
• Development of a Discounted Cash Flow (DCF) model.
• Presenting a business case to senior executives.
It provided delegates with a set of reusable skills as well as helping them to provide the evidence
we needed to complete the cost benefit analysis.
2.6 Interviews
Our experience of these studies is that one-to-one interviews, conducted either face to face or
by telephone, are the best source of metrics and this has proved to be the case in this study.
We have developed a structured approach for conducting such interviews. It starts by
establishing with the interviewee benefits in qualitative terms and then proceeds to
quantification based on assessing the highest value components from their replies. Where

Study methodology
6
possible we used examples drawn from existing case studies of different types of benefits to get
people thinking constructively about how these might apply in their own organisation.
In total we conducted more than 30 interviews. They were prioritised to fill in gaps in more
innovative application areas and ensure an even spread of authority types. In addition, we spoke
to organisations which had already been the subject of case studies, usually to confirm the
nature of benefits – realised or predicted – and to update quantification, where appropriate.
In the course of the interviews it was sometimes necessary to give an assurance of anonymity;
this encouraged some people to speak more openly. For this reason the case studies are
sometimes referred to by generic type of authority rather than to a specific authority.
2.7 Construction of the CBA Model
From the information gathered through the preceding steps we have created a financial model.
The model is essentially a set of spreadsheets that build up a picture of the return on investment
in England and Wales.
2.7.1 Principles
It is not feasible to conduct a survey of all local authorities. To overcome this we have provided
a range of values for the RoI by including sensitivity analysis, which has varied parameters for
best and worst case scenarios.
In order to bring the values to a common baseline (described as Net Present Value), discount
rates are applied to past and future benefits (and costs). It is conventional to ignore the effects
of inflation since they generally apply equally to costs and benefits so cancel each other out.
Establishing the proportion of the benefits directly attributable to GeoPlace information, as
opposed to the application itself has been assessed for each use case quantified. We also
consider the counterfactual – what would have been used if the gazetteers were not available.
The financial model is designed to be modifiable so that it might be maintained and updated as
more information becomes available in the future. This has been supplied to GeoPlace, along
with a tutorial (with accompanying Microsoft PowerPoint Presentation) on how it can be best
used going forward.
2.7.2 Process
The study undertaken has gone through the following steps:
1. Each case study has been corroborated against normal industry behaviour in order to
validate that it reflects the extent it is likely to be implemented by other local authorities
across England and Wales. The optimism bias prevalent in all case study-based sample has
been taken into account by “writing down” the benefits.
2. The benefits identified by the local authorities from their case studies were scaled up to
achieve a national impact based either on population, total council revenue/expenditure or
other possible metrics depending on applicability.

Study methodology
7
3. The current level of adoption was then used to predict the total impact of full adoption. The
adoption period is the time it is estimated it is likely to take for the technology to become
“business as usual” across all local authorities in England and Wales. This has been assessed
from the GeoPlace improvement schedules, an annual questionnaire completed by all local
authorities that details (amongst many other factors) integration of the LLPG with other
information systems.
4. The adoption rates have then been applied to the flows of net benefits over time that
allowed us to calculate both the level of current cost-benefit and predicted position over
the next 5 years (to 2020). We only predict to this horizon as the pace of change of
technology makes looking further not credible.
5. The costs for building and maintaining the address and street data is offset against the
benefits and allocated to the appropriate applications. Assumptions are made concerning
“sunk costs” i.e. costs incurred in the past that have been amortised.
2.8 Validation Workshop
Once the activities above were completed, we conducted a workshop with opinion formers in
the community, including, in addition to leading local authority representatives, selected
individuals from the Local Government Association and Socitm to present the preliminary results
and invite their feedback.
This exercise was extremely helpful and yielded many insights, validating assumptions and
providing ideas on overcoming barriers to adoption.
2.9 Economist Review
ConsultingWhere worked with one of the foremost experts in the field of geo-infonomics, Alan
Smart of ACIL Allen to validate the methodology and results. Geo-infonomics is the science of
applying economic principles and techniques such as cost benefit analysis to geospatial
applications. Alan Smart is the principal author of the seminal studies on the economic benefits
of geospatial in Australia and New Zealand, as well as the reviewer for the UK study undertaken
by ConsultingWhere for the Local Government Association.
Mr. Smart has reviewed and advised on the methodology and results in order to further enhance
its credibility and robustness.
2.10 Final Report
This final report is being delivered along with a Microsoft PowerPoint presentation with notes
that provides a useful “shorthand” means of communicating the results. The financial model
has also been supplied to GeoPlace with other supporting materials.
Literature Review
8
3 Literature Review
The following section evaluates wider contexts that inform and provide useful insight to this
report. We review the Value of Information principles as well as the European Union Public
Information Value study and consider the two previous studies that have assessed the value of
addressing: the CEBR report and the LGA Economic Value Study. In addition to this, reviews of
international best practice from Australia and Denmark provide useful comparative studies. The
lessons learned from these studies are referenced as appropriate in later sections.
3.1 Economics
3.1.1 Value of Information principles
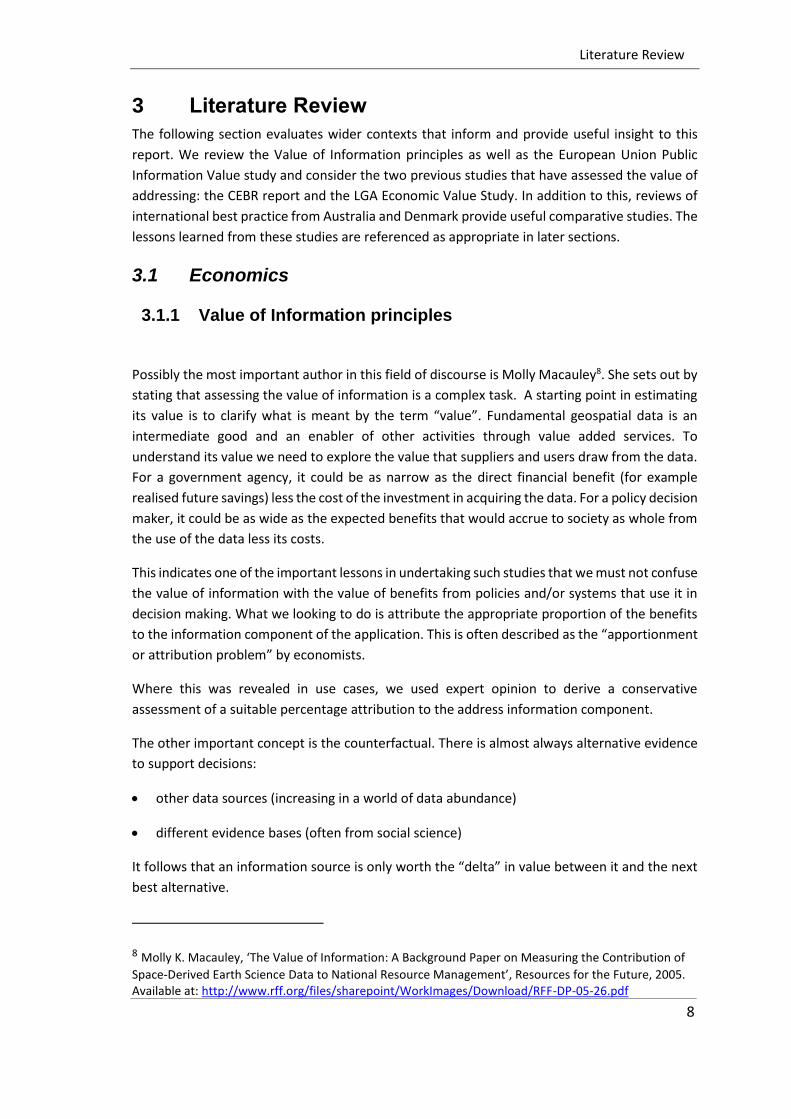
Possibly the most important author in this field of discourse is Molly Macauley8. She sets out by
stating that assessing the value of information is a complex task. A starting point in estimating
its value is to clarify what is meant by the term “value”. Fundamental geospatial data is an
intermediate good and an enabler of other activities through value added services. To
understand its value we need to explore the value that suppliers and users draw from the data.
For a government agency, it could be as narrow as the direct financial benefit (for example
realised future savings) less the cost of the investment in acquiring the data. For a policy decision
maker, it could be as wide as the expected benefits that would accrue to society as whole from
the use of the data less its costs.
This indicates one of the important lessons in undertaking such studies that we must not confuse
the value of information with the value of benefits from policies and/or systems that use it in
decision making. What we looking to do is attribute the appropriate proportion of the benefits
to the information component of the application. This is often described as the “apportionment
or attribution problem” by economists.
Where this was revealed in use cases, we used expert opinion to derive a conservative
assessment of a suitable percentage attribution to the address information component.
The other important concept is the counterfactual. There is almost always alternative evidence
to support decisions:
• other data sources (increasing in a world of data abundance)
• different evidence bases (often from social science)
It follows that an information source is only worth the “delta” in value between it and the next
best alternative.
8 Molly K. Macauley, ‘The Value of Information: A Background Paper on Measuring the Contribution of
Space-Derived Earth Science Data to National Resource Management’, Resources for the Future, 2005. Available at: http://www.rff.org/files/sharepoint/WorkImages/Download/RFF-DP-05-26.pdf
Literature Review
9
To quote Macauley again, she suggests value is determined by four key factors:
1. The degree of uncertainty faced by decision makers.
2. What is at stake as an outcome of a decision.
3. The cost of using the information to make decisions.
4. The cost/price of the next-best information substitute.
We must also factor-in the ability and willingness of individuals to act on the information they
receive.
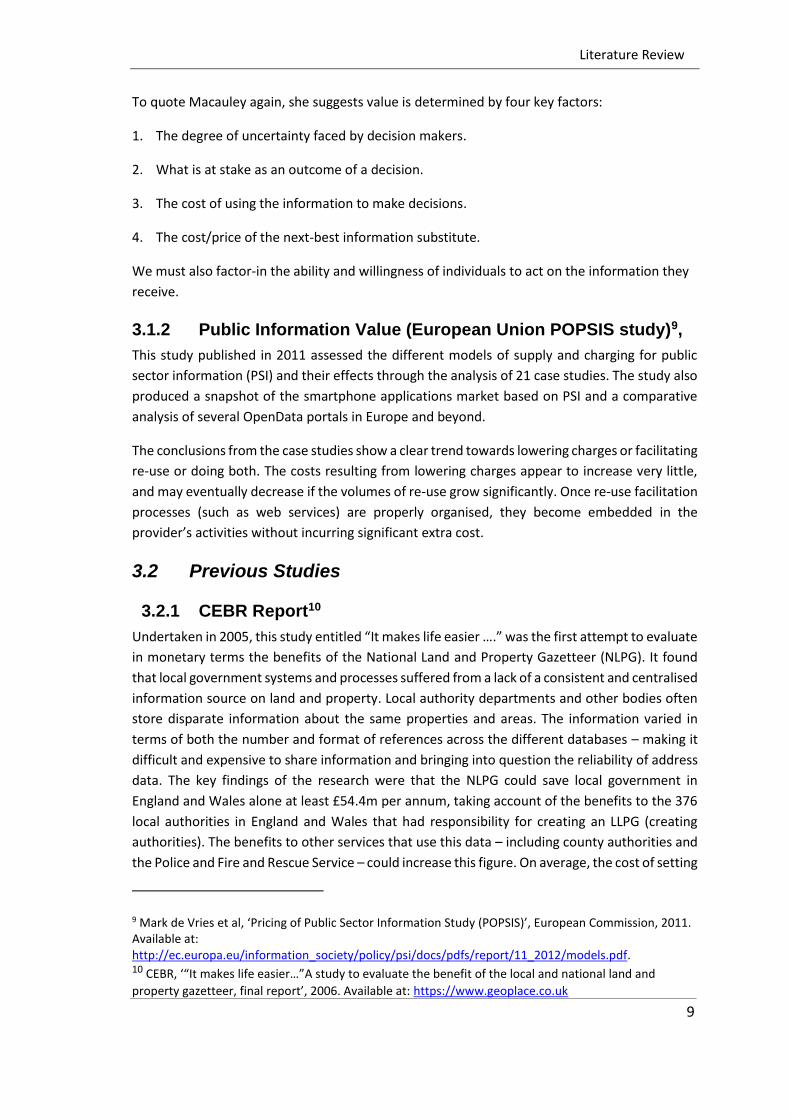
3.1.2 Public Information Value (European Union POPSIS study)9,
This study published in 2011 assessed the different models of supply and charging for public
sector information (PSI) and their effects through the analysis of 21 case studies. The study also
produced a snapshot of the smartphone applications market based on PSI and a comparative
analysis of several OpenData portals in Europe and beyond.
The conclusions from the case studies show a clear trend towards lowering charges or facilitating
re-use or doing both. The costs resulting from lowering charges appear to increase very little,
and may eventually decrease if the volumes of re-use grow significantly. Once re-use facilitation
processes (such as web services) are properly organised, they become embedded in the
provider’s activities without incurring significant extra cost.
3.2 Previous Studies
3.2.1 CEBR Report10
Undertaken in 2005, this study entitled “It makes life easier ….” was the first attempt to evaluate
in monetary terms the benefits of the National Land and Property Gazetteer (NLPG). It found
that local government systems and processes suffered from a lack of a consistent and centralised
information source on land and property. Local authority departments and other bodies often
store disparate information about the same properties and areas. The information varied in
terms of both the number and format of references across the different databases – making it
difficult and expensive to share information and bringing into question the reliability of address
data. The key findings of the research were that the NLPG could save local government in
England and Wales alone at least £54.4m per annum, taking account of the benefits to the 376
local authorities in England and Wales that had responsibility for creating an LLPG (creating
authorities). The benefits to other services that use this data – including county authorities and
the Police and Fire and Rescue Service – could increase this figure. On average, the cost of setting
9 Mark de Vries et al, ‘Pricing of Public Sector Information Study (POPSIS)’, European Commission, 2011. Available at: http://ec.europa.eu/information_society/policy/psi/docs/pdfs/report/11_2012/models.pdf. 10 CEBR, ‘“It makes life easier…”A study to evaluate the benefit of the local and national land and
property gazetteer, final report’, 2006. Available at: https://www.geoplace.co.uk

Literature Review
10
up an LLPG to a local authority was £34,000 and the running costs were £40,000 per annum
(including staff costs and other costs such as software licences). The project evaluation showed
that over a ten year period, the benefit‐cost ratio of the NLPG to local government alone could
amount to 3.3:1.
3.2.2 LGA Economic Value Study (2010)11
The value of the National Land and Property Gazetteer (NLPG) was included in this study,
undertaken by ConsultingWhere. The base information was derived from the GIS survey of local
public service providers undertaken by the Local Government Association in 2009 which
included a question related to NLPG data sharing. The size of the survey sample was 201 replies
from a total of 348 authorities, made up of shire districts, metropolitan districts, unitary
authorities, London boroughs and Welsh counties. Although county councils, national parks,
police, fire and rescue and passenger transport organisations were included in the survey, as
they do not have primary responsibility for the services considered they were excluded from the
analysis.
The costs of implementing NLPG sharing for the services where data was not shared were
calculated based on the assessment made as part of the CEBR report in 2006 of setup costs
(capital expenditure) and on-going (recurrent) costs. They were indexed to the financial year
2008-9 at a 2.5% inflation rate. An additional cost was added for data matching based on actual
charges made by Intelligent Addressing under their Mapping Service Agreement with local
government uplifted to take into account preparation work by the local authority and
apportioned systems connection costs. The on-going staff effort in data cleansing was assumed
to be covered within the recurrent running costs. Investments in setup, made prior to 2004-5
were disregarded, since they would have been amortised under normal accountancy practice
prior to the period under consideration.
The identified costs and benefits were input to a discounted cash flow model based on an
average 12 month implementation, so benefits are realised one year later than the investment
is made. A discount rate of 4% per annum was applied over the period of the investments (6
years) to calculate the value of the net benefits as at the beginning of the period. The cumulative
net present value calculated for the six year period to 2014/5 was £24m.
3.3 International comparative studies
3.3.1 Australia: National Address Management Framework
(NAMF)
In Australia, thousands of new addresses are created every week through the daily interactions
between federal, state and local government, the private sector and the public. The business
11 Andrew Coote and Alan Smart, ‘The value of geospatial information in local public service delivery in
England and Wales’, Local Government Association, 2010. Available at: http://www.local.gov.uk/c/document_library/get_file?uuid=b6875678-4150-4d74-8b16-bdd9653f774d&groupId=10180

Literature Review
11
operations of many enterprises; utilities, telecommunications, construction, banking and
insurance rely on timely access to these new addresses as well as the millions of existing
addresses. Address information is collected and stored in many different ways, creating the
potential for addresses to vary widely in quality and accuracy.
With multiple capture of data and no single authoritative source of information there are
considerable inefficiencies and even risks to life. Inaccurate and unreliable addresses that are
inconsistently geo-referenced carry a high financial cost and, in the despatching of emergency
services, a human cost. A single accurate and consistent address dataset is also needed for
service delivery, emergency planning and counter-terrorism.
For example, in 2009, the West Australian Public Sector Commission and Landgate (the Western
Australian Land Information Authority) invited 28 agencies to participate in an address data
quality survey. The critical nature of address information to public sector entities was
highlighted in the 20 survey responses received. Street and postal address were identified as
fundamental to a citizen’s ability to interact with government12.
In another survey by the New South Wales Addressing Working Group (NAWG) the needs of
major stakeholders in their use of addresses were analysed. The survey targeted 40 users from
all levels of Government and the private sector. Over 75% of those surveyed believed that
correct addresses were “business critical” to their organisation, with 54% stating that problems
relating to addresses frequently affected the delivery of their organisation’s products and
services. Just over 45% believed that these problems resulted in “high” costs for their
organisation13.
In recognition of the economic and social benefits associated with improving address quality,
Australia has adopted a national, coordinated approach to address management in the form of
the National Address Management Framework (NAMF) which is delivered by PSMA14.
The NAMF is a consistent, standards-based framework that guides the process for verifying
addresses and provides a solid basis for exchange of address data. The core aim of the technical
framework is to provide a unique address where “one address = one location”.
NAMF comprises a single authoritative address data set, an address data interchange standard
and web services specification. The single authoritative address dataset consists of:
12 Public Sector Commissioner’s Circular: 2010-04 Policy Framework and Standards for Address Management in Public Sector Entities. Available at: https://publicsector.wa.gov.au/document/public-sector-commissioners-circular-2010-04-policy-framework-and-standards-address-management-public-sector-entities-replaced 13 Current Addressing Practices in Australia, NAWG Discussion Paper: 2010-01’, as cited in NAMF Fact Sheet, 2013. Available at: http://www.anzlic.gov.au/resources/national_address_management_framework 14 PSMA Limited is a public company owned by Australia’s federal, state and territory governments that facilitates access to high-quality location data.
Literature Review
12
- the Geocoded National Address File (G-NAF)15 from PSMA;
- the Postal Address File (PAF) from Australia Post.
The G-NAF can be used in applications and operations where an accurate geocoded address is
required, including for address validation. The PAF is provided by the accredited Address
Matching Approval System (AMAS) for postal delivery operations and functions. G-NAF and PAF
provide complementary location and postal address services and together provide a complete
and authoritative source of addressing data.
The federated model uses standards to improve the interoperability of address information.
National guidelines have been created in order to produce a greater degree of accuracy than
was possible with pre-existing address validation systems. The Australian and New Zealand
Spatial Information Council (ANZLIC) are responsible for governance of the standards and
guidelines. The NAMF compliance framework has been developed to enable users to ensure
their geocoded address validation services are compliant. G-NAF is the authoritative dataset for
the location of the address; PAF that is used for postal delivery is not included in the compliance
framework.
NAMF makes address management and operations more efficient and accurate. It focuses on
improving the quality of address resources used by governments at all levels by:
• using daily address feeds to create a near-live database of authoritative geocoded
addresses for Australia;
• providing the tools for checking addresses and ensuring consistency;
• ensuring a consistent web service interface for address verification;
• providing a web service for the notification of address verification failure (defined as the
failure to locate an address through searching the reference dataset);
• being driven by the interests of both the users of address data and the address custodians.
The Australian government is committed to better use of public data and is supporting data-
driven innovation through open data. Access to spatial data is becoming increasingly important
to the economy with the fast growing use of mobile devices. In December 2015, the Australian
Government’s announced its National Innovation and Science Agenda. One of the measures it
includes is to make two of PSMA Australia’s products: G-NAF and the Administrative Boundaries
datasets openly available. By doing so, the government is removing barriers to the greater use
of the data and creating opportunities for industry innovation and competitiveness. Since
15 G-NAF was first released in 2004. It contains over 13 million physical addresses. G-NAF is updated quarterly; on average 400,000 address changes are made each year. Every address contains a geocode and metadata to assist in decision-making. Data is sourced from various contributors including: address information for valuation and planning from State and Territory address custodians; addresses of all mail recipients from Australia Post and addresses of registered voters from the Australian Electoral Commission.
Literature Review
13
February 2016, the datasets have been published on data.gov.au under an open data licence at
no cost to end users16.
The benefits of the NAMF include:
• Providing a single authoritative national dataset for verifying addresses national.
• Improving the quality of address information.
• Improving access to up-to-date authoritative geocoded addresses.
• Standardising the verification reference of the dataset.
• Improving the efficiency of sharing address information.
• Standardising the interchange of address information and notification.
• Standardising address verification web services.
• Providing a consistent and rich source of dataset feedback to authorities.
• Reducing duplication when adding or changing address verification services.
• Improving the efficiency of the address verification process.
• Streamlining business processes and reducing duplicated effort for effective address
management.
3.3.2 Denmark: the value of address data
Before 2003, Denmark’s public sector address data was not accessible to the private sector. The
data, containing around 2.4 million addresses, was owned by the 275 individual municipalities
with no common licence agreement or system was in place for data distribution. As a
consequence, address databases were duplicated and were of a varying standard and quality
across the commercial sector. The inefficiencies arising from the lack of availability of address
data and its ambiguities had direct and indirect costs to the business community, public services
and citizens.
Denmark has recognised for several decades that addresses are an important part of its society’s
infrastructure. From the mid 1990s Denmark took significant steps to establish a common
address file through a nationwide collaboration between local governments. Between 1996 -
2001, all municipalities in Demark undertook a process of harmonisation of their public base
register and base maps as well as a quality check and improvement of their address data.
Geocoding of all addresses using a single point per address and based on maps of 1:10,000 to
1:000 scales, was also undertaken. By 2002, Denmark had high quality address data (97% of
16 The G-NAF is provided as a Pipe Separated Value (PSC) file and the Administrative Boundaries dataset is provided as an ESRI Shapefile. Updated versions of these datasets are published on a quarterly basis.
Literature Review
14
which contained geocodes). There was an increasing awareness that geocoded addresses were
a major public asset that could provide significant socio-economic benefits.
In December 2002, the Danish Government made a bold move towards maximising the potential
of its public address data by announcing The Better Access to Public Data Agreement (also
known as the Free of Charge Agreement). The core aim was to promote the broader use of public
address data for commercial as well as non-commercial purposes, and in doing so, improve
public and private services as well as public safety. As the address data was already geocoded,
addresses could be used as geographic identifiers in digital maps, for example, for optimising
route planning for the emergency services. Intellectual property rights and licence agreements
that would usually exist to restrict the use of public data were removed. The Better Access to
Public Data Agreement came into force in 2003 but it was not fully implemented until 2005
following an amendment that removed a number of legal limitations on the distribution of
address data to third parties.
In terms of cost, part of the Agreement involved a three-year compensation package for the
municipalities who were under an obligation to update data annually; this amounted to around
£0.9 million. In addition, the Danish Enterprise and Construction Authority (DECA), responsible
for overall regulation of the single address system, incurred costs as a result of distributing
address data through the Public Data Server (PDS) during the period 2004 to 2009 which raised
the total cost to the equivalent of about £1.6 million. Subsequently the running costs of the
system decreased. In 2010 they were estimated to be the equivalent of £0.2 million.
In 2010 the Danish Government commissioned a report to assess and quantify the impact of the
Better Access to Public Data Agreement of 2002. The process of measuring the economic gains
involved a cost benefit analysis, which looked at the costs of establishing common address data
in relation to the benefits gained in the wider economy. This assessment involved qualitative
analysis through interviews with households and businesses and quantitative analysis of the
estimated negative economic consequences of not making common address reference data
available. For example, for the Danish Postal Service the cost associated with continuing with
the inconsistencies of the address system was estimated at the equivalent of £0.7 million per
year17.
The study concluded that the direct financial benefits from the Agreement for society in the
period 2005 to 2009 amounted to the equivalent of around £51 million18. During the same
17 Morten Lind, National Survey and Cadastre, Denmark, ‘Benefits of common address reference data –
experience and assessments’, presented at Urisa, Washington, DC, 2007. Available at: http://www.isotc211.org/address/Copenhagen_Address_Workshop/papers/Lind_BenefitsOfCommonAddressReferenceData_URISA2007.pdf 18 The total value of all distributed address datasets was calculated to be around £51 million. The value calculations were based on an assumption that the economic value of the free-of-charge addresses in each individual application corresponded to the price users actually paid for the local governments’ address data prior to the Agreement. It is debatable whether this value is too low or too high. The calculations could be too low as the price charged prior the Agreement was under a single site licence, after the Agreement the user could freely share the data and integrate it into products intended for resale, resulting in a higher utility value. On the other hand, the value may be set too high as, all else

Literature Review
15
period, the total costs of the Agreement (the compensation to the municipalities and the cost
of PDS distribution) were around £2.3 million. The net economic benefits were estimated to be
£49 million. Around 30% of the benefits would be in the public sector and around 70% would be
in the private sector. The value for society in 2010 was estimated at the equivalent £12.8 million
or £5 per address. In the same year the cost benefit ratio was considered to be 1 to 7019.
The assessment only includes the direct financial benefits from the 1,236 organisations receiving
address data from the PDS. Supplementary economic benefits arising further down the chain of
address distribution were not included in the study. For example, according to Statistics
Denmark, in 2010, 46% of Danish families had a satellite navigation system for use in their cars;
this is the equivalent of about 1.3 million GPS, each with a copy of all Danish addresses.
The benefits of Denmark’s free-of-charge address data to society are wide ranging for both public and private sectors:
• The emergency services now all use the same high quality common address reference data.
A precise location is key to dispatching the right ambulance or fire service via the most
efficient route to the correct location. In 2004 a case was reported in Denmark of an
ambulance being dispatched to the wrong city resulting in the death of an individual – an
outcome that could have been avoided with correct address information.
• Better route planning has benefitted public transport services and its users. For example,
the Free of Charge Data Agreement made the successful Journey Planner application
possible, assisting public transport users in planning their journeys. Without it, the project
would have needed to manage individual agreements with all the 275 individual
municipalities (Journey Planner can be accessed via computer, smartphone or tablet).
• The postal delivery service Post Denmark has assessed that its new optimising route
planning tool ‘TOR’ will reduce delivery costs by the equivalent of £5.3 million every year20.
In 2004, Post Denmark reported a net 3.3% reduction in all costs in the first year of the
project and 100% Return on Investment (RoI) within 1-2 years21.
being equal, general digitalisation in society and the increasing spread of digital data since 2002 would have resulted in a falling price for the address data set. In order to take into account of these uncertainties, and to incorporate the prudence principle, the assessment reduced the calculated value of the address data by 25% so that only 75% was included in the results. The assessment also included savings made by municipalities no longer needing to assign resources to the deal with negotiations, agreements, rights and delivery of data to the private sector and vice versa. These savings were calculated as the equivalent of £3.5 million from 2005-2009. See reference below in footnote 12. 19 The Danish Enterprise and Construction Authority, ‘The value of Danish address data’, 2010. Available at: http://www.adresse-info.dk 20 Soren Rude and Morten Lind, Danish Enterprise and Construction Agency ‘The economic value of free of charge address data’. Presented at the AfricaGEO SDI Workshop May, 2011. Available at: http://archivedpublicwebsite.up.ac.za/sitefiles/file/48/16053/Rude_2011_SDIWorkshop_Denmark_Value_of_Addresses_Handouts.pdf 21 Morten Lind, 2007. op.cit.

Literature Review
16
• For public safety and crime detection, access to the geocoded addresses has improved
services and significantly contributed to the implementation and use of GIS in the police
force.
• Geocoded address data is a crucial tool to the Danish Centre of Disease Control as it aids the
national monitoring of infectious diseases and contributes to the analysis and detection of
the transmission source of disease outbreaks.
• Cancer research has been enhanced by geocoded addresses. Studies of the effects of
environmental pollution on human health have benefitted from geocoded address data. For
example, recent research estimating the levels of radon in the homes of children with
leukaemia would not have been possible without it22.
• For the commercial sector, free access to address data is providing opportunities for
businesses to develop new and innovative products based on the address as a common
reference.
• Address data for all of Denmark is of a consistently highly quality, in a fixed, standardised
data format. Errors and omissions to address data can be reported easily and updated once,
in one place.
22 Soren Rude and Morten Lind, 2011. op. cit.

Key Findings
17
4 Key Findings
4.1 External factors
A PESTLE analysis23 is a framework or tool used to analyse and monitor the external
environmental factors that have an impact on an organisation. PESTLE analysis is in effect an
audit of an organisation's environmental influences with the purpose of using this information
to guide strategic decision making. The following PESTLE analysis is a summary of key macro
factors that shape GeoPlace’s operating environment:
4.1.1 Political
Situation:
• There is a general lack of political awareness of the potential of address and street
gazetteer data to inform and enhance decision making in the public sector.
• The potential benefits from the integration of health and social care are poorly understood
by decision makers.
Response:
• Devolution and local decision making could be a possible way forward to raise awareness
and put gazetteer data on the government agenda.
4.1.2 Economic
Situation:
• The current economic climate is driving further cuts in public spending. There is reduced
funding for partnership working with emergency services in many localities.
Response:
• IT-driven transformation is widely considered to be pivotal to improving efficiency.
Promoting the use of location data could help further reduce costs across the public
sector.
4.1.3 Social
Situation:
• Costs and inefficiencies arise when local authorities do not have the necessary tools to
pinpoint and target those most in need.
23 PESTLE – The acronym stands for Political, Economic, Social, Technological, Legislative and
Environmental factors and is a standard technique for analysis of external factors affecting an organisation.

Key Findings
18
Response:
• Accurate and unified addressing helps local authorities care for vulnerable people, tackle
social isolation and work towards digital inclusion.
• Early retirement initiatives in local government increase the need for knowledge
management underpinned by gazetteers.
• Open government data (free at the point of delivery) widely expected worldwide.
4.1.4 Technology
Situation:
• The rapid expansion of access to digital information and the ability for individuals and
organisations to store flexibly that data allows a wider array of users to access appropriate
location information more quickly and easily.
• The scope and speed of technological changes are facilitating better integration with
location information, these advances include: APIs, open standards, the cloud, data as a
platform, big data (predictive analysis) and transition from web 2.0 to web 3.0.
Response:
• Opportunities arising from advancements in technology need to be harnessed to promote
location data as a key factor in facilitating better integration.
4.1.5 Legislative
Situation:
• There are information governance restrictions on addresses (regarded as personal data in
many instances, particularly in the NHS).
Response:
• GeoPlace needs to work with the Government Data Service and others at a national level
to understand and, where appropriate, relax these constraints.
• Creating secure “hubs” where matching is undertaken without compromising governance
rules is a short-term solution.
4.1.6 Environment
Situation:
• Changes in the environment pose challenges to local authorities. For example, air quality
control and the increased risk of flooding brought about by climate change.
Response:
Key Findings
19
• Better address data is critical for effective emergency management particularly for rapid
responses to flooding.
4.2 Internal factors
There have been significant changes since the last cost benefit study in 2010. Key impacts on
LLPG/LSG since last review include:
• The creation of GeoPlace.
• The Public Sector Mapping Agreement (PSMA) of 2011 has had significant impact. Its licence
lets public sector organisations in England and Wales access and share Ordnance Survey (OS)
digital mapping; AddressBase from the OS is available without charge if national coverage is
required.
• Severe reductions in local authority budgets have taken place with consequent cuts to staff
numbers engaged in gazetteer maintenance and with that the loss of expertise. Many
retirements result in the loss of domain knowledge.
• An increasing degree of integration of the Address ID (UPRN) into core local authority
systems.
• Increasing use of addressing for analysis, for example in the identification of benefit fraud.
• Overall there has been a reduction in the interaction between emergency services and local
authorities. Resources for crime prevention partnerships with the Police have been reduced.
However, nationally the picture is more mixed for Fire and Rescue Services with some more
positive initiatives, for instance, with the London Fire Brigade.
• The volume of changes to address data is still significant.
• New housing and street renaming can now be more efficiently recorded thereby improving
data quality.
• There are now more shared services including address and street gazetteer maintenance.
4.3 Key current government policy initiatives
There are a variety of current initiatives taking place across government where address data
can “intercept” the political agenda and thereby create opportunities to access funds and
support:
• Within the Government Data Service relevant initiatives are:
– Centres of Excellence in information sharing.
– Implementing the Local Government Transparency Code and open data.
– Supporting standardisation (addresses already have a national standard – BS7666).

Key Findings
20
• In local government shared services can bring about opportunities for greater efficiency in
address maintenance24.
• Addresses form a part of the information infrastructure for strategic planning such as house
building incentives25, for example on brownfield sites.
• Local Land Charges could be supported by the possible development of a centralised Land
Registry database to include the UPRN26.
• ‘Devolution deals’ that are currently in process, for example the Greater Manchester
Combined Authority (GMCA)27 and the greater focus on local issues which throw into focus
the need for a detailed geographical base for decision making including address data.
• Health and social care integration initiatives such as those focused on mental health,
vulnerable families (e.g. the ‘Troubled Families’ initiative) and reducing digital exclusion all
benefit from location based data.
• The increased freedom for local authorities to charge for services might be used to sell, for
instance, anonymised data analytics products.
4.4 Value survey (questionnaire) results
ConsultingWhere worked with GeoPlace to design an online questionnaire using the marketing
survey tool Survey Monkey. The survey was undertaken over the period between November
2015 and the end of January 2016. 178 responses were received from close to 800 invitations
sent, a 22% return. However, there were few authorities making more than one response, so in
terms of authorities responding we estimate the return at closer to 40%.
As the response rate is still relatively low, we must take this into account before drawing detailed
conclusions from the survey. However, some useful inferences can be drawn and these are
summarised in this section.
24 The LGS national shared services map for 2015 which shows that there are 416 shared service arrangements occurring between councils across the country resulting in £462 million efficiency savings indicating that there are opportunities within these arrangements for address maintenance. See: http://www.local.gov.uk/shared-services-map 25 See press release on fast track applications to speed up planning process and boost housebuilding at: https://www.gov.uk/government/news/fast-track-applications-to-speed-up-planning-process-and-boost-housebuilding 26 See press release on Land registry to widen its powers and take on Local Land Charge searches at: https://www.gov.uk/government/news/land-registry-to-widen-its-powers-and-take-on-local-land-charge-searches--2 27 See further information on devolution for the GMCA at: http://www.gmhsc.org.uk/devolution-what-
it-means/

Key Findings
21
4.4.1 Respondents
Figure 2: Survey Respondents by Type
Unitary authorities (including Metropolitan Districts, London Boroughs and Welsh Counties)
represented 40% of the responses and districts 44% of responses. There were relatively few
county respondents (9%). The remainder were predominantly shared services.
4.4.2 Most important users
The figure below shows the ranking of users by importance, defined as those that the
respondents view as gaining the most value from the LLPG and LSG.

Key Findings
22
Figure 3: Ranking of current users
Planning and development (54%), Highways and transport (17%) customer Services (14%)
scored most highly. The least important current uses of LLPG and LSG in local organisations,
those ranked 11-15 by importance were public health, public safety and interaction with
emergency services.
These leads us to suggest that the functions with opportunities for greater realisation of value:
• Corporate services – reflecting little understanding as senior management level of the value
of address and street data;
• Social Services – this suggests that there is a mutual lack of understanding of how data in
general and addresses in particular can provide insights in social care provision;
• Public Safety – surprisingly low importance ranking given the recent floods;
• Education – low importance perhaps reflecting the lack of close interaction between those
maintaining address and street data with this department;
• Emergency Services – may reflect generally less interaction between local authorities and
emergency services in relation to data sharing;
Total responses: 133
Ranking: 1 – most important
users
Low importance
Big opportunities

Key Findings
23
• Public health – no score, reflects planned funding cuts possibly.
4.4.3 Benefits assessment
The survey asked respondents to assess the time savings, the figure below shows the results.
Figure 4: Time saving assessment
Those responding (42%), most commonly indicated savings in excess of 20%. However, the
subsequent question relating to quantification elicited only a small number of responses. Only
18 (10%) answered the question, with only 4 representatives having noticed any benefits. Of
those, time savings were highlighted with monetary values of £20,000 and £100,000 per annum.
The low proportion of respondents answering the question indicates that this kind of
assessment is not part of the normal “thought pattern” of the community. This was reinforced
by the tenor of the comments which indicated the assessment of benefits has not been a priority
and business cases are scarce.
Although this is understandable since their focus is naturally on the work in hand, it does
indicate an area where GeoPlace can work fruitfully on improving awareness and training.
A further question requested feedback on some key qualitative benefits.

Key Findings
24
Figure 5: Qualitative Benefits
73 (41%) of respondents answered this question. Better quality of information was recognised
by all, with a high proportion also seeing better data sharing. However, considerably less
witnessed improved evidence-based decision making. This is disappointing since it indicates that
the dataset is not seen as having a clear link to policy setting.
4.4.4 Costs
We asked respondents to assess the costs of their use of the LLPG and LSG. A disappointingly
low number of answers 25 (14%) were received. However, IT costs (including staff costs) were
identified as most significant with training as the only other significant element.
4.4.5 Barriers to entry
The responses to this question are analysed later in the report – see section 6.
Key Findings
25
4.5 State of the market analysis by business function
Based on the analysis of existing case studies, GeoPlace improvement surveys and the
questionnaire, in this section we examine the key uses of LLPG and LSG data across the main
functional areas on local government and assess their suitability for inclusion in the cost-
benefit quantification.
4.5.1 Planning and development
The longest established and most well developed uses of the LLPG and UPRN are found in use
cases in the functional area. These include integration into planning and building control
processes in the majority of all types of local authorities. Local Land Charges has seen perhaps
the most significant impact, with the UPRN being the key identifier used to bring diverse sources
of data together. Other examples include systems that facilitate notification of neighbours of
planning applicants, local plan revision and planning consultations. Plans to move responsibility
for Local Land Charges to the Land Registry is delaying investment in this functional area.
4.5.2 Highways and transport
The use of the LSG in planning and the issuing of permits for streetworks both by local authorities
and by utility companies is well established. The LLPG can also play a role in notification of those
affected by streetworks although this is less widespread. The LSG is also widely used for
optimising inspection routes for highway maintenance; providing the means for more effective
gritting and salting routes and reducing service interruptions for streetworks.
4.5.3 Revenue and benefits
The LLPG is being used successfully to pinpoint missing council tax or non-domestic rates
collection. The use of address data as part of a matching process to detect council tax and benefit
fraud is included in the cost benefits quantification. This is increasingly being undertaken as part
of what is referred to as a data warehouse application or more recently big data analytics. An
example of this process is the detection of potentially fraudulent claiming of single person
occupancy by cross-referencing against other local authority address data such a parking fines;
several people using the same address (claimed to be in single occupancy)for parking fines
indicates the need to investigate the claim. Matching with central government data through the
National Fraud Initiative (NFI) also has substantial potential to highlight fraud.
4.5.4 Corporate services
The creation of executive and member dashboards that allow decision makers to be able to see
what is happening across the council in relation to a small area (defined by a group of addresses)
or individual address.
The use cases in Corporate Services are often “bundled up” into larger Digital Transformation
projects and the specific benefits of the LLPG and LSG are difficult to separate out for
quantification.

Key Findings
26
4.5.5 Social services
A growing number of use cases relate to social services, these include neighbourhood analysis
and the identification of troubled families, support for vulnerable people, loneliness studies and
special needs transport. Currently, the numbers of implemented systems are small, however,
there is significant potential to recognise these successes, create case studies and promote them
as exemplars of best practice.
4.5.6 Street scene
The most easily quantified use case for this type of council function is the use of tablets or
smartphones to allow officers to spend more time in the field and react more rapidly to
incidents. This technology opens up new possibilities for reporting problems such as graffiti as
well as work order management and management reporting. There are however few examples
where the benefits have been captured. In recent years resources have been scaled back as a
reaction to budget cuts, so the pace of the roll-out of new technology has slowed.
4.5.7 Property services
The address gazetteer (LLPG) has long been used to assist property departments in locating,
managing and rationalising their assets. The usage is a small part of a much more complex
process and few examples of quantification exist. The availability of the land registry index map
as open data under INSPIRE provides opportunities for further work by local authorities on
vacant land. The Public Rights of Way (PRoW) maintained by councils can also be hosted within
the LSG data.
4.5.8 Environmental services
Address data is fundamental to the licensing and monitoring of commercial premises. However,
apportioning the benefits is often problematic. Environmental issues such as illegal tipping can
also be monitored and tackled more effectively with address data. The LSG can be used as a base
to record detailed environmental information, allowing streetworks activities to be carried out
with consideration and awareness of roadside nature reserves and sites and artefacts in the sites
and monuments record.
4.5.9 Customer services
Customer Relationship Management (CRM) systems are one of the largest consumers of address
data for identifying location during calls and face-to-face meetings. The 2015 improvement
study suggests 72% of councils’ CRMs are reliant on the UPRN. Address data can also assist with
service interruption notices and opinion surveys. The associated benefits of channel shift are
quantified as part of the study.
4.5.10 Waste management
Waste management, particularly route optimisation for refuse collection, recycling and other
waste is a strong use case which quantified within this study. It has been widely adopted and is

Key Findings
27
now being promoted nationally through the DCLG local waste management partnership
scheme28.
4.5.11 Public safety
The use of address data to facilitate contingency planning and the evacuation of people in
emergency situations, most notably in recent years as a result of flooding, is an increasingly
widely recognised use of the LLPG and LSG. The UPRN is also extensively used in emergency
simulations to test preparedness and coordination between emergency services, councils and
other authorities such as utilities. Quantification relies upon assessment of the risks avoided and
use of metrics for the statistical value of a life and similar injury metrics. Although this approach
could be pursued, our view is that the address is not sufficiently central to avoiding loss of life,
considering limited council responsibilities in this respect, to justify attempting to quantify.
4.5.12 Education
Exemplars of the best practice, such as the London Grid for Learning show how the UPRN can
yield efficiencies for the allocation of school places within catchment areas. Other applications
for improving costs of contracted out school transport in rural areas and special needs transport
also show significant potential for efficiency savings.
4.5.13 Electoral management
Although the use of addresses to validate electoral roll records is widely adopted, the evidence
suggests that the benefits (Huntingdonshire Council for example29) are relatively modest. The
spin-off applications such as supporting ward boundary changes (Northumberland County
Council30 and consolidating polling stations, although vital to local democracy, have mostly non-
financial benefits.
4.5.14 Public health
The recent Socitm report, titled ‘Health and Social Care Integration – The Case for Place’31
references a number of case studies. The process of Joint Strategic Needs Assessments carried
out by Health and Wellbeing Boards with inputs from a broad range of stakeholders in the health
and social care arena provide a good example of the benefits of location-based analysis.
However, this functional area has been subject to recent cuts, and there appears to be little
appetite for better use of address data.
28 Local Waste Service Standards Project, Local Digital Coalition, 2014. Available at: http://www.localdigitalcoalition.uk/product/local-waste-service-standards-project/ 29 Modernising Electoral Data services in Huntingdonshire, GeoPlace, 2015. Available at: https://www.geoplace.co.uk/-/modernising-electoral-data-services-in-huntingdonshire 30 Supporting the electoral process in Northumberland council, GeoPlace, 2015. Available at:
https://www.geoplace.co.uk/-/supporting-the-electoral-process-in-northumberland-council 31 Soctim, ‘Health and Social Care Integration – The Case for Place’, 2015. Available at: https://www.socitm.net
Key Findings
28
4.5.15 Emergency services
We found evidence of a significant downgrading of interaction between local authorities and
emergency services. Crime reduction partnerships, widely adopted and well-resourced in 2010
have been subject to budget cuts and changes in priorities in many localities. The sharing of
address information through information integration has consequently been considerably
reduced and is in many areas largely restricted to serious case reviews.
In respect to Fire and Rescue Services (FRS), considerable progress was made in some areas
during preparation for the now defunct Fire Control project, and the use of AddressBase within
despatch systems does occur. Some examples of best practice were found, such as the London
Fire Brigade, but these instances tend to be based on the enthusiasm of particular officers rather
than being a corporate priority. Key findings are as follows:
• There is clear potential for improved interaction in respect to initiatives such as fire safety
checks for vulnerable people.
• In view of the large “on the ground” work of FRS organisations, the potential as a source of
quality improvement of addresses is significant.
• Co-despatch trials between ambulance and fire services, requiring greater data integration within despatch services also has the potential to improve data quality if rolled-out nationally.

GeoPlace cost benefit analysis
29
5 GeoPlace cost benefit analysis
5.1 Quantification approach
The analysis covers the time period from 2010 to 2020. From 2010-2015 the benefits represent
those already realised and costs incurred (ex-post) and from 2016-2020 the estimated future
benefits and costs are predicted (ex-ante).
To establish benefits already realised (ex-post) we categorised those benefits to ensure an even
spread across a range of use cases (applications). We estimated current adoption levels and
future rates to a realistic horizon of 2020. The study focused on the largest and most irrefutable
benefits accepting that they only represent a proportion of potential benefits. This involved
looking for those case studies that supported existing policies or processes.
An annual time interval for the cash flows and both GeoPlace’s and local authority costs for an
estimation of costs to implement and maintain the LLPG and LSG. Quantifiable use cases with
demonstrable benefits formed the basis of the analysis.
In all cases conservative assumptions have been made. Sensitivity analysis has been used to
estimate lower and upper bound Return on Investment (RoI). We have also adjusted for
optimism bias that arises as those providing case studies tend to be those that have a positive
story to tell. A reduction in reported net benefits of 25% is used to counter optimism bias.
5.2 Costs summary
Operating costs were provided by GeoPlace and included:
• Staff costs
• Amortisation intangible assets
• Depreciation of tangible assets
• Other operating charges
• Auditors costs
• Operating lease rentals
Local Authority costs included:
• LLPG maintenance by 348 authorities with levels of effort based on:
- the 2016 telephone survey by GeoPlace
- the 2013 London survey
- miscellaneous other sources
GeoPlace cost benefit analysis
30
• Staff costs from the most recent LGA survey32.
• Staff costs were overheaded at 30% to include general overhead and LLPG software costs.
• An additional £100,000 per authority has been assumed for directly apportioned costs of
integration projects over the 10 year life cycle. This value was tested with the validation
panel and confirmed as a reasonable assumption.
Costs incurred before 2010 are treated as “sunk costs” and not included in the evaluation.
For reasons of commercial sensitivity details of the cost breakdown for GeoPlace are not
detailed in the report.
5.3 Quantified use cases
The most widely adopted and quantifiable use cases identified by our research were:
1. Benefits from data sharing and integration using the UPRN, such as reduced data entry
and automatic e-forms population.
2. Revenue and Benefit Analysis reducing benefits fraud and generating additional council
tax revenue.
3. Waste Management improvements through route optimisation.
4. Channel Shift whereby web services are reducing face to face and telephone contact.
These four types of quantifiable use cases are the building blocks of the cost benefit analysis.
5.4 Data sharing and integration savings
The basis of the calculation is the Improvement Schedules for April 2014 and April 2015 supplied
by GeoPlace. These indicate the volume of changes made to the LLPG over the preceding 12
months. The number of Full Time Equivalent (FTE) staff who made these changes is based on a
sample survey of local authorities and a regional survey from 2013 of London Boroughs. The
average time taken to make each change is calculated by dividing the number of changes by the
staff time available. The number of systems integrated with the master UPRN database based
on live link counts in the improvement schedules have then been used to estimate the savings.
A more detailed description of the methodology is contained in a separate document supplied
with the financial model.
5.5 Regression analysis example: council tax
The quantification of the remaining use cases used regression analysis as shown below. The
total annual expenditure of the local authority is plotted against the increase in revenue
reported in a series of case studies and a “best fit” represented by a single line using least
squares is generated. The last point on the straight line represents a total figure for a group of
32 http://www.local.gov.uk/research-pay-and-workforce
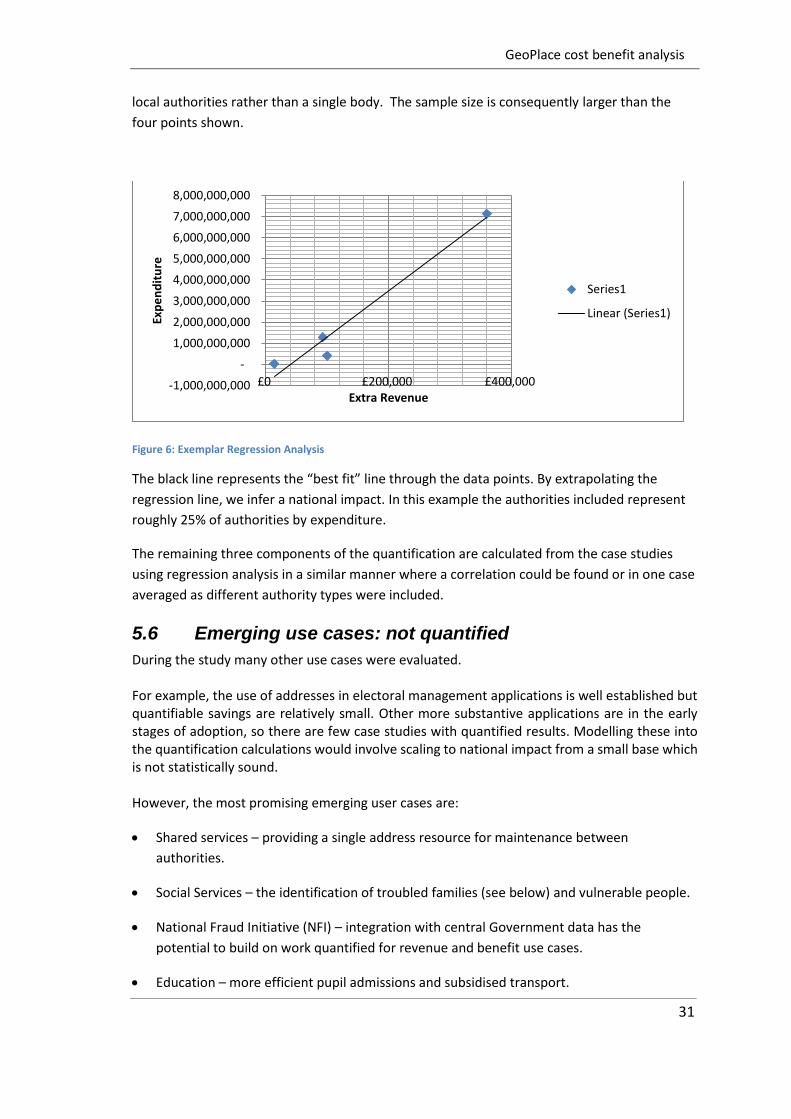
GeoPlace cost benefit analysis
31
local authorities rather than a single body. The sample size is consequently larger than the
four points shown.
Figure 6: Exemplar Regression Analysis
The black line represents the “best fit” line through the data points. By extrapolating the
regression line, we infer a national impact. In this example the authorities included represent
roughly 25% of authorities by expenditure.
The remaining three components of the quantification are calculated from the case studies
using regression analysis in a similar manner where a correlation could be found or in one case
averaged as different authority types were included.
5.6 Emerging use cases: not quantified
During the study many other use cases were evaluated. For example, the use of addresses in electoral management applications is well established but quantifiable savings are relatively small. Other more substantive applications are in the early stages of adoption, so there are few case studies with quantified results. Modelling these into the quantification calculations would involve scaling to national impact from a small base which is not statistically sound. However, the most promising emerging user cases are:
• Shared services – providing a single address resource for maintenance between
authorities.
• Social Services – the identification of troubled families (see below) and vulnerable people.
• National Fraud Initiative (NFI) – integration with central Government data has the
potential to build on work quantified for revenue and benefit use cases.
• Education – more efficient pupil admissions and subsidised transport.
-1,000,000,000
-
1,000,000,000
2,000,000,000
3,000,000,000
4,000,000,000
5,000,000,000
6,000,000,000
7,000,000,000
8,000,000,000
£0 £200,000 £400,000
Exp
en
dit
ure
Extra Revenue
Series1
Linear (Series1)

GeoPlace cost benefit analysis
32
• Emergency services – improving the quality of LLPG/LSG.
Examples from a selection of these use cases are examined in more detail below.
5.6.1 Social services example: Troubled Families
The integration of council core systems (Benefits, Education and Address Gazetteer) has been
used as a basis for analysis in one northern Unitary Authority. This has resulted in the following
benefits:
• Supporting evidence for grant applications on known cases.
• Identification of new potential cases for follow-up by social services.
• Resulting grants leveraged by analysis (see figure 7 below).
Figure 7: Unitary Authority Troubled Families Grants
Clearly, the grants resulting from this work cannot be claimed directly as benefits of the address
data, other datasets were part of the project. However, if a method for apportionment of
benefits can be agreed then benefits from such exercises can be included in future analyses.
5.6.2 Education example: London Grid for Learning
The London Grid for Learning (LGfL) has implemented a number of data integration initiatives
that relate school admissions to the UPRN. The move to having waiting lists online has been
enabled by the UPRN being in both the child record and the online account tool. The savings in
staff time from the reduced workload, particularly on appeals, in a single London Borough has
been estimated at £55k per annum.
Scaling this to all London Boroughs (on the basis of population) would result in savings of the
order of £1.9m per annum. Taking a conservative view of the attribution to the LLPG as 10%
compared to the next best alternative (PAF), this equates to a potential benefits of £190k per
annum for London.

GeoPlace cost benefit analysis
33
5.6.3 National Fraud Initiative
The National Fraud Initiative (NFI)33 is an exercise that matches electronic data within and
between public and private sector bodies to prevent and detect fraud.
The NFI presented to a regional meeting of address and street custodians in 2015. Figure 8:
National Fraud Initiative Outcomes is part of that presentation and highlights the scale of
potential benefits from the data matching service that it offers. The rows highlighted in orange
are those where address data can potentially enhance the matching process.
Source: Audit Commission
Figure 8: National Fraud Initiative Outcomes
33 https://www.gov.uk/guidance/national-fraud-initiative-additional-public-services
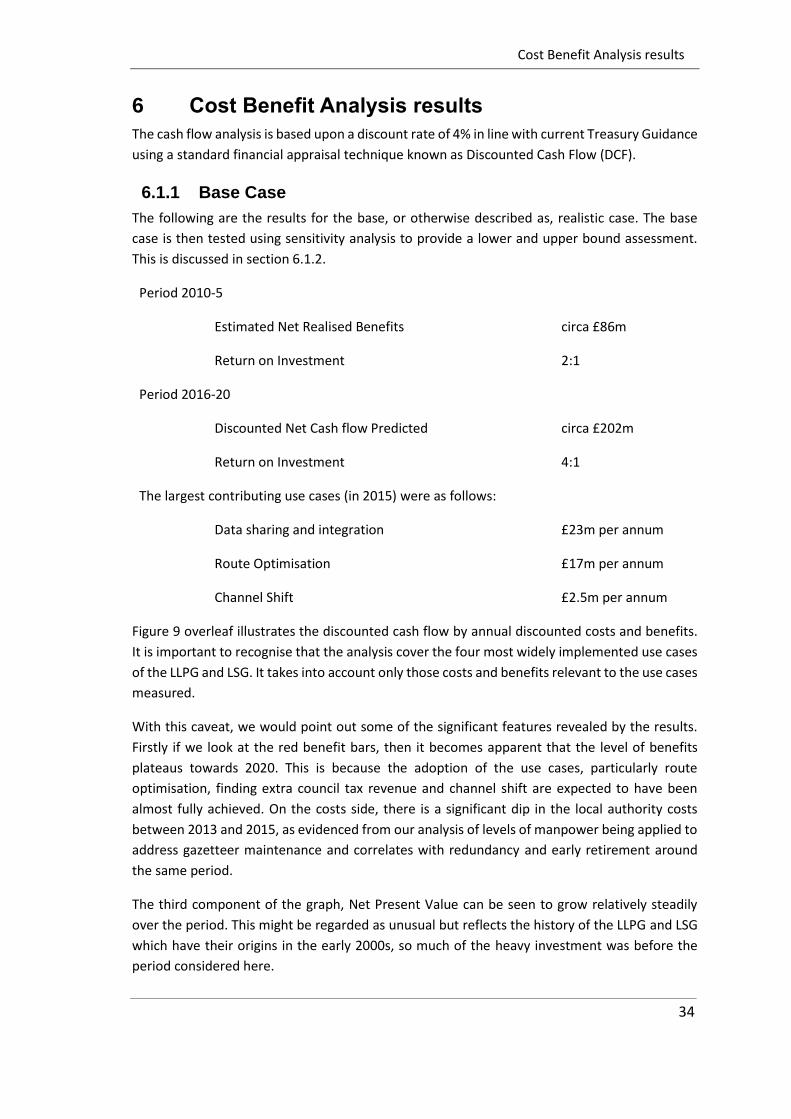
Cost Benefit Analysis results
34
6 Cost Benefit Analysis results
The cash flow analysis is based upon a discount rate of 4% in line with current Treasury Guidance
using a standard financial appraisal technique known as Discounted Cash Flow (DCF).
6.1.1 Base Case
The following are the results for the base, or otherwise described as, realistic case. The base
case is then tested using sensitivity analysis to provide a lower and upper bound assessment.
This is discussed in section 6.1.2.
Period 2010-5
Estimated Net Realised Benefits circa £86m
Return on Investment 2:1
Period 2016-20
Discounted Net Cash flow Predicted circa £202m
Return on Investment 4:1
The largest contributing use cases (in 2015) were as follows:
Data sharing and integration £23m per annum
Route Optimisation £17m per annum
Channel Shift £2.5m per annum
Figure 9 overleaf illustrates the discounted cash flow by annual discounted costs and benefits.
It is important to recognise that the analysis cover the four most widely implemented use cases
of the LLPG and LSG. It takes into account only those costs and benefits relevant to the use cases
measured.
With this caveat, we would point out some of the significant features revealed by the results.
Firstly if we look at the red benefit bars, then it becomes apparent that the level of benefits
plateaus towards 2020. This is because the adoption of the use cases, particularly route
optimisation, finding extra council tax revenue and channel shift are expected to have been
almost fully achieved. On the costs side, there is a significant dip in the local authority costs
between 2013 and 2015, as evidenced from our analysis of levels of manpower being applied to
address gazetteer maintenance and correlates with redundancy and early retirement around
the same period.
The third component of the graph, Net Present Value can be seen to grow relatively steadily
over the period. This might be regarded as unusual but reflects the history of the LLPG and LSG
which have their origins in the early 2000s, so much of the heavy investment was before the
period considered here.
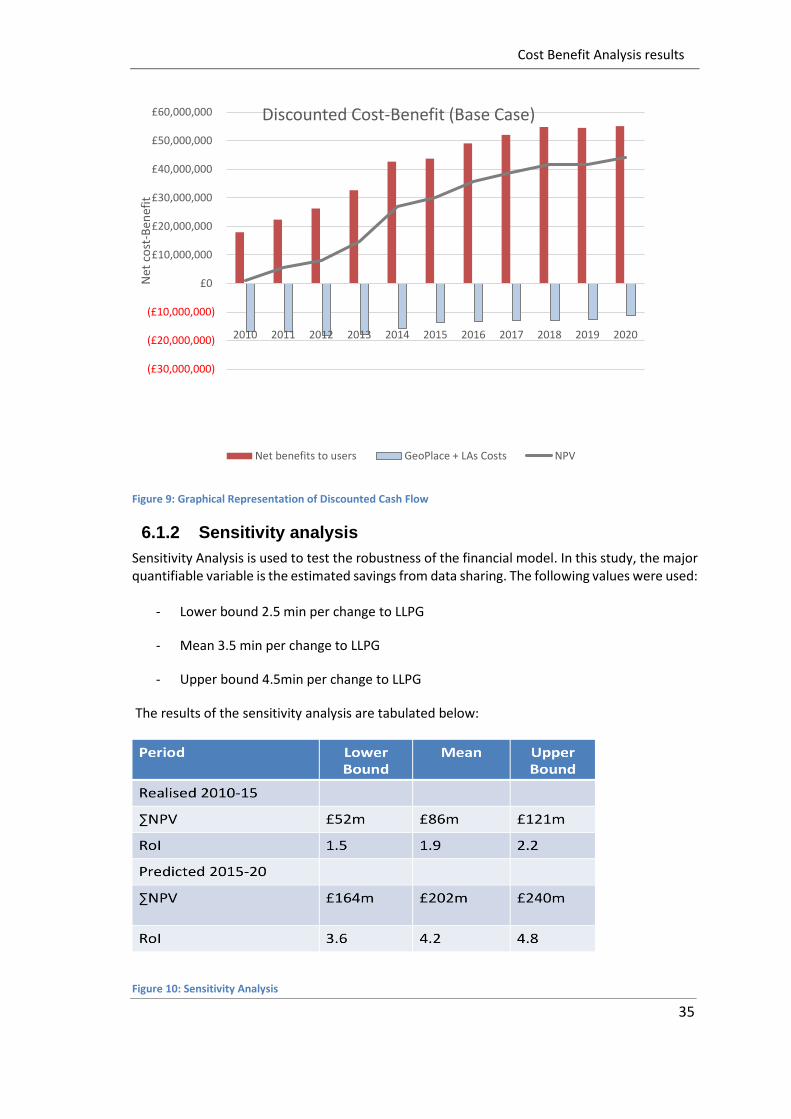
Cost Benefit Analysis results
35
Figure 9: Graphical Representation of Discounted Cash Flow
6.1.2 Sensitivity analysis
Sensitivity Analysis is used to test the robustness of the financial model. In this study, the major quantifiable variable is the estimated savings from data sharing. The following values were used:
- Lower bound 2.5 min per change to LLPG
- Mean 3.5 min per change to LLPG
- Upper bound 4.5min per change to LLPG
The results of the sensitivity analysis are tabulated below:
Figure 10: Sensitivity Analysis
(£30,000,000)
(£20,000,000)
(£10,000,000)
£0
£10,000,000
£20,000,000
£30,000,000
£40,000,000
£50,000,000
£60,000,000
2010 2011 2012 2013 2014 2015 2016 2017 2018 2019 2020
Net
co
st-B
enef
it
Discounted Cost-Benefit (Base Case)
Net benefits to users GeoPlace + LAs Costs NPV

Cost Benefit Analysis results
36
6.2 Validation: LGA Study 2010
In order to independently validate the analysis, the study examined previous work undertaken
in this field.
6.2.1 Denmark
The Danish study referenced in section 3, reports a Return on Investment (RoI) of over 30:1,
much higher than reported here. Clearly a major factor is the scope of benefits which in the
Danish case is much wider than the local authority sector. Also, one needs to consider that
Denmark is starting from a very much higher base of integration. The synchronisation of base
registers, including complete integration of addresses with for instance national building,
cadastral and taxation records has been in place for more than 10 years. In consequence, the
costs of maintenance are shared more widely across the public service, reducing the cost base
attributable to the address register significantly.
Furthermore the size of the problem of achieving consistency and maintaining currency is much
smaller, as it is a country of only 4 million citizens, less than 10% of the population of England
and Wales. There are also cultural differences that lead to much reduced issues around
information governance which in the UK still restrict data sharing.
6.2.2 Australia
The G-NAF experience also reported in Section 3.3, validates the range of use cases where
benefits can potentially be realised. The recent announcement that G-NAF has become part of
Australia’s open data resource is recognition by their Government of address data as a
fundamental part of the national information infrastructure.
6.2.3 England and Wales: Geospatial Value Study
In 2010, what was then the National Land and Property Gazetteer (NLPG) was included within
a study for the Local Government Association (LGA) assessing the value of geospatial
information34. Only the data sharing component was considered but the predicted results from
that study bear comparison with the present study. Figure 11: LGA Study - Data Sharing Benefits
shows the predicted benefits at around £17.7m in 2014-5. The figure predicted by the current
study exceeds that level at about £27.4m. The availability of more accurate statistics for the
savings in the cost of making changes to the gazetteer, from GeoPlace improvement schedules,
only available since 2013 is the most likely cause of the difference.
34 The Value of Geospatial Information to Local Public Service Delivery in England and Wales
http://www.local.gov.uk/research-geographic-information

Cost Benefit Analysis results
37
Figure 11: LGA Study - Data Sharing Benefits
6.3 Limitations of the financial analysis
The following limitations of the financial analysis need to be taken into consideration in using these results:
• A limited set of use cases was included in the quantification. These were chosen to be easily
understood and defensible. However, this may under-estimate the true level of benefits.
• Values have been extrapolated from a limited sample of case studies. As some values may
not be representative those used in calculations have been reduced by 25% to counter any
positive bias of case studies.
• The panel of experts used to validate assumptions do not have perfect knowledge of practice
in all local authorities.
• The adoption rates and levels of expenditure are based on consultants’ judgement from case
study and market evidence.
• Predictions about the future are inherently uncertain.
It is also important to note that the RoI is based on a subset of the applications in which the
address and street gazetteer are deployed. It is therefore a conservative production and the
actual levels may be higher.
6.4 Economist review
The economist review was undertaken by Alan Smart of ACIL Allen, principal of a large economic
consultancy based in Sydney, Australia. He has led many of the largest economic studies
internationally in the geospatial field over the last decade
His review comments can be summarised as:
Cost Benefit Analysis results
38
• An approach using cost benefit analysis is appropriate for the nature and scale of the
investment.
• Negative discounts for years 2010-15 should be introduced into the discounted cash flow
calculation, to bring the cash flow to a consistent present value. NB This has been
implemented.
• Setting a project life cycle through to only 2020 is commensurate with an area of fast
developing technological change.
• It was a pragmatic and defensible position to not try to account for “sunk costs” from the
period before 2010.
• Case study scaling was justified although more examples would have further strengthened
the analysis.
The economist was also able to supply supportive evidence for Australian G-NAF project
included in the literature review.
6.5 Benefits realisation
Whilst the main purpose of the study was to produce a predicted RoI, the results will very quickly
become out of date as further implementations take place and other factor change.
Consequently, it is critical that a plan is put in place that commences as soon as possible to allow
the predicted benefits to be realised and evidence of their realisation measured and recorded
to allow future auditing.
The following Key Performance Indicators (KPIs) are suggested:
• Adoption rates for the quantified use cases to increase by 10% per annum.
• One new use case reaching 10% adoption per annum.
The “improvement schedule” represents the most easily adapted vehicle for measuring such
quantifiable improvement.
The questions asked in the improvement questionnaire will need only minor enhancement to
collect the following information:
• Number of FTEs employed on address maintenance and Street Naming and Numbering.
• Gazetteer change numbers - separate out into automated and manual types.
• Cost of UPRN-based integration projects completed (time and investments).

Barriers to adoption
39
7 Barriers to adoption
Through the course of the study, the team had many useful conversations regarding how the
process of adoption into a wider range of applications might be facilitated. In this section we
examine the evidence and attempt to draw some conclusions as to the most useful actions to
reduce the “barrier to adoption”.
7.1 Survey Analysis
The results of the survey question regarding barriers to adoption are shown in below.
Figure 12: Barriers to Adoption
Respondents were asked to choose the key constraints (biggest barrier) shown in yellow and the
next most significant barrier (in blue). Summarising the results for the 73 (41%) who answered
the question we found that:
• The lack of funds and fully occupied staff are the main constraints.
• The lack of management awareness is a contributing factor.
• Many of the narrative comments related to the impact of software limitations.
It would also suggest that the capability of staff to undertake the necessary work is not a
significant constraint.

Barriers to adoption
40
7.2 Analysis
Whilst many initiatives were suggested to the team, our belief is that focusing on a small number
of areas may be most beneficial. The following are we believe most strategically important:
i) Intercepting the digital transformation agenda
Currently almost all available effort in local authorities is spent maintaining and
improving the quality of data. Limited access to additional resources, in many cases
within the business function but in other cases from within mainstream IT, would
have potentially significant impact on the rate of integration and thereby accelerate
the flow of benefits.
ii) Engaging senior management
At individual councils there is a need for better C-level briefing materials, this was
recently underscored during discussions at the GeoPlace conference – too often it
was observed that anything concerning gazetteers was passed unseen from CEOs to
custodians, defeating the object of targeting them.
iii) Working at a national level with partners
A number of potential partners who might help reduce barriers at a national level
by working collaboratively together were identified. Principal amongst these are
Nesta, Socitm and Solace.
iv) Quick wins
Identifying examples of authorities where individuals have achieve success with
short-term impact but requiring limited resource. Demonstrable success can then
be used to build the case for more far reaching projects.
v) Building national models
Collaborating with DCLG’s digital local success on waste management as a national
model for other use cases.
By adopting these measures, we estimate that the return on investment could be increased by circa £20m over the next 5 years.

Recommendations
41
8 Recommendations
We recommend a sustained, multi-faceted, marketing campaign based on the results of this
study. The core messages to communicate to local authorities should be:
• The substantial benefits that have been realised from past investment.
• The need for current staffing levels and product quality to be maintained in order to realise
greater benefits in the future.
• The multiple opportunities for enhanced benefits tied to national efficiency initiatives, such
as the successful Troubled Families scheme.
GeoPlace is recommended to:
i) Enhance collaboration with bodies working at a national level such as the Audit Commission
(NFI), Socitm, CIO Council, DCLG and Nesta.
ii) Further promote examples of best practice across a wider range of business functions such as
education and social services. The value of data sharing with emergency services should also be
re-emphasised.
iii) Work more closely with the Ordnance Survey to promote the use of AddressBase for local
authority functions where out of area coverage is required.
iv) Advocate and work towards replicating DCLG schemes such as the DCLG Local Digital Project
for Local Waste Service Standards for other use cases.
v) Establish key performance indicators that allow realised benefits to be regularly (annually
quantified). To support the key performance indicators the improvement schedules should be
extended.
End of Document