Geophysical Journal Internationaldigital.csic.es/bitstream/10261/131451/1/Macchiavelli... ·...
19
Geophysical Journal International Geophys. J. Int. (2016) 205, 408–426 doi: 10.1093/gji/ggw022 GJI Geodynamics and tectonics Plate kinematics of the central Atlantic during the Oligocene and early Miocene Antonio Schettino 1 and Chiara Macchiavelli 1, 2 1 School of Science and Technology – Geology Division, University of Camerino, Via Gentile III da Varano, I-62032 Camerino (MC), Italy. E-mail: [email protected] 2 Institute of Earth Sciences Jaume Almera, ICTJA-CSIC, Lluis Sole i Sabaris s/n, E-08028 Barcelona, Spain Accepted 2016 January 15. Received 2016 January 14; in original form 2015 September 14 SUMMARY A new plate motions model for the northwest Africa–North America Plate pair during the Oligocene and early Miocene is presented. The model is accompanied by a high-resolution isochron map for the central Atlantic region, resulting from a re-examination of 423 ship tracks from the NGDC data base for the area between the 15 ◦ 20 FZ and the Azores triple junction. A new digital model of fracture zones for this region and a set of 309 magnetic profiles crossing the Oligocene to recent oceanic crust within the study area allowed to determine accurate finite reconstruction poles for the North America–northwest Africa conjugate plate pair between the early Miocene (Chron 6) and the early Oligocene (Chron 13). For times older than Chron 7 (∼25 Ma), the finite reconstruction poles were calculated using a reliable data set coming exclusively from the region south of the Canary Islands FZ (∼32 ◦ N), which allowed to test the rigidity of the northwest African oceanic lithosphere during the Oligocene– early Miocene phase of Atlas orogeny. A comparison of theoretical magnetic isochrons with observed magnetic lineations systematically shows that anomalously high spreading rates occurred in the area north of the Canary Islands FZ before Chron 7, thereby suggesting that the formation of the Atlas mountain, rather than being a localized intracontinental process, was logically linked to the central Atlantic spreading history. Thus, an independent Moroccan Plate could have existed during the Oligocene–early Miocene time interval, which included both the oceanic lithosphere north of the Canary Islands FZ and the northern Maghrebian areas of Morocco, Algeria and Tunisia. In this eventuality, the Atlas mountain belt should be reinterpreted as a giant flower structure associated with dextral transpression. Key words: Plate motions; Magnetic anomalies: modelling and interpretation; Marine mag- netics and palaeomagnetics. 1 INTRODUCTION Although the kinematics of the central Atlantic region has been studied extensively since the 1960s (Heirtzler et al. 1968; Le Pi- chon & Fox 1971; Pitman & Talwani 1972; Francheteau 1973; Sclater et al. 1977; Olivet et al. 1984; Klitgord & Schouten 1986; Sundvik & Larson 1988; Roest et al. 1992; Schettino & Turco 2009; Labails et al. 2010; Merkouriev & DeMets 2014), the com- plexity of the ridge processes that occurred in this area during the Cenozoic has raised a series of intriguing questions that are still waiting for a satisfactory answer. For example, several V-shaped structures can be observed around the mid-Atlantic Ridge (MAR), which are uncommon along other oceanic spreading centres. These features have been interpreted alternatively as minor fracture zones (Rona 1976; Rona & Gray 1980), traces of volcanic segments that propagate along the plate boundary as a consequence of astheno- spheric axial flow (Schouten et al. 1987; M¨ uller & Roest 1992), traces of melting anomalies associated with ridge–plume interac- tion (Vogt 1971; White 1997; Escart´ ın et al. 2001; Jones et al. 2002). Another unsolved problem is represented by the formation of the Atlas mountain belt in northwest Africa, which has been generally considered either as an Alpine chain (i.e. related to the convergence between Africa and Eurasia, e.g. Hafid et al. 2006) or as an intracontinental mountain range that experienced moderate crustal shortening and exhumation as a result of crustal isostatic and dynamic topography (e.g. Teixell et al. 2003). To date, only a few authors have debated these mainstream interpretations, either on the basis of kinematic (Schettino & Turco 2009; Schettino et al. 2010) or geological (Malus` a et al. 2007; Ellero et al. 2012) evidence. In this study, we present the first high-resolution kinematic model of the central Atlantic for the time interval comprised between the early Oligocene and the early Miocene, with the objective to help 408 C The Authors 2016. Published by Oxford University Press on behalf of The Royal Astronomical Society. at Centre Mediterrani d'Investions Marines y Ambientals on April 26, 2016 http://gji.oxfordjournals.org/ Downloaded from
Transcript of Geophysical Journal Internationaldigital.csic.es/bitstream/10261/131451/1/Macchiavelli... ·...

Geophysical Journal InternationalGeophys. J. Int. (2016) 205, 408–426 doi: 10.1093/gji/ggw022
GJI Geodynamics and tectonics
Plate kinematics of the central Atlantic during the Oligoceneand early Miocene
Antonio Schettino1 and Chiara Macchiavelli1,2
1School of Science and Technology – Geology Division, University of Camerino, Via Gentile III da Varano, I-62032 Camerino (MC), Italy.E-mail: [email protected] of Earth Sciences Jaume Almera, ICTJA-CSIC, Lluis Sole i Sabaris s/n, E-08028 Barcelona, Spain
Accepted 2016 January 15. Received 2016 January 14; in original form 2015 September 14
S U M M A R YA new plate motions model for the northwest Africa–North America Plate pair during theOligocene and early Miocene is presented. The model is accompanied by a high-resolutionisochron map for the central Atlantic region, resulting from a re-examination of 423 ship tracksfrom the NGDC data base for the area between the 15◦20′ FZ and the Azores triple junction.A new digital model of fracture zones for this region and a set of 309 magnetic profilescrossing the Oligocene to recent oceanic crust within the study area allowed to determineaccurate finite reconstruction poles for the North America–northwest Africa conjugate platepair between the early Miocene (Chron 6) and the early Oligocene (Chron 13). For timesolder than Chron 7 (∼25 Ma), the finite reconstruction poles were calculated using a reliabledata set coming exclusively from the region south of the Canary Islands FZ (∼32◦N), whichallowed to test the rigidity of the northwest African oceanic lithosphere during the Oligocene–early Miocene phase of Atlas orogeny. A comparison of theoretical magnetic isochrons withobserved magnetic lineations systematically shows that anomalously high spreading ratesoccurred in the area north of the Canary Islands FZ before Chron 7, thereby suggesting thatthe formation of the Atlas mountain, rather than being a localized intracontinental process,was logically linked to the central Atlantic spreading history. Thus, an independent MoroccanPlate could have existed during the Oligocene–early Miocene time interval, which includedboth the oceanic lithosphere north of the Canary Islands FZ and the northern Maghrebianareas of Morocco, Algeria and Tunisia. In this eventuality, the Atlas mountain belt should bereinterpreted as a giant flower structure associated with dextral transpression.
Key words: Plate motions; Magnetic anomalies: modelling and interpretation; Marine mag-netics and palaeomagnetics.
1 I N T RO D U C T I O N
Although the kinematics of the central Atlantic region has beenstudied extensively since the 1960s (Heirtzler et al. 1968; Le Pi-chon & Fox 1971; Pitman & Talwani 1972; Francheteau 1973;Sclater et al. 1977; Olivet et al. 1984; Klitgord & Schouten 1986;Sundvik & Larson 1988; Roest et al. 1992; Schettino & Turco2009; Labails et al. 2010; Merkouriev & DeMets 2014), the com-plexity of the ridge processes that occurred in this area during theCenozoic has raised a series of intriguing questions that are stillwaiting for a satisfactory answer. For example, several V-shapedstructures can be observed around the mid-Atlantic Ridge (MAR),which are uncommon along other oceanic spreading centres. Thesefeatures have been interpreted alternatively as minor fracture zones(Rona 1976; Rona & Gray 1980), traces of volcanic segments thatpropagate along the plate boundary as a consequence of astheno-
spheric axial flow (Schouten et al. 1987; Muller & Roest 1992),traces of melting anomalies associated with ridge–plume interac-tion (Vogt 1971; White 1997; Escartın et al. 2001; Jones et al.2002). Another unsolved problem is represented by the formationof the Atlas mountain belt in northwest Africa, which has beengenerally considered either as an Alpine chain (i.e. related to theconvergence between Africa and Eurasia, e.g. Hafid et al. 2006)or as an intracontinental mountain range that experienced moderatecrustal shortening and exhumation as a result of crustal isostatic anddynamic topography (e.g. Teixell et al. 2003). To date, only a fewauthors have debated these mainstream interpretations, either on thebasis of kinematic (Schettino & Turco 2009; Schettino et al. 2010)or geological (Malusa et al. 2007; Ellero et al. 2012) evidence.
In this study, we present the first high-resolution kinematic modelof the central Atlantic for the time interval comprised between theearly Oligocene and the early Miocene, with the objective to help
408 C© The Authors 2016. Published by Oxford University Press on behalf of The Royal Astronomical Society.
at Centre M
editerrani d'Investions Marines y A
mbientals on A
pril 26, 2016http://gji.oxfordjournals.org/
Dow
nloaded from

Plate kinematics of the central Atlantic 409
Figure 1. Study area, showing available ship-track data from the GEODAS–NGDC (black dashed lines). ECMA, East Coast Magnetic Anomaly; BSMA,Blake Spur Magnetic Anomaly; CI, Canary Islands.
understanding the processes that occurred in this region during thelast 33 Myr. In particular, we are going to test if the oceanic litho-sphere to the east of the MAR behaved as a single northwest AfricanPlate, as assumed in the classic models, or alternatively that a sep-arate Moroccan Plate existed during the Oligocene–early Mioceneas suggested by Schettino & Turco (2009). A second objective is toinvestigate the possibility that simple ridge kinematics may providean alternative explanation for the observed V-shaped structures. Fi-nally, we want to test if secondary tectonic stages existed, associatedwith changes in plate motions, during the time interval between theearly Oligocene and the early Miocene within the ‘canonical’ stagesbounded by anomalies 13 (33.1 Ma), 8 (25.8 Ma) and 6 (20.1 Ma;e.g. Muller et al. 1999).
The study area includes the oceanic lithosphere between 15◦Nand the Azores triple junction (ATJ; Fig. 1). We used marine mag-netic data from 423 ship tracks in the NGDC data base to determinemagnetic anomaly picks, and the latest version (ver. 23) of the globalfree-air gravity anomaly map (Sandwell et al. 2014) to create an ac-curate digital model of fracture zones (Fig. 2). The resulting data setof magnetic anomaly crossings and fracture zones was used in theinversion algorithms to obtain finite reconstruction poles for NorthAmerica with respect to northwest Africa and to generate a newisochron map for the central Atlantic.
The formation of the Atlas mountain belt requires that northwestAfrica was subject to some amount of internal deformation duringthe Cenozoic. Therefore, it is of paramount importance to establishwhether or not it behaved as a single quasi-rigid plate during theOligocene–early Miocene time interval. When this research started,shortly after the publication of a paper from Schettino & Turco(2009) and the subsequent debate about the existence of an inde-pendent Moroccan Plate (Labails et al. 2010; Schettino et al. 2010),a high-resolution isochron chart for the central Atlantic region hadnot yet been published. However, a recent comprehensive studyfrom Merkouriev & DeMets (2014) has produced a detailed platemotions model between Nubia and North America since Anomaly6. Consequently, our results for times younger than Chron 6 arebriefly presented here only for completeness. For the time interval
between chrons 6 and 13, the results discussed in this study rep-resent the first attempt to describe accurately both ridge processesand plate motions in the central Atlantic region. We shall see thatthe magnetic evidence suggests the existence of an independentMoroccan Plate, because all the available magnetic profiles northof the Canary Islands FZ (CIFZ) show higher spreading rates fortimes older than Anomaly 7 (∼25 Ma), which correlates with thetiming of the Atlas orogeny. Therefore, the model presented heresupports the possibility that the CIFZ was temporarily convertedinto a right-lateral strike-slip plate boundary during the Cenozoic,allowing eastward escape of an independent Moroccan Plate.
2 F R A C T U R E Z O N E S O F T H E C E N T R A LAT L A N T I C R E G I O N
In addition to magnetic anomaly crossings, quantitative determina-tion of the seafloor spreading history of an oceanic basin requires anaccurate identification of transform faults and fracture zone trends,because these features constrain Euler pole locations in the inver-sion procedure. As mentioned above, we used the recent globalfree-air gravity anomaly map of Sandwell et al. (2014) to digitizefracture zone segments in the central Atlantic (Fig. 2). In the re-sulting digital model, four active V-shaped structures were assumedto be composed by oblique alignments of small abandoned trans-form faults, according to the process described below. Therefore,they were included in the compilation as lineations formed by smallfracture zone segments. However, these data did not participate tothe inversion procedure for determining finite reconstruction poles,because only sampling points from the large-offset fracture zoneswere used for that purpose.
It is well known that V-shaped structures around spreading ridgesoriginate from spot features of the newly forming oceanic litho-sphere, which shift longitudinally along the axial zone (either north-wards or southwards in the case of the MAR). In the north Atlanticand Azores region, these structures assume the form of narrowridges that start at the axial zone and are disposed symmetrically
at Centre M
editerrani d'Investions Marines y A
mbientals on A
pril 26, 2016http://gji.oxfordjournals.org/
Dow
nloaded from

410 A. Schettino and C. Macchiavelli
Figure 2. Central Atlantic fracture zones, identified on the basis of gravity anomaly data (black lines). The background raster shows free-air gravity anomalies(Sandwell et al. 2014).
Figure 3. Active V-shaped structures in the central Atlantic.
about the spreading centre (Gente et al. 1995; Escartın et al. 2001;Jones et al. 2002). Their geometry suggests that they are associatedeither with flow of hot spot material or melting regime anomaliesthat migrate at high velocity, up to 122 mm yr–1 around Iceland.Conversely, the active V-shaped structures that can be observed be-tween 19◦N and 26◦N in the central Atlantic are depressions ratherthan ridges, which form large angles with the axial zone (Fig. 3).
In this instance, the velocity of migration along the axial zone israther low, ranging between 2.7 and 5.2 mm yr–1. Furthermore, andmost importantly, they always appear in combination with inter-rupted fracture zones. In fact, Figs 2 and 3 show four fracture zonesthat terminate at the outer ends of corresponding V-shaped struc-tures without reaching the spreading ridge. These observations ledus to postulate that the central Atlantic V-shaped structures were
at Centre M
editerrani d'Investions Marines y A
mbientals on A
pril 26, 2016http://gji.oxfordjournals.org/
Dow
nloaded from
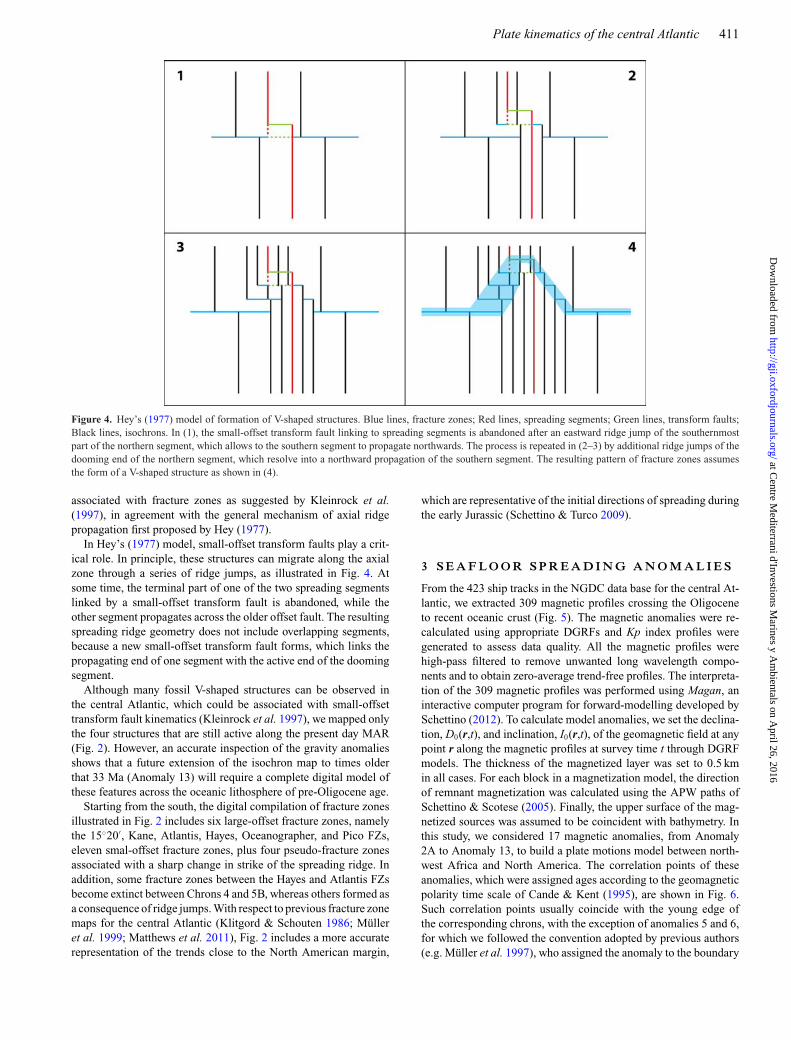
Plate kinematics of the central Atlantic 411
Figure 4. Hey’s (1977) model of formation of V-shaped structures. Blue lines, fracture zones; Red lines, spreading segments; Green lines, transform faults;Black lines, isochrons. In (1), the small-offset transform fault linking to spreading segments is abandoned after an eastward ridge jump of the southernmostpart of the northern segment, which allows to the southern segment to propagate northwards. The process is repeated in (2–3) by additional ridge jumps of thedooming end of the northern segment, which resolve into a northward propagation of the southern segment. The resulting pattern of fracture zones assumesthe form of a V-shaped structure as shown in (4).
associated with fracture zones as suggested by Kleinrock et al.(1997), in agreement with the general mechanism of axial ridgepropagation first proposed by Hey (1977).
In Hey’s (1977) model, small-offset transform faults play a crit-ical role. In principle, these structures can migrate along the axialzone through a series of ridge jumps, as illustrated in Fig. 4. Atsome time, the terminal part of one of the two spreading segmentslinked by a small-offset transform fault is abandoned, while theother segment propagates across the older offset fault. The resultingspreading ridge geometry does not include overlapping segments,because a new small-offset transform fault forms, which links thepropagating end of one segment with the active end of the doomingsegment.
Although many fossil V-shaped structures can be observed inthe central Atlantic, which could be associated with small-offsettransform fault kinematics (Kleinrock et al. 1997), we mapped onlythe four structures that are still active along the present day MAR(Fig. 2). However, an accurate inspection of the gravity anomaliesshows that a future extension of the isochron map to times olderthat 33 Ma (Anomaly 13) will require a complete digital model ofthese features across the oceanic lithosphere of pre-Oligocene age.
Starting from the south, the digital compilation of fracture zonesillustrated in Fig. 2 includes six large-offset fracture zones, namelythe 15◦20′, Kane, Atlantis, Hayes, Oceanographer, and Pico FZs,eleven smal-offset fracture zones, plus four pseudo-fracture zonesassociated with a sharp change in strike of the spreading ridge. Inaddition, some fracture zones between the Hayes and Atlantis FZsbecome extinct between Chrons 4 and 5B, whereas others formed asa consequence of ridge jumps. With respect to previous fracture zonemaps for the central Atlantic (Klitgord & Schouten 1986; Mulleret al. 1999; Matthews et al. 2011), Fig. 2 includes a more accuraterepresentation of the trends close to the North American margin,
which are representative of the initial directions of spreading duringthe early Jurassic (Schettino & Turco 2009).
3 S E A F L O O R S P R E A D I N G A N O M A L I E S
From the 423 ship tracks in the NGDC data base for the central At-lantic, we extracted 309 magnetic profiles crossing the Oligoceneto recent oceanic crust (Fig. 5). The magnetic anomalies were re-calculated using appropriate DGRFs and Kp index profiles weregenerated to assess data quality. All the magnetic profiles werehigh-pass filtered to remove unwanted long wavelength compo-nents and to obtain zero-average trend-free profiles. The interpreta-tion of the 309 magnetic profiles was performed using Magan, aninteractive computer program for forward-modelling developed bySchettino (2012). To calculate model anomalies, we set the declina-tion, D0(r,t), and inclination, I0(r,t), of the geomagnetic field at anypoint r along the magnetic profiles at survey time t through DGRFmodels. The thickness of the magnetized layer was set to 0.5 kmin all cases. For each block in a magnetization model, the directionof remnant magnetization was calculated using the APW paths ofSchettino & Scotese (2005). Finally, the upper surface of the mag-netized sources was assumed to be coincident with bathymetry. Inthis study, we considered 17 magnetic anomalies, from Anomaly2A to Anomaly 13, to build a plate motions model between north-west Africa and North America. The correlation points of theseanomalies, which were assigned ages according to the geomagneticpolarity time scale of Cande & Kent (1995), are shown in Fig. 6.Such correlation points usually coincide with the young edge ofthe corresponding chrons, with the exception of anomalies 5 and 6,for which we followed the convention adopted by previous authors(e.g. Muller et al. 1997), who assigned the anomaly to the boundary
at Centre M
editerrani d'Investions Marines y A
mbientals on A
pril 26, 2016http://gji.oxfordjournals.org/
Dow
nloaded from

412 A. Schettino and C. Macchiavelli
Figure 5. Traces of magnetic profiles used in this study (blue lines).
between the main normal and reversed polarity chrons. A correla-tion chart for the whole set of 309 magnetic profiles, showing thealignment of identified anomalies around the MAR, can be foundin the supporting information.
Fig. 7 shows the distribution of magnetic crossings for the se-lected anomalies, which were used in conjunction with fracture zonedata to determine finite Euler rotations of North America relativeto northwest Africa at anomaly times. These results are listed inTable 1. The best estimate of 1σ random noise in anomaly pickingvaries between 2.5 and 4.1 km. It is important to note that wideareas in the central Atlantic have poor coverage of anomaly cross-ings, notably below 23◦N and above 32◦N. As a consequence, finitereconstruction poles for anomalies older than Anomaly 5 are con-strained by a much lower number of spreading ridge segments, asindicated by the dramatic decrease in degrees of freedom (DOF)for the Euler rotations older than 11 Ma in Table 1. We used an im-proved version of Hellinger’s algorithm (Hellinger 1981), includedin the software PLACA (Matias et al. 2005), to determine finitereconstruction poles for anomalies 2A, 3, 3A, 4, 5, 5B, 5C, 5D,5E, 6, 6B, 7, 8, 9, 10, 12 and 13. Fig. 8 shows the superpositionof magnetic anomaly crossings and crossings reconstructed usingthe best-fitting rotations listed in Table 1. These data were used tobuild magnetic lineations and isochrons according to standard pro-cedures (e.g. Schettino 2014). The resulting isochron chart for thecentral Atlantic since Anomaly 13 is shown in Fig. 9. It illustratesthe ridge processes that occurred in this region starting from 33 Ma.For example, it is possible to note the coalescence of four spreadingsegments to form a single linear ridge between 31◦N and 34◦N afterAnomaly 5 or, alternatively, the split of a ridge segment to form twodistinct spreading segments separated by a transform fault around34◦N at anomaly 5 time (∼11 Ma). More to the south, the mapillustrates the effect of the axial migration of small-offset transform
faults described in the last section. Finally, we can observe severalepisodes of formation of pseudo-fracture zones as a consequenceof localized variations of spreading asymmetry (e.g. just south of25◦N or around 28◦N).
Starting from Anomaly 8, the finite reconstruction poles listed inTable 1 were calculated excluding crossings from the region northof the CIFZ, in order to test the rigidity of northwest Africa duringthe Oligocene–early Miocene phase of Atlas orogeny. This testcould not be performed determining rotation parameters directlyfrom crossings observed in the region comprised between 30◦N andthe ATJ, because the available data set was too sparse to allow areliable statistical estimation of rotation parameters. Consequently,in the isochron chart of Fig. 9, isochron segments north of the CIFZfrom Anomaly 8 to Anomaly 13 are substituted by representativemagnetic lineations.
The rotation parameters listed in Table 1 can be used to gener-ate velocity fields and create base maps for plate reconstructions.However, if they are used to predict local spreading rates and com-pare the results with observed values, it is necessary to correct forboth spreading asymmetry and outward displacement. An estimateof the spreading asymmetries associated with the isochron map ofFig. 9 is listed in Table 2. The asymmetry (α) was calculated by thefollowing formula:
α = 2�xE
v�t− 1, (1)
where �xE is the distance (in km) between two isochrons along theeastern side of the spreading ridge in the case of stage asymmetry,or the distance of an isochron from the ridge in the case of averageasymmetry. In eq. (1), v is the full spreading rate (in km Myr–1)while �t is the time interval between two isochrons or the ageof an isochron. The quantity α is positive when the width of the
at Centre M
editerrani d'Investions Marines y A
mbientals on A
pril 26, 2016http://gji.oxfordjournals.org/
Dow
nloaded from

Plate kinematics of the central Atlantic 413
Figure 6. Correlation points of magnetic anomalies. The lower panel shows the best fitting magnetization model and anomaly locations associated with anobserved magnetic profile (middle panel – black line). The red line shows the theoretical magnetic signal generated by such magnetization distribution. Theupper panel shows a constant-velocity model, obtained using the average full spreading velocity of the best-fitting model between anomaly 13 and the present.
crust accreted to the African side during some time interval �texceeded the width of the crust accreted to the North American side.From Table 2, we note that the overall spreading asymmetry sinceAnomaly 13 increased from ∼–10 per cent at the northern segmentto ∼0 per cent at the southernmost segment and that this trend isreproduced for the stage between anomalies 6 and 13. Therefore, therelative amount of crust that was accreted to North America sincethe Oligocene is higher in the northern part of the central Atlantic,so that the corresponding MAR segments were displaced eastwardswith respect to the southern segments.
In order to compare the spreading velocities predicted using thekinematic parameters listed in Table 1 with GPS data or other kine-matic models of current plate motions in the central Atlantic, weneed to correct the Euler pole relative to the stage (0–2A) for out-ward displacement (DeMets & Wilson 2008). An overall estimatecan be obtained introducing the angular outward displacement, δ�,which is the intercept of the best-fitting linear function of angulardisplacements � versus time t:
� (t) = kt + δ�. (2)
In this expression, k is the slope of the linear regression curve� = �(t) determined by stage poles. In this study, we had just twostage boundaries at anomalies 2A (t1 = 2.58 Ma) and 3 (t2 = 4.18Ma), and corresponding stage angles �1 = 0.56◦ and �2 = 0.34◦.Therefore, the slope resulted to be k = 0.2125◦ Myr–1. Hence, from(2) we easily obtain: δ� = 0.0118◦. This is the angular correction
that should be applied to the most recent Euler pole in Table 1.In terms of linear distances, at the northern and southern endsof the MAR we have: δxmin
∼= 1.14 km δxmax∼= 1.30 km, respec-
tively. These results are in agreement with the estimates of DeMets& Wilson (2008) and Merkouriev & DeMets (2014). In terms ofspreading rates, we obtain respectively vmin
∼= 20.67 mm yr–1 andvmax
∼= 23.61 mm yr–1 at the northern and southern ends of theMAR, instead of vmin
∼= 21.04 mm yr–1 and vmax∼= 24.04 mm yr–1
as calculated from the rotation model in Table 1.
4 P L AT E M O T I O N S A RO U N DT H E C E N T R A L AT L A N T I C S I N C ET H E O L I G O C E N E
Confidence ellipses for the rotation poles listed in Table 1 areshown in Figs 10 and 11. We note that the confidence ellipse ofAnomaly 3 is entirely included in the Anomaly 2A region of un-certainty. Therefore, it is not possible to distinguish, on a statisticalbasis, the stages 0–C2A and C2A–C3. Even taking into account ofthe angular velocities, they form a single stage that spans the last4.18 Myr. With the exception of Anomaly 5, the remaining Eulerpoles form a quite regular westward directed arrangement. Fig. 12shows a plot of the minimum and maximum spreading rates alongthe central Atlantic ridge. Of course, the maximum rate correspondsto the most distal point along the spreading ridge relative to the stage
at Centre M
editerrani d'Investions Marines y A
mbientals on A
pril 26, 2016http://gji.oxfordjournals.org/
Dow
nloaded from

414 A. Schettino and C. Macchiavelli
Figure 7. Distribution of magnetic anomaly crossings for anomalies 2A (2.58 Ma), 3 (4.18 Ma), 3A (5.89 Ma), 4 (7.43 Ma), 5 (10.95 Ma), 5B (14.80 Ma), 5C(16.01 Ma), 5D (17.28 Ma), 5E (18.28 Ma), 6 (20.13 Ma), 6B (22.59 Ma), 7 (24.73 Ma), 8 (25.82 Ma), 9 (27.03 Ma), 10 (28.28 Ma), 12 (30.48 Ma) and 13(33.06 Ma) (blue dots).
pole. This graph is much more informative of an angular velocityplot, because angular velocities may change also in absence of realspreading rate variations. In fact, they may change simply as a con-sequence of variations in the stage pole location, even in the caseof an approximately constant spreading rate. The plot in Fig. 12shows that the difference between maximum and minimum veloc-ity decreases with time, especially after 23 Ma. This indicates thatthe stage poles corresponding to the finite reconstructions listed inTable 1 have progressively moved away from the MAR. Regardingthe average spreading rate, it was subject to six major transitions atAnomaly 10 (28.28 Ma), 6 (20.13 Ma), 5D (17.28 Ma), 5C (16.01Ma), 5 (10.95 Ma) and 4 (7.43 Ma), with a sharp velocity drop at thelast stage boundary. Starting from 7.4 Ma (Anomaly 4), the averagespreading rate varies between 23 and 24 mm yr–1.
In the northern part of the central Atlantic, an important fea-ture of the magnetic crossings associated with anomalies older thanAnomaly 7 is represented by a systematic mismatch with corre-sponding rotated crossings. In fact, the latter are invariably displacedtoward the MAR by 30–35 km with respect to the conjugate mag-netic lineations. Fig. 13 shows the example of Anomaly 8 crossings.
Although the data set north of the CIFZ is incomplete and cannotbe used to determine reliable reconstruction poles, stage poles, andangular velocities for ages older than ∼25 Ma, the observed misfitof crossings is indicative of the fact that the spreading rates in thisarea could have been higher than that predicted by the southerndata set. Six high-quality magnetic profiles from this area are illus-trated in Figs 14(a)–(f). They show that the observed crossings foranomalies 8–13 are systematically displaced landwards from bothsides of the MAR with respect to theoretical crossings obtainedfrom the rotation parameters of Table 1, the latter being constrainedonly by magnetic data south of the CIFZ. Therefore, the magneticevidence suggests the possibility that an independent tectonic plateformed during the Oligocene in the northern part of the central At-lantic, at the expense of either the North American or the northwestAfrican Plate. In the former case, the western branch of the CIFZwas temporarily converted into a sinistral strike-slip fault and com-pressional structures formed along the North American margin. Inthe alternative scenario, the eastern branch of this fracture zone wasconverted into a dextral strike-slip fault and compressional struc-tures formed in northwest Africa (see fig. 6 in Schettino & Turco
at Centre M
editerrani d'Investions Marines y A
mbientals on A
pril 26, 2016http://gji.oxfordjournals.org/
Dow
nloaded from
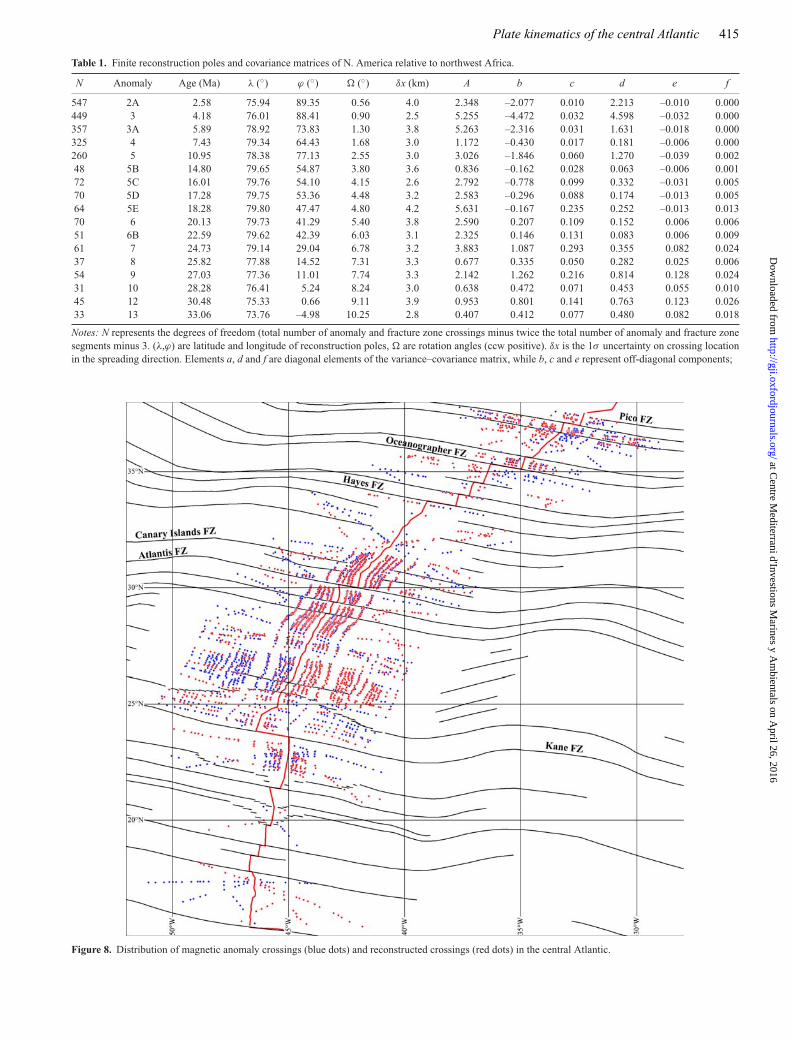
Plate kinematics of the central Atlantic 415
Table 1. Finite reconstruction poles and covariance matrices of N. America relative to northwest Africa.
N Anomaly Age (Ma) λ (◦) ϕ (◦) � (◦) δx (km) A b c d e f
547 2A 2.58 75.94 89.35 0.56 4.0 2.348 –2.077 0.010 2.213 –0.010 0.000449 3 4.18 76.01 88.41 0.90 2.5 5.255 –4.472 0.032 4.598 –0.032 0.000357 3A 5.89 78.92 73.83 1.30 3.8 5.263 –2.316 0.031 1.631 –0.018 0.000325 4 7.43 79.34 64.43 1.68 3.0 1.172 –0.430 0.017 0.181 –0.006 0.000260 5 10.95 78.38 77.13 2.55 3.0 3.026 –1.846 0.060 1.270 –0.039 0.00248 5B 14.80 79.65 54.87 3.80 3.6 0.836 –0.162 0.028 0.063 –0.006 0.00172 5C 16.01 79.76 54.10 4.15 2.6 2.792 –0.778 0.099 0.332 –0.031 0.00570 5D 17.28 79.75 53.36 4.48 3.2 2.583 –0.296 0.088 0.174 –0.013 0.00564 5E 18.28 79.80 47.47 4.80 4.2 5.631 –0.167 0.235 0.252 –0.013 0.01370 6 20.13 79.73 41.29 5.40 3.8 2.590 0.207 0.109 0.152 0.006 0.00651 6B 22.59 79.62 42.39 6.03 3.1 2.325 0.146 0.131 0.083 0.006 0.00961 7 24.73 79.14 29.04 6.78 3.2 3.883 1.087 0.293 0.355 0.082 0.02437 8 25.82 77.88 14.52 7.31 3.3 0.677 0.335 0.050 0.282 0.025 0.00654 9 27.03 77.36 11.01 7.74 3.3 2.142 1.262 0.216 0.814 0.128 0.02431 10 28.28 76.41 5.24 8.24 3.0 0.638 0.472 0.071 0.453 0.055 0.01045 12 30.48 75.33 0.66 9.11 3.9 0.953 0.801 0.141 0.763 0.123 0.02633 13 33.06 73.76 –4.98 10.25 2.8 0.407 0.412 0.077 0.480 0.082 0.018
Notes: N represents the degrees of freedom (total number of anomaly and fracture zone crossings minus twice the total number of anomaly and fracture zonesegments minus 3. (λ,ϕ) are latitude and longitude of reconstruction poles, � are rotation angles (ccw positive). δx is the 1σ uncertainty on crossing locationin the spreading direction. Elements a, d and f are diagonal elements of the variance–covariance matrix, while b, c and e represent off-diagonal components;
Figure 8. Distribution of magnetic anomaly crossings (blue dots) and reconstructed crossings (red dots) in the central Atlantic.
at Centre M
editerrani d'Investions Marines y A
mbientals on A
pril 26, 2016http://gji.oxfordjournals.org/
Dow
nloaded from

416 A. Schettino and C. Macchiavelli
Figure 9. Oligocene to recent isochron chart of the central Atlantic region. Dashed lines represent magnetic lineations.
Table 2. Spreading asymmetry between N. America and northwest Africa since Anomaly 13.
�xE An 1 – An 13 (km) �xE An 6 – An 13 (km) n◦ λ (◦) α An 1 – An 13 (per cent) α An 6 – An 13 (per cent)
457 180 1 30.76 –9.0 –14.4432 171 2 30.27 –13.9 –18.8417 155 3 29.75 –16.9 –26.4424 165 4 29.15 –15.5 –21.6441 170 5 27.37 –12.1 –19.5465 187 6 24.72 –7.4 –11.0484 182 7 24.16 –3.6 –13.5423 192 8 22.54 –15.7 –8.8458 193 9 21.02 –8.8 –8.3448 215 10 19.38 –10.8 +2.1459 231 11 18.7 –8.6 +9.9493 240 12 18.14 –1.8 +14.2513 236 13 17.09 +2.2 +12.1
Notes: �xE An 1 – An 13 is the offset of Anomaly 13 along a flow line from the eastern side of the MAR (km).�xE An 6 – An 13 is the distance between anomalies 13 and 6 along a flow line from the eastern side of the MAR (km). n◦ is a segmentnumber. λ is the latitude of the intersection between the selected flow line and the MAR. α An 1 – An 13 is the overall spreadingasymmetry since Anomaly 13. α An 6 – An 13 is the spreading asymmetry between anomalies 13 and 6.
at Centre M
editerrani d'Investions Marines y A
mbientals on A
pril 26, 2016http://gji.oxfordjournals.org/
Dow
nloaded from
Plate kinematics of the central Atlantic 417
Figure 10. Finite reconstruction poles and confidence ellipses for anomalies 2A, 3, 3A, 4, 5, 5B, 5C, 5D, 5E, 6 and 6B. Red stars ‘A’ and ‘K’ show the locationof modern Nubia–North America Euler poles of Argus et al. (2010) and Kogan & Steblov (2008), respectively, and their confidence ellipses (grey line).
Figure 11. Finite reconstruction poles and confidence ellipses for anomalies 7, 8, 9, 10, 12 and 13. Red star shows the 3-Myr-average MORVEL Nubia–NorthAmerica pole (DeMets et al. 2010). Red square ‘2An.1 M&D’ shows the location of Merkouriev & DeMets (2014) opening pole for Anomaly 2An.1. Red dots‘8 M’, and ‘13 M’ show the locations of Muller et al. (1999) total reconstruction poles for anomalies 8 and 13.
2009). Of course, the latter is the sole possibility that is compati-ble with geological evidence, as the unique event of compressionalong the conjugate margins occurred in the Atlas region of north-west Africa, while coeval magmatic activity in the Canary Islandsis compatible with a location close to a plate boundary.
5 D I S C U S S I O N
The kinematic model illustrated in the previous sections shows thatthe North America–northwest Africa motion since 33 Ma is welldescribed by six major stage transitions, at Anomaly 10 (28.3 Ma),6 (20.1 Ma), 5D (17.3 Ma), 5C (16.0 Ma), 5 (11.0 Ma) and 4 (7.4Ma) (Fig. 12), accompanied by a quite irregular migration of thestage poles (Fig. 15). It is important to note that while stage polepaths provide important information about the opening history of anocean basin, the arrangement of a set of finite reconstruction polessuch as that shown in Figs 10 and 11 does not contain any kinematicinformation. It merely shows the location and uncertainty region ofthe finite reconstruction poles obtained by the statistical analysis of
a set of magnetic anomaly crossings and fracture zones. The stagepole path in Fig. 15 and the velocity plot in Fig. 12 show that the timeinterval between from Anomaly 3 (4.2 Ma) to the present is a singlestage. Conversely, although the stage poles between anomalies 5B(14.8 Ma) and 5D (17.3 Ma) are very close each other, the sharpvelocity transition at Anomaly 5C (16.0 Ma) implies that they donot form a single stage. Meaningfully, the major stage transitionat Anomaly 4, which is also extensively discussed in Merkouriev& DeMets (2014), is synchronous with an abrupt change in therelative motion between North America and Eurasia observed byMerkouriev & DeMets (2008) in the North Atlantic.
A comparison of the result presented here for Anomaly 2A withthe GPS-derived Nubia–North America Euler pole from recentstudies (Kogan & Steblov 2008; Argus et al. 2010) is illustratedin Fig. 10. These two modern Nubia–North America Euler polesare located ∼5.9◦ and ∼6.0◦ from our Anomaly 2A pole, respec-tively. Regarding the average spreading rates along the MAR, thesestudies predict 21 and 20 mm yr–1, respectively, slower than ouraverage spreading rate corrected for outward displacement, whichis 22.14 mm yr–1. Another interesting comparison can be made with
at Centre M
editerrani d'Investions Marines y A
mbientals on A
pril 26, 2016http://gji.oxfordjournals.org/
Dow
nloaded from

418 A. Schettino and C. Macchiavelli
Figure 12. Minimum and maximum spreading rates along the mid-Atlantic Ridge. Six major velocity transitions can be observed at the end of chrons C4(7.43 Ma), C5r (10.95 Ma), C5C (16.01 Ma), C5D (17.28 Ma), C6r (20.13 Ma) and C10 (28.28 Ma).
Figure 13. Systematic misfit of reconstructed magnetic crossing associated with Anomaly 8 (red dots) with the corresponding magnetic lineation (dashed blueline).
at Centre M
editerrani d'Investions Marines y A
mbientals on A
pril 26, 2016http://gji.oxfordjournals.org/
Dow
nloaded from

Plate kinematics of the central Atlantic 419
Figure 14. (a) Upper panel: displacement of magnetic crossings older than Anomaly 7 (dots with arrows) in high-quality magnetic profile 02030010.1 north ofthe CIFZ. The theoretical location of the crossings has been calculated on the basis of the rotation model in Table 1. Lower panel: Location of profile 02030010.1(red line). (b) Upper panel: displacement of magnetic crossings older than Anomaly 7 (dots with arrows) in high-quality magnetic profile 67010030.1 north ofthe CIFZ. The theoretical location of the crossings has been calculated on the basis of the rotation model in Table 1. Lower panel: location of profile 67010030.1(red line). (c) Upper panel: displacement of magnetic crossings older than Anomaly 7 (dots with arrows) in high-quality magnetic profile 67010053.1 north ofthe CIFZ. The theoretical location of the crossings has been calculated on the basis of the rotation model in Table 1. Lower panel: location of profile 67010053.1(red line). (d) Upper panel: displacement of magnetic crossings older than Anomaly 7 (dots with arrows) in high-quality magnetic profile 09260004.2 north ofthe CIFZ. The theoretical location of the crossings has been calculated on the basis of the rotation model in Table 1. Lower panel: location of profile 09260004.2(red line). (e) Upper panel: displacement of magnetic crossings older than Anomaly 7 (dots with arrows) in high-quality magnetic profile 01030013.1 north ofthe CIFZ. The theoretical location of the crossings has been calculated on the basis of the rotation model in Table 1. Lower panel: location of profile 01030013.1(red line). (f) Upper panel: displacement of magnetic crossings older than Anomaly 7 (dots with arrows) in high-quality magnetic profile 15020072.1 northof the CIFZ. The theoretical location of the crossings has been calculated on the basis of the rotation model in Table 1. Lower panel: Location of profile15020072.1 (red line).
at Centre M
editerrani d'Investions Marines y A
mbientals on A
pril 26, 2016http://gji.oxfordjournals.org/
Dow
nloaded from

420 A. Schettino and C. Macchiavelli
Figure 14 (Continued.)
the 3-Myrs-average MORVEL Nubia–North America pole (Fig. 11),which is located at an angular distance of 12.4◦ with respect to ourAnomaly 2A pole, but close to the 2An.1 opening pole of Merk-ouriev & DeMets (2014), although the average opening rate of22.9 mm yr–1 is not much different from our result.
For the time interval between chrons 8 and 13, which is morerelevant for the objectives of this study, we can compare our newlyestimated rotations with those obtained by Muller et al. (1999). Theangular distances between the Muller et al. (1999) finite reconstruc-tion poles for anomalies 8 and 13 and our Euler poles are small,
at Centre M
editerrani d'Investions Marines y A
mbientals on A
pril 26, 2016http://gji.oxfordjournals.org/
Dow
nloaded from
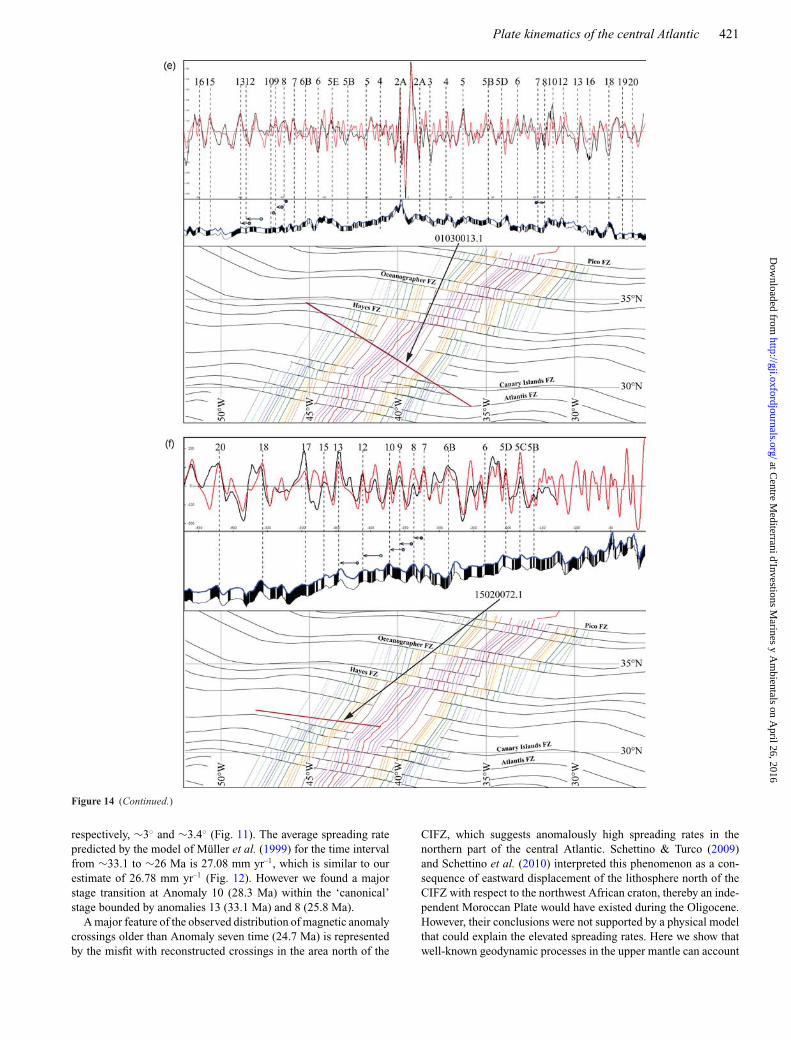
Plate kinematics of the central Atlantic 421
Figure 14 (Continued.)
respectively, ∼3◦ and ∼3.4◦ (Fig. 11). The average spreading ratepredicted by the model of Muller et al. (1999) for the time intervalfrom ∼33.1 to ∼26 Ma is 27.08 mm yr–1, which is similar to ourestimate of 26.78 mm yr–1 (Fig. 12). However we found a majorstage transition at Anomaly 10 (28.3 Ma) within the ‘canonical’stage bounded by anomalies 13 (33.1 Ma) and 8 (25.8 Ma).
A major feature of the observed distribution of magnetic anomalycrossings older than Anomaly seven time (24.7 Ma) is representedby the misfit with reconstructed crossings in the area north of the
CIFZ, which suggests anomalously high spreading rates in thenorthern part of the central Atlantic. Schettino & Turco (2009)and Schettino et al. (2010) interpreted this phenomenon as a con-sequence of eastward displacement of the lithosphere north of theCIFZ with respect to the northwest African craton, thereby an inde-pendent Moroccan Plate would have existed during the Oligocene.However, their conclusions were not supported by a physical modelthat could explain the elevated spreading rates. Here we show thatwell-known geodynamic processes in the upper mantle can account
at Centre M
editerrani d'Investions Marines y A
mbientals on A
pril 26, 2016http://gji.oxfordjournals.org/
Dow
nloaded from

422 A. Schettino and C. Macchiavelli
Figure 15. Path of stage poles of North America with respect to northwest Africa since Anomaly 13 (blue dots).
for both the formation of the Atlas mountain belt and the spreadingrate anomalies north of the CIFZ.
Let us consider the force balance at a basal point x of a litho-spheric plate that moves on the fluid (in rheological sense) astheno-sphere. Let μB be the sum of all plate boundary torques, plus torquesthat are equivalent to boundary forces (e.g. ridge push). If τB(x) isthe traction exerted at point x, associated with this total torque, sothat μB = x × τB(x), then the steady equilibrium velocity, v0, atwhich the plate will move relative to the top transition zone satisfiesthe equation:
τ B (x) = η
hv0 (x) + h
2∇ p, (3)
where η and h are the average asthenosphere viscosity and thick-ness, respectively, and ∇p is the lateral pressure gradient in theasthenosphere. The first term at the right-hand side of eq. (3) rep-resents a passive viscous drag, while the second term is an activedrag exerted at the base of the lithosphere by a pressure-driven as-thenosphere flow in the case of lateral changes in the pressure field(e.g. Schettino 2014). This equation implies that high equilibriumvelocities result when ∇p �= 0 and opposes τB. Most importantly, itconstrains the local plate velocity v0 given a known system of plateboundary forces and a flow direction in the asthenosphere. There-fore, we can check if this equation can be satisfied by the specificgeodynamic and kinematic conditions that existed at the beginningof the Oligocene in the central Atlantic region.
To estimate the traction τB(x) associated with plate boundarytorques, we note that at the beginning of the Oligocene the AfricanPlate was surrounded by spreading ridges along the eastern, west-ern, and southern boundaries, while an old subduction zone boundedits northeastern side (e.g. Schettino & Turco 2011). The system ofspreading ridges around Africa generated a net northward push,which added to the northward slab pull exerted by the Tethyan slabalong the northeastern boundary. Therefore, we expect that Africamoved northwards through a counter-clockwise rotation relative tothe deep mantle. We can test the tenability of this model consider-
ing plate motions in a hot spot frame of reference, which allows toapproximate with sufficient accuracy velocities with respect to themore rigid shells formed by the transition zone and the lower man-tle. To this purpose, we used an age-recalibrated version of Muller’set al. (1993) African fixed hotspot model. In this frame, between 33and 25 Ma northwest Africa was rotating counter-clockwise abouta pole located southwest of the ATJ, as illustrated in Fig. 16. Inthe hypothesis that an independent Moroccan Plate formed duringthe Oligocene, we can estimate the velocity field that would haveestablished in the northeastern part of the central Atlantic and in theMoroccan Meseta from the observed spreading rates north of theCIFZ. In fact, we can reasonably assume that during its eastwardescape the new plate shared with northwest Africa a common stagepole location S relative to North America, so that the CIFZ wassimply converted into a right-lateral strike slip fault without for-mation of major extensional or compressional structures that havenever been observed in the eastern central Atlantic region. The totalaverage misfit of Anomaly 13 crossings north of the CIFZ with re-spect to isochrons 13 on both sides is ∼68 km (left misfit plus rightmisfit). Therefore, the expected velocity of eastward displacementfor the Moroccan Plate is δv = ∼8.2 mm yr–1 for a time interval �t= ∼8.3 Myr between anomalies 7 and 13. Using the rotation modelin Table 1, we easily obtain a stage pole of Morocco relative to NorthAmerica between 24.73 and 33.06 Ma at S = (59.15◦S,150.72◦E).Therefore, the angular distance of the mid-point of the part of theMAR that lies to the north of the CIFZ from S is θ = 154.7◦.This quantity can be used to convert the velocity δv into an angularvelocity of eastward displacement, δω:
δω = 180δv
π Rsinθ. (4)
From (4) it results: δω = 0.173◦ Myr–1. Consequently, the total an-gular displacement for the time interval �t is: �� = δω�t = 1.44◦.From this quantity, we can calculate a stage pole of Morocco rel-ative to North America for the time interval between Anomalies 7and 13. The corresponding velocity field relative to the deep mantle
at Centre M
editerrani d'Investions Marines y A
mbientals on A
pril 26, 2016http://gji.oxfordjournals.org/
Dow
nloaded from

Plate kinematics of the central Atlantic 423
Figure 16. Plate reconstruction at 33.1 Ma (early Oligocene), showing a possible configuration of plate boundaries in the central Atlantic and westernMediterranean. Grey, Continental lithosphere; Light grey, Extended continental crust; Purple, Mesozoic oceanic crust of the Tethyan domain; LT, LigurianTethys; AZP, Azores plume location; CIP, Canary Islands plume; white circle indicates the location of the African instantaneous Euler pole in a hot spotreference frame; red arrows represent absolute velocity field of the Moroccan Plate and direction of asthenosphere toroidal flow; Black arrows show theabsolute motion of Africa.
is shown in Fig. 16. By eq. (3), this field is compatible with bothan excess ridge push from mantle plumes that could have existedin the northern central Atlantic and an ENE directed upper man-tle Poiseuille–Couette viscous flow associated with lateral pressurevariations.
Many lines of evidence indicate that the location of the Azoresplume at the beginning of the Oligocene (∼33 Ma) was more tothe south and did not coincide with the present day location ofthe Azores plateau (Gente et al. 2003). At that time, the latter didnot exist yet, but excess volcanism between the Atlantis Seamountand the MAR between 40 and 25 Ma and anomalously shallowdepths in the residual topography suggest that an ancestor of theAzores mantle plume existed close to the MAR segments facingthe Moroccan Meseta, south of the Pico FZ (Fig. 16). Numericalmodelling shows that in normal conditions ridges generate compres-sive deviatoric stress fields of ∼40 MPa in the elastic zone of theoceanic lithosphere, which are independent from the spreading ve-locity (Bott 1991). However, anomalous hot and low-density uppermantle zones beneath oceanic ridges, forming ocean floor swells,determine a substantial increase in the magnitude of the compres-sional deviatoric stress field in the oceanic area, reaching 100 MPabeneath the oldest crust, and the appearance of a significant com-pressional deviatoric component (up to 90 MPa) in the adjacentcontinental margin (Bott 1991). Therefore, there is evidence thatan elevated and uncompensated ridge push component operated inthe time interval before 25 Ma in the area north of the CIFZ. This
force field was directed eastwards in the eastern sector of the centralAtlantic.
The existence of an Oligocene ENE directed toroidal flow in theupper mantle, which would have exerted active drag at the base ofthe Moroccan lithosphere determining higher spreading rates alongthe MAR, cannot be proved directly. The effect of asthenospherecurrents on geological processes has been studied by several au-thors, notably King & Anderson (1998), Alvarez (2010), Faccenna& Becker (2010), Becker & Faccenna (2011). In the case of thenorthwest African craton, Duggen et al. (2009) first postulated theexistence of an asthenosphere flow from the Canary Islands mantleplume (Anguita & Hernan 2000) toward the western Mediterraneanregion, which travelled through a sublithospheric channel beneaththe Moroccan Meseta and was responsible for voluminous Neogenevolcanism in the Atlas region. It is interesting to note that accord-ing to Missenard & Cadoux (2012) the time interval between ∼35and ∼11 Ma was characterized by the absence of volcanism inthis area, thereby apparently an asthenosphere flow beneath theMoroccan Meseta during the Oligocene–early Miocene should beexcluded. However, we stress the fact that volcanism is always con-trolled by the onset of extensional regime on a pre-existing systemof fractures and faults, not by the mere existence of thermal anoma-lies (Anderson & Natland 2005). Before 35 Ma, the Canary Islandsmantle plume already existed, and it is likely that a weak flowformed beneath the Atlas Rift and directed towards the Mediter-ranean subduction zones, giving rise to magmatic episodes with
at Centre M
editerrani d'Investions Marines y A
mbientals on A
pril 26, 2016http://gji.oxfordjournals.org/
Dow
nloaded from

424 A. Schettino and C. Macchiavelli
Figure 17. Structural interpretation of the Atlas mountain belt as a giant flower structure. JF, Jebilet Fault; SAF, South Atlas Fault; NAF, North Atlas Fault;AAF, Anti Atlas Fault; SSF, South Siroua Fault.
limited amount of alkaline volcanism (Missenard & Cadoux 2012).Here we suggest that rapid flow capable of triggering intraconti-nental deformation started only at the beginning of the Oligocene,when the high-pressure region close to the plume was faced by alow-pressure zone in the western Mediterranean, associated withthe southward subduction of Ligurian Tethys lithosphere beneathMorocco (Fig. 16; Verges & Fernandez 2012). In this scenario, thecombined effect of excess ridge push from the Azores plume andnegative pressure gradients in the region between the Canary Is-lands plume and the western Mediterranean drove the inversion ofthe Atlas rift structures. Such transpressional tectonic regime ham-pered the upwelling of magma until the end of the Rif–Tell orogenyin the Neogene.
The hypothetical scenario illustrated above implies that a Mo-roccan Plate formed as a consequence of the combined effect ofexcess ridge push from mantle plumes and active eastward tractionexerted by the asthenosphere. In this instance, the Atlas mountainbelt should be interpreted as a giant flower structure associated withtranspressional motion along the South Atlas Fault (Fig. 17) andnot as an intracontinental chain generated by isostasy or dynamictopography (e.g. Teixell et al. 2003). There is general consensusthat the inversion of the Mesozoic structures of the Atlas rift (e.g.Le Roy and Pique 2001), which led to the formation of the Atlasorogen (Beauchamp et al. 1996; Frizon de Lamotte et al. 2000;Pique et al. 2002), occurred during the Oligocene–early Miocenetime interval. Therefore, the timing of the Atlas orogeny is coevalwith the high spreading rate event observed in the northern part ofthe central Atlantic. In the classic central Atlantic kinematic mod-els, the amount of deformation in the Atlas region is considered
negligible, so that it is assumed that northwest Africa behaved as asingle rigid plate both during the break-up of Pangea and the Ceno-zoic phase of Atlas orogeny (e.g. Klitgord & Schouten 1986; Roestet al. 1992). Conversely, in the model of Schettino & Turco (2009),an independent Moroccan Plate existed during the Triassic–earlyJurassic between North America, northwest Africa, and Iberia. Atthat time, a wide rift formed between the Moroccan Meseta and theAfrican craton. Later, during the Cenozoic, the rift structures wereinverted as a consequence of eastward transpressional motion be-tween the Moroccan Plate and northwest Africa. Although this viewhas been challenged by Labails et al. (2010), there is strong geolog-ical evidence of dextral transpression both in the High Atlas and inthe Anti-Atlas (Courbouleix et al. 1981; Weijermars 1993; Gomezet al. 1998; Malusa et al. 2007; Ellero et al. 2012). Therefore, theargument that the amount of shortening in the Atlas is moderate(e.g. Teixell et al. 2003) cannot be used to support a rigid-plateapproximation for northwest Africa during the Oligocene.
6 C O N C LU S I O N S
In this paper, we have performed a high-resolution kinematic anal-ysis of the central Atlantic region since the Oligocene (∼33 Ma)through a detailed analysis of marine magnetic and gravity data.The main objective was to detect the existence of minor changes inplate motions during the last 33 Myr within the ‘canonical’ stagesbounded by anomalies 6, 8 and 13. We have shown that at leastseven stages are necessary to describe the sea floor spreading his-tory between North America and northwest Africa since 33 Ma, with
at Centre M
editerrani d'Investions Marines y A
mbientals on A
pril 26, 2016http://gji.oxfordjournals.org/
Dow
nloaded from

Plate kinematics of the central Atlantic 425
boundaries at Anomaly 10 (28.3 Ma), 6 (20.1 Ma), 5D (17.3 Ma), 5C(16.0 Ma), 5 (11.0 Ma) and 4 (7.4 Ma). Another important objectivewas to describe ridge kinematics along the central Atlantic part ofthe MAR. We have found that some ridge segments were subject tocoalescence, others to reorientation, while spreading segment split-ting through formation of small-offset transform faults was quitecommon in this region. Finally, we have described a geodynamicscenario that could explain the high spreading rates observed in thenorthern part of the central Atlantic. This model implies the forma-tion of an independent tectonic plate during the Oligocene, namelythe Moroccan Plate, which decoupled the oceanic lithosphere northof the CIFZ from northwest Africa and moved in dextral transpres-sion along the former Atlas Rift, determining structural inversionbuilding of the Atlas mountain belt.
A C K N OW L E D G E M E N T S
The GEODAS ship-track data used in this study can be foundat NGDC (http://www.ngdc.noaa.gov/mgg/geodas/trackline.html).The computer program used in the analysis of magnetic data wasdesigned by the first author and can be freely downloaded at:http://www.serg.unicam.it/Downloads.htm. We would like to thankJ. Dyment and an anonymous reviewer for their useful suggestions.
R E F E R E N C E S
Alvarez, W., 2010. Protracted continental collisions argue for continentalplates driven by basal traction, Earth planet. Sci. Lett., 296, 434–442.
Anderson, D.L. & Natland, J.H., 2005. A brief history of the plume hypoth-esis and its competitors: concept and controversy, in Plates, Plumes, andParadigms, pp. 119–145, eds Foulger, G.R., Natland, J.H., Presnall, D.C.& Anderson, D.L., Geological Society of America Special Paper 388.
Anguita, F. & Hernan, F., 2000. The Canary Islands origin: a unifying model,J. Volc. Geother. Res., 103, 1–26.
Argus, D.F., Gordon, R.G., Heflin, M.B., Ma, C., Eanes, R., Willis, P., Peltier,W.R. & Owen, S.E., 2010. The angular velocities of the plates and thevelocity of Earth’s centre from space geodesy, Geophys. J. Int., 180(3),913–960.
Beauchamp, W., Barazangi, M., Demnati, A. & El Alji, M., 1996. Intra-continental Rifting and Inversion: Missour Basin and Atlas Mountains,Morocco, AAPG Bull., 80(9), 1459–1482.
Becker, T.W. & Faccenna, C., 2011. Mantle conveyor beneath the Tethyancollisional belt, Earth planet. Sci. Lett., 310, 453–461.
Bott, M.H.P., 1991. Ridge push and associated plate interior stress in normaland hot spot regions, Tectonophysics, 200(1–3), 17–32.
Cande, S.C. & Kent, D.V., 1995. Revised calibration of the geomagneticpolarity timescale for the late Cretaceous and Cenozoic, J. geophys. Res.,100(B4), 6093–6095.
Courbouleix, S., Delpont, G. & Destaucq, C., 1981. Un grand decrochementEst-Ouest au Nord du Maroc, a l’origine des structures plissees atlasiques.Arguments geologiques et experimentaux, Bull. Soc. Geol. France, 23(1),33–43.
DeMets, C. & Wilson, D.S., 2008. Toward a minimum change model forrecent plate motions: calibrating seafloor spreading rates for outwarddisplacement, Geophys. J. Int., 174(3), 825–841.
DeMets, C., Gordon, R.G. & Argus, D.F., 2010. Geologically current platemotions, Geophys. J. Int., 181, 1–80.
Duggen, S., Hoernle, K.A., Hauff, F., Kluegel, A., Bouabdellah, M. & Thirl-wall, M.F., 2009. Flow of Canary mantle plume material through a sub-continental lithospheric corridor beneath Africa to the Mediterranean,Geology, 37(3), 283–286.
Ellero, A., Ottria, G., Ouanaimi, H. & Malusa, M.G., 2012. Structural ge-ological analysis of the High Atlas (Morocco): evidences of a transpres-sional fold-thrust belt, in Tectonics - Recent Advances, eds Sharkov, E.,INTECH, Open Access Publisher.
Escartın, J., Cannat, M., Pouliquen, G., Rabain, A. & Lin, J., 2001. Crustalthickness of V-shaped ridges south of the Azores: interaction of the Mid-Atlantic Ridge (36◦–39◦N) and the Azores hot spot, J. geophys. Res.,106(B10), 21 719–21 735.
Faccenna, C. & Becker, T.W., 2010. Shaping mobile belts by small-scaleconvection, Nature, 465(7298), 602–605.
Francheteau, J., 1973. Plate tectonics model of the opening of the AtlanticOcean south of the Azores, in Implications of Continental Drift to theEarth Sciences, pp. 197–202, eds Tarling, D.H. & Runcorn, S.K., Aca-demic Press.
Frizon de Lamotte, D., Saint Bezar, B., Bracene, R. & Mercier, E., 2000.The two main steps of the Atlas building and geodynamics of the westernMediterranean, Tectonics, 19(4), 740–761.
Gente, P. et al., 1995. Characteristics and evolution of the segmentation ofthe Mid-Atlantic Ridge between 20◦N and 24◦N during the last 10 millionyears, Earth planet. Sci. Lett., 129(1), 55–71.
Gente, P., Dyment, J., Maia, M. & Goslin, J., 2003. Interaction betweenthe Mid-Atlantic Ridge and the Azores hot spot during the last 85 Myr:emplacement and rifting of the hot spot-derived plateaus, Geochem. Geo-phys. Geosyst., 4, 8514, doi:10.1029/2003GC000527.
Gomez, F., Allmendinger, R., Barazangi, M., Er-Raji, A. & Dahmani, M.,1998. Crustal shortening and vertical strain partitioning in the MiddleAtlas Mountains of Morocco, Tectonics, 17(4), 520–533.
Hafid, M., Zizi, M., Bally, A.W. & Salem, A.A., 2006. Structural styles ofthe western onshore and offshore termination of the High Atlas, Morocco,Comptes Rendus Geosci., 338(1), 50–64.
Heirtzler, J.R., Dickson, G.O., Herron, E.M., Pitman III, W.C. & Le Pichon,X., 1968. Marine magnetic anomalies, geomagnetic field reversals, andmotions of the ocean floor and continents, J. geophys. Res., 73(6), 2119–2136.
Hellinger, S.J., 1981. The uncertainties of finite rotations in plate tectonics,J. geophys. Res., 86, 9312–9318.
Hey, R., 1977. A new class of “pseudofaults” and their bearing on platetectonics: a propagating rift model, Earth planet. Sci. Lett., 37(2), 321–325.
Jones, S. M., White, N. & Maclennan, J., 2002. V-shaped ridges around Ice-land: Implications for spatial and temporal patterns of mantle convection,Geochem. Geophys. Geosyst., 3(10), 1059, doi:10.1029/2002GC000361.
King, S.D. & Anderson, D.L., 1998. Edge-driven convection, Earth planet.Sci. Lett., 160, 289–296.
Kleinrock, M.C., Tucholke, B.E., Lin, J. & Tivey, M.A., 1997. Fastrift propagation at a slow-spreading ridge, Geology, 25(7), 639–642.
Klitgord, K.D. & Schouten, H., 1986. Plate kinematics of the central Atlantic,in The Geology of North America, Vol. M: The Western North AtlanticRegion, pp. 351–378, eds Vogt, P.R. & Tucholke, B.E., Geol. Soc. ofAmerica.
Kogan, M.G. & Steblov, G.M., 2008. Current global plate kinematics fromGPS (1995-2007) with the plate-consistent reference frame, J. geophys.Res., 113, B04416, doi:10.1029/2007JB005353.
Labails, C., Olivet, J.L., Aslanian, D. & Roest, W.R., 2010. An alternativeearly opening scenario for the Central Atlantic Ocean, Earth planet. Sci.Lett., 297(3), 355–368.
Le Pichon, X. & Fox, J.P., 1971. Marginal offsets, fracture zones,and the early opening of the North Atlantic, J. geophys. Res., 76,6294–6308.
Le Roy, P. & Pique, A., 2001. Triassic-Liassic Western Moroccan synriftbasins in relation to the Central Atlantic opening, Mar. Geol., 172, 359–381.
Malusa, M.G., Polino, R., Cerrina Feroni, A., Ellero, A., Ottria, G., Baidder,L. & Musumeci, G., 2007. Post-Variscan tectonics in eastern Anti-Atlas(Morocco), Terra Nova, 19, 481–489.
Matias, L.M., Olivet, J.L., Aslanian, D. & Fidalgo, L., 2005. PLACA: a whitebox for plate reconstruction and best-fit pole determination, Comput.Geosci., 31(4), 437–452.
Matthews, K.J., Muller, R.D., Wessel, P. & Whittaker, J.M., 2011. Thetectonic fabric of the ocean basins, J. geophys. Res., 116, B12109,doi:10.1029/2011JB008413.
at Centre M
editerrani d'Investions Marines y A
mbientals on A
pril 26, 2016http://gji.oxfordjournals.org/
Dow
nloaded from
426 A. Schettino and C. Macchiavelli
Merkouriev, S. & DeMets, C., 2008. A high-resolution model for Eurasia–North America plate kinematics since 20 Ma, Geophys. J. Int., 173(3),1064–1083.
Merkouriev, S. & DeMets, C., 2014. High-resolution estimates of Nubia–North America plate motion: 20 Ma to present, Geophys. J. Int., 196(3),1281–1298.
Missenard, Y. & Cadoux, A., 2012. Can Moroccan Atlas lithospheric thin-ning and volcanism be induced by Edge-Driven Convection?, Terra Nova,24(1), 27–33.
Muller, R.D. & Roest, W.R., 1992. Fracture zones in the North Atlantic fromcombined Geosat and Seasat data, J. geophys. Res., 97(B3), 3337–3350.
Muller, R.D., Royer, J.-Y. & Lawver, L.A., 1993. Revised plate motionsrelative to the hotspots from combined Atlantic and Indian Ocean hotspottracks, Geology, 21(3), 275–278.
Muller, R.D., Roest, W.R., Royer, J.-Y., Gahagan, L.M. & Sclater, J.G., 1997.Digital isochrons of the world’s ocean floor, J. geophys. Res., 102(B2),3211–3214.
Muller, R.D., Royer, J.-Y., Cande, S.C., Roest, W.R. & Maschenkov, S., 1999.New constraints on the Late Cretaceous/Tertiary plate tectonic evolutionof the Caribbean, in Caribbean Basins, Sedimentary Basins of the World,Vol. 4, pp. 33–59, ed. Mann, P., Elsevier Science B.V.
Olivet, J.L., Bonnin, J., Beuzart, P. & Auzende, J.M., 1984. Cinematique del’Atlantique nord et central, Rapp. Sci. Tech., 54, Centre National pourl’Exploration des Oceans, 108–112.
Pique, A., Tricart, P., Guiraud, R., Laville, E., Bouaziz, S., Amrhar, M. &Ouali, R.A., 2002. The Mesozoic–Cenozoic Atlas belt (North Africa): anoverview, Geodinamica Acta, 15, 185–208.
Pitman III, W.C & Talwani, M., 1972. Sea floor spreading in the NorthAtlantic, Geol. Soc. Am. Bull., 83(3), 619–646.
Roest, W.R., Danobeitia, J.J., Verhoef, J. & Collette, B.J., 1992. Magneticanomalies in the Canary basin and the Mesozoic evolution of the centralNorth Atlantic, Mar. geophys. Res., 14(1), 1–24.
Rona, P.A., 1976. Asymmetric fracture zones and sea-floor spreading. Earthplanet. Sci. Lett., 30(1), 109–116.
Rona, P.A. & Gray, D.F., 1980. Structural behavior of fracture zones symmet-ric and asymmetric about a spreading axis: Mid-Atlantic Ridge (latitude23 N to 27 N), Geol. Soc. Am. Bull., 91(8), 485–494.
Sandwell, D.T., Muller, R.D., Smith, W.H., Garcia, E. & Francis, R., 2014.New global marine gravity model from CryoSat-2 and Jason-1 revealsburied tectonic structure, Science, 346(6205), 65–67.
Schettino, A., 2012. Magan: a new approach to the analysis and interpreta-tion of marine magnetic anomalies, Comput. Geosci., 39, 135–144.
Schettino, A., 2014. Quantitative Plate Tectonics, Springer, 403 pp.Schettino, A. & Scotese, C.R., 2005. Apparent polar wander paths for the
major continents (200 Ma - Present Day): a paleomagnetic referenceframe for global plate tectonic reconstructions, Geophys. J. Int., 163(2),727–759.
Schettino, A. & Turco, E., 2009. Breakup of Pangaea and plate kine-matics of the central Atlantic and Atlas regions, Geophys. J. Int., 110,1078–1097.
Schettino, A. & Turco, E., 2011. Tectonic history of the western Tethys sincethe late Triassic, GSA Bull., 123(1/2), 89–105.
Schettino, A., Tassi, L. & Turco, E., 2010. Reply to comments by C. Labailsand W. Roest on ‘Breakup of Pangaea and plate kinematics of the centralAtlantic and Atlas regions’, Geophys. J. Int., 183, 99–102.
Schouten, H., Dick, H.J.B. & Klitgord, K.D., 1987. Migration of mid-ocean-ridge volcanic segments, Nature, 326, 835–839.
Sclater, J.G., Hellinger, S. & Tapscott, C., 1977. Paleobathymetry ofthe Atlantic Ocean from the Jurassic to the present, J. Geol., 85(5),509–552.
Sundvik, M.T. & Larson, R.L., 1988. Seafloor spreading history of thewestern North Atlantic Basin derived from the Keathley sequence andcomputer graphics, Tectonophysics, 155(1–4), 49–71.
Teixell, A., Arboleya, M.L., Julivert, M. & Charroud, M., 2003. Tectonicshortening and topography in the central High Atlas (Morocco), Tectonics,22(5), doi:10.1029/2002TC001460.
Verges, J. & Fernandez, M., 2012. Tethys–Atlantic interaction along theIberia–Africa plate boundary: the Betic–Rif orogenic system, Tectono-physics, 579, 144–172.
Vogt, P.R., 1971. Asthenosphere motion recorded by the ocean floor southof Iceland, Earth planet. Sci. Lett., 13, 153–160.
Weijermars, R., 1993. Estimation of paleostress orientation withindeformation zones between two mobile plates, GSA Bull.,105(11), 1491–1510.
White, R.S., 1997. Rift–plume interaction in the North Atlantic, Phil. Trans.R. Soc. Lond., A, 355(1723), 319–339.
S U P P O RT I N G I N F O R M AT I O N
Additional Supporting Information may be found in the online ver-sion of this paper:
Figure S1.(http://gji.oxfordjournals.org/lookup/suppl/doi:10.1093/gji/ggw022/-/DC1).
Please note: Oxford University Press is not responsible for the con-tent or functionality of any supporting materials supplied by theauthors. Any queries (other than missing material) should be di-rected to the corresponding author for the paper.
at Centre M
editerrani d'Investions Marines y A
mbientals on A
pril 26, 2016http://gji.oxfordjournals.org/
Dow
nloaded from