Geomorphic evidence for post&10 Ma uplift of the western...
17
Geomorphic evidence for post-10 Ma uplift of the western flank of the central Andes 18° 30 0 –22° S Gregory D. Hoke, 1,2 Bryan L. Isacks, 1 Teresa E. Jordan, 1 Nicola ´s Blanco, 3 Andrew J. Tomlinson, 3 and Jahandar Ramezani 4 Received 14 November 2006; revised 4 April 2007; accepted 11 June 2007; published 31 October 2007. [1] The western Andean mountain front forms the western edge of the central Andean Plateau. Between 18.5° and 22°S latitude, the mountain front has 3000 m of relief over 50 km horizontal distance that has developed in the absence of major local Neogene deformation. Models of the evolution of the plateau, as well as paleoaltimetry estimates, all call for continued large-magnitude uplift of the plateau surface into the late Miocene (i.e., younger than 10 Ma). Longitudinal river profiles from 20 catchments that drain the western Andean mountain front contain several streams with knickpoint-bounded segments that we use to reconstruct the history of post-10 Ma surface uplift of the western flank of the central Andean Plateau. The generation of knickpoints is attributed to tectonic processes and is not a consequence of base level change related to Pacific Ocean capture, eustatic change, or climate change as causes for creating the knickpoint-bounded stream segments observed. Minor valley-filling alluvial gravels intercalated with the 5.4 Ma Carcote ignimbrite suggest uplift related river incision was well under way by 5.4 Ma. The maximum age of river incision is provided by the regionally extensive, approximately 10 Ma El Diablo–Altos de Pica paleosurface. The river profiles reveal that relative surface uplift of at least1 km occurred after 10 Ma. Citation: Hoke, G. D., B. L. Isacks, T. E. Jordan, N. Blanco, A. J. Tomlinson, and J. Ramezani (2007), Geomorphic evidence for post-10 Ma uplift of the western flank of the central Andes 18°30 0 – 22°S, Tectonics, 26, TC5021, doi:10.1029/2006TC002082. 1. Introduction [2] The processes and rates related to the formation of large continental plateaus remain controversial. Many different mechanisms and ideas have been invoked to explain their evolution, spanning climatic controls [e.g., Montgomery et al., 2001], pure structural thickening via horizontal shortening [e.g., McQuarrie, 2002], to viscous flow of lower crustal material [Clark and Royden, 2000]. The outcomes of some models of plateau forming processes are much easier to test with observation than others. The simplest metric of tectonic activity is upper crustal defor- mation combined with chronologic constraints. In contrast, proposed mechanisms of plateau formation not resulting in surface-breaking faults are much more difficult to constrain. [3] The Andes of South America are home to the central Andean Plateau, the second highest continental plateau on Earth at 4 km average elevation. The plateau is bounded on either side by mountainous topography of the Eastern and Western Cordilleras. The eastern side of the Andean orogen is characterized by a wide belt of Neogene supracrustal deformation expressed by numerous surface- breaking faults and folds. The belt has varied tectonic style, typified by basement uplifts in the Argentine and Peruvian forelands, as well as the spectacular thin-skinned Sub- Andean fold-and-thrust belt in Bolivia. Structural studies indicate that as much as 300 km of Neogene horizontal shortening [McQuarrie et al., 2005] has occurred across the entire plateau and postulate that it generated 3000–4000 m of relief between the plateau and the undeformed foreland [Elger et al., 2005]. By contrast, the western mountain front of the central Andes contains a similar amount of relief but only minor Neogene supracrustal deformation (Figure 1). Several studies related to the development of the plateau or the central Andes as a whole [Garzione et al., 2006; Gregory-Wodzicki, 2000; Isacks, 1988; Kay and Kay, 1993; Kay et al., 1994; Lamb and Hoke, 1997] postulate that uplift of the plateau surface occurred throughout the Miocene. However, the western mountain front has provided little evidence in support of the uplift history interpretations that were based on observations from other parts of the plateau, due to the lack of well-defined geologic structures of appropriate age. Where structural geology approaches cannot be applied, we must explore other methods to test the various hypotheses for plateau forma- tion. Here we examine the longitudinal stream profiles from 20 drainage networks (Figure 1) descending the western flank of the central Andean Plateau in an effort to detect and quantify post-10 Ma relief formation in the region. To do so we perform three tasks. The first is the extraction of stream profiles from digital elevation data, the second is TECTONICS, VOL. 26, TC5021, doi:10.1029/2006TC002082, 2007 1 Department of Earth and Atmospheric Sciences, Cornell University, Ithaca, New York, USA. 2 Now at Department of Earth and Environmental Sciences, University of Rochester, Rochester, New York, USA. 3 Servicio Nacional de Geologı ´a y Minerı ´a, Santiago, Chile. 4 Department of Earth Atmospheric and Planetary Sciences, Massachusetts Institute of Technology, Cambridge, Massachusetts, USA. Copyright 2007 by the American Geophysical Union. 0278-7407/07/2006TC002082 TC5021 1 of 17
Transcript of Geomorphic evidence for post&10 Ma uplift of the western...

Geomorphic evidence for post-10 Ma uplift of the western flank
of the central Andes 18�3000––22�S
Gregory D. Hoke,1,2 Bryan L. Isacks,1 Teresa E. Jordan,1 Nicolas Blanco,3
Andrew J. Tomlinson,3 and Jahandar Ramezani4
Received 14 November 2006; revised 4 April 2007; accepted 11 June 2007; published 31 October 2007.
[1] The western Andean mountain front forms thewestern edge of the central Andean Plateau. Between18.5� and 22�S latitude, the mountain front has�3000 m of relief over �50 km horizontal distancethat has developed in the absence of major localNeogene deformation. Models of the evolution of theplateau, as well as paleoaltimetry estimates, all call forcontinued large-magnitude uplift of the plateau surfaceinto the late Miocene (i.e., younger than 10 Ma).Longitudinal river profiles from 20 catchments thatdrain the western Andean mountain front containseveral streams with knickpoint-bounded segmentsthat we use to reconstruct the history of post-10 Masurface uplift of the western flank of the central AndeanPlateau. The generation of knickpoints is attributed totectonic processes and is not a consequence of baselevel change related to Pacific Ocean capture, eustaticchange, or climate change as causes for creating theknickpoint-bounded stream segments observed. Minorvalley-filling alluvial gravels intercalated with the5.4 Ma Carcote ignimbrite suggest uplift related riverincision was well under way by 5.4 Ma. The maximumage of river incision is provided by the regionallyextensive, approximately 10 Ma El Diablo–Altos dePica paleosurface. The river profiles reveal that relativesurface uplift of at least1 km occurred after 10 Ma.Citation: Hoke, G. D., B. L. Isacks, T. E. Jordan, N. Blanco, A. J.
Tomlinson, and J. Ramezani (2007), Geomorphic evidence for
post-10 Ma uplift of the western flank of the central Andes 18�300–
22�S, Tectonics, 26, TC5021, doi:10.1029/2006TC002082.
1. Introduction
[2] The processes and rates related to the formation oflarge continental plateaus remain controversial. Many
different mechanisms and ideas have been invoked toexplain their evolution, spanning climatic controls [e.g.,Montgomery et al., 2001], pure structural thickening viahorizontal shortening [e.g., McQuarrie, 2002], to viscousflow of lower crustal material [Clark and Royden, 2000].The outcomes of some models of plateau forming processesare much easier to test with observation than others. Thesimplest metric of tectonic activity is upper crustal defor-mation combined with chronologic constraints. In contrast,proposed mechanisms of plateau formation not resulting insurface-breaking faults are much more difficult to constrain.[3] The Andes of South America are home to the central
Andean Plateau, the second highest continental plateau onEarth at �4 km average elevation. The plateau is boundedon either side by mountainous topography of the Easternand Western Cordilleras. The eastern side of the Andeanorogen is characterized by a wide belt of Neogenesupracrustal deformation expressed by numerous surface-breaking faults and folds. The belt has varied tectonic style,typified by basement uplifts in the Argentine and Peruvianforelands, as well as the spectacular thin-skinned Sub-Andean fold-and-thrust belt in Bolivia. Structural studiesindicate that as much as 300 km of Neogene horizontalshortening [McQuarrie et al., 2005] has occurred across theentire plateau and postulate that it generated 3000–4000 mof relief between the plateau and the undeformed foreland[Elger et al., 2005]. By contrast, the western mountain frontof the central Andes contains a similar amount of relief butonly minor Neogene supracrustal deformation (Figure 1).Several studies related to the development of the plateau orthe central Andes as a whole [Garzione et al., 2006;Gregory-Wodzicki, 2000; Isacks, 1988; Kay and Kay,1993; Kay et al., 1994; Lamb and Hoke, 1997] postulatethat uplift of the plateau surface occurred throughoutthe Miocene. However, the western mountain front hasprovided little evidence in support of the uplift historyinterpretations that were based on observations from otherparts of the plateau, due to the lack of well-defined geologicstructures of appropriate age. Where structural geologyapproaches cannot be applied, we must explore othermethods to test the various hypotheses for plateau forma-tion. Here we examine the longitudinal stream profiles from20 drainage networks (Figure 1) descending the westernflank of the central Andean Plateau in an effort to detectand quantify post-10 Ma relief formation in the region. Todo so we perform three tasks. The first is the extraction ofstream profiles from digital elevation data, the second is
TECTONICS, VOL. 26, TC5021, doi:10.1029/2006TC002082, 2007
1Department of Earth and Atmospheric Sciences, Cornell University,Ithaca, New York, USA.
2Now at Department of Earth and Environmental Sciences, Universityof Rochester, Rochester, New York, USA.
3Servicio Nacional de Geologıa y Minerıa, Santiago, Chile.4Department of Earth Atmospheric and Planetary Sciences,
Massachusetts Institute of Technology, Cambridge, Massachusetts, USA.
Copyright 2007 by the American Geophysical Union.0278-7407/07/2006TC002082
TC5021 1 of 17

Figure 1. Shaded relief topographic image with the locations of the major physiographic elements ofthe western Andes of northernmost Chile and names of the 20 basins considered in this study. Countryboundaries are shown with light gray lines. The towns of Iquique, Pica, and Arica are labeled forreference. Between the Quebrada de Tiliviche and Rıo Loa, all of the drainage basins are closed oreffectively closed. The location of the Rıo Loa is labeled in red. Inset shows the location of the studyarea, political boundaries, country names, and the central Andean Plateau delineated by the 3000 melevation contour (thick line).
TC5021 HOKE ET AL.: LATE MIOCENE UPLIFT IN NORTHERN CHILE
2 of 17
TC5021

demonstration of the ages of stream segments, and third isreconstruction of the surface relief at the times when thedated stream segments were created.
2. Geologic Setting
[4] The Andes are the type example of a noncollisionalorogen in a convergent margin setting. Here the Nazca platesubducts below the overriding South American plate. Sub-duction along this margin has been active since the Meso-zoic, with the modern phase of mountain building beginningin the latest Oligocene [Jordan et al., 1997; Mpodozis andRamos, 1989]. The central Andean segment of the orogen isdominated by the central Andean Plateau which spans some�1500 km N-S and 300 km E-W at its widest point. It isbounded to the west by the volcanic peaks of the WesternCordillera (the volcanic arc) and to the east by the EasternCordillera (the hinterland of the modern Sub-Andean fold-thrust belt).[5] Our study area lies within the modern Andean fore
arc and forms the western flank of the central AndeanPlateau. Several physiographic provinces exist in the studyarea (Figure 1). From west to east, they are the (1) CoastalCordillera, (2) Central Depression (Pampa del Tamarugal),(3) western mountain front, (4) Western Cordillera, and(5) Altiplano (Figure 1). In the study area the CoastalCordillera lies between the Pacific Ocean and the CentralDepression and has peaks as high as 2500 m and an averageelevation of �1500 m that wanes toward the north, where itis less than 1000 m at 18.5�S. The Coastal Cordillera iscomposed of Mesozoic volcanic arc and plutonic rocks, andmarine sedimentary rocks, with Oligocene to Recent allu-vial and colluvial sedimentary units filling intermontanebasins [Garcıa et al., 2004; Muzzio, 1986, 1987; ServicioNacional de Geologıa y Minerıa (SERNAGEOMIN), 2002;Silva, 1977]. The Central Depression is a broad plain at�1000 m elevation that lies between the Coastal Cordilleraand the western mountain front and is underlain byOligocene to Recent sedimentary fill. The western mountainfront connects the high elevations of the Western Cordilleraand Altiplano to the Central Depression. The WesternCordillera is composed of rocks of the Miocene to Recentvolcanic arc.[6] All parts of the study area below 3500 m elevation are
subject to the hyperarid conditions of the Atacama Desert.The analysis of meteorological station data by Houston andHartley [2003] shows that rainfall is strongly dependent onelevation in this area. At 1000 m, in the Central Depression,rainfall is <50 mm/yr, though at elevations >3500 m, rainfallis �150 mm/yr. The high peaks of the Western Cordillera(5000–6000 m) do not have station data but are believed tohave annual precipitation in excess of 200 mm/yr. Severallines of evidence point to the long-term stability of climate inthis region [Alpers and Brimhall, 1988;Houston andHartley,2003; Sillitoe and McKee, 1996].[7] The western mountain front in northernmost Chile is
a steep (�3�) topographic front with �3000 m of verticalrelief occurring over �50 km horizontal distance. The latest
Oligocene middle Miocene sedimentary package exposedalong the front is broadly deformed into a west dippingmonoclinal form [Isacks, 1988; Mortimer et al., 1974;Mortimer and Saric Rendic, 1975] (Figure 2), with severaldistinct sedimentary and volcanic units creating markerhorizons that are continuous from the crest of the mountainfront to its toe. Locally, parts of this sequence are folded andcut by steeply dipping west vergent reverse faults that areestimated to have produced 3–8 km of horizontal shorten-ing [Digert et al., 2003; Farıas et al., 2005; Garcıa, 2002;Garcıa et al., 2004; Munoz and Charrier, 1996; Pinto et al.,2004; Victor et al., 2004]. Currently, two competing modelsexist for the topographic relief development of the westernAndean mountain front. Isacks’ [1988] model interprets theupper crust as a monoclinal flexure that is an accommoda-tion structure between the rising plateau and the static forearc [Isacks, 1988]. An alternative contends that offset onupper crustal faults generates the full topographic relief[Munoz and Charrier, 1996; Victor et al., 2004]. Althoughthe two opposing models lead to the same basic geometryand end result of the western monocline as a landform, thereare differences in both the mechanisms and timing of uplift.In Isacks’ [1988] model, excluding the thermal effects,uplift is a result of isostatic adjustment to thickening inthe plateau caused by east-west shortening across theorogen. In this model, deformation along the westernmountain front, in particular the monoclinal flexure, doesnot play an important role in the structural shortening butinstead accommodates the difference in isostatic compen-sation between the undeformed fore arc and the deformingplateau, and as such, the flexure is a consequence ratherthan a cause of uplift. Because the model links uplift toshortening history across the orogen, it predicts that forma-tion of the western mountain front occurred throughout thetime span of shortening, hence throughout the Miocene toRecent [Allmendinger et al., 1997; Isacks, 1988]. In thefault based model, the faulting and folding are the cause andnot the consequence, of uplift. Therefore the model predictsthat relief generation is restricted to the timing of the localfaults and folds [Farıas et al., 2005; Munoz and Charrier,1996; Victor et al., 2004].[8] The profound and long-term aridity of this region
results in the extraordinary preservation of strata on thesteep western mountain front, as well as an extremely wellpreserved poly phase landscape [Garcıa and Herial, 2005;Hoke et al., 2004; Mortimer and Saric Rendic, 1975; Tosdalet al., 1984; Worner et al., 2002] (Figures 2 and 3). TheNeogene cover of the western mountain front is composedmostly of alluvial sedimentary rocks with intercalated tuffsranging from the latest Oligocene to Pliocene age. Theseunits are north of 19.75�S, the Oligo-Miocene OxayaFormation [Garcıa, 2002; Salas et al., 1966] and overlyingmiddle Miocene El Diablo Formation; and south of19.75�S, the Oligo-Miocene Altos de Pica Formation [GalliOlivier and Dingman, 1962] (Figure 3) and overlyinguppermost Miocene–lower Pliocene strata. These unitsand several of their exposed members create regionallyextensive, recognizable surfaces that can be used as time-
TC5021 HOKE ET AL.: LATE MIOCENE UPLIFT IN NORTHERN CHILE
3 of 17
TC5021

lines. Particularly useful in this study are the top surfaces ofthe El Diablo and Altos de Pica Formations.[9] The El Diablo and Altos de Pica Formations are
choronostratigraphically correlative (Figure 3) [Farıas etal., 2005; Garcıa et al., 2004; Pinto et al., 2004] andlaterally contiguous units [SERNAGEOMIN, 2002]. Onthe basis of different geochronologic constraints, we treatthe top surfaces of the El Diablo and Altos de PicaFormation as one continuous, temporally equivalent pedi-ment surface. Traditionally the pediment at the top ofEl Diablo Formation [Tobar et al., 1968] has been inter-preted to be �10 Ma, an age constrained by the ages ofandesite clasts (youngest clast age of 11.9 Ma) within thetop few meters of the unit [Garcıa, 2002; Garcıa andHerial, 2005] and by the 8–9 Ma K-Ar age of theTana lava flow which overlies the El Diablo 142 surface[Mortimer et al., 1974; Munoz and Sepulveda, 1992; Pintoet al., 2004] (Figure 3). Likewise, new chronologic data (seeauxiliary material Text S1) for ignimbrite horizons broadlybracket the age of the pediment surface at the top of the
Altos de Pica Formation.1 The pediment is older thanthe Carcote ignimbrite inset in river valleys incised intothe pediment surface (hence older than 5.4 Ma) and youngerthan the youngest ignimbrite interbedded within the Altosde Pica Formation, and hence younger than 13.03 Ma(Figure 3). Further to the south, the base of the Arcas fanoverlies the top surface of Altos de Pica and has an age of�7 Ma [Kiefer et al., 1997]. In contrast to the preceding,von Rotz et al. [2005] propose a slightly younger age,between 8.5 and 7.5 Ma, for the El Diablo Surface on thebasis of magnetostratigraphy and a Rb-Sr age on an inter-calated tuff near the top of the formation. Although slightlyyounger, their proposed age is broadly similar to thepreviously proposed age for the surface. 21Ne cosomogenicnuclide studies attempting to date the pediment surfaceshave all yielded ages that are outside of what is strati-graphically reasonable [Dunai et al., 2005; Evenstar et al.,
Figure 2. Geologic map modified from the 1:1,000,000 geologic map of Chile [SERNAGEOMIN,2002] of the area between Quebradas Chacarilla and Manı draped over the shaded relief topography ofthe SRTM 90 m DEM. The elevation of the SW corner of the map is �1200 m, while the northeast corneris at 4000 m. The 500 m contours on the map show the monoclinal form of the western mountain frontand the relatively undissected nature of the upper member of the Altos de Pica Formation as it extendsfrom the lower elevations of the Pampa del Tamarugal to higher elevations to the east. The highest islandsof Altos de Pica occur at elevations near 4000 m.
1Auxiliary material data sets are available at ftp://ftp.agu.org/apend/tc/2006tc002082. Other auxiliary material files are in the HTML.
TC5021 HOKE ET AL.: LATE MIOCENE UPLIFT IN NORTHERN CHILE
4 of 17
TC5021

2005]. No data directly constrain the age of the El DiabloAltos de Pica pediment surface.
3. Rivers of Northernmost Chile
[10] We consider rivers that drain the western mountainfront of the central Andes between 18.5� and 22�S latitude(Figure 1) as potential recorders of surface uplift on thewestern slope of the central Andean Plateau. Mortimer[1980] was the first to study and describe the drainages ofnorthern Chile. The age of the mountain front drainagesystems are constrained by the fact that all of the basins areincised into the 10 Ma Altos de Pica–El Diablo pedimentsurface and river valleys between 20 and 22�S are partlyfilled by the 5.4 Ma Carcote ignimbrite (Figure 4; seeauxiliary material Text S1) and therefore can be assigneda late Miocene age.[11] Two general classes of river valleys exist in this
region, those with outlets to the Pacific Ocean (riversbetween 18.5� and 19.75�S and the Rıo Loa with its outletat 21.5�S) and those that drain into the effectively closedPampa del Tamarugal basin (19.75�–22�S). All of themodern drainage basins used in this study have their head-waters at elevations >4000 m. Rivers that drain to thePacific Ocean have a maximum relief of �6000 m, whilethose streams that drain into the Pampa del Tamarugal Basinhave �4500 m of relief. Figure 5 shows the representativerelief structures for the two classes of drainage system.[12] North and south of the closed Pampa del Tamarugal
Basin, rivers that drain the mountain front incise the CoastalCordillera and drain to the Pacific (Figure 1). The Rıo Loa
and Quebrada Tilliviche river profiles have the leastadvanced migration of their knickpoints related to thisincision event. The timing of this event for the Rıo Loacan be constrained by the crosscutting relationships betweenthe valley and the local stratigraphy near the town ofQuillagua [Saez et al., 1999]. Near the top of the depositscut by the Rıo Loa is a 6 Ma volcanic ash [Saez et al.,1999], which can be used to infer that the initiation ofincision occurred sometime after 6 Ma. Despite the fact thatthe Loa has captured all of the basins that drain into theSalar de Llamara, the extremely slow propagation of theknickpoint back into the Salar has thus far effectivelyisolated the streams which drain the western Andean slopefrom their new base level.[13] The age of down cutting of the Quebrada Tiliviche
across the Coastal Cordillera (Figure 1) is constrained bynew geochronologic data presented here. A strath terrace cutinto Mesozoic bedrock occurs at an elevation of 950 mbelow sea level (msl), a position that is 50 m below the topof the canyon and �550 m above the valley bottom(Figure 6). The position of the terrace high on the canyonwall indicates it accumulated at an early stage in the incisionof the canyon. U-Pb dating of zircons in a volcanic ashintercalated in the river deposits overlying the strath indi-cates a depositional age of 6.4 Ma. The post terrace incisionrate calculated using these values is �90 m/Ma. Thisincision has two possible origins, one related to a break-through or spillover to the Pacific Ocean and the other beingrelated to surface uplift of the Coastal Cordillera. Thebreakthrough or spillover hypothesis requires that the Cen-tral Depression did not drain to the Pacific prior to the circa6.4 Ma incision, a situation that is not consistent with thedominance of fluvial deposits and lack of evaporite depositsnear the latitude of Quebrada Tiliviche. In either case,despite the circa 6.4 Ma age for initiation of down cutting,the knickpoint has only migrated 10 km into the CentralDepression where river incision is minimal (see profiles ofMortimer [1980] and Hoke [2006]). In contrast, the knick-point has already migrated through the canyons farthernorth to the foot of the western slope. This may suggesteither that the canyons to the north have an older agethan the 7.5 Ma age estimated by Kober et al. [2006] orthat the smaller Tiliviche valley has a much lower streampower for down cutting. Worner et al. [2002] placed aminimum age constraint on the development of the Llutavalley with a 2.7 Ma 40Ar/39Ar age on the Lauca-Perezignimbrite at the bottom of the valley near its outlet to thePacific Ocean.
4. Stream Profile Reconstruction Methodology
[14] We use knickpoint-bounded segments of riverprofiles to reconstruct the downstream paleoprofiles ofrivers that drain the western flank of the central Andes.This approach relies on the implicit assumption thatthe river profile segment being modeled existed underequilibrium conditions and that knickpoints migrateupstream in erosional waves [Whipple and Tucker, 1999].River profiles can serve as sensitive indicators of climate
Figure 3. Generalized stratigraphy of the western Andeanmountain front between 18�300S and 22�S. Age constraintsare from Mortimer et al. [1974] (Tana Lava), Garcıa [2002](andesite clasts), Worner et al. [2002] (Lauca-PerezIgnimbrite), Kiefer et al. [1997] (Arcas Fan), and this paper(Quebrada Tiliviche, Carcote Ignimbrite, and the 13 Ma ashhorizon in Altos de Pica Formation).
TC5021 HOKE ET AL.: LATE MIOCENE UPLIFT IN NORTHERN CHILE
5 of 17
TC5021

change [Zaprowski et al., 2005], base level fluctuation and/or tectonic forcing [Kirby and Whipple, 2001; Snyder et al.,2000; Whipple and Tucker, 1999; Wobus et al., 2003]. Inthis paper we follow the reasoning discussed by Snyder etal. [2000] and Schoenbohm et al. [2004]. The stream powererosion model for a detachment-limited bedrock streampredicts channel erosion as a function of drainage area (A)and slope (S),
e ¼ KAmSn ð1Þ
where e is the rate of bedrock channel erosion, K is acoefficient of erosion, and the exponents m and n arepositive constants [Whipple and Tucker, 1999]. Accordingto this model, slope must decrease with increasing drainagearea in order to keep the rate of channel bed erosion
constant. In tectonically active regions, river bed elevationthrough time (dz/dt) is a balance between uplift rate (U) anderosion rate e,
dz=dt ¼ U � e ¼ U � KAmSn ð2Þ
In the steady state (equilibrium) case where dz/dt = 0, (2)simplifies and can be rearranged to yield
S ¼ U=Kð Þ1=nA�m=n ð3Þ
Substitution of Hack’s law, A = xh [Hack, 1957], where x isequal to distance downstream in meters and h is a dimen-sionless constant with a value of �1.6, for the area term (A)in equation (3), and integration yields the simplified version
Figure 4. Distribution of the Carcote Ignimbrite (gray polygons) in the catchments (heavy black lines)that drain the southern end of the study area. Topographic contours (gray lines) are derived from 90 mSRTM data and have a 500 m spacing.
TC5021 HOKE ET AL.: LATE MIOCENE UPLIFT IN NORTHERN CHILE
6 of 17
TC5021

of the long profile of a steady state river given by Whippleand Tucker [1999]:
x xð Þ ¼ z0 � U=Kð Þ1=n 1� hm
n
� ��1
x1�hm=n0 � x1�hm=n
� �ð4Þ
where x0 and z0 are the position and elevation at the top ofthe profile, respectively. The power law relationship in (3) isobserved directly in stream profiles extracted from digitalelevation models, and the parameters m/n and (U/K)1/n canbe derived by a regression through slope-area data. The ratiom/n (slope of the regression line) is commonly referred to asthe concavity index (q), while (U/K)1/n (slope intercept) isthe steepness index (ks). The values of ks and q are highlycorrelated; therefore we report values for ks that are nor-malized (ksn) to a reference concavity q = 0.4, a value in the
range of those commonly reported [Snyder et al., 2000].Concavity values for the rivers considered in this studyrange between 0.15 and 20, which is much greater than thetheoretical range of 0.3 to 0.6 [Hack, 1957; Snyder et al.,2000, and references therein]. As discussed by Whipple[2004], such very high concavities are (1) usually localto short reaches of rivers and (2) often indicative ofdisequilibrium river profiles. An alternative explanationfor this concavity range could be the strong contrastbetween different rock types.[15] River long profiles are thought to represent the relief
structure of the landscape [Whipple et al., 1999; Whippleand Tucker, 1999], therefore knickpoint-bounded profilesegments are transient pieces of a profile that representsome prior set of relief conditions. Whether relief isgenerated through base level fall in the downstream endor uplift of the headwaters, a perturbation in the relief
Figure 5. Shaded relief topography, drainage networks, and swath topographic profiles showing therelief structure of basins that drain the western mountain front into the Pacific Ocean (Figure 5a) and theeffectively closed Pampa del Tamarugal Basin (Figure 5b). Knickpoints are marked by yellow triangles.(a) Rıo Camarones–Quebrada Suca catchment with trunk stream and tributaries (colored profiles) fromthe Rıo Camarones (‘‘cam’’) and the Quebrada Suca (‘‘suc’’) plotted with the maximum and minimumtopography for a 70 km wide swath (black profiles) running along the basin axis. (b) Quebrada Tarapacacatchment with trunk and tributaries (colored profiles) plotted with the maximum and minimumtopographic envelopes (black profiles) for a 47 km wide swath. All river profiles were projected into theline used to create the swath profiles. Minimum and maximum topographic profiles are determined byselecting the maximum and minimum cell values for each 1 km step length in the swath profiles. Notethat the Tarapaca profiles end in the Central Depression and do not outlet to sea level.
TC5021 HOKE ET AL.: LATE MIOCENE UPLIFT IN NORTHERN CHILE
7 of 17
TC5021

structure is produced. In northern Chile, base level remainednearly fixed during the period between 10 and 5.4 Ma, asevidenced by the incision of Quebrada Tiliviche in the northand the closed/effectively closed Pampa del Tamarugal tothe south, while the total relief for the basins draining thewestern slope changed because of uplift. Each profilesegment reflects different relief conditions and thereforecan be used to estimate the amount of relief generatedbetween the knickpoint bounded segments [i.e., Clark et al.,2005]. Knickpoints or broader knick zones are discontinu-ities in river profiles that can be large or small and generallyare introduced into a profile by a perturbation in either sideof equation (1). The perturbations may be either a change oferosion rate (through climate change), or a change indownstream slope caused by adjustment to a new base levelthrough capture or breakthrough, or a change in upstreamslope caused by tectonic uplift or subsidence. Conceptually,tectonic uplift can be viewed as a relative base level fall.Irrespective of the ultimate cause, knickpoints create anom-alous zones of increased slope that result in focused erosion.According to Whipple and Tucker [1999], knickpointsshould migrate upstream as a wave from their point oforigin. The section of the stream that lies upstream from theknickpoint operates under the same set of conditions asbefore, while points downstream of the knickpoint haveadjusted to a new equilibrium profile. In areas where thechannel incision rate (e) is low, the propagation of theknickpoint wave upstream through the profile may besufficiently slow that it can be observed and measured.
Here we surmise that the conditions in northern Chile favorthe slow upstream propagation of knickpoints.[16] The river profile data presented here were extracted
from Shuttle Radar Topography Mission (SRTM) digitaltopography corrected for data dropouts using a linearinterpolation scheme. Fortunately the SRTM data for thisregion do not contain large (>0.5 km2) zones of datadropout. Large flat areas constituting salars (salt pans) wereremoved from the topographic data using the mappeddistribution of salars from a 1:1,000,000 scale geologicmap of Chile [SERNAGEOMIN, 2002] prior to the extrac-tion of directional and area accumulation grids. Individualdrainage basins were identified and extracted from thelarger grids of area and elevation for analysis. Becausetwo different classes of drainage basins exist in our studyarea, two separate sets of criteria were used to extractdrainage basins from the topographic data. In the regionwhere rivers drain into the Pampa del Tamarugal Basin(19.5�–22�), outlets were picked at alluvial fan heads,which generally mark the transition between the alluvial(depositional) and confined (net erosional) segments of therivers. Drainage basins that reach the Pacific Ocean wereassigned outlets at sea level. River profiles were extractedfrom these data and analyzed following the proceduresoutlined by Wobus et al. [2006]. Because of the mediumspatial resolution of the topographic data, the minimum areacutoff used for river profiles was 121 grid cells or 0.98 km2.The elevation data for each profile were binned in 30-mincrements, mildly filtered with an algorithm that removesartificial spikes in the data and smoothed with a 500 m
Figure 6. Aerial photo showing the location of the strath terrace preserved in the Quebrada Tilivichecanyon, downstream from the confluence of the Quebradas Camina and Rematilla. U-Pb dating ofzircons in an ash preserved on the terrace yields an age of �6.4 Ma (see auxiliary material Text S1).
TC5021 HOKE ET AL.: LATE MIOCENE UPLIFT IN NORTHERN CHILE
8 of 17
TC5021

(horizontal) moving window [Wobus et al., 2006]. In mostcases, longitudinal profiles and plots of slope vs. area wereexamined for several tributaries in each drainage basin.Knickpoints and other profile discontinuities were mappedon the profiles. The parameters used to model individualstream segments, the steepness index (ksn) and concavityindex (q), were derived from regression of channel slopeversus cumulative drainage area in log-log space. While weapply the methods presented above, particularly equations(3) and (4) to project the stream segments, we find itnecessary to point out that the end result would likely vary
very little from results obtained by the application of asimple power law curve fitting to the profile segments.
5. Results
[17] The rivers that drain the western Andean mountainfront exhibit a wide variety of profile forms (e.g., Figures 5and 7), but generally have at least 2 and often 3 distinctconcave-up knickpoint-bounded segments, an upper, middleand lower (Figure 5). The river segments studied here arebroadly similar in form to those of Schoenbohm et al.’s
Figure 7. An example of a stream long profile from the Tarapaca basin with three distinct concaveprofile segments that are bounded by zones of strong convexities. (a) Stream long profile with thedownstream projection of the middle stream segment. The different stream segments are labeledaccordingly. (b) Graph showing cumulative drainage area with distance downstream. (c) Plot of streamgradient versus cumulative drainage area for the same stream. The concavity and ks values for themodeled stream segment in Figure 7a were derived by the linear regression of slope-area data thatcorresponds to that stretch of the stream (dark blue line). Purple crosses show the slope datacorresponding to 30 m elevation bins, while the red squares show a log binning of the same data.
TC5021 HOKE ET AL.: LATE MIOCENE UPLIFT IN NORTHERN CHILE
9 of 17
TC5021
[2004] study of tributaries draining into the Red River inChina. Lower segments reflect either the modern transitionbetween alluvial fans and confined channels in the Pampadel Tamarugal (Figures 5b and 7) or the Pacific Ocean(Figure 5a). Middle segments are generally steeper and cancontain linear segments and broad convex knick zonesmarking their upper limits; the highest concavity indexand ks values are found in these segments. The uppersegments almost universally fall within the ‘‘typical’’ rangeof the concavity index (see discussion above) with valuesbetween 0.15 and 1.0.[18] For reasons detailed in the three paragraphs that
follow, we attribute the generation of knickpoints on thewestern slope to be the result of tectonic uplift of thewestern Andean mountain front and adjacent Altiplano,rather than the result of climate change or sudden baselevel fall related to breakthrough of streams to the PacificOcean (see below) or relative subsidence of the Pampa delTamarugal Basin. The generation of knickpoints remainscontroversial, since it involves many factors related tolithology (K in equation (1)), climate (K in equation (1))and uplift (U in equation (1)) and how these factorscontribute to channel form. It is possible that knickpointsor waves of erosion generated in part of the profile wherethe rock is easily eroded could accumulate spatially on moreresistant lithologies creating broader knick zones.[19] Since the climate of northern Chile has been gener-
ally arid to hyperarid since the middle Miocene [Alpers andBrimhall, 1988; Rech et al., 2006; Sillitoe and McKee,1996], we reason that the episodic nature of precipitationthat accompanies arid conditions has not changed in a waythat would result in significant profile modification (i.e.,knickpoint generation), although it is difficult to rule outentirely. While climatic fluctuations have been detectedregionally [Betancourt et al., 2000; Bobst et al., 2001;Latorre et al., 2002; Rech et al., 2002], Rech et al. [2006]argue that time averaged precipitation did not exceed
200 mm/yr for the entire area. In this part of northern Chilethere are streams that outlet to the Pacific Ocean and thosethat are effectively closed basins, yet both classes of streamscontain prominent knickpoint-bounded segments and prom-inent knick zones (Figure 5). For many catchments thatdrain into the Pacific Ocean, the wave of erosion hasmigrated back substantially in the trunk streams, but thiswave has not propagated through all of the tributaries(Figure 5a ‘‘cam2’’ and ‘‘cam 3’’ trunk stream profiles,compared with the ‘‘cam1’’ profile and the suca profiles).[20] Surface uplift of the western mountain front and
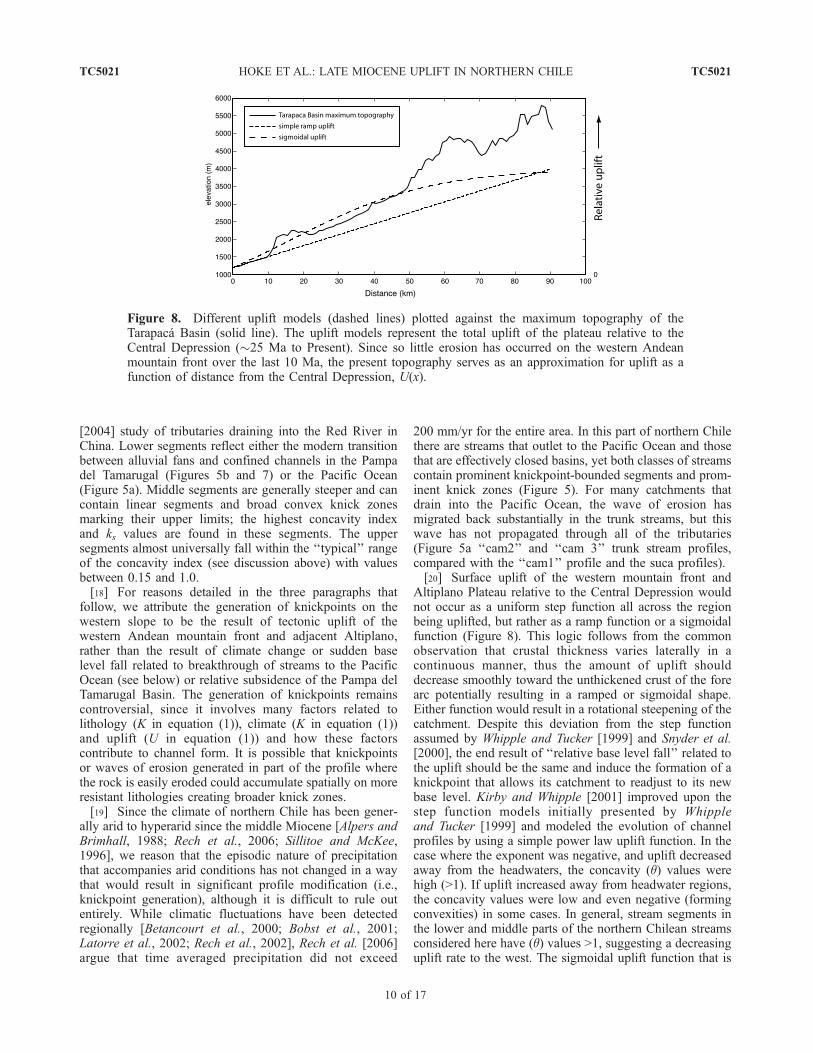
Altiplano Plateau relative to the Central Depression wouldnot occur as a uniform step function all across the regionbeing uplifted, but rather as a ramp function or a sigmoidalfunction (Figure 8). This logic follows from the commonobservation that crustal thickness varies laterally in acontinuous manner, thus the amount of uplift shoulddecrease smoothly toward the unthickened crust of the forearc potentially resulting in a ramped or sigmoidal shape.Either function would result in a rotational steepening of thecatchment. Despite this deviation from the step functionassumed by Whipple and Tucker [1999] and Snyder et al.[2000], the end result of ‘‘relative base level fall’’ related tothe uplift should be the same and induce the formation of aknickpoint that allows its catchment to readjust to its newbase level. Kirby and Whipple [2001] improved upon thestep function models initially presented by Whippleand Tucker [1999] and modeled the evolution of channelprofiles by using a simple power law uplift function. In thecase where the exponent was negative, and uplift decreasedaway from the headwaters, the concavity (q) values werehigh (>1). If uplift increased away from headwater regions,the concavity values were low and even negative (formingconvexities) in some cases. In general, stream segments inthe lower and middle parts of the northern Chilean streamsconsidered here have (q) values >1, suggesting a decreasinguplift rate to the west. The sigmoidal uplift function that is
Figure 8. Different uplift models (dashed lines) plotted against the maximum topography of theTarapaca Basin (solid line). The uplift models represent the total uplift of the plateau relative to theCentral Depression (�25 Ma to Present). Since so little erosion has occurred on the western Andeanmountain front over the last 10 Ma, the present topography serves as an approximation for uplift as afunction of distance from the Central Depression, U(x).
TC5021 HOKE ET AL.: LATE MIOCENE UPLIFT IN NORTHERN CHILE
10 of 17
TC5021

expected for the western Andean mountain front (Figure 8)has a near constant amount of uplift in the higher regions(east) that gently rolls over into a steep gradient in upliftrates toward the west before decreasing to zero. A simplenumerical experiment using a stream power based model forwhich uplift conditions changed from an initial steady stateprofile, produced with a uniform uplift pattern, to a sigmoi-dal-shaped uplift pattern confirmed that a sigmoidal upliftpattern would indeed produce a knickpoint. Knickpointgeneration occurred at the base of the profile outlet andmigrated upstream producing a geometry similar to what weobserve for the rivers of the western Andean slope.
[21] Assuming a tectonic origin for the knickpoint-bounded segments, we modeled the downstream projectionof river longitudinal profiles using equation (4), as illustratedin Figure 7a, for a total of 34 knickpoint-bounded profilesegments from 15 of the 20 catchments that drain thewestern slope (Figure 9a). The parameters (q and ksn) usedto project the profiles are from linear regressions of thestream segments in slope-area plots (Table 1 and auxiliarymaterial Text S2). The outlet elevations of the projectedstream profiles (extended to the same horizontal position asthe modern outlet) are between 0 m and 3672 m, inclusiveof the profiles projected for lower, upper and middle streamsegments (Figure 9a). Because the inferred uplift pattern for
Figure 9. (a) Projected tributary outlet elevations for 34 streams in 15 catchments that drain the westernslope and have well-defined knickpoint-bounded segments. Open circles correspond to upper knickpoint-bounded segments, solid triangles correspond to middle knickpoint-bounded segments, and soliddiamonds are lower profile segment projections as described in Figure 7. The elevations of the modernoutlets are marked by crosses, which are very similar in elevation to the lower segment projections for therivers north of the effectively closed Tamarugal Basin. (b) Relief between modern river outlets and theelevation of the projected river segment outlets for 21 streams that have well-defined middle elevationknickpoint-bounded segments. Closed basin and corrected open basin relief values have an average of1080 ± 230 m, which is interpreted here to represent tectonic uplift.
TC5021 HOKE ET AL.: LATE MIOCENE UPLIFT IN NORTHERN CHILE
11 of 17
TC5021

the western slope results in westward rotational steepeningof the catchments, our modeled outlet elevations are min-imum estimates.[22] An especially interesting measure is the relief
between the modeled paleoprofile outlet constructed forthe middle segments of streams compared to the actualelevation of the modern outlet (Figure 9a). If tectonic forcesare responsible for the relief generation, as we postulatehere, then the difference between the outlets serves as ameasure of uplift. When considering the measured relief,rivers that presently drain into the Pacific Ocean contain�1 km more relief than the rivers that drain into the Pampadel Tamarugal Basin (difference in elevation between thecrosses and triangles in Figure 9a). This difference in reliefinvites two different interpretations: either an additionalkilometer of uplift has occurred in the area north of19.75�S, or the projected middle segments of the northernstreams formed relative to a base level equivalent to theelevation of the modern Central Depression, i.e., prior towhatever event caused the incision of the Coastal Cordilleraand the Central Depression. In order to isolate the impact oftectonic uplift of the western slope, we subtract the reliefgeneration caused by the incision event across the Coastal
Cordillera. This correction for ‘‘Coastal Cordillera incision’’is quantified as follows. Profiles from particularly inactivetributaries in two separate catchments that drain into thePacific Ocean contain rivers with lower profile segmentshaving downstream projections that result in outlet eleva-tions of 1070 ± 110 m and 1200 ± 100 m. These elevationscorrespond with elevations of the El Diablo pedimentsurface that forms the broad flat interfluves between thecanyons. The 1070–1200 m elevation range also corre-sponds to the outlet elevations for the modern streams thatdrain into the effectively closed Pampa del Tamarugal Basinto the south. In three northern drainages (Tiliviche, Suca-Camarones, and Vitor), we interpret these projections torepresent the prior base level of the mountain front drainagesystem, before the streams equilibrated to the modern�1000 m relief between the Pacific Ocean and the CentralDepression. On the basis of the dated river terrace in theQuebrada de Tiliviche (see above), where it currentlyincises across the Coastal Cordillera, we interpret that therivers to the north were graded to the Pampa del Tamarugalbase level prior to �6.4 Ma. The Rıo Azapa valley, whichoutlets where there is no Coastal Cordillera, was also gradedto the now 1000 m high El Diablo surface, so we can apply
Table 1. Projected Stream Outlet Elevations and Base Levels
StreamSegment
OutletLatitude
SegmentTypea Concavity q ksn q = �0.4 r2
OutletElevation, m Error, m
BaseLevel, m
aza003 �18.47 m �0.70 53.0 0.84 2262 130 1000aza006 �18.47 m �0.58 74.0 0.90 2011 188 1000vit201–1 �18.76 u 0.42 31.1 0.79 3645 65 1211vit201–2 �18.76 l 2.10 111.0 0.82 1211 101 1211vit202 �18.76 u 0.58 57.7 0.77 1891 320 1211cam001 �19.19 u 0.39 46.9 0.81 1369 264 1000cam003 �19.19 u 0.54 42.5 0.82 2798 194 1000suc001–1 �19.19 u 0.25 53.2 0.75 �10 383 0suc001–2 �19.19 m 2.50 94.6 0.75 1931 104 1000suc003 �19.19 m 1.16 72.0 0.71 2062 119 1000tili01–1 �19.55 m 10.30 212.0 0.79 1987 111 1067tili01–2 �19.55 u 21.00 184.0 0.75 3158 48 1067tili01–3 �19.55 l 5.10 77.2 0.83 1067 110 1067tara02–1 �20.09 m 13.80 164.0 0.76 2194 76 1219tara02–2 �20.09 m 3.60 192.0 0.47 2216 280 1219tara03 �20.09 m 8.40 133.0 0.78 2574 72 1219tara04 �20.09 m 0.66 44.0 0.53 2277 276 1219quip03 �20.25 u 0.37 53.8 0.86 2231 209 1337jmor01 �20.52 m 1.00 43.3 0.92 2414 123 1263jmor04 �20.52 m 0.45 89.4 0.72 1778 378 1263chac01 �20.80 m 1.00 56.3 0.70 2465 101 1353chac07 �20.80 u 0.83 16.2 0.82 3672 32 1353guat01 �20.99 m 1.20 87.6 0.70 2755 165 1295mani01 �21.10 m 0.41 39.5 0.78 2392 121 1309sup02a–1 �21.23 m 1.60 52.0 0.60 2566 149 1376sup02a–2 �21.23 m 0.68 44.0 0.82 2337 106 1376sup04 �21.23 m 0.76 64.5 0.82 2854 109 1376viej01 �21.31 m 0.99 35.2 0.90 3191 63 1900tamb01 �21.43 u 0.79 45.3 0.98 3251 72 1307tamb02 �21.43 u 2.30 68.7 0.60 3206 98 1307tamb03 �21.43 m 0.15 26.4 0.56 2105 289 1307tamb04 �21.43 u 0.57 68.8 0.49 1864 267 1307tamb04–2 �21.43 m 0.38 34.9 0.85 2157 97 1307arc01 �21.70 m 0.65 24.9 0.94 2759 70 1661
aSegments are u, upper; l, lower; m, middle.
TC5021 HOKE ET AL.: LATE MIOCENE UPLIFT IN NORTHERN CHILE
12 of 17
TC5021

a similar correction to its projected stream segments. Forbasins where lower profile stream segments project near theclosed basin paleobase level, that value was applied tocorrect for ‘‘Coastal Cordillera incision’’, otherwise thestream base level is set to 1000 m. Such a correction isnot necessary for the closed basins south of the QuebradaTiliviche, where no ambiguity exists regarding the lowerriver segment base level history.[23] Applying the base level correction to the streams
north of the modern Pampa del Tamarugal closed basin, the21 modeled profiles that represent the middle segmentshave an average relief between the modeled paleoprofileoutlet compared to the actual/corrected elevation of themodern outlet of 1080 ± 230 m (Figure 9b). We interpretthe consistent clustering of relief over a 350 km long stretchof the western mountain front to represent tectonicallygenerated relief related to the relative uplift of the westernmountain front and adjacent central Andean Plateau withrespect to the Central Depression.[24] In the preceding we have assumed, for the sake of
simplicity, that the elevations of the Coastal Cordillera andCentral Depression have remained similar to their presentvalues throughout the time of stream profile preservation.However, there are no constraints. While this does not affectthe relative uplift interpretations for the modeled streamsegments, it does leave alternative interpretations for thelower stream segments in the northern streams. Specifically,we cannot differentiate between a model where base levelfell through drainage breakthrough of the Coastal Cordilleraand a model where the northern streams persistently outletto the ocean and �1 km of wholesale uplift of the CoastalCordillera and Central Depression occurred following6.4 Ma [Garcıa and Herial, 2005]. The lack of accommo-dation structures in the seismic data between the CentralDepression and the western mountain front [Digert et al.,2003] implies that should the latter model be true this upliftwould also affect the elevations on the plateau.[25] The modeled projections of the upper profile seg-
ments (11 profiles) have a wide range of projected outletelevations, between �10 and 3675 msl (Figure 9a). Thisgreat scatter highlights the difficulty in deciphering theevolution of these highest stream segments with respect tothe rest of the catchment. These parts of the stream networkreach high in the Western Cordillera and Altiplano, where along history of volcanic edifice construction and earlyCenozoic deformation complicate the set of controls. Therewas a pervasive influence of middle Miocene to Pliocenevolcanic activity as far south as 20�S, as well as theexistence of prior mountainous relief related to the Incaic(Eocene-Oligocene) deformation in areas south of 20�S,each of which makes it difficult to ascertain whether or notthe highest reaches of the profiles were always linked totheir current trunk streams or are the result of more recentcaptures. Because it is uncertain that these upper streamsegments evolved as part of their current catchment basin,we do not consider these upper river profile projections tobe an accurate indicator of tectonic relief creation. Thetiming of uplift recorded in the middle stream segments canbe inferred from the age of the stream segments modeled.
As all middle segments dissect the 10 Ma (or 8.5–7.5 Maproposed by von Rotz et al. [2005]) pediment surfaces thatcap the El Diablo and Altos de Pica Formations, themodeled segments and their uplift must be younger thanthe pediment surface. The middle profile segments ofsuc003 and tili01a (Table 1) also deeply dissect (>500 m)the 8–9 Ma Tana lava [Pinto et al., 2004] and underlyingunits, indicating that these modeled stream segments areyounger than 8–9 Ma. Last, the middle profile segments ofsup04, tamb03 and arc01 transect, with only tens of metersof incision, valleys that contain terraces built of alluvialgravels and the intercalated 5.4 Ma Carcote ignimbrite(Figure 4). In downstream areas of the same middle profilesegments, the valleys contain strath terraces capped byCarcote ignimbrite high on the canyon walls [Tomlinsonet al., 2001]. We use the projection of the river profiles andthe average elevations of areas mapped as Carcote byTomlinson et al. [2001] as a means of evaluating the ageof incision of the rivers (Figure 10). In the Quebrada Sipuca(Figure 10a), the elevation of the Carcote exposures corre-sponds well with the actual middle stream segment forsup04 and modeled downstream projection of the middlesegment between 40 and 33 km along the profile, then theCarcote terraces decrease sharply in elevation (33 to 26 kmin Figure 10a inset). We interpret the Carcote Ignimbritecapped terraces between �36 km and 26 km to reflect thepaleostream profile at 5.4 Ma. Clearly, incision of themiddle segment was well under way in the Quebrada Sipucaby 5.4 Ma and suggests that surface uplift had to haveoccurred before deposition of the Carcote ignimbrite. Thecorrespondence between the elevation of the Carcote rem-nants and the modeled middle segment are consistent withan interpretation in which the lower profile knickpointerosional wave has deeply dissected the lower profile seg-ments and is currently working on the downstream limit ofthe uplifted middle profile segments. Furthermore the cor-respondence of the modeled stream profile with the nowstranded exposures of Carcote Ignimbrite confirm thevalidity of the profile modeling approach applied here.Despite similar occurrences of the Carcote in the QuebradaTambillo (tamb03) and the Quebrada Arcas (arc01) profiles,not enough of the downstream extent of the ignimbriteterraces is preserved to allow for similar observations(Figures 10b and 10c). The timing of uplift is similar inage, and perhaps contemporaneous with the 6.4 Ma age ofdown cutting of the northern rivers to the ocean deducedfrom relations in the Quebrada Tiliviche. As the persistenceof profile segments depends heavily on the rate of headwardpropagation of the knick zones, the suggestion is that therate of propagation must have been slow, as evidenced bythe slight advance of the Quebrada Tiliviche knick zoneover the last 6.4 Ma [Hoke, 2006] and the 3 km of retreatsince 5.4 Ma in the Quebrada Sipuca.
6. Discussion
[26] Our data show clear evidence for at least 1 km ofsurface uplift of the western Andean mountain front withrespect to the Central Depression during the last 10 Ma.
TC5021 HOKE ET AL.: LATE MIOCENE UPLIFT IN NORTHERN CHILE
13 of 17
TC5021

This result is unambiguous between 19.75� and 22�S wherethe streams drain to the modern closed Pampa del Tamar-ugal basin. In the area spanning 18.5�–19.75�S we reachthis conclusion after subtracting �1000 m for the base levelchange between the El Diablo–Altos de Pica surface and
the modern river outlets to the Pacific Ocean. This is animportant new constraint that tests Isacks’ [1988] hypoth-esis of passive surface uplift of the western Andean slopeand Munoz and Charrier’s [1996] and Victor et al.’s [2004]model of upper crustal fault control on the western mountain
Figure 10. Relationship between the 5.4 Ma Carcote ignimbrite, the modeled middle river segments,and the actual river profile for sup04, tamb03 and arc01. The profiles, modeled and actual, and theaverage elevation of mapped outcrops of Carcote ignimbrite were projected into one straight profile linefor each catchment. (a) The sup04 river profile showing that the Carcote ignimbrite is at similarelevations to the knickpoint-bounded middle segment and its modeled projection until �33 km along theprofile where it drops in elevation to a position between the modern profile and the modeled profile.(b and c) The tamb03 and arc01 modern and projected river profiles and the average elevations of themapped exposures of Carcote ignimbrite. Less extensive deposition or exposure of the ignimbrite makesthe interpretation more difficult, but the initial modeled segments and the mapped distribution of theCarcote correspond well with one another.
TC5021 HOKE ET AL.: LATE MIOCENE UPLIFT IN NORTHERN CHILE
14 of 17
TC5021

front. Our data can only track the creation of increasedrelief, and not absolute elevation change, because theabsolute elevation of our reference datum, the CentralDepression, is not constrained. However, the 100s of metersof incision of the El Diablo surface in the Lluta and Azapavalleys near the coast, where the Coastal Cordillera isabsent, would suggest that some uplift of the coastal regionmay have occurred within the last 10 Ma.[27] The dynamics of the uplift model proposed by Isacks
[1988] call for the formation of the western mountain frontto be controlled by thermal and mechanical weakening ofthe South American lithosphere, due to subduction zoneprocesses. In the model, the location of the mountain frontcoincides with the boundary between strong and weaklithosphere, which in turn coincides with the western tipof the asthenospheric wedge under the South Americanlithosphere [Isacks, 1988]. The model proposes a first phaseof uplift to be the consequence of widespread horizontalshortening and crustal thickening during the ‘‘Quechua’’phase of deformation. In the second stage of the model,when upper crustal deformation shifts eastward and theeastern foreland fold-and-thrust belts develop, the plateaugrows higher in response to lower crustal ductile shorteningand thickening driven by addition of mass from the under-thrusting of the Bolivian foreland [Isacks, 1988]. The timingof the initiation of the second stage of deformation wasrefined by Allmendinger et al. [1997] to be 12 to 6 Ma. Thecessation of deformation in the Eastern Cordillera was at�10 Ma with earliest deformation in the Sub-Andean fold-and-thrust belt occurring as early as 9 Ma [Echavarrıa et al.,2003]. Isacks’ [1988] model treats the western Andeanmountain front as a passive consequence of uplift andmonoclinal tilting, driven by the tectonics within and eastof the plateau.[28] In contrast, the faulting models of Munoz and
Charrier [1996] and Victor et al. [2004] suggest that theuplift of the western mountain front can be explained solelyby displacements on a west verging fault system that isexposed discontinuously from 18�300S to �21�300S [Digertet al., 2003; Garcıa, 2002; Garcıa et al., 2004; Munoz andCharrier, 1996; Victor et al., 2004]. Throughout the systemof faults and fault-related folds, the ages of unconformities,growth folds and syntectonic conglomerates indicate defor-mation is pre-6 Ma, with the greatest shortening ratesconstrained to be older than 10 Ma [Garcıa et al., 2004;Garcıa and Herial, 2005; Pinto et al., 2004; Victor et al.,2004]. Only minor post-6 Ma faulting and folding (<100 mdisplacement) occurs [Garcıa et al., 2004; Pinto et al.,2004]. For example, the modeled middle segments ofstream profiles suc003 and tili01a (Table 1) lie east of theMoquella flexure, a 4 km wide growth fold [Pinto et al.,2004]. Pinto et al. [2004] document �650 m of uplift acrossthe Moquella flexure between 25 Ma and the deposition ofthe 8–9 Ma Tana Lava but only 50 m of uplift younger than8–9 Ma. The modeled stream segments crosscut andtherefore postdate the Tana Lava, but the 50 m of upliftby post-Tana flexural folding is insufficient to explain the�1 km of uplift indicated by the projected stream profileoutlets.
[29] Shortening between 25 and 10 Ma along the westernmountain front [Garcıa et al., 2004; Garcıa and Herial,2005; Pinto et al., 2004; Victor et al., 2004] is compatiblewith both Isacks’ [1988] first stage of plateau growth andthe faulting models of Munoz and Charrier [1996] andVictor et al. [2004], but the two models depart in regards totheir predictions for the post-10 Ma uplift history. With thepaucity of post-10 Ma fault activity on the west flank of theplateau [Elger et al., 2005; Victor et al., 2004], the uppercrustal faulting model implies that significant uplift of thewestern edge of the plateau did not continue into the lateMiocene. This prediction is contradicted by paleoelevationestimates from paleobotanical and stable isotope studies ofpaleosols which indicate large amounts of young uplift ofthe plateau, with more than 50% of the plateau elevationbeing attained in the last 10 Ma [Garzione et al., 2006;Ghosh et al., 2006; Gregory-Wodzicki, 2000; Rech et al.,2006]. The early uplift requisite of the faulting model is alsoincompatible with the geomorphic results presented hereinand other geomorphic studies which likewise indicateimportant post-10 Ma uplift [Barke and Lamb, 2006;Gubbels et al., 1993; Hoke et al., 2004; Kennan et al.,1997; Schildgen et al., 2007; Worner et al., 2002] Anotherimportant distinction between Isacks’ [1988] model andMunoz and Charrier’s [1996] and Victor et al.’s [2004]model is their degree of consistency with isostatic compen-sation. Since the ratio of positive topography to continentalroot is �1:5 [Lowrie, 1997], the 3–3.5 km of Neogenerelief generation postulated for the central Andean Plateaurequires �20 km of Neogene crustal thickening. This valueis in agreement with Eocene and current crustal thicknessestimates under the western mountain front. Geochemicalproxy data suggest that following Eocene magmatismand the Incaic shortening event, crustal thicknesses were�45 km at 35 Ma [Haschke and Gunther, 2003; Haschke etal., 2002], whereas geophysical data determine its currentthickness to be 65–70 km [Beck et al., 1996; Wigger et al.,1994]. Shortening estimates from balanced cross sectionsalong the western mountain front and western edge of theplateau (Western Cordillera) indicate 3 to 8 km of horizontalshortening that produces �3–7 km of crustal thickening, farless than is required to explain the thickened Neogenecrustal root. Since most of the shortening along the westernmountain front occurred between 25 and 10 Ma, it wouldhave been an important contribution to topographic devel-opment along the western edge of the central AndeanPlateau during the early and middle Miocene, in accordancewith both stage 1 of Isacks’ model and the fault upliftmodel. However, the timing relationships clearly reveal thatsignificant uplift of the central Andean Plateau younger than10 Ma cannot be caused by the west vergent faults innorthern Chile.[30] We clearly document that uplift persisted into the
latest Miocene. In this respect, our results provide evidencein support of Isacks’ [1988] model for the uplift of theAltiplano. Specifically, we demonstrate that uplift of thewestern flank of the plateau continued as the eastern extentof Andean crustal shortening shifted eastward into what isnow the Sub-Andean fold-thrust belt. The paucity of sig-
TC5021 HOKE ET AL.: LATE MIOCENE UPLIFT IN NORTHERN CHILE
15 of 17
TC5021

nificant post-10 Ma faulting activity in our study areasuggests that �1000 m of late Miocene uplift accompanieda lithospheric phenomenon that is not associated with localfaulting and folding. Two likely candidates are lower crustalflow of material from the east in response to upper crustalshortening in the Sub-Andean fold-thrust belt and under-thrusting of the Brazilian shield [Isacks, 1988], or removalof a dense lower crust and/or lithospheric mantle [Garzioneet al., 2006; Kay and Kay, 1993]. Mounting evidence existsin support of both of these mechanisms in the generation ofcontinental plateaus [e.g., Clark and Royden, 2000; Kay etal., 1994]. Our results are consistent with elevation increasesince 10 Ma, and so are consistent with the paleoelevationestimates of Gregory-Wodzicki [2000] and Rech et al.[2006]. Our evidence for post-10 Ma uplift is similar tothe timing of uplift suggested by Garzione et al. [2006] andGhosh et al. [2006]. Furthermore our results lend support toother geomorphic evidence that suggests uplift more recentthan 10 Ma, most notably the incision of the San Juan delOro surface [Barke and Lamb, 2006; Gubbels et al., 1993;Kennan et al., 1997; Schildgen et al., 2007], and the tiltingand dissection of the �10 Ma Atacama Gravels south of25�S [Mortimer, 1973; Riquelme et al., 2003].
7. Conclusions
[31] Downstream modeling of knickpoint-boundedstream segments on the western Andean mountain front
reveal an �1 km increase in relief, and landform relation-ships to dated strata indicate that the timing of relative upliftwas within the last 10 Ma. Previous models for northernChile calling upon only involvement of local deformationpredicted the uplift of the plateau to have been nearlycomplete by the end of the middle Miocene. The lateMiocene relief documented herein was created in theabsence of significant deformation (i.e., faulting or folding)in the area, suggesting that processes occurring in the lowercrust (i.e., lower crustal flow) or upper mantle (lithosphericdelamination) are responsible for the growth of the centralAndean Plateau during this period. Our results confirm thepresence and timing of the second stage of plateau growthadvocated by Isacks [1988].
[32] Acknowledgments. This material is based upon work supportedby the National Science Foundation under grant 0208130 to T.E.J. andB.L.I. and supported by NASA Headquarters under Earth System ScienceFellowship grant NGT5-30461 to G.D.H. We thank Carlos Perez de Arce(SERNAGEOMIN) for 40Ar/39Ar analysis of the biotites. Tectonicsreviewers Kelin Whipple and Jon Pelletier provided feedback which helpedto clarify our presentation of this material. Kelin Whipple and his researchgroup helped acquaint G.D.H. with the stream profile analysis methods.Discussions with Carmala Garzione (University of Rochester) and NoahFinnegan (University of Washington/Cornell) improved the ideas presentedhere.
ReferencesAllmendinger, R. W., T. E. Jordan, S. M. Kay, and B. L.
Isacks (1997), The evolution of the Altiplano-Punaplateau of the centralAndes,Annu.Rev. EarthPlanet.Sci., 25, 139–174.
Alpers,C.N., andG.H.Brimhall (1988),MiddleMioceneclimatic-change in the Atacama Desert, northernChile—Evidence from supergene mineralization atLa-Escondida,Geol. Soc.Am.Bull.,100, 1640–1656.
Barke, R., and S. Lamb (2006), Late Cenozoic uplift ofthe Eastern Cordillera, Bolivian Andes, EarthPlanet. Sci. Lett., 249, 350–367.
Beck, S. L., G. Zandt, S. C. Myers, T. C. Wallace, P. G.Silver, and L. Drake (1996), Crustal-thickness var-iations in the central Andes, Geology, 24, 407–410.
Betancourt, J. L., C. Latorre, J. A. Rech, J. Quade, andK. A. Rylander (2000), A 22000-year record ofmonsoonal precipitation from northern Chile’s Ata-cama Desert, Science, 289, 1542–1546.
Bobst, A. L., T. K. Lowenstein, T. E. Jordan, L. V.Godfrey, T. L. Ku, and S. Luo (2001), A 106 kapaleoclimate record from drill core of the Salar deAtacama, northern Chile, Palaeogeogr Palaeoecol,173, 21–42.
Clark, M. K., and L. H. Royden (2000), Topographicooze: Building the eastern margin of Tibet by lowercrustal flow, Geology, 28, 703–706.
Clark, M. K., G. Maheo, J. Saleeby, and K. A. Farley(2005), The non-equilibrium landscape of thesouthern Sierra Nevada, California, GSA Today,15, 4 – 9.
Digert, F. E., et al. (2003), Subsurface stratigraphy ofthe Neogene Tamarugal Basin, northern Chile,paper presented at X Congreso Geologico Chileno,Uni.de Concepcion, Concepcion, Chile.
Dunai, T. J., G. A. Gabriel Lopez, and J. Juez-Larre(2005), Oligocene-Miocene age of aridity in theAtacama Desert revealed by exposure dating of ero-
sion-sensitive landforms, Geology, 33, 321 – 324,doi:10.1130/G21184.1.
Echavarrıa, L., R. Hernandez, R. Allmendinger, andJ. Reynolds (2003), Subandean thrust and fold belt ofnorthwestern Argentina; geometry and timing of theAndean evolution, AAPG Bull., 87, 965–985.
Elger, K., O. Oncken, and J. Glodny (2005), Plateau-style accumulation of deformation: SouthernAltiplano, Tectonics, 24, TC4020, doi:10.1029/2004TC001675.
Evenstar, L., et al. (2005), Miocene-Pliocene climatechange in the Peru-Chile Desert, paper presentedat 6th International Symposium on Andean Geody-namics, Inst. de Rech. pour le Dev., Barcelona,Spain, 12–14 Sept.
Farıas, M., R. Charrier, D. Comte, J. Martinod, andG. Herail (2005), Late Cenozoic deformation anduplift of the western flank of the Altiplano:Evidence from the depositional, tectonic, and geo-morphologic evolution and shallow seismic activ-ity (northern Chile at 19�300S), Tectonics, 24,TC4001, doi:10.1029/2004TC001667.
Galli Olivier, C., and R. J. Dingman (1962),Cuadrangulos Pica, Alca, Matilla y Chacarilla, conun estudio sobre los recursos de agua subterranea,provincia de Tarapaca, Carta Geol. Chile, 3(2 –5),125 pp.
Garcıa, M. (2002), Evolution Oligo-Miocene deL’Altiplano Occidental (Arc et Avant-Arc duNord Chili, Arica): Tectonique, volcanisme,sedementation, geomorphologie et bilan erosion-sedimentation, Ph.D. thesis, 118 pp, Univ. JosephFourier, Grenoble, France.
Garcıa, M., and G. Herial (2005), Fault-related folding,drainage network evolution and valley incision dur-ing the Neogene in the Andean Precordillera ofnorthern Chile, Geomorphology, 65, 279–300.
Garcıa, M., et al. (2004), Hoja Arica, Region deTarapaca, Serv. Nac. de Geol. y Minerıa, Santiago,Chile.
Garzione, C. N., P. Molnar, J. C. Libarkin, and B. J.MacFadden (2006), Rapid late Miocene rise of theBolivian Altiplano: Evidence for removal of mantlelithosphere, Earth Planet. Sci. Lett., 241, 543–556.
Ghosh, P., C. N. Garzione, and J. M. Eiler (2006),Rapid uplift of the Altiplano revealed throughC-13-O-18 bonds in paleosol carbonates,Science, 311, 511–515.
Gregory-Wodzicki, K. M. (2000), Uplift history of thecentral and northern Andes: A review, Geol. Soc.Am. Bull., 112, 1091–1105.
Gubbels, T. L., B. L. Isacks, and E. Farrar (1993),High-level surfaces, plateau uplift, and forelanddevelopment, Bolivian central Andes, Geology,21, 695–698.
Hack, J. T. (1957), Studies of longitudinal stream pro-files in Virginia and Maryland, U.S. Geol. Surv.,Reston, Va.
Haschke, M., and A. Gunther (2003), Balancing crustalthickening in arcs by tectonic vs. magmatic means,Geology, 31, 933–936.
Haschke, M., W. Siebel, A. Gunther, and E. Scheuber(2002), Repeated crustal thickening and recyclingduring the Andean orogeny in north Chile(21�– 26�S), J. Geophys. Res., 107(B1), 2019,doi:10.1029/2001JB000328.
Hoke, G. D. (2006), The influence of climate andtectonics on the geomorphology of the westernslope of the central Andes, Chile and Peru, Doctoralthesis, 283 pp, Cornell Univ., Ithaca, N. Y.
Hoke, G. D., B. L. Isacks, T. E. Jordan, and J. S. Yu(2004), Groundwater-sapping origin for the giantquebradas of northern Chile, Geology, 32, 605 –608.
TC5021 HOKE ET AL.: LATE MIOCENE UPLIFT IN NORTHERN CHILE
16 of 17
TC5021

Houston, J., and A. J. Hartley (2003), The central An-dean west-slope rainshadow and its potential con-tribution to the origin of hyper-aridity in theAtacama desert, Int. J. Climatol., 23, 1453–1464.
Isacks, B. L. (1988), Uplift of the central Andean Pla-teau and Bending of the Bolivian Orocline, J. Geo-phys. Res., 93, 3211–3231.
Jordan, T. E., J. H. Reynolds, and J. P. Erikson (1997),Variability in age and initial shortening and uplift inthe central Andes, in Tectonic Uplift and ClimateChange, edited by W. F. Ruddiman, pp. 41 –61,Plenum Press, New York.
Kay, R. W., and S. M. Kay (1993), Delamination anddelamination magmatism, Tectonophysics, 219,177–189.
Kay, S. M., et al. (1994), Young mafic back arc volca-nic-rocks as indicators of continental lithosphericdelamination beneath the Argentine Puna Plateau,central Andes, J. Geophys. Res., 99, 24,323 –24,339.
Kennan, L., et al. (1997), High-altitude paleosurfaces inthe Bolivian Andes: evidence for late Cenozoic sur-face uplift, in Paleosurfaces: Recognition, Recon-struction and Paleoenvironmental Interpretation,edited by M. Widdowson, Geol. Soc. Spec. Publ.,120, 307–323.
Kiefer, E., M. J. Dorr, H. Ibbeken, and H.-J. Gotze(1997), Gravity-based mass balance of an alluvialfan giant: The Arcas Fan, Pampa del Tamarugal,northern Chile, Rev. Geol. Chile, 24, 165–185.
Kirby, E., and K. Whipple (2001), Quantifying differ-ential rock-uplift rates via stream profile analysis,Geology, 29, 415–418.
Kober, F., et al. (2006), Surface uplift and climatechange: The geomorphic evolution of the WesternEscarpment of the Andes of northern Chile betweenthe Miocene and present, in Tectonics, Climate andLandscape Evolution, edited by S. D. Willett et al.,Spec. Pap. Geol. Soc. Am., 398, 75 –86.
Lamb, S., and L. Hoke (1997), Origin of the high pla-teau in the central Andes, Bolivia, South America,Tectonics, 16, 623–649.
Latorre, C., J. L. Betancourt, K. A. Rylander, andJ. Quade (2002), Vegetation invasions into absolutedesert: A 45000 yr rodent midden record from theCalama-Salar de Atacama basins, northern Chile(lat 22�–24�S), Geol. Soc. Am. Bull., 114, 349–366.
Lowrie, W. (1997), Fundamentals of Geophysics, 1sted., 354 pp., Cambridge Univ. Press, Cambridge,U. K.
McQuarrie, N. (2002), The kinematic history of thecentral Andean fold-thrust belt, Bolivia: Implica-tions for building a high plateau, Geol. Soc. Am.Bull., 114, 950–963.
McQuarrie, N., B. K. Horton, G. Zandt, S. Beck, andP. G. DeCelles (2005), Lithospheric evolution of theAndean fold-thrust belt, Bolivia, and the origin ofthe central Andean plateau, Tectonophysics, 399,15– 37, doi:10.1016/j.tecto.2004.12.013.
Montgomery, D. R., and E. Foufoula-Georgiou (1993),Channel network source representation using digitalelevation models, Water Resour. Res., 29, 3925–3934.
Montgomery, D. R., G. Balco, and S. D. Willett (2001),Climate, tectonics, and the morphology of theAndes, Geology, 29, 579–582, doi:10.1130/0091-7613(2001)029<0579:CTATMO>2.0.CO;2.
Mortimer, C. (1973), The Cenozoic history of thesouthern Atacama Desert, Chile, J. Geol. Soc.London, 129, 505–526.
Mortimer, C. (1980), Drainage evolution in theAtacama Desert of northernmost Chile, Rev. Geol.Chile, 11, 3 –28.
Mortimer, C., and N. Saric Rendic (1975), Cenozoicstudies in northernmost Chile, Geol. Rundsch., 64,395–420.
Mortimer, C., E. Farrar, and N. Saric (1974), K-Ar agesfrom Tertiary lavas of the northernmost ChileanAndes, Geol. Rundsch., 63, 484–490.
Mpodozis, C., and V. Ramos (1989), The Andes ofChile and Argentina, in Geology of the Andes andIts Relation to Hydrocarbon andMineral Resources,edited by G. E. Ericksen et al., pp. 56–90, Circum-Pac. Counc. for Energy and Miner. Resour., Houston,Tex.
Munoz, N., and R. Charrier (1996), Uplift of thewestern border of the Altiplano on a west vergentthrust system, northern Chile, J. S. Am. Earth Sci.,9, 171–181.
Munoz, N., and P. Sepulveda (1992), Estructuras com-presivas con vergencia al oeste en el borde orientalde la Depresion Central, norte de Chile (19�150S),Rev. Geol. Chile, 19, 241–247.
Muzzio, J. G. (1986), Geologia de los cuadrangulosCaleta Camarones, Cuya, Punta Gorda, y CerroAtajana, I region, Chile: Informe de Avance, Serv.Nac. de Geol. y Minerıa, Santiago, Chile.
Muzzio, J. G. (1987), Geologia de los cuadrangulosPisagua, Zapiga, Caleta Buena y Huara: informede Advance Proyecto hoja Pisagua, 2 maps, scale1:100000, Serv. Nac. de Geol. y Minerıa, Santiago,Chile.
Pinto, L., et al. (2004), Sedimentacion sintectonica aso-ciada a las estructuras neogeneas en la Precordillerade la zona de Moquella, Tarapaca (19�150S, norte deChile), Rev. Geol. Chile, 31, 19–44.
Rech, J. A., J. Quade, and J. L. Betancourt (2002), LateQuaternary paleohydrology of the central AtacamaDesert (lat 22�–24�S), Chile, Geol. Soc. Am. Bull.,114, 334–348.
Rech, J. A., B. S. Currie, G. Michalski, and A. M.Cowan (2006), Neogene climate change and upliftin the Atacama Desert, Chile, Geology, 34, 761 –764, doi:10.1130/G22444.1.
Riquelme, R., J. Martinod, G. Herail, J. Darrozes, andR. Charrier (2003), A geomorphological approachto determining the Neogene to Recent tectonic de-formation in the Coastal Cordillera of northernChile (Atacama), Tectonophysics, 361, 255–275.
Saez, A., L. Cabrera, A. Jensen, and G. Chong (1999),Late Neogene lacustrine record and palaeogeogra-phy in the Quillagua Llamara basin, central Andeanfore-arc (northern Chile), Palaeogeogr. Palaeocli-matol. Palaeoecol., 151, 5 – 37, doi:10.1016/S0031-0182(99)00013-9.
Salas, R., et al. (1966), Geologıa y recursos mineralesdel departamento de Arica, provincia de Tarapaca,Serv. Nac. de Geol. y Minerıa, Santiago, Chile.
Schildgen, T., K. V. Hodges, K. X. Whipple, P. W.Reiners, and M. S. Pringle (2007), Uplift of thewestern margin of the Andean Plateau revealedfrom canyon incision history, southern Peru, Geol-ogy, 35(6), 523–526, doi:10.1130/G23532A.1.
Schoenbohm, L. M., K. X. Whipple, B. C. Burchfiel,and L. Chen (2004), Geomorphic constraints onsurface uplift, exhumation, and plateau growth inthe Red River region, Yunnan Province, China,Geol. Soc. Am. Bull., 116, 895–909, doi:10.1130/B25364.1.
Servicio Nacional de Geologıa y Minerıa(SERNAGEOMIN) (2002), Mapa geologico deChile, 3 sheets, Santiago, Chile.
Sillitoe, R. H., and E. H. McKee (1996), Age of super-gene oxidation and enrichment in the Chilean por-phyry copper province, Econ. Geol. Bull. Soc., 91,164–179.
Silva, L. I. (1977), Hojas Pisagua y Zapiga, I Region,Inst. de Invest. Geol., Santiago, Chile.
Snyder, N. P., K. X. Whipple, G. E. Tucker, andD. J. Merritts (2000), Landscape response to tec-tonic forcing: Digital elevation model analysis ofstream profiles in the Mendocino triple junctionregion, northern California, Geol. Soc. Am. Bull.,
112 , 1250 – 1263, doi:10.1130/0016-7606(2000)11220021250:LRTTFD>2.0.CO;2.
Tobar, A., et al. (1968), Cuadrangulos Camaraca yAzapa. Provincia de Tarapaca, 20 pp. and 22 maps,scale 21:50000, Inst. de Invest. Geol., Santiago,Chile.
Tomlinson, A. J., et al. (2001), Geologıa de la Precor-dillera Andina de Quebrada Blanca Chuquicamata,Regiones I y II [20�300–22�300], 444 pp. and 20maps pp, Serv. Nac. de Geol. y Minerıa, Santiago,Chile.
Tosdal, R. M., A. H. Clark, and E. Farrar (1984), Cen-ozoic polyphase landscape and tectonic evolution ofthe Cordillera Occidental, southernmost Peru, Geol.Soc. Am. Bull., 95, 1318–1332.
Victor, P., O. Oncken, and J. Glodny (2004), Uplift ofthe western Altiplano plateau: Evidence from thePrecordillera between 20� and 21�S (northernChile), Tectonics, 23, TC4004, doi:10.1029/2003TC001519.
von Rotz, R., F. Schlunegger, F. Heller, and I. Villa(2005), Assessing the age of relief growth in theAndes of northern Chile: Magneto-polarity chron-ologies from Neogene continental sections,Terra Nova, 17, 462 – 471, doi:10.1111/j.1365-3121.2005.00634.x.
Whipple, K. X. (2004), Bedrock rivers and the geomor-phology of active orogens, Annu. Rev. Earth Planet.Sci., 32, 151–185.
Whipple, K. X., and G. E. Tucker (1999), Dynamics ofthe stream-power river incision model: Implicationsfor height limits of mountain ranges, landscape re-sponse timescales, and research needs, J. Geophys.Res., 104, 17,661–17,674.
Whipple, K. X., E. Kirby, and S. H. Brocklehurst(1999), Geomorphic limits to climate-induced in-creases in topographic relief, Nature, 401, 39– 43,doi:10.1038/43375.
Wigger, P., et al. (1994) Variation in crustal structure ofthe southern central Andes deduced from seismicrefraction investigations, in Tectonics of the South-ern Central Andes, edited by K.-J. Reutter et al.,pp. 23–48, Springer-Verlag, Berlin, Germany.
Wobus, C. W., K. V. Hodges, and K. X. Whipple(2003), Has focused denudation sustained activethrusting at the Himalayan topographic front?,Geology, 31, 861–864, doi:10.1130/G19730.1.
Wobus, C., et al. (2006), Tectonics from topography:procedures, promise and pitfalls, in Tectonics, Cli-
mate and Landscape Evolution, edited by S. D.Willett et al., Spec. Pap. Geol. Soc. of Am., 398,55 –74.
Worner, G., D. Uhlig, I. Kohler, and H. Seyfried (2002),Evolution of the West Andean Escarpment at 18�S(N. Chile) during the last 25 Ma: Uplift, erosion andcollapse through time, Tectonophysics, 345, 183–198, doi:10.1016/S0040-1951(01)00212-8.
Zaprowski, B. J., F. J. Pazzaglia, and E. B. Evenson(2005), Climatic influences on profile concavityand river incision, J. Geophys. Res., 110, F03004,doi:10.1029/2004JF000138.
���������N. Blanco and A. J. Tomlinson, Servicio Nacional
de Geologıa y Minerıa, Av. Santa Marıa 0104, Santiago,Chile.
G. D. Hoke, Department of Earth and Environ-mental Sciences, University of Rochester, 227 Hutch-inson Hall, Rochester, NY 14627, USA.
B. L. Isacks and T. E. Jordan, Department of Earthand Atmospheric Sciences, Cornell University, SneeHall, Ithaca, NY 14853, USA.
J. Ramezani, Department of Earth Atmospheric andPlanetary Sciences, Massachusetts Institute of Technol-ogy, 54-1117, Cambridge, MA 02139, USA.
TC5021 HOKE ET AL.: LATE MIOCENE UPLIFT IN NORTHERN CHILE
17 of 17
TC5021