GEOMETRICAL T TACK UP TECHNIQUES - DAAAM...There are 14 different types of geometric tolerances,...
16
DAAAM INTERNATIONAL SCIENTIFIC BOOK 2013 pp. 857-872 CHAPTER 52 GEOMETRICAL TOLERANCE STACK UP TECHNIQUES SAHANI A.K.; JAIN P.K. & SHARMA SATISH C. Abstract: Tolerance design has become a very sensitive and important issue in product and process development because of increasing demand for quality products and the growing requirements for automation in manufacturing. This chapter presents tolerance stack up analysis of dimensional and geometrical tolerances. The stack up of tolerances is important for functionality of the mechanical assembly as well as optimizing the cost of the system. Many industries are aware of the importance of geometrical dimensioning & Tolerancing (GDT) of their product design. Conventional methods of tolerance stack up analysis are tedious and time consuming. Stack up of geometrical tolerances is usually difficult as it involves application of numerous rules & conditions. This chapter introduces the various approaches viz. Generic Capsule, Quickie and Catena methods, used towards tolerance stack up analysis for geometrical tolerances. Automation of stack up of geometrical tolerances can be used for tolerance allocation on the components as well as their assemblies considering the functionality of the system. Stack of geometrical tolerances has been performed for individual components as well as assembly of these components. Key words: GDT, Tolerance stack up, Generic Capsule, Quickie, Catena Method. Authors´ data: Sahani, A[jai] K[umar]; Jain, P[ramod] K[umar]; Sharma, S[atish] C., Mechanical & Industrial Engineering Department, Indian Institute of Technology Roorkee, India, [email protected] This Publication has to be referred as: Sahani, A[jai] K[umar]; Jain, P[ramod] K[umar] & Sharma S[atish], C. (2013) Geometrical Tolerance Stack Up Techniques, Chapter 52 in DAAAM International Scientific Book 2013, pp. 857-872, B. Katalinic & Z. Tekic (Eds.), Published by DAAAM International, ISBN 978-3-901509-94-0, ISSN 1726-9687, Vienna, Austria DOI: 10.2507/daaam.scibook.2013.52
Transcript of GEOMETRICAL T TACK UP TECHNIQUES - DAAAM...There are 14 different types of geometric tolerances,...
DAAAM INTERNATIONAL SCIENTIFIC BOOK 2013 pp. 857-872 CHAPTER 52
GEOMETRICAL TOLERANCE
STACK UP TECHNIQUES
SAHANI A.K.; JAIN P.K. & SHARMA SATISH C. Abstract: Tolerance design has become a very sensitive and important issue in
product and process development because of increasing demand for quality products
and the growing requirements for automation in manufacturing. This chapter
presents tolerance stack up analysis of dimensional and geometrical tolerances.
The stack up of tolerances is important for functionality of the mechanical
assembly as well as optimizing the cost of the system. Many industries are aware
of the importance of geometrical dimensioning & Tolerancing (GDT) of their
product design. Conventional methods of tolerance stack up analysis are tedious
and time consuming. Stack up of geometrical tolerances is usually difficult as it
involves application of numerous rules & conditions. This chapter introduces the
various approaches viz. Generic Capsule, Quickie and Catena methods, used
towards tolerance stack up analysis for geometrical tolerances. Automation of
stack up of geometrical tolerances can be used for tolerance allocation on the
components as well as their assemblies considering the functionality of the system.
Stack of geometrical tolerances has been performed for individual components as
well as assembly of these components.
Key words: GDT, Tolerance stack up, Generic Capsule, Quickie, Catena Method.
Authors´ data: Sahani, A[jai] K[umar]; Jain, P[ramod] K[umar]; Sharma, S[atish]
C., Mechanical & Industrial Engineering Department, Indian Institute of Technology
Roorkee, India, [email protected]
This Publication has to be referred as: Sahani, A[jai] K[umar]; Jain, P[ramod]
K[umar] & Sharma S[atish], C. (2013) Geometrical Tolerance Stack Up Techniques,
Chapter 52 in DAAAM International Scientific Book 2013, pp. 857-872, B. Katalinic
& Z. Tekic (Eds.), Published by DAAAM International, ISBN 978-3-901509-94-0,
ISSN 1726-9687, Vienna, Austria
DOI: 10.2507/daaam.scibook.2013.52
Sahani, A.K.; Jain, P.K. & Sharma Satish, C.: Geometrical Tolerance Stack Up Tec...
1. Introduction
The technology has undergone major changes over the centuries to meet the
changing requirement of the society. During World War II, the United States
manufactured and shipped spare parts overseas for the war effort. Many of these parts
were made to specifications but would not assemble. The military recognized that
producing parts that do not properly fit or function is a serious problem since lives
depend on equipment that functions properly. After the war, a committee representing
government, industry, and education spent considerable time and effort investigating
this defective parts problem; this group needed to find a way to insure that parts
would properly fit and function every time. The result was the development of GDT.
Features toleranced with GDT reflect the actual relationship between mating
parts. Drawings with properly applied geometric tolerancing provide the best
opportunity for uniform interpretation and cost-effective assembly. GDT was created
to insure the proper assembly of mating parts, to improve quality, and to reduce cost.
Before designers can properly apply geometric tolerancing, they must carefully
consider the fit and function of each feature of every part. Properly applied geometric
tolerancing insures that every part will assemble every time. Geometric tolerancing
allows the designers to specify the maximum available tolerance and consequently
design the most economical parts.
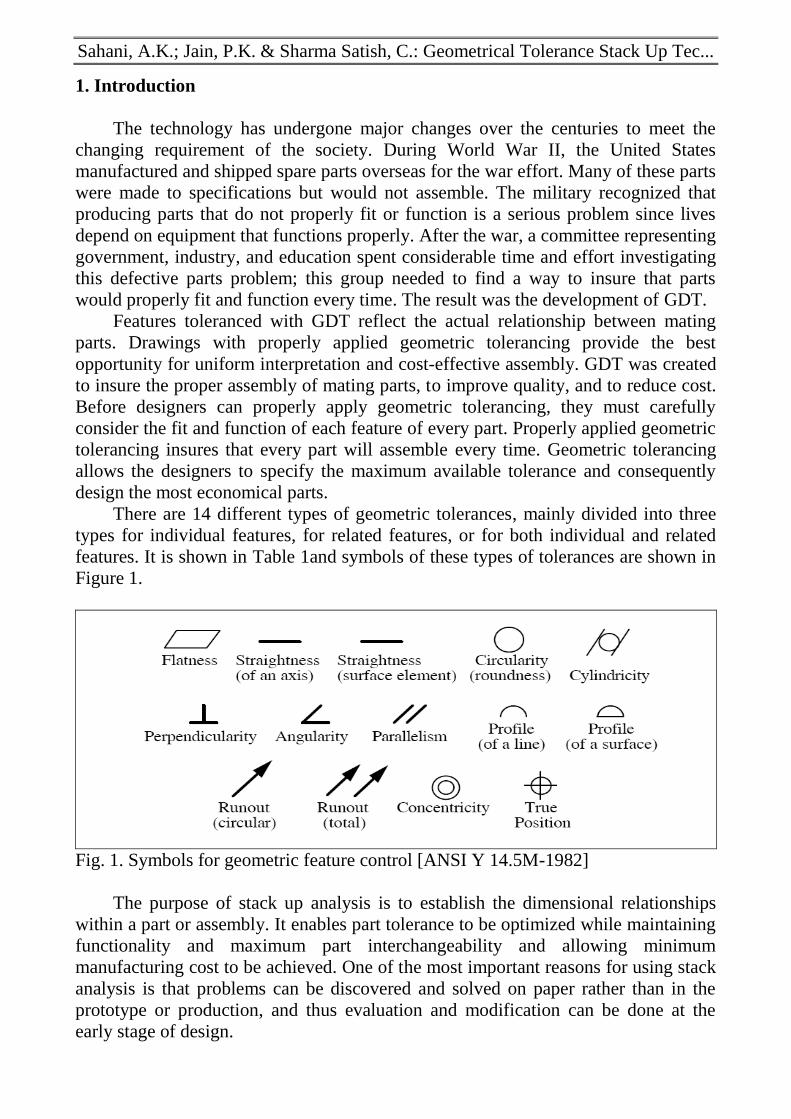
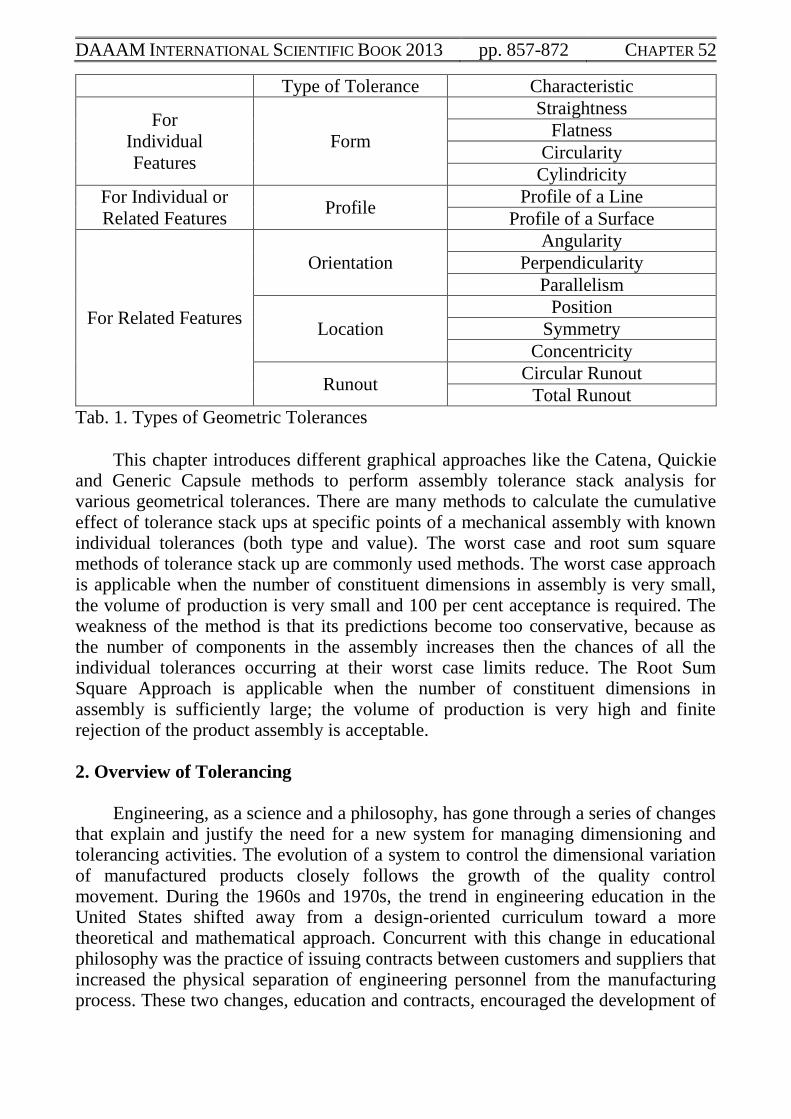
There are 14 different types of geometric tolerances, mainly divided into three
types for individual features, for related features, or for both individual and related
features. It is shown in Table 1and symbols of these types of tolerances are shown in
Figure 1.
Fig. 1. Symbols for geometric feature control [ANSI Y 14.5M-1982]
The purpose of stack up analysis is to establish the dimensional relationships
within a part or assembly. It enables part tolerance to be optimized while maintaining
functionality and maximum part interchangeability and allowing minimum
manufacturing cost to be achieved. One of the most important reasons for using stack
analysis is that problems can be discovered and solved on paper rather than in the
prototype or production, and thus evaluation and modification can be done at the
early stage of design.
DAAAM INTERNATIONAL SCIENTIFIC BOOK 2013 pp. 857-872 CHAPTER 52
Type of Tolerance Characteristic
For
Individual
Features
Form
Straightness
Flatness
Circularity
Cylindricity
For Individual or
Related Features Profile
Profile of a Line
Profile of a Surface
For Related Features
Orientation
Angularity
Perpendicularity
Parallelism
Location
Position
Symmetry
Concentricity
Runout Circular Runout
Total Runout
Tab. 1. Types of Geometric Tolerances
This chapter introduces different graphical approaches like the Catena, Quickie
and Generic Capsule methods to perform assembly tolerance stack analysis for various geometrical tolerances. There are many methods to calculate the cumulative effect of tolerance stack ups at specific points of a mechanical assembly with known individual tolerances (both type and value). The worst case and root sum square methods of tolerance stack up are commonly used methods. The worst case approach is applicable when the number of constituent dimensions in assembly is very small, the volume of production is very small and 100 per cent acceptance is required. The weakness of the method is that its predictions become too conservative, because as the number of components in the assembly increases then the chances of all the individual tolerances occurring at their worst case limits reduce. The Root Sum Square Approach is applicable when the number of constituent dimensions in assembly is sufficiently large; the volume of production is very high and finite rejection of the product assembly is acceptable.
2. Overview of Tolerancing
Engineering, as a science and a philosophy, has gone through a series of changes that explain and justify the need for a new system for managing dimensioning and tolerancing activities. The evolution of a system to control the dimensional variation of manufactured products closely follows the growth of the quality control movement. During the 1960s and 1970s, the trend in engineering education in the United States shifted away from a design-oriented curriculum toward a more theoretical and mathematical approach. Concurrent with this change in educational philosophy was the practice of issuing contracts between customers and suppliers that increased the physical separation of engineering personnel from the manufacturing process. These two changes, education and contracts, encouraged the development of
Sahani, A.K.; Jain, P.K. & Sharma Satish, C.: Geometrical Tolerance Stack Up Tec...
several different product design philosophies. The philosophies include engineering driven design, process driven design, and inspection driven design.
2.1 Engineering Driven Design
An engineering driven design is based on the premise that the engineering designer can specify any tolerance values deemed necessary to ensure the perceived functional requirements of a product. Traditionally, the design engineer assigns dimensional tolerances on component parts just before the drawings are released. These tolerance values are based on past experience, best guess, anticipated manufacturing capability or build-test-fix methods during product development. When the tolerances are determined, there is usually little or no communication between the engineering and the manufacturing or inspection departments. This method is sometimes called the “over-the-wall” approach to engineering design because once the drawings are released to production, the manufacturing and inspection personnel must live with whatever dimensional tolerance values are specified.
2.2 Process Driven Design A process driven design establishes the dimensional tolerances that are placed
on a drawing based entirely on the capability of the manufacturing process, not on the requirements of the fit and function between mating parts. When the manufactured parts are inspected and meet the tolerance requirements of the drawings, they are accepted as good parts. However, they may or may not assemble properly. This condition occurs because the inspection process is only able to verify the tolerance specifications for the manufacturing process rather than the requirement for design fit and function for mating parts.
2.3 Inspection Driven Design
An inspection driven design derives dimensional tolerances from the expected measurement technique and equipment that will be used to inspect the manufactured parts. Inspection driven design does not use the functional limits as the assigned values for the tolerances that are placed on the drawing. The functional limits of a dimensional tolerance are the limits that a feature has to be within for the part to assemble and perform correctly. One inspection driven design method assigns tolerances based on the measurement uncertainty of the measurement system that will be used to inspect finished parts.
3. Previous Research
A lot of work has been done in the field of conventional tolerancing.
Conventional tolerancing methods do a good job for dimensioning and tolerancing
size features and are still used in good capacity today, but conventional tolerancing
do not cater precisely for form, profile, runout, location and orientation features.
Geometric Dimensioning and Tolerancing is used extensively for location, profile,
runout, form and orientation features. The stack of geometrical tolerances has been
done by Ngoi et al. In his research, a generic approach has been presented which is

DAAAM INTERNATIONAL SCIENTIFIC BOOK 2013 pp. 857-872 CHAPTER 52
simple and systematic process of tolerance stack analysis. The model is constructed,
representing the given and the unknown dimensions. The proposed method uses, as
the name implies, a generic capsule, which takes into account all the related aspects
of the axis and surface type of tolerance. Ngoi et al. presented an elegant approach by
using the ‘Quickie’ technique towards tolerance stack analysis for GDT. The
proposed approach has the potential to significantly reduce the amount of work
required and computerization is proving to be promising. The ‘Quickie’ GDT method
is applicable to all geometric characteristics. However, due to different treatments in
various families of geometric characteristics, the ‘Quickie’ GDT approach analysed
runout and concentricity tolerances. Ngoi et al. presented a straightforward, easy-to-
use graphical approach known as the “Catena” method for tolerance stack analysis,
involving geometric characteristics in form control – flatness, straightness, circularity
and cylindricity. No complicated mathematical formulae are required in deriving the
solution. Ngoi et al. suggested Nexus method for stack up of position tolerance
involving bonus and shift tolerances. The method constructs graphical representations
of features termed Nexus cells. The cells contain all geometric information of the
features in numerical values. After each feature is represented by a Nexus cell, the
cells are linked up to form the Nexus model for the part. Once the model is
completed, it can be used to evaluate GDT problems associated with the part. The
method is also applicable for assembly. The "Noded graph" model by Ngoi et al. is
constructed, representing the given and the unknown dimensions. Links are then
established, using the model, which help to formulate the stack path of interest into a
linear equation. The equation is used to complete the tolerance stack analysis module.
Swift et al. introduced a knowledge-based statistical approach to tolerance allocation,
where a systematic analysis for estimating process capability levels at the design
stage is used in conjunction with statistical methods for the optimization of tolerances
in assembly stacks. The method takes into account failure severity through linkage
with failure mode and effects analysis (FMEA) for the setting of realistic capability
targets. Ngoi et al. presented a simple graphical method to represent the process links
between surface planes, and leads to ease in performing the validity of a process plan.
The approach used the linear optimisation software, LINDO, to solve the respectively
linear working dimension and manufacturing tolerance equations. Ngoi et al.
presented a simplified approach of model construction directly from the process plan.
With the model constructed, the relevant process links between any two surfaces can
be easily determined. Unlike other methods, it does not require transcribing the link
information into constraint equations. The formation of the constraint equations is
made easier by direct read-out from the model. He JR described an extension of a
model which determines an optimum set of dimensions and tolerances for machining
processes at minimum manufacturing cost. This optimisation minimizes the cost of
scrap, which is a function of manufacturing tolerances, as the objective function.
Requirements of design sizes, geometrical tolerances (both form and position) and
machining allowances are expressed mathematically as constraints for the
optimization. Singh et al. reviewed different methods of tolerances allocation and
found mean shift models. The combination of the basic approaches can appropriately
be considered more useful because of simplicity of application and improved

Sahani, A.K.; Jain, P.K. & Sharma Satish, C.: Geometrical Tolerance Stack Up Tec...
precision over the plain basic. Numerical integration and experimental design
methods are relatively less complicated, and are useful especially when it is difficult
to express the assembly response function analytically or when computation of the
partial derivatives is difficult. Singh et al. reviewed tolerance synthesis approaches
for tolerance stack-up i.e. the worst-case and the root sum square approaches, or a
combination of the aforementioned basic approaches, viz. the Spotts criteria and the
Greenwood and Chase criteria, used in an estimation of the tolerance build-up. There
is a need to have properly estimated mean-shift factors to get precise results. Zhang
and Wang used the exponential cost-tolerance model for the various machining
processes for the allocation of design and machining tolerances based on the least
manufacturing cost criterion using simulated annealing as the optimization method.
Ahluwalia et al. developed a computer aided tolerance control (CATC) system based
on the tolerance chart technique. The selection of manufacturing processes and
sequence of processes affects process tolerance stacking. The system can be used for
computer aided process planning (CAPP) and for CAD/CAM integration. Chase et al.
described a procedure for tolerance specification based on quantitative estimates of
the cost of tolerances, which permits the selection of component tolerances in
mechanical assemblies for minimum cost of production. Chase et al. described
several algorithms for performing tolerance allocation automatically, based on
optimization techniques. A cost vs. tolerance function is used to drive the
optimization to the minimum overall cost. The methods provide a rational basis for
assigning tolerances to dimensions. Sahani et al. compared different methods for
stack up of geometrical tolerances.
4. Methods for Tolerance Stack Up
In this section, methods have been presented, that can calculate the cumulative
effect of tolerance stack ups at specific points of a mechanical assembly. It is
assumed that individual tolerances are known (both type and value). The different
methods are as follows:
4.1 Worst Case Analysis
This method, also known as linear stack-up, is the most basic method for
predicting the effect of individual tolerances on the whole assembly. In this method,
tolerance analysis is done by assuming that all the individual tolerances occur at their
worst limits or dimensions simultaneously. The accumulated tolerance (ΔY)
can be written as
1
(1)n
i
Y i
Where,
n = Number of constituent dimensions in the dimension chain
i = Tolerance associated with dimension.
This approach is applicable when

DAAAM INTERNATIONAL SCIENTIFIC BOOK 2013 pp. 857-872 CHAPTER 52
(a) The volume of production is very small
(b) 100 per cent acceptance is required
(c) The number of constituent dimensions in assembly is very small
The weakness of the method is that its predictions become too conservative,
because as the number of the parts in the assembly increases then the chances of all
the individual tolerances occurring at their worst case limits reduce. This method can
be used in designing fixtures and also used for collision avoidance by robots.
4.2 Statistical Tolerance Analysis
This method assumes a probability distribution function (pdf) for the variation
of tolerances and then uses this function to predict the assembly variability in the
system. A standard procedure for tolerance analysis is to determine the first four
moments of this function and use these to choose a distribution that describes the
system variability. The main techniques for statistical tolerance analysis are described
below.
4.2.1 Root Sum Squares Method (RSS)
It is the most general form, assuming a Normal or Gaussian distribution for
component variations. This case is very popular and frequently used in mechanical
assemblies because of its simplicity. It has been found that it is very optimistic and
many times the number of rejections in the assembly is more than predicted. Total
tolerance of assembly can given as
2
1
(2)n
i
i
Y
Where,
n = Number of constituent dimensions in the dimension chain i = Tolerance associated with dimension.
This approach is applicable when
(a) The volume of production is very high
(b) Finite rejection of the product assembly is acceptable
(c) The number of constituent dimensions in assembly is sufficiently large
4.2.2 Estimated Mean Shift Model
It is a slight modification of the RSS analysis. In RSS we assume that the
variation of each component dimension is symmetrically distributed about the mean
or nominal dimension, which in real processes, is shifted due to setup errors or drifts
due to time- varying parameters such as tool wear. In this method the mean is
shifted to accommodate the variations.
Sahani, A.K.; Jain, P.K. & Sharma Satish, C.: Geometrical Tolerance Stack Up Tec...
2 2
1 1
/ 3 (1 ) (3)n n
i i
i i
Y i i z
Where,
i = mean shift factor associated with the manufacturing process for
dimension Xi
Z = 3.00, corresponding to 99.73 percent yield this value is most commonly
used in an analytical treatment
4.2.3 Taguchi’s Method
The general idea of Taguchi's method is to use fractional factorial or
orthogonal array experiments to estimate the assembly variations due to the
component variations. This means that the modified Taguchi method is a product
Gaussian Quadrature method that gives correct values of the moments up to the
fifth moment for linear functions. This method is similar to the Quadrature
method.
4.2.4 Reliability Index Method
This method calculates the yield or the probability of successful assembly based
on the Hasofer-Lind reliability index. Given the moments of the component
parameters, each of these random variables is transformed into a standard normal
random variable.
4.2.5 Motorola Six Sigma Model
It is a modification for the RSS method, developed by the Motorola Corp, where
a process capability index is assumed. The process capability index is six times the
variance of the process. It is a modification of the estimated mean shift model that
assumes that the mean of a process shifts due to process variations due to tool wear.
In order to achieve high quality in a complex product comprised of many
components and processes, each component and process must be produced at
significantly higher quality levels in order for the composite result to meet final
quality standards.
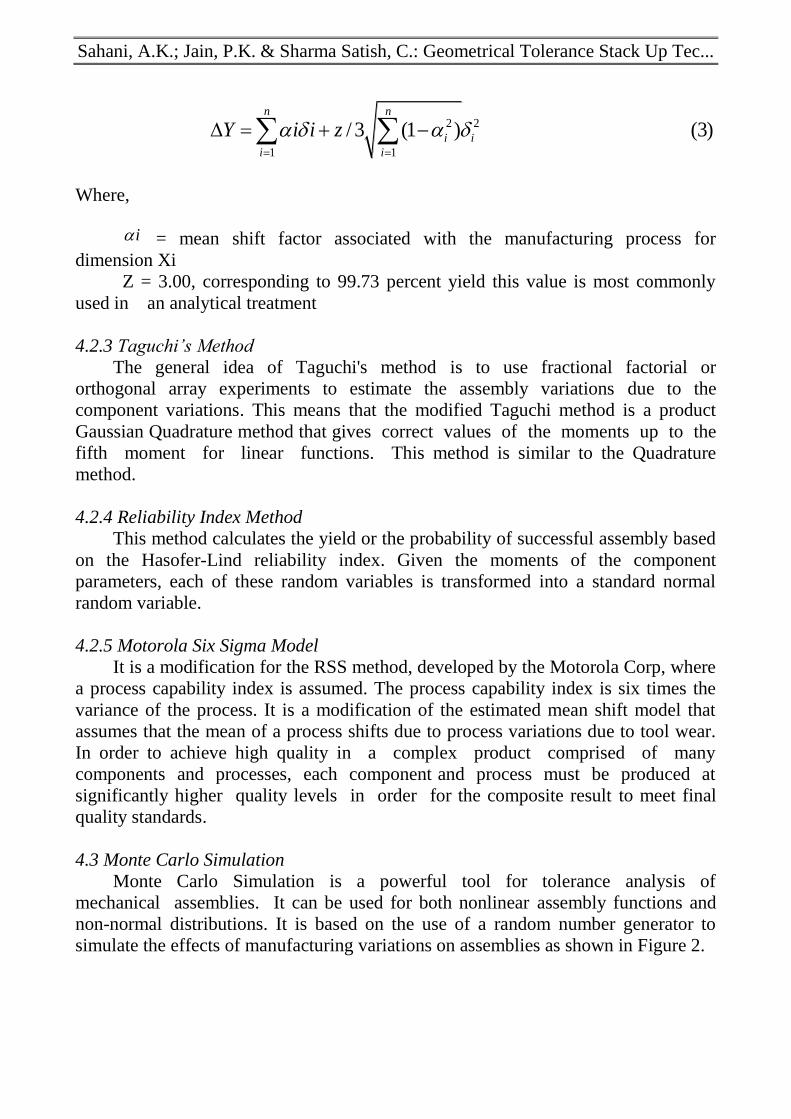
4.3 Monte Carlo Simulation
Monte Carlo Simulation is a powerful tool for tolerance analysis of
mechanical assemblies. It can be used for both nonlinear assembly functions and
non-normal distributions. It is based on the use of a random number generator to
simulate the effects of manufacturing variations on assemblies as shown in Figure 2.
DAAAM INTERNATIONAL SCIENTIFIC BOOK 2013 pp. 857-872 CHAPTER 52
Fig. 2. Monte Carlo distribution
5. Methodology
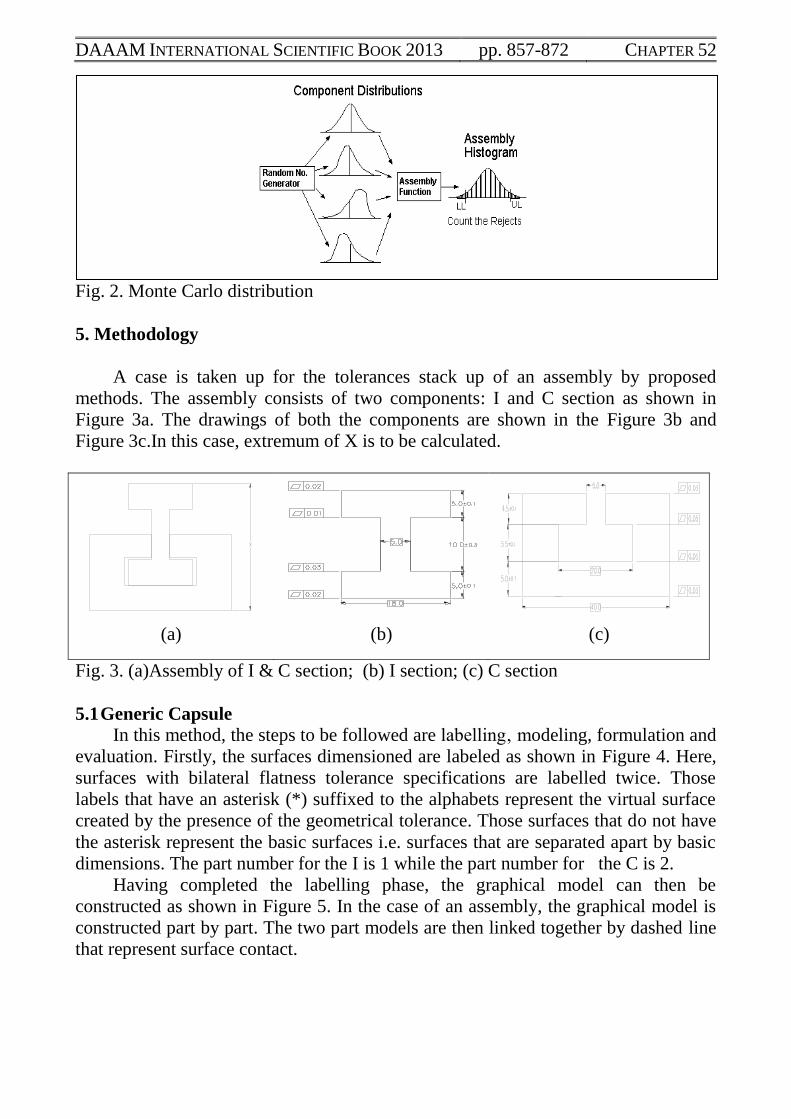
A case is taken up for the tolerances stack up of an assembly by proposed
methods. The assembly consists of two components: I and C section as shown in
Figure 3a. The drawings of both the components are shown in the Figure 3b and
Figure 3c.In this case, extremum of X is to be calculated.
(a) (b) (c)
Fig. 3. (a)Assembly of I & C section; (b) I section; (c) C section
5.1 Generic Capsule
In this method, the steps to be followed are labelling‚ modeling, formulation and
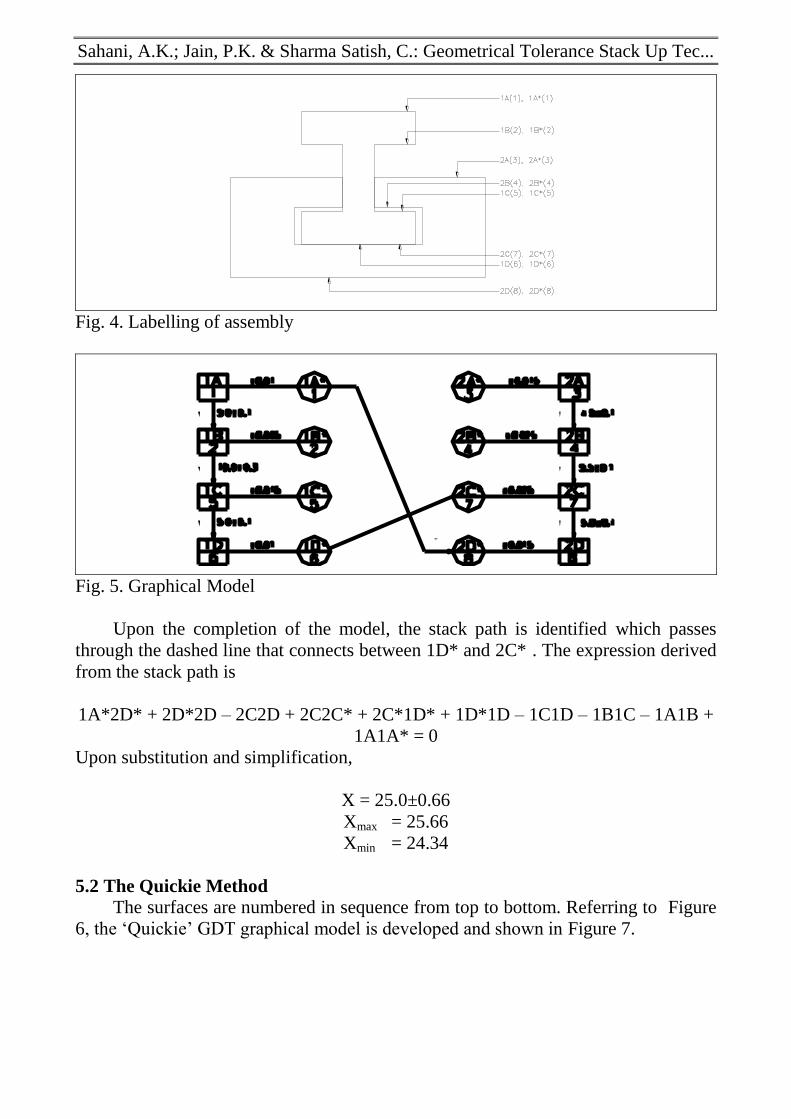
evaluation. Firstly, the surfaces dimensioned are labeled as shown in Figure 4. Here,
surfaces with bilateral flatness tolerance specifications are labelled twice. Those
labels that have an asterisk (*) suffixed to the alphabets represent the virtual surface
created by the presence of the geometrical tolerance. Those surfaces that do not have
the asterisk represent the basic surfaces i.e. surfaces that are separated apart by basic
dimensions. The part number for the I is 1 while the part number for the C is 2.
Having completed the labelling phase, the graphical model can then be
constructed as shown in Figure 5. In the case of an assembly, the graphical model is
constructed part by part. The two part models are then linked together by dashed line
that represent surface contact.
Sahani, A.K.; Jain, P.K. & Sharma Satish, C.: Geometrical Tolerance Stack Up Tec...
Fig. 4. Labelling of assembly
Fig. 5. Graphical Model
Upon the completion of the model, the stack path is identified which passes
through the dashed line that connects between 1D* and 2C* . The expression derived
from the stack path is
1A*2D* + 2D*2D – 2C2D + 2C2C* + 2C*1D* + 1D*1D – 1C1D – 1B1C – 1A1B +
1A1A* = 0
Upon substitution and simplification,
X = 25.0±0.66
Xmax = 25.66
Xmin = 24.34
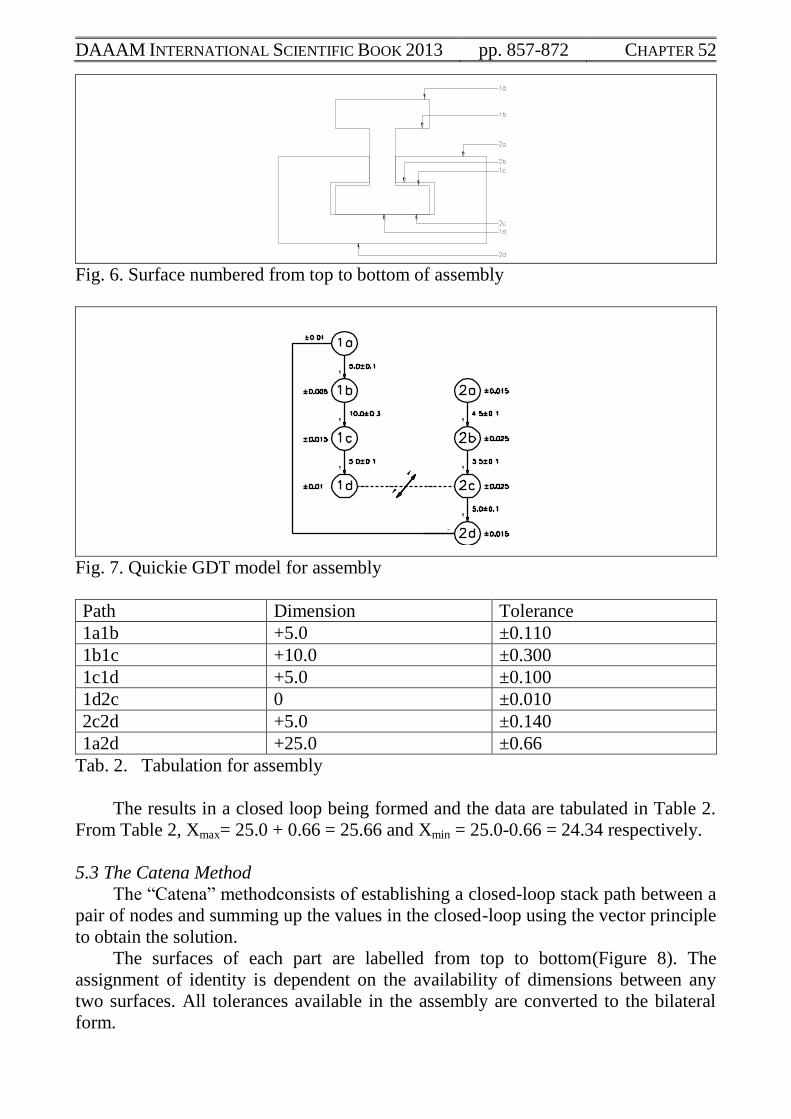
5.2 The Quickie Method
The surfaces are numbered in sequence from top to bottom. Referring to Figure
6, the ‘Quickie’ GDT graphical model is developed and shown in Figure 7.
DAAAM INTERNATIONAL SCIENTIFIC BOOK 2013 pp. 857-872 CHAPTER 52
Fig. 6. Surface numbered from top to bottom of assembly
Fig. 7. Quickie GDT model for assembly
Path Dimension Tolerance
1a1b +5.0 ±0.110
1b1c +10.0 ±0.300
1c1d +5.0 ±0.100
1d2c 0 ±0.010
2c2d +5.0 ±0.140
1a2d +25.0 ±0.66
Tab. 2. Tabulation for assembly
The results in a closed loop being formed and the data are tabulated in Table 2.
From Table 2, Xmax= 25.0 + 0.66 = 25.66 and Xmin = 25.0-0.66 = 24.34 respectively.
5.3 The Catena Method
The “Catena” methodconsists of establishing a closed-loop stack path between a
pair of nodes and summing up the values in the closed-loop using the vector principle
to obtain the solution.
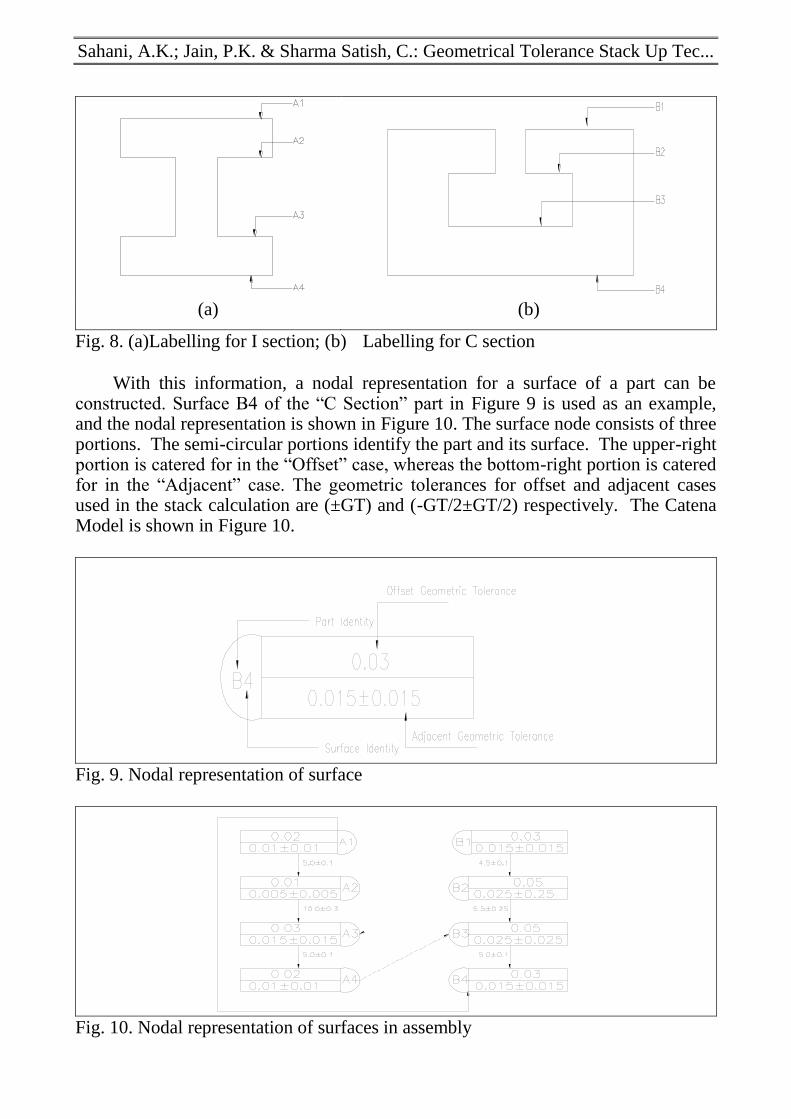
The surfaces of each part are labelled from top to bottom(Figure 8). The
assignment of identity is dependent on the availability of dimensions between any
two surfaces. All tolerances available in the assembly are converted to the bilateral
form.
Sahani, A.K.; Jain, P.K. & Sharma Satish, C.: Geometrical Tolerance Stack Up Tec...
(a) (b)
Fig. 8. (a)Labelling for I section; (b) Labelling for C section
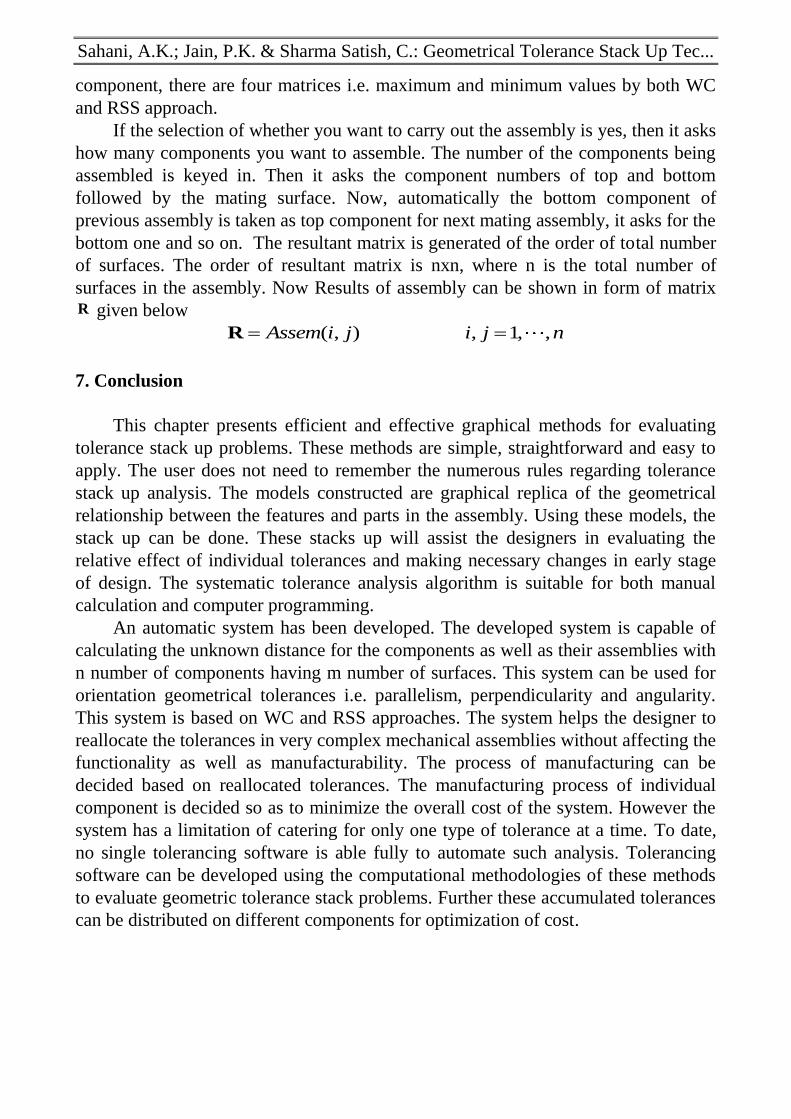
With this information, a nodal representation for a surface of a part can be
constructed. Surface B4 of the “C Section” part in Figure 9 is used as an example, and the nodal representation is shown in Figure 10. The surface node consists of three portions. The semi-circular portions identify the part and its surface. The upper-right portion is catered for in the “Offset” case, whereas the bottom-right portion is catered for in the “Adjacent” case. The geometric tolerances for offset and adjacent cases used in the stack calculation are (±GT) and (-GT/2±GT/2) respectively. The Catena Model is shown in Figure 10.
Fig. 9. Nodal representation of surface
Fig. 10. Nodal representation of surfaces in assembly

DAAAM INTERNATIONAL SCIENTIFIC BOOK 2013 pp. 857-872 CHAPTER 52
Upon the completion of the Catena model, the stack path is identified which
should pass through the dashed line that connects between B3 and A4. The closed
loop path will be A1-B4-B3-A4-A3-A2-A1 and the expression derived is
X ±0.015 – (5.0 ± 0.1) ± 0.025 ± 0.01 – (5.0 ± 0.1) – (10.0 ± 0.3) – (5.0 ± 0.1) ± 0.01
= 0
X = 25.0±0.66
Xmax= 25.66
Xmin= 24.34
5.4 Conventional Method
The extremum of X are calculated as
X= Flatness at 2D+2C2D+ Flatness at 2C+ Flatness at 1D+1C1D +1B1C+1A1B+
Flatness at 1A
= (±0.015) + (5.0+0.1) + (±0.025) + (±0.01)+ (5.0+0.1) + (10.0+0.3)+
(5.0+0.1)+(±0.01)
= 25.0+0.66
So,
Xmax=25.66
Xmin=24.34
However, it is difficult to computerise the conventional method for tolerance
stack up. So, this method is not useful for large assemblies where as graphical
approach techniques provide an opportunity to handle large assemblies by writing a
computer program.
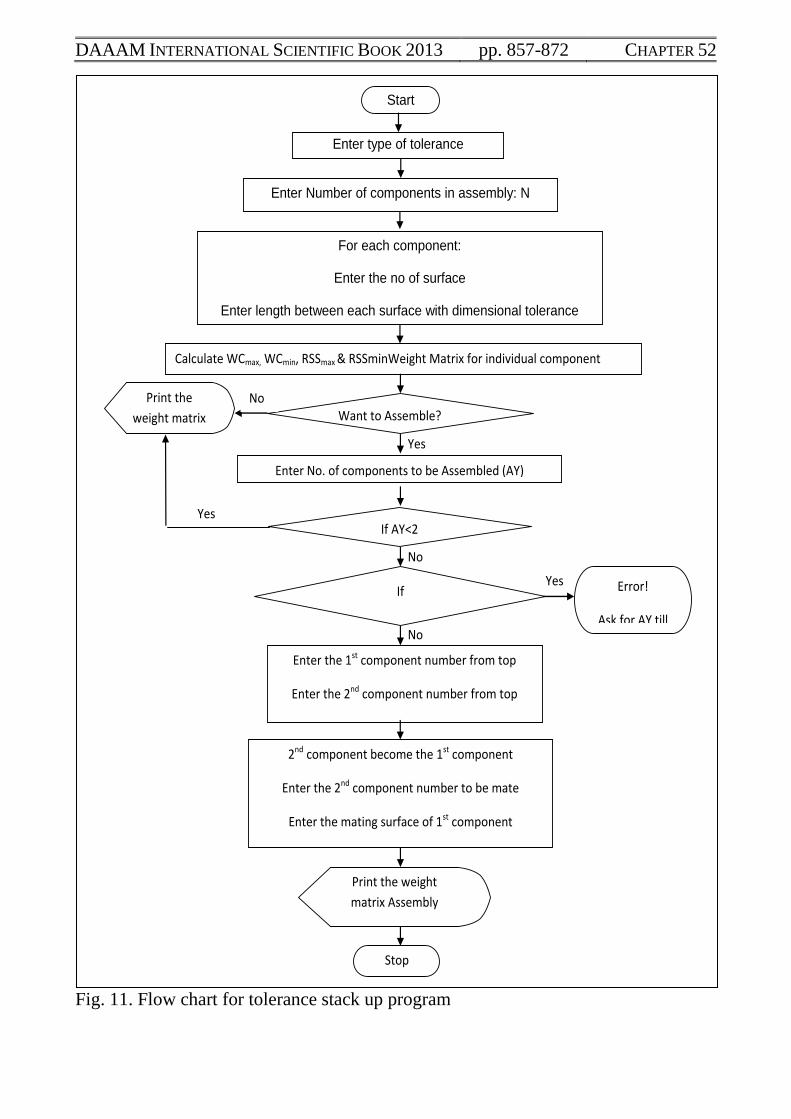
6. Logic for Computation
For calculation of distances between one surface to another, a system has been
developed (Figure 11) for the orientation based geometrical tolerance. While running
the system, it asks for which type tolerance you want to cater for. After key in the
proper tolerance type, it asks the number of components. For each component, we
have to give the input that includes number of surfaces, the distance between one
surface to another. While providing the distances, it also asks for the dimensional
tolerance. Once the above step is completed, the input required is the reference
surface and the parallelism on each surface. After inputting all these details, the
geometrical tolerances are divided by 2 because of bilateral in nature. Same types of
input should be provided for all other components. After that the system asks whether
you want to carry out the assembly of these components. If the answer is no, then the
output is displayed in form of resultant matrix which provide the distance between
one surface to another of same component. The stack up of tolerances has been done
by both technique i.e. worst case and root sum square approach. Hence for each
Sahani, A.K.; Jain, P.K. & Sharma Satish, C.: Geometrical Tolerance Stack Up Tec...
component, there are four matrices i.e. maximum and minimum values by both WC
and RSS approach.
If the selection of whether you want to carry out the assembly is yes, then it asks
how many components you want to assemble. The number of the components being
assembled is keyed in. Then it asks the component numbers of top and bottom
followed by the mating surface. Now, automatically the bottom component of
previous assembly is taken as top component for next mating assembly, it asks for the
bottom one and so on. The resultant matrix is generated of the order of total number
of surfaces. The order of resultant matrix is nxn, where n is the total number of
surfaces in the assembly. Now Results of assembly can be shown in form of matrix R given below
( , ) , 1, ,Assem i j i j n R
7. Conclusion
This chapter presents efficient and effective graphical methods for evaluating
tolerance stack up problems. These methods are simple, straightforward and easy to
apply. The user does not need to remember the numerous rules regarding tolerance
stack up analysis. The models constructed are graphical replica of the geometrical
relationship between the features and parts in the assembly. Using these models, the
stack up can be done. These stacks up will assist the designers in evaluating the
relative effect of individual tolerances and making necessary changes in early stage
of design. The systematic tolerance analysis algorithm is suitable for both manual
calculation and computer programming.
An automatic system has been developed. The developed system is capable of
calculating the unknown distance for the components as well as their assemblies with
n number of components having m number of surfaces. This system can be used for
orientation geometrical tolerances i.e. parallelism, perpendicularity and angularity.
This system is based on WC and RSS approaches. The system helps the designer to
reallocate the tolerances in very complex mechanical assemblies without affecting the
functionality as well as manufacturability. The process of manufacturing can be
decided based on reallocated tolerances. The manufacturing process of individual
component is decided so as to minimize the overall cost of the system. However the
system has a limitation of catering for only one type of tolerance at a time. To date,
no single tolerancing software is able fully to automate such analysis. Tolerancing
software can be developed using the computational methodologies of these methods
to evaluate geometric tolerance stack problems. Further these accumulated tolerances
can be distributed on different components for optimization of cost.
DAAAM INTERNATIONAL SCIENTIFIC BOOK 2013 pp. 857-872 CHAPTER 52
Fig. 11. Flow chart for tolerance stack up program
Yes
Start
Enter type of tolerance
For each component:
Enter the no of surface
Enter length between each surface with dimensional tolerance
Enter reference surface
Enter geometrical tolerance on each surface
Calculate WCmax, WCmin, RSSmax & RSSminWeight Matrix for individual component
Want to Assemble? Print the
weight matrix
Error!
Ask for AY till
2 <AY <N
Enter No. of components to be Assembled (AY)
If AY<2
If
AY > N
Enter the 1st component number from top
Enter the 2nd component number from top
Enter the mating surface of 1st component
Enter the mating surface of 2nd component
No
Yes
Yes
No
Enter Number of components in assembly: N
No
2nd component become the 1st component
Enter the 2nd component number to be mate
Enter the mating surface of 1st component
Enter the mating surface of 2nd component
And so on
Till last component
Print the weight
matrix Assembly
(n x n)
Stop
Sahani, A.K.; Jain, P.K. & Sharma Satish, C.: Geometrical Tolerance Stack Up Tec...
7. References
Ahluwalia, R.S. & Karolin, A.V. (1984). CATC – A computer aided tolerance control
system. Journal of manufacturing system, 3(2), pp.153-160
Chase, K.W. (1999). Minimum cost tolerance allocation, ADCATS Report No. 99-5,
Brigham Young University
Chase, K.W.; Greenwood, W.H.; Loosli, B.G. & Hauglund, L.F. (1990). Least cost
tolerance allocation for mechanical assemblies with automated part selection.
Manufacturing Review, 3(1), pp. 49-59
Drake, Paul J. Jr. (1999). Dimensioning & Tolerancing Handbook, Mc Graw Hill, ISBN 0-
07-018131-4, New York
He, J.R. & Gibson P.R. (1992). Computer Aided Geometrical Dimensioning and
Tolerancing for Process-Operation Planning and Quality Control. Int Adv Manuf Technol, 7,
pp. 11-20
Ngoi B.K.A.; Agrawal A.M. & Chua C.S. (1998). The Nodal Graph Approach to stack
Analysis. Int J Adv Manuf Technol, 14, pp. 343-349
Ngoi, B.K.A. & Goh, L.C. (1997). A ‘stepper’ approach to tolerance charting. Proc Institute
of Mechanical Engineers, Vol 211 Part B, pp. 539-546
Ngoi, B.K.A. & Tan, C.S. (1997). Graphical Approach to Tolerance Charting-A "Maze
Chart" method. Int J Adv Manuf Technol, 13, pp. 282-289
Ngoi, B.K.A.; Agrawal A.M. & Chua, C.S. (2010). The generic capsule approach to
tolerance stack analysis. International Journal of Production Research, 36:12, pp. 3273-
3293
Ngoi, B.K.A.; Lim, L.E.N.; Ang, P.S & Ong, A.S. (2000). The Nexus method for evaluating
geometric dimensioning and tolerancing problems with position callout. Proc Institute of
Mechanical Engineers, Volume 211 Part B, pp. 235-241
Ngoi, B.K.A.; Lim, L.E.N.; Ang, P.S. & Ong, A.S. (1999). Assembly Tolerance Stack
Analysis for Geometric Characteristics in Form Control – the “Catena” Method. Int J Adv
Manuf Technol, 15, pp. 292–298
Ngoi, B.K.A.; Tan, C.S. & Goh, L.C. (1997). Graphical approach to assembly tolerance
stack analysis—the ‘Quickie’ GDT method. Proc Institute of Mechanical Engineers,
Volume No. 211, Part B, pp. 463-472
Sahani, A.K.; Sharma, A.K.; Jain, P.K.; Sharma, Satish C.; Bajpai, J.K. (2011). Review of
Assembly Tolerance Stack up Analysis Techniques for Geometrical Tolerances, Proceeding
International Congerence on Agile Manufacturing, pp. 191+197, Agra, December 2011,
Narosa Publication, New Delhi
Singh, P.K.; Jain, P.K. & Jain, S.C. (2009). Important issues in tolerance design of
mechanical assemblies. Part 1: tolerance analysis. Proc. ImechE, J. Engineering
Manufacture, Vol. 223 Part B, pp. 765-778
Singh, P.K.; Jain, P.K. & Jain, S.C. (2009). Important issues in tolerance design of
mechanical assemblies, Part 2: tolerance synthesis. Proc. ImechE, J. Engineering
Manufacture, Vol. 223 Part B, pp. 1249-1287
Swift, K.G.; Raines M. & Booker, J.D. (1999). Tolerance optimization in assembly stacks
based on capable design. Proceedings of the Institution of Mechanical Engineers, Journal of
Engineering Manufacture, Part B, pp. 677-693
Zhang, C. & Wang, H. (1993). Integrated tolerance optimization with simulated annealing.
International Journal of Advanced Manufacturing Technology, 8, pp. 167-174