GeoMedia 3D - Intergraph · Look around and you will see 3D everywhere – from video games to ......
18
WHITE PAPER GeoMedia ® 3D Integrating 3D and GIS: Intergraph ® Brings You the Full Power of GeoMedia in 3D
Transcript of GeoMedia 3D - Intergraph · Look around and you will see 3D everywhere – from video games to ......

WH
ITE
PA
PE
R
GeoMedia® 3D Integrating 3D and GIS: Intergraph® Brings You the Full Power of GeoMedia in 3D

GeoMedia 3D
Contents
1. GeoMedia 3D .............................................................................................................. 1 1.1 Executive Summary .......................................................................................................................... 1
1.2 System Integration ............................................................................................................................ 1
1.3 An Overview ..................................................................................................................................... 2
2. Working with Content Files .......................................................................................... 3
3. Working with Images ................................................................................................... 6 3.1. Adding Imagery to a 3D View – An Example .................................................................................. 6
4. Working with Area Feature Classes ............................................................................ 7 4.1. Area-based Mapping Examples ...................................................................................................... 7
4.1.1 Hotspot Mapping Example ...................................................................................................... 7 4.1.2 Hovering Area Feature Classes Above the Surface ............................................................... 7 4.1.3 Creating LOD 1 Representations of Buildings ........................................................................ 8 4.1.4 Importing a Collection of Buildings in KMZ Format ................................................................. 8
5. Working with Point Feature Classes ............................................................................ 9 5.1. Explaining Rotation and Model Placement in GeoMedia 3D .......................................................... 9
6. Working with Linear Feature Classes ........................................................................ 10
7. Working with Flight Paths .......................................................................................... 12 7.1. Waypoints and Waypoint Properties ............................................................................................. 12
8. GeoMedia 3D – Viewing the Future .......................................................................... 14
i

GeoMedia 3D
1. GeoMedia 3D
1.1 Executive Summary The general population is becoming immersed in 3D. Google Maps and Bing Maps are ubiquitous as the public becomes global positioning system (GPS) aware. These gateway technologies into location-based thinking are moving to 3D, as are many other technologies we use on a daily basis.
Look around and you will see 3D everywhere – from video games to movies. You can purchase a 3D television from your local appliance store, as well as a 3D DVD player. On cable TV, ESPN and Discovery are commissioning 3D broadcast networks. One way to summarize this onslaught of 3D would be that Generation X is immersed in it, Generation Y will require it, and the general population will soon accept nothing less.
The GIS industry is seeing demand grow for 3D capabilities across all market segments. The availability of commercial and casually-built city models is ramping up demand for GIS incorporation. GIS systems have continued to provide a top-down view as if the world were flat. This is the same view we have had since the first satellites orbited the earth and started capturing images.
We have essentially been trapped in a satellite’s view of the world, until recent years when 3D visualization applications were incorporated into the GIS space. Organizations began including 3D visualization applications alongside their GIS software to provide a more realistic view of GIS datasets. However, these were separate applications and required intermediate file conversions and transfer, requiring you to run two applications side-by-side.
Today, GIS can provide an alternative to the top-down satellite view, enabling you to gain a better understanding of geospatial data. As a result, you can make confident, more informed decisions based on a more thorough understanding of geospatial data as we view it natively in 3D. We are at an inflection point where integrated 3D becomes part of the fabric of GIS. Intergraph’s GeoMedia 3D specifically addresses this innovative shift in GIS and changes the way you view the world.
1.2 System Integration Intergraph has 3D-enabled the GeoMedia desktop. This means a seamless integration of the current capabilities of GeoMedia with a new 3D map window – an extension to the GeoMedia environment. System integration is important to the design of GeoMedia 3D, meaning the new 3D style properties are seamlessly integrated into all workflows.
The new 3D styles should appear as a natural extension to the existing properties dialog box and ideally mimic the model as closely as possible. With this in mind, changing the styles of any legend entry essentially follows the paradigm presented in GeoMedia but updates style dialogs to include a 3D settings tab.
We integrated Skyline technology into GeoMedia for immediate 3D functionality. This technique leverages the well-established 3D visualization of Skyline into the GeoMedia workspace. GeoMedia allows you to access GIS data through connections, which are links that allow the transfer and translation of feature data from the various supported data warehouse types. Warehouses can include both raster feature classes and vector data feature classes.
Displaying feature classes in this context refers not only to displaying any feature within the 3D map window, but also maintaining the connectivity to the feature source. You can interact with the geospatial information (X, Y, and Z) and attribution just like you would with GeoMedia and perform geospatial analytics within the 3D visualization component. Interaction with feature classes rendered in the 3D map window is similar to interaction with a displayed feature in a typical GeoMedia 2D map window.
If you are familiar with GeoMedia, you likely have a working understanding of connections, warehouses, and feature classes. To summarize, connections are the link between GeoMedia and a warehouse. Warehouses are databases that typically contain spatial feature data consisting of points, lines, or areas.
1

GeoMedia 3D
Feature classes are collections of same-type data. For instance, points can represent fire hydrants, lines can represent telephone cables, and areas can represent buildings.
1.3 An Overview Because GeoMedia 3D is an extension to GeoMedia, it inherits all of the rich GeoMedia connectivity through a wide range of data sources. Therefore, you can access any existing GeoMedia connection with GeoMedia 3D, including Open Geospatial Consortium (OGC®) and compliant Web services, such as Web map service (WMS) and Web feature service (WFS).
You can also bring common elevation files into GeoMedia 3D without any pre-processing. Data sources can, however, contain VOID values that are treated as the absence of data, resulting in holes within the surface. In these cases, it is advisable to use surface modeling software, such as GeoMedia Grid or GeoMedia Terrain to pre-process the data and remove these VOID values. If you are processing large numbers of surfaces or images, consider using the Skyline TerraBuilder product for efficiency. For workgroups, or in an enterprise scenario, you can deploy a TerraGate 3D data server based on Skyline technology to provide increased performance when streaming 3D data to a number of 3D clients.
Finally, you can import new data that originated as a 3D model, such as CityGML or Google files, through a utility delivered with GeoMedia 3D to bring them into the 3D environment, and create data records to enable GeoMedia to fully interact with them.
2

GeoMedia 3D
2. Working with Content Files Content files are the foundation to layer your GIS data. GeoMedia 3D resources include two base content files. One file links to a TerraGate server via the Internet and does not require a local terrain file. With this content file, the imagery and terrain are served to a 3D map window via the Internet.
Note: If you intend to display large amounts of imagery and terrain data, consider implementing your own TerraGate server locally as this technology is specifically designed to stream large amounts of data to the GeoMedia 3D map window.
The other base content file links to a local low resolution terrain file and does not require Internet access. In Figures 1 and 2, the two content files appear to yield similar content, but upon closer inspection you will notice that these files contain different imagery and terrain resources.
Figure 1: World Image from a Local Connection Figure 2: World Image from a TerraGate Connection
3

GeoMedia 3D
To illustrate the difference in the two content files noted above, the following "zoom in" example using the San Francisco area in California USA is provided in Figures 3 and 4.
Figure 3: 1:25 million: West Coast North America (San
Francisco highlighted)
Figure 4: 1:25 million: West Coast North America (San
Francisco highlighted)
Figure 5: 1:100,000: San Francisco (Small Area Highlighted) Figure 6: 1:100,000 San Francisco (same area highlighted)
As can be seen from the above example, the quality and resolution of the imagery in the file accessed via the internet (Figure 5) is much higher than the local file (Figure 6). If you were to continue to zoom in on the San Francisco area the imagery would continue to improve and the terrain would also update to reflect the local terrain in the Francisco area. See Figures 7 and 8.
Figure 7: 1:2,000: Football Field (High Oblique View) Figure 8: 1:2,000: Football Field (Low Oblique View)
4

GeoMedia 3D
The *.MPT format, a Skyline format, is the published surface file format. MPT files contain elevation/surface models and associated imagery. The *.FLY format is a container file that can be linked to *.MPTs as well as other 3D objects, vector formats, images, etc.
Note: If you have your own collection of FLY/MPT files, you can make use of these instead of using the default files. However, there are pros and cons associated with working with pre-built Skyline files. In short, you can augment your FLY/MPT files with all kinds of data using GeoMedia 3D. In doing so, you maintain connectivity to the database (e.g., dynamically ask questions of these data and map the answers thematically, just like you would using a 2D map window). Display performance, however, can be affected as the number of features added via GeoMedia 3D increases.
Consider using Skyline products to pre-load some features (e.g., add features that are static to a FLY/MPT file using Skyline). For example, if you have a large collection of ortho-photographs, high-resolution set of terrain files, or 3D models, these features could be pre-loaded into a FLY/MPT file Skyline TerraBuilder and optimized for display, potentially making the process of converting to 3D faster.
Additionally, if you are currently making use of a Skyline TerraGate server, you can use GeoMedia 3D to reference a FLY file that is connected to the TerraGate server and, in turn, have TerraGate stream features into the 3D window.
Note: The TerraGate suite is a family of tools designed to support the client-server data delivery requirements of the Skyline 3D technology. With the TerraGate tools, you can stream terrain databases and features stored on a server to multiple GeoMedia 3D workstations over a network or the internet.
5
GeoMedia 3D
3. Working with Images Imagery is an integral component of both 2D and 3D maps, as it provides realistic backdrops. Imagery in GeoMedia can be ordered (layered one image on top of another). Layering allows you to create a continuous fabric of imagery even when lower and higher resolutions of imagery are used in tandem.
Adding imagery to the 3D map window is no different from adding imagery to your 2D map window; GeoMedia 3D honors the insert image commands and image display properties.
Note: If you intend to display large amounts of imagery and terrain data, consider implementing your own TerraGate servers. as this technology has been specifically designed to stream large amounts of data to the GeoMedia 3D map window.
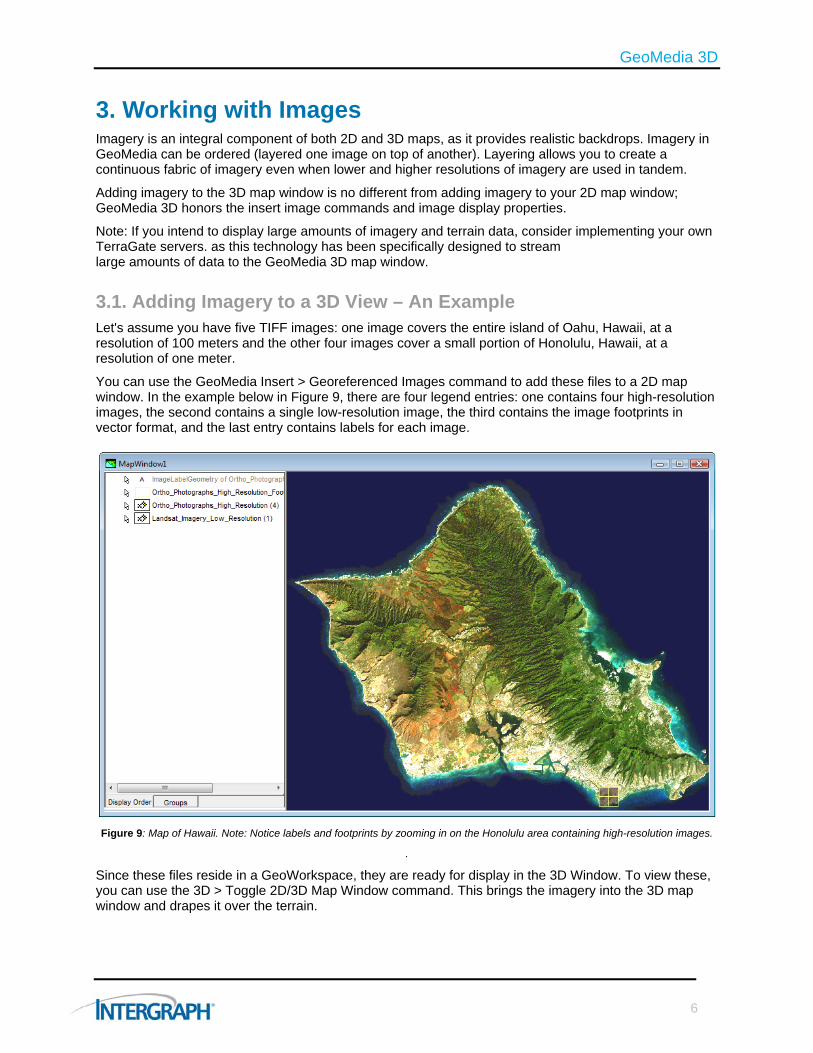
3.1. Adding Imagery to a 3D View – An Example Let's assume you have five TIFF images: one image covers the entire island of Oahu, Hawaii, at a resolution of 100 meters and the other four images cover a small portion of Honolulu, Hawaii, at a resolution of one meter.
You can use the GeoMedia Insert > Georeferenced Images command to add these files to a 2D map window. In the example below in Figure 9, there are four legend entries: one contains four high-resolution images, the second contains a single low-resolution image, the third contains the image footprints in vector format, and the last entry contains labels for each image.
Figure 9: Map of Hawaii. Note: Notice labels and footprints by zooming in on the Honolulu area containing high-resolution images.
.
Since these files reside in a GeoWorkspace, they are ready for display in the 3D Window. To view these, you can use the 3D > Toggle 2D/3D Map Window command. This brings the imagery into the 3D map window and drapes it over the terrain.
6
GeoMedia 3D
4. Working with Area Feature Classes
The addition of 3D not only allows you to create realistic representations of the world, but also gives you access to your GIS data, including any attribution within a 3D environment. With GeoMedia 3D, you can take advantage of this 3D connectivity and create thematic maps where, for example, the height of an extrusion reflects an attribute value, such as assessed value.
4.1. Area-based Mapping Examples
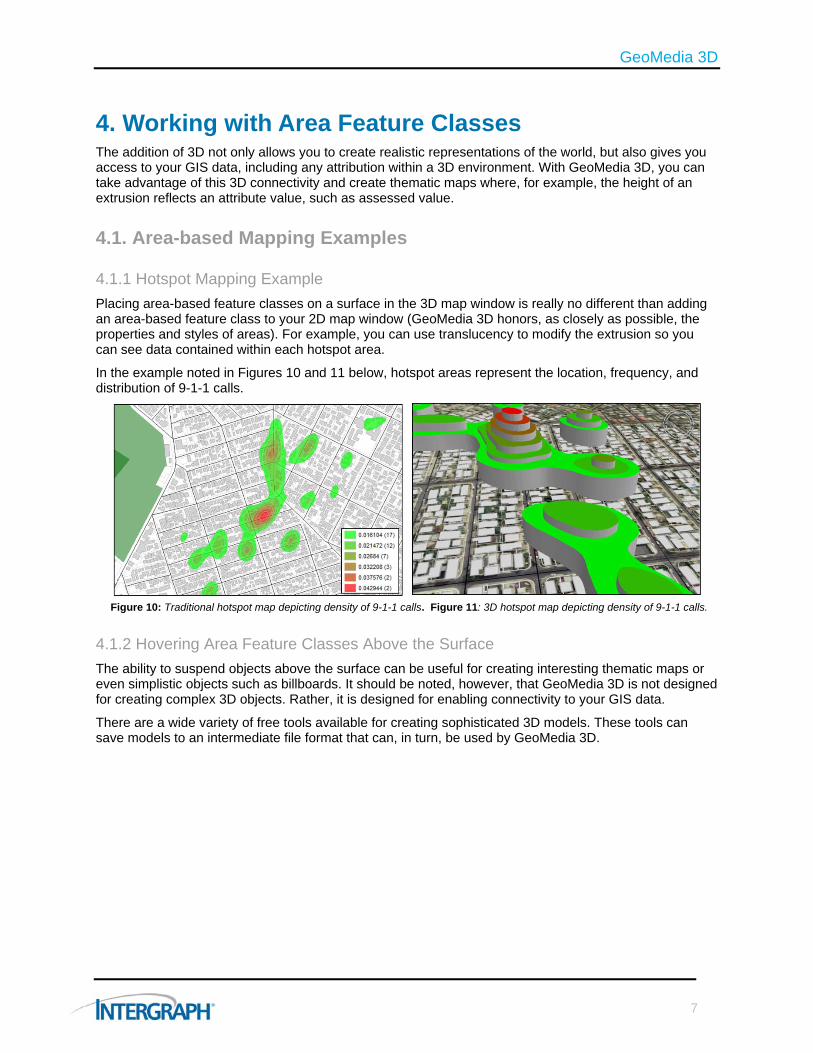
4.1.1 Hotspot Mapping Example Placing area-based feature classes on a surface in the 3D map window is really no different than adding an area-based feature class to your 2D map window (GeoMedia 3D honors, as closely as possible, the properties and styles of areas). For example, you can use translucency to modify the extrusion so you can see data contained within each hotspot area.
In the example noted in Figures 10 and 11 below, hotspot areas represent the location, frequency, and distribution of 9-1-1 calls.
Figure 10: Traditional hotspot map depicting density of 9-1-1 calls. Figure 11: 3D hotspot map depicting density of 9-1-1 calls.
4.1.2 Hovering Area Feature Classes Above the Surface The ability to suspend objects above the surface can be useful for creating interesting thematic maps or even simplistic objects such as billboards. It should be noted, however, that GeoMedia 3D is not designed for creating complex 3D objects. Rather, it is designed for enabling connectivity to your GIS data.
There are a wide variety of free tools available for creating sophisticated 3D models. These tools can save models to an intermediate file format that can, in turn, be used by GeoMedia 3D.
7

GeoMedia 3D
4.1.3 Creating LOD 1 Representations of Buildings You can use GeoMedia 3D to create level of detail (LOD) 1 representations from a feature class containing building footprints, while also maintaining connectivity to your GIS data.
The following applicable definitions of LOD buildings are provided:
Table 1: LOD Definitions
LOD O Only block structure of buildings
LOD 1 Only block structure of buildings with textures
LOD 2 Building structure including shapes of roofs and wall openings like windows and doors
LOD 3 Façade elements
LOD 4 Indoor structures
You can use texture files with attribution to texture the side and/or tops of extruding features, increasing the realism of the buildings.
4.1.4 Importing a Collection of Buildings in KMZ Format You can use GeoMedia 3D to create LOD 1 representations from an area feature class containing building footprints. GeoMedia 3D includes an Import 3D Objects utility that you can use to import a collection of 3D models.
This utility creates an input MDB file as the conversion process generates a new feature class or appends new records to an existing feature class. It also includes a pointer to the 3D model. The pointer allows the 3D Settings tab to link the model for display in the 3D map window. The attribute file also includes the attributes origin_x, origin_y, and origin_z, which are used to correctly position the model when viewed in the 3D map window. The origin_x and origin_y attributes are used to geo-locate the model, while the origin_z attribute is used to place the model relative to the surface at the location specified in x and y.
Note: The system attempts to place the model on the surface; however, if the model was not designed to take change within a surface into account, the model may appear to hover above the surface in some locations.
8

GeoMedia 3D
5. Working with Point Feature Classes Point features are geographic entities that can be described using a single location. These features typically include elements such as fire hydrant locations or incident locations. This data is stored in GeoMedia as a point feature class with numerous styles that apply to them. With GeoMedia 3D, the 2D styles are extended to make use of a wide variety of 3D symbols to create realistic views of existing GIS data. In addition to placing 3D point symbols, you can use attribution in parallel with 3D styles and properties to control the display of point symbols and create 3D thematic maps that can effectively communicate themes. Attribute-based symbology is an integral part of GeoMedia as it allows users to control display characteristics via attribution. This allows programmatic control in conveying a message or theme. For example, with GeoMedia 3D, you can create a map to reflect the relative pressure of each fire hydrant in a city using 3D point symbols. Specifically, a graduated 3D symbol map can use the size of each 3D fire hydrant symbol to reflect the pressure value.
5.1. Explaining Rotation and Model Placement in GeoMedia 3D GeoMedia includes a number of rich geometry editing capabilities, used to add, modify, and manage features. Rotation is vital tool for 3D viewing.
The Edit > Feature > Rotate command interactively rotates one or more existing feature geometries or labels from a read-write connection.
All geometry types can be rotated except images and rectangles. By selecting the command followed by the geometry to be rotated (action-object mode), you can define the rotation angle for the selected features.
9

GeoMedia 3D
6. Working with Linear Feature Classes With the addition of GeoMedia 3D, you can create maps that make use of a wide variety of 3D symbols to create realistic views of linear GIS data. In addition to draping linear features on the surface, you can also use attribution in parallel with 3D styles and properties to control display properties of linear features and create 3D thematic maps that effectively communicate themes.
The ability to drive the display of linear features using Z values and attribution can be useful for creating 3D thematic maps of utilities. In Figure 8 a linear feature class representing a utility lays both below and above the surface and contains vertical runs (i.e., each of the vertices within each line are encoded with a Z value that represents its height/depth relative to a surface).
Upon closer inspection of the data using the Geometry Information command, each of the vertices that make up each line has a Z value relative to the surface as shown in Figure 12.
Figure 12: Linear Features Display
10

GeoMedia 3D
You can control the diameter of a line through the “Use Cylinder with Diameter of List Box” option displayed in Figure 13. This box allows you to enter a value, pick a numeric attribute, or define an expression.
Figure 13: Use Cylinder with Diameter of List Box
If you enter a value, it controls the width of every line representing the feature class.
If you select a numeric attribute, the value of the attribute is used to individually control the width of each line segment in the feature class.
Dynamically control the width using expressions.
After setting these properties, toggle to 3D for a realistic understanding what each line segment is doing relative to the surface and to one another.
While exploring the results using the navigation tools, you can actually navigate both above and below the surface.
11

GeoMedia 3D
7. Working with Flight Paths The ability to fly a predefined route within a 3D environment can prove useful for graphically conveying information. For example, urban planners can evaluate proposed utility corridors or review the aesthetic effects of introducing new buildings into an environment; or intelligence seeking public safety officers may want to visually inspect an area of interest. With flight paths, you can re-fly the exact same path repeatedly. This ability allows you to make iterative modification to the objects that fall within the view of the flight path (i.e., modify terrain, add/remove buildings, add/remove vegetation between each run). Each run can be recorded to evaluate each proposal or scenario.
In GeoMedia 3D, you can create flight paths using a wide variety of tools. You can create, edit, save, manage, and record flight paths.
7.1. Waypoints and Waypoint Properties Flight paths consist of waypoints with specific properties (i.e., height, tilt, rotation, speed, transition, and message). You can individually modify waypoints or modify them as a collection using the “Flight Path” editing commands. (See Figure 14.)
Figure 14: Sample Flight Path in the Editing Window Containing 20 Waypoints
The height value is used to place the viewing platform a specific height above the surface. For example, if you enter a value of 20 and the units of measure for the height value is set to m (meters) for every waypoint in a flight path, the viewing platform will travel along at 20 meters above the surface.
The tilt value sets the viewing tilt for a given waypoint. For example, if you enter a value of 0 and the units of measure for the rotation value is set to deg (degrees), the viewing platform will travel along the select set looking straight ahead at 0-degree tilt relative to the forward direction of the flight path.
Given this paradigm, if you were to enter a value of 45, the viewing platform will travel along a selected line looking ahead at a 45-degree upward angle relative to the forward direction of the flight path. Note: Valid values for the tilt option include -90 (straight down from the relative angle of the flight path) to 90 (straight up from the relative angle of the flight path).
The rotation value sets the viewing angle for a given waypoint. For instance, by entering a value of 0 set to deg (degrees), the viewing platform will travel along the selected line looking forward at a 0-degree angle relative to the forward direction of the flight path. Given this paradigm, if you were to enter a value of 135, the viewing platform will travel along the selected line looking backwards at a 135-degree angle relative to the forward direction of the flight path.
12

GeoMedia 3D
Figure 15: Speed value of 50
The speed value is used to set the speed for a given waypoint. For example, in Figure 15, by entering a value of 50 set to mph, the viewing platform will travel along the selected line at 50 miles per hour. The qualifying units of measure for speed can be set using the 3D > Options command using the options in the “flight defaults” frame. You can set parameters to miles per hour (mph), feet per second (fps), knots, kilometers per hour (kps), and meters per second.
13

GeoMedia 3D
8. GeoMedia 3D – Viewing the Future GeoMedia 3D provides 2D and 3D map windows that allows management of selection and location between them. This does not, however, impose synchronization, as you are free to roam or work in a single map window. Geospatial organizations have spent years collecting, building, and refining existing datasets. GeoMedia 3D extends the GeoMedia environment to enable utilizing that very same data in a 3D environment, controlling how it is represented, and providing options beyond just depicting buildings in 3D. GeoMedia 3D makes it easy for an existing GeoMedia user to quickly understand and learn. Intergraph achieves this through simple modifications to the GeoMedia style properties dialog. A new 3D settings tab has been added to allow you to define the way features appear in 3D. Once set up on a feature class basis, you can save these settings in the GeoMedia workspace or export them to a library for use with other projects, making the 3D settings both persistent and portable. This approach greatly reduces the learning curve and enhances the ability to create a 3D representation from an existing dataset. The capabilities are not just limited to extruding or replacing buildings; you can choose to use other available attributes, write expressions, utilize attribute-based symbols to control appearance, or depict statistical results by symbol and extrusion. In addition to existing geospatial datasets, 3D models are also being built at a rapid pace. The challenge is to integrate the work into 3D models for incorporation into existing geospatial datasets for realistic 3D environments. Intergraph doesn’t envision that you would want to sit at a GeoMedia workstation and design complex 3D models. This is best accomplished offline using software designed for that purpose. Intergraph simply wants to import the finished models and allow you to apply them in the context of GIS analysis. Once a 3D environment is created, you can communicate effectively through flight paths. You can fly a route free-form, fly a selection of linear features, or collect flight data point by point. Using the GIS capabilities of GeoMedia, the flight path is captured as a series of waypoints representing location, or x, y, and z. You can also review and edit the waypoints that make up your flight path afterwards, before you commit it to a video file. If you didn’t fly the route to your satisfaction the first time, there’s no need to try again. You can simply edit the waypoints collected to make any necessary adjustments.
GeoMedia 3D retains all the standard GeoMedia tools at your disposal for spatial queries, spatial analysis, and all other GIS functionality – all enabled in the 3D environment. GeoMedia 3D is not just visualization; it’s the full power of GeoMedia in 3D. With GeoMedia 3D, you can perform the following functions:
Manage and protect critical infrastructure by providing a more realistic understanding of real-world parameters and terrain characteristics
Improve understanding and communication for complex projects
Present data trends intuitively
Provide an effective communication method for smarter, more confident decision-making both internally and externally
Reduce errors caused by data misinterpretation
Defense and Intelligence
Captures complexities of the modern battlefield
Improves force protection and situational awareness
14

GeoMedia 3D
15
Explores complex, multi-dimensional operational scenarios
Government
Visually portrays data trends for crime, traffic, and property values
Assesses visual impact of development projects
Provides project visualization for the public
Public Safety
Enhances resource planning with 3D visualization of crime and incident locations
Visualizes destination for response coordination
Improves disaster preparation and response
Security
Amplifies situational awareness with 3D common operating pictures
Enhances disaster preparation and response
Strengthens skills training through realistic 3D representations
Transportation
Improves road planning via route visualization and fly-throughs
Provides the public with project visualization
Visualizes statistical trends (i.e., traffic, repairs, right-of-way values, etc.)
Utilities and Communications
Assesses ground conditions for infrastructure
Locates targets with subterranean views of underground runs
Integrates all data in a dynamic 3D view
For more information about GeoMedia 3D, visit: www.intergraph.com/GeoMedia3D.

For more information about Intergraph, visit our website at www.intergraph.com.
©2011 Intergraph Corporation. All rights reserved. Intergraph, the Intergraph logo, and GeoMedia are registered trademarks of Intergraph Corporation or its subsidiaries in the United States and in other countries. Other products and brand names are trademarks of their respective owners. Intergraph believes that the information in this publication is accurate as of its publication date. Such information is subject to change without notice. Intergraph is not responsible for inadvertent errors.7/11 SGI-US-0039A-ENG