Geomechanics of the Microseismic Response in … Library/Events/2016/fy16 cs...Geomechanics of the...
18
Geomechanics of the Microseismic Response in Devonian Organic Shales of PA and WV Presented by: Erich V. Zorn, PhD, PG 17 August 2016 Erich Zorn¹, Abhash Kumar¹, Richard Hammack¹, William Harbert¹² ¹ National Energy Technology Laboratory ² University of Pittsburgh Prepared for: CARBON STORAGE AND OIL AND NATURAL GAS TECHNOLOGIES REVIEW MEETING 16-18 August 2016, Sheraton-Station Square, Pittsburgh, PA
Transcript of Geomechanics of the Microseismic Response in … Library/Events/2016/fy16 cs...Geomechanics of the...

Geomechanics of the Microseismic Response in Devonian Organic Shales of PA and WV
Presented by: Erich V. Zorn, PhD, PG
17 August 2016
Erich Zorn¹, Abhash Kumar¹, Richard Hammack¹, William Harbert¹²
¹ National Energy Technology Laboratory ² University of Pittsburgh
Prepared for: CARBON STORAGE AND OIL AND NATURAL GAS TECHNOLOGIES REVIEW MEETING 16-18 August 2016, Sheraton-Station Square, Pittsburgh, PA

Clearfield County Study
Greene County Study
Monongalia County Study
Study Locations
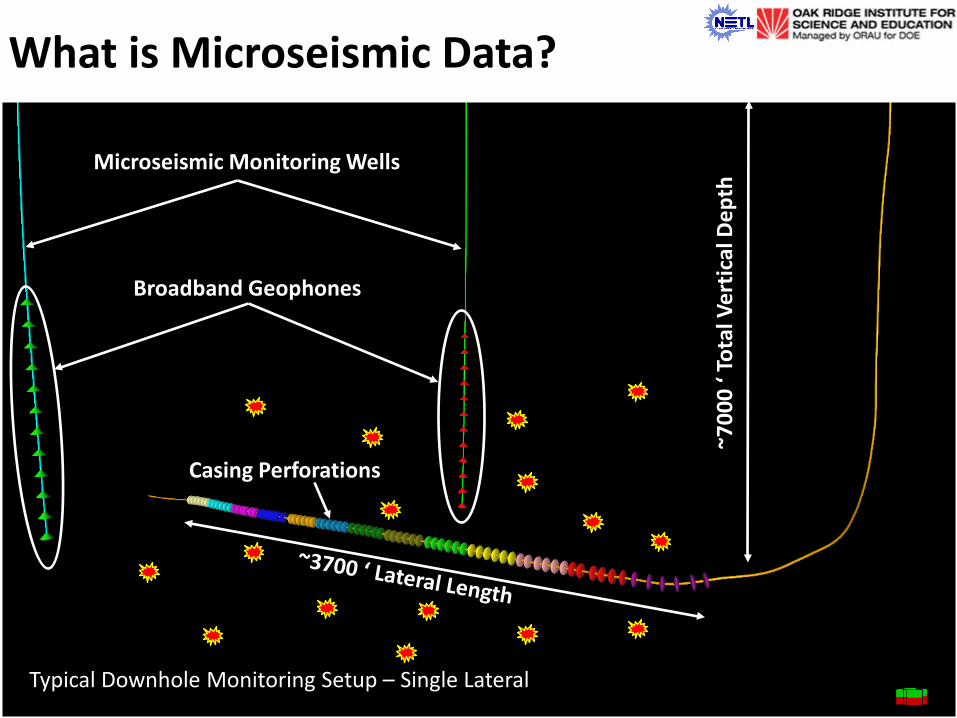
Microseismic Monitoring Wells
Broadband Geophones
~700
0 ‘ T
otal
Ver
tical
Dep
th
Casing Perforations
Typical Downhole Monitoring Setup – Single Lateral
What is Microseismic Data?
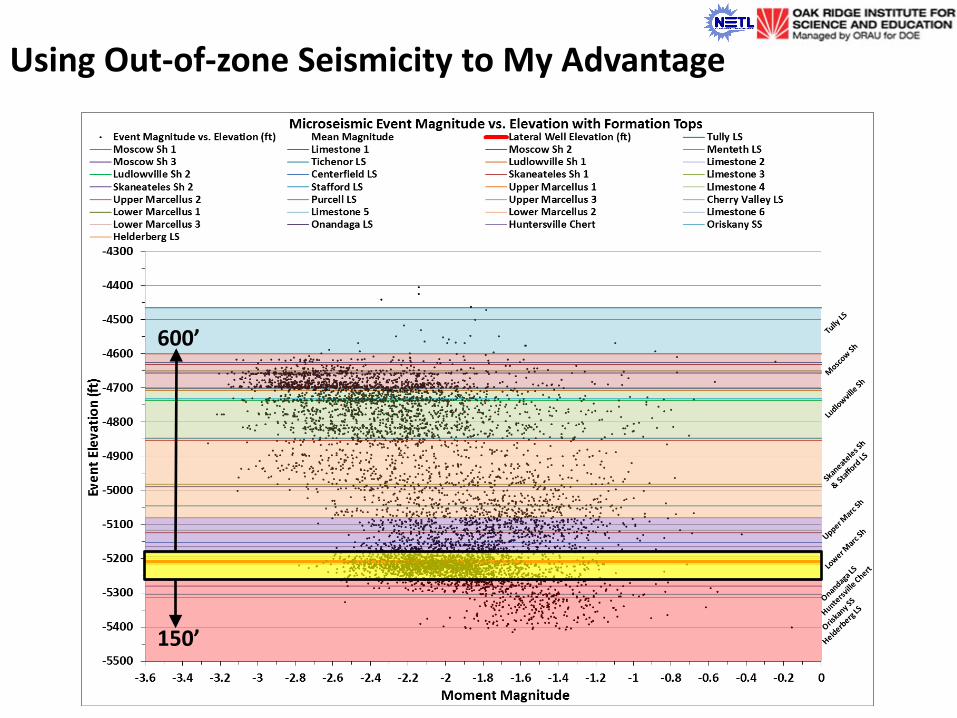
Using Out-of-zone Seismicity to My Advantage
600’
150’

Creating Microseismic “Pseudo-logs”
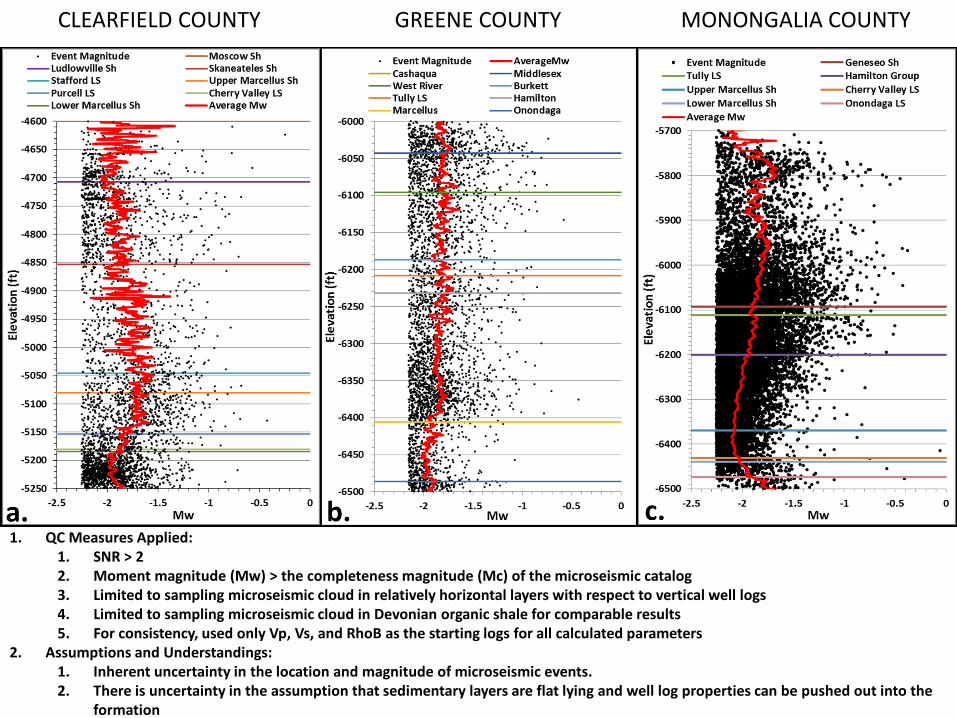
CLEARFIELD COUNTY GREENE COUNTY MONONGALIA COUNTY
1. QC Measures Applied: 1. SNR > 2 2. Moment magnitude (Mw) > the completeness magnitude (Mc) of the microseismic catalog 3. Limited to sampling microseismic cloud in relatively horizontal layers with respect to vertical well logs 4. Limited to sampling microseismic cloud in Devonian organic shale for comparable results 5. For consistency, used only Vp, Vs, and RhoB as the starting logs for all calculated parameters
2. Assumptions and Understandings: 1. Inherent uncertainty in the location and magnitude of microseismic events. 2. There is uncertainty in the assumption that sedimentary layers are flat lying and well log properties can be pushed out into the
formation

CLEARFIELD COUNTY GREENE COUNTY MONONGALIA COUNTY
Microseismic Logs Elastic Property Logs
Microseismic Logs Elastic Property Logs
Microseismic Logs Elastic Property Logs General observations for all three sites: 1. A low b-value (indicating a higher overall insitu stress condition) generally corresponds to a low event count, high average Mw, and high
YM. 2. This makes sense seismologically, agreeing with the laws of Gutenberg and Richter that dictate that large events will occur less
frequently than small events, and the observations of Goertz-Allman etal (2012) that suggest that b-value in the case of microseismic catalogs is inversely proportional to in-situ stress state.
3. b-value (and hence, stress) is certainly linked to the geomechanical properties of the rock. The effects of existing earth stresses can be amplified or diminished according to the ability of the rock to deform elastically.
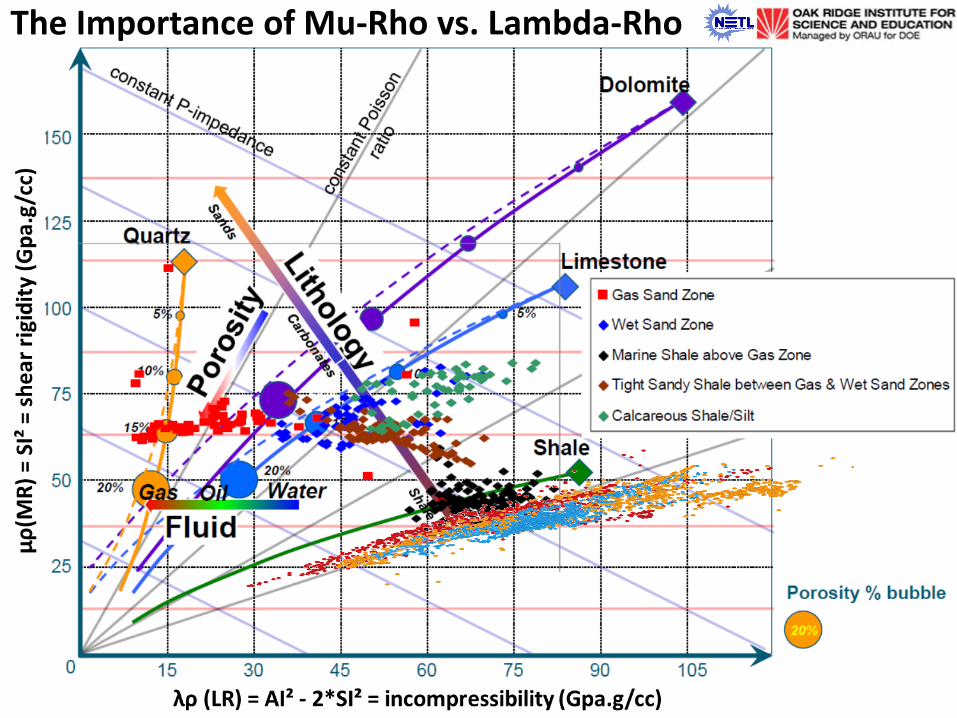
The Importance of Mu-Rho vs. Lambda-Rho
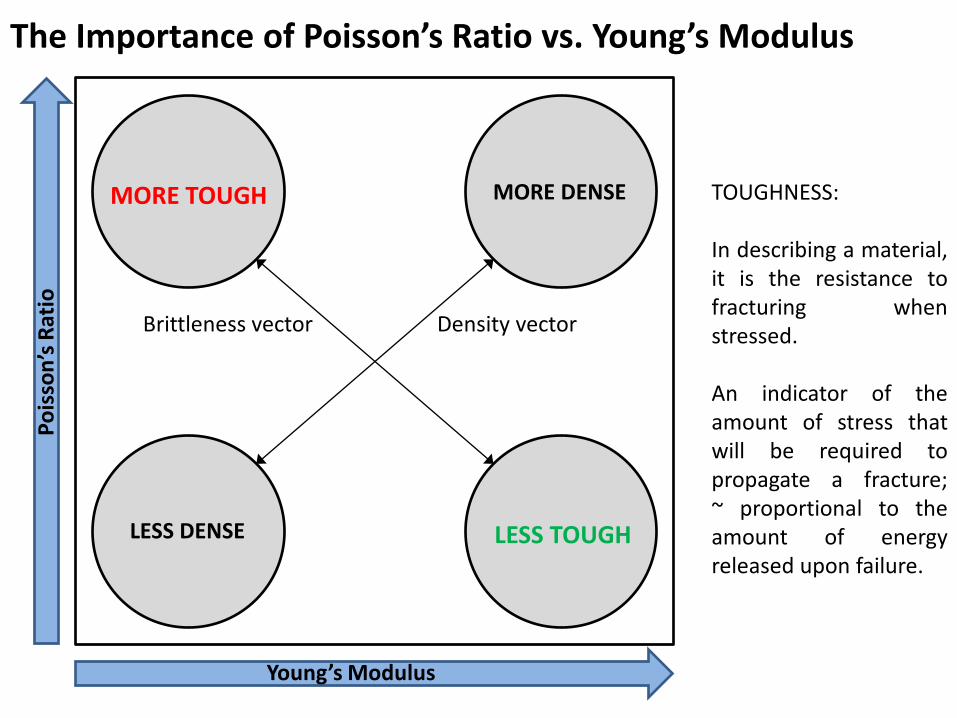
Young’s Modulus
Pois
son’
s Rat
io
MORE BRITTLE LESS DENSE
MORE DENSE LESS BRITTLE
Brittleness vector Density vector
LESS TOUGH
MORE TOUGH TOUGHNESS: In describing a material, it is the resistance to fracturing when stressed. An indicator of the amount of stress that will be required to propagate a fracture; ~ proportional to the amount of energy released upon failure.
The Importance of Poisson’s Ratio vs. Young’s Modulus
90
200
Gam
ma
(API
)
YM = 30 GPa
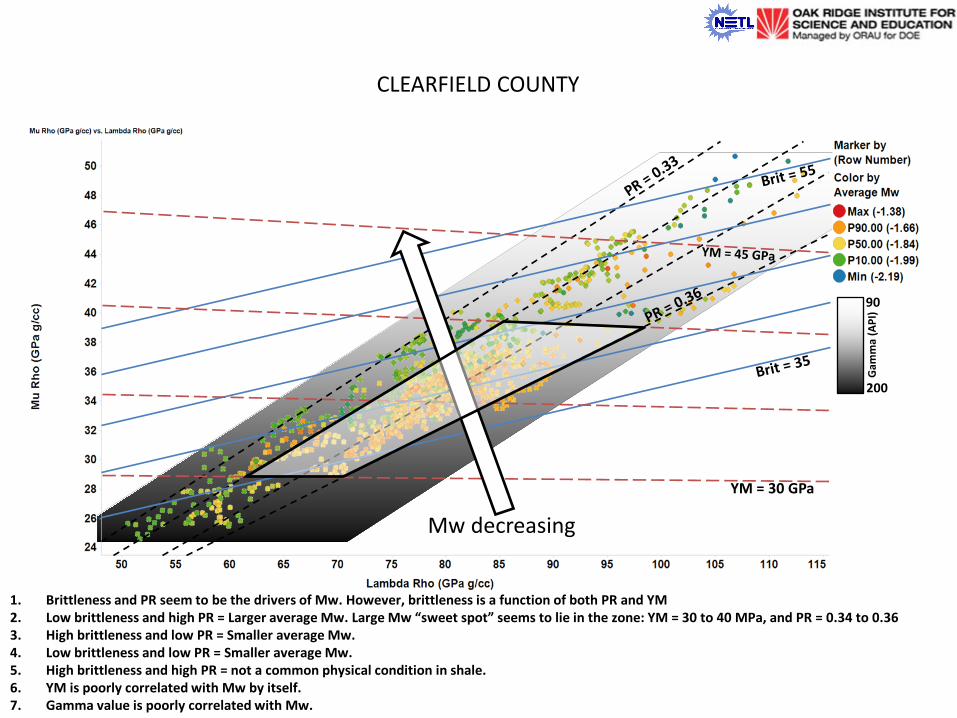
CLEARFIELD COUNTY
1. Brittleness and PR seem to be the drivers of Mw. However, brittleness is a function of both PR and YM 2. Low brittleness and high PR = Larger average Mw. Large Mw “sweet spot” seems to lie in the zone: YM = 30 to 40 MPa, and PR = 0.34 to 0.36 3. High brittleness and low PR = Smaller average Mw. 4. Low brittleness and low PR = Smaller average Mw. 5. High brittleness and high PR = not a common physical condition in shale. 6. YM is poorly correlated with Mw by itself. 7. Gamma value is poorly correlated with Mw.
Mw decreasing
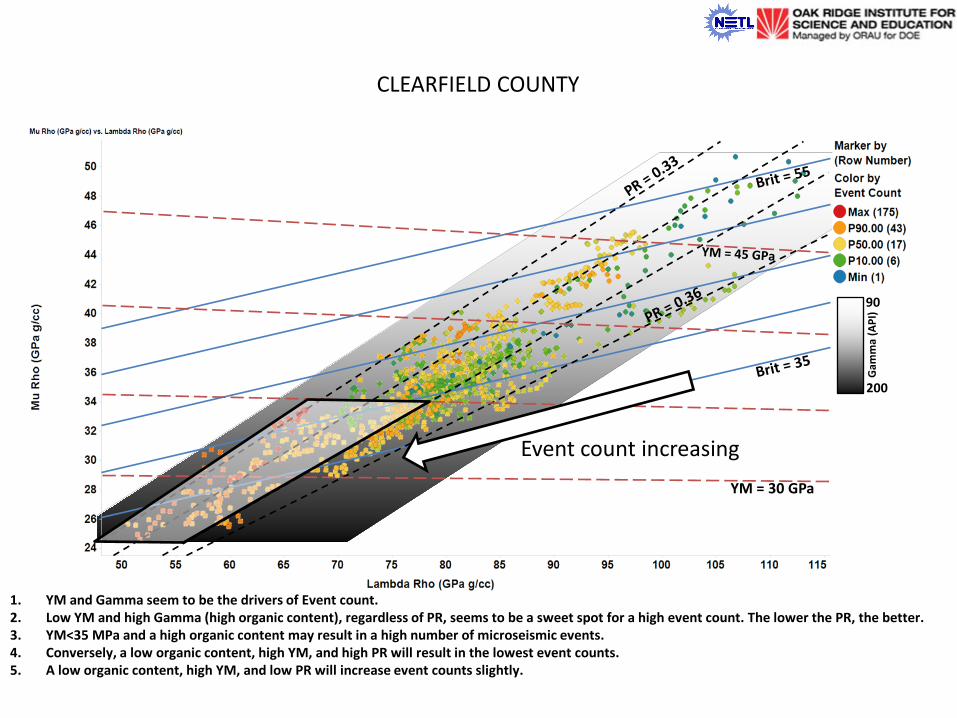
CLEARFIELD COUNTY
90
200
Gam
ma
(API
)
YM = 30 GPa
1. YM and Gamma seem to be the drivers of Event count. 2. Low YM and high Gamma (high organic content), regardless of PR, seems to be a sweet spot for a high event count. The lower the PR, the better. 3. YM<35 MPa and a high organic content may result in a high number of microseismic events. 4. Conversely, a low organic content, high YM, and high PR will result in the lowest event counts. 5. A low organic content, high YM, and low PR will increase event counts slightly.
Event count increasing

90
200
Gam
ma
(API
)
YM = 30 GPa
1. The b-value can be interpreted as an indicator of stress condition. Low b = higher stress. Gamma value seems to highly influence the b-value. 2. YM appears to also be correlated with the b-value. 3. So, low organic content and high YM = higher stress condition. And vice versa. 4. A low YM and high organic content would presumably allow internal stresses to be redistributed more readily, discouraging a high stress condition. 5. In MR vs. LR space, according to Goodway, the state of in-situ stress increases with increasing MR and LR. This is in agreement with our
interpretation.
CLEARFIELD COUNTY
b-value decreasing

80
300
Gam
ma
(API
)
YM = 25.0 GPa
MONONGALIA COUNTY
1. PR, YM, and brittleness all strongly influence the average Mw of microseismicity. 1. High brittleness = larger events; High YM = larger events; High PR = larger events. 2. Low PR rocks can host small to mid-sized events depending upon the YM; e.g. PR = 0.33-0.35 and YM = 25-33 (minimum to P10). Same PR,
but YM = 33-50 (P50 to P90 magnitudes). 2. Mid brittleness and high PR = P90 to maximum average Mw. Large Mw “sweet spot” in the zone: YM = 30 to 40 MPa, and PR = 0.34 to 0.36 3. High brittleness and low PR = P50 to P90 average Mw. 4. Low brittleness and low PR = Minimum to P10 average Mw. 5. High brittleness and high PR = not a common physical condition in shale. Would require abnormally high Young’s Modulus. 6. Gamma value is vaguely correlated with Mw, but larger magnitudes tend to reside in the lower gamma rocks and vice versa.
Mw increasing

MONONGALIA COUNTY
80
300
Gam
ma
(API
)
YM = 25.0 GPa
1. PR seems to be best correlated with Event Count. In general, a high PR results in less microseismic events and vice versa. 2. High PR and high YM will result in the lowest number of microseismic events. 3. Lower PR (0.33 to 0.35) and high YM (40 to 50 Gpa) seems to be the sweet spot for high event count. Overall, low PR results in higher event count.

MONONGALIA COUNTY
80
300
Gam
ma
(API
)
YM = 25.0 GPa
1. The b-value can be interpreted as an indicator of stress condition. Low b = higher stress. 2. Gamma value can be interpreted as an indicator of relative organic content. High gamma = higher organic content. 3. Brittleness (and YM to a lesser extent) appears to be correlated with the b-value. 4. Organic content is generally correlated with b-value. So, low organic content and high Brittleness = higher stress condition. And vice versa. 5. A low YM and high organic content would presumably allow internal stresses to be redistributed more readily, discouraging a high stress condition. 6. In MR vs. LR space, according to Goodway, the state of in-situ stress increases with increasing MR and LR. This is in agreement with our
interpretation.
b-value decreasing
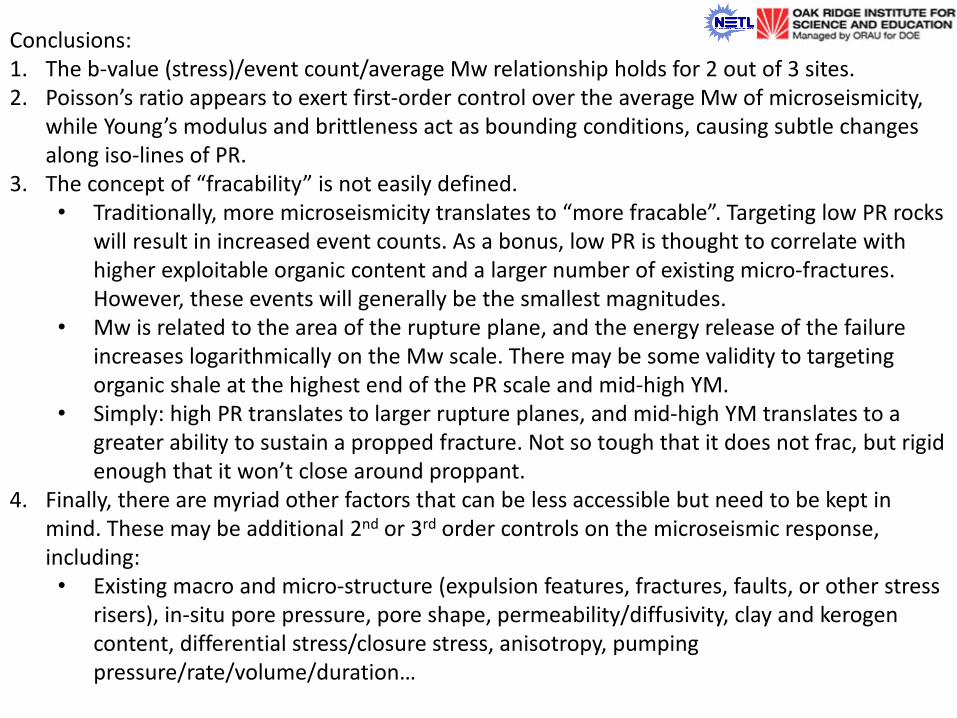
Conclusions: 1. The b-value (stress)/event count/average Mw relationship holds for 2 out of 3 sites. 2. Poisson’s ratio appears to exert first-order control over the average Mw of microseismicity,
while Young’s modulus and brittleness act as bounding conditions, causing subtle changes along iso-lines of PR.
3. The concept of “fracability” is not easily defined. • Traditionally, more microseismicity translates to “more fracable”. Targeting low PR rocks
will result in increased event counts. As a bonus, low PR is thought to correlate with higher exploitable organic content and a larger number of existing micro-fractures. However, these events will generally be the smallest magnitudes.
• Mw is related to the area of the rupture plane, and the energy release of the failure increases logarithmically on the Mw scale. There may be some validity to targeting organic shale at the highest end of the PR scale and mid-high YM.
• Simply: high PR translates to larger rupture planes, and mid-high YM translates to a greater ability to sustain a propped fracture. Not so tough that it does not frac, but rigid enough that it won’t close around proppant.
4. Finally, there are myriad other factors that can be less accessible but need to be kept in mind. These may be additional 2nd or 3rd order controls on the microseismic response, including: • Existing macro and micro-structure (expulsion features, fractures, faults, or other stress
risers), in-situ pore pressure, pore shape, permeability/diffusivity, clay and kerogen content, differential stress/closure stress, anisotropy, pumping pressure/rate/volume/duration…
Work in Progress: • Complete the loop by projecting crossplot results into stratigraphic framework in a
meaningful way. • Compare microseismic from the same formations, but temporally (2.5 years) separate
hydraulic fracturing campaigns.
Opportunity for Collaboration: • Data requirements for this analysis are fairly simple: microseismic data (with good
vertical control), p-sonic, s-sonic, and density logs…

Acknowledgements
US DOE - National Energy Technology Laboratory & Industry Partners Oak Ridge Institute for Science and Education
University of Pittsburgh Departments of Geology and Engineering
Thank You!
Questions?