Geology of the Western Part of Los Alamos National ... · Claudia J. Lewis Alexis Lavine Steven L....
108
LA-13960-MS Approved for public release; distribution is unlimited. Geology of the Western Part of Los Alamos National Laboratory (TA-3 to TA-16), Rio Grande Rift, New Mexico
Transcript of Geology of the Western Part of Los Alamos National ... · Claudia J. Lewis Alexis Lavine Steven L....
LA-13960-MS
Approved for public release;
distribution is unlimited.
Geology of the Western Part of Los Alamos
National Laboratory (TA-3 to TA-16),
Rio Grande Rift, New Mexico

Cover Photos:
Views of a gas pipeline trench through LANL Technical Area 9 graben (see Plate 1).
Top left photo: Cleaning and logging trench walls.
Bottom right photo: Fractured and possibly faulted Bandelier Tuff (Tshirege MemberUnit 4 upper) overlain by thin colluvial cover.
Los Alamos National Laboratory, an affirmative action/equal opportunity employer, is operated by theUniversity of California for the United States Department of Energy under contract W-7405-ENG-36.
This report was prepared as an account of work sponsored by an agency of the United StatesGovernment. Neither the Regents of the University of California, the United States Government norany agency thereof, nor any of their employees make any warranty, express or implied, or assumeany legal liability or responsibility for the accuracy, completeness, or usefulness of any information,apparatus, product, or process disclosed, or represent that its use would not infringe privately ownedrights. Reference herein to any specific commercial product, process, or service by trade name,trademark, manufacturer, or otherwise, does not necessarily constitute or imply its endorsement, recommendation, or favoring by the Regents of the University of California, the United StatesGovernment, or any agency thereof. The views and opinions of authors expressed herein do notnecessarily state or reflect those of the Regents of the University of California, the United StatesGovernment, or any agency thereof. Los Alamos National Laboratory strongly supports academicfreedom and a researcher’s right to publish; as an institution, however, the Laboratory does notendorse the viewpoint of a publication or guarantee its technical correctness.
Edited by Roger Eckhardt
This work was funded by the Office of Infrastructure, Facilities, and Construction of theLos Alamos National Laboratory Operations Directorate.

Claudia J. Lewis
Alexis Lavine
Steven L. Reneau
Jamie N. Gardner
Ryan Channell
C. William Criswell
LA-13960-MS
Issued: December 2002
Geology of the Western Part of Los Alamos
National Laboratory (TA-3 to TA-16),
Rio Grande Rift, New Mexico


Table of Contents
v
TABLE OF CONTENTS
Page
TABLE OF CONTENTS . . . . . . . . . . . . . . . . . . . . . . . . . . . . . . . . . . . . . . . . . . . . . . . . . . . . . . . . . . . . . . .vLIST OF FIGURES AND PLATES . . . . . . . . . . . . . . . . . . . . . . . . . . . . . . . . . . . . . . . . . . . . . . . . . . . . . .viiLIST OF TABLES . . . . . . . . . . . . . . . . . . . . . . . . . . . . . . . . . . . . . . . . . . . . . . . . . . . . . . . . . . . . . . . . . .viii
ABSTRACT . . . . . . . . . . . . . . . . . . . . . . . . . . . . . . . . . . . . . . . . . . . . . . . . . . . . . . . . . . . . . . . . . . . . . . . . .1
I. INTRODUCTION . . . . . . . . . . . . . . . . . . . . . . . . . . . . . . . . . . . . . . . . . . . . . . . . . . . . . . . . . . . . . . . . . .3
II. PREVIOUS WORK . . . . . . . . . . . . . . . . . . . . . . . . . . . . . . . . . . . . . . . . . . . . . . . . . . . . . . . . . . . . . . . .5
III. METHODS . . . . . . . . . . . . . . . . . . . . . . . . . . . . . . . . . . . . . . . . . . . . . . . . . . . . . . . . . . . . . . . . . . . . . .8A. Geologic Mapping . . . . . . . . . . . . . . . . . . . . . . . . . . . . . . . . . . . . . . . . . . . . . . . . . . . . . . . . . . .8B. Geochemistry . . . . . . . . . . . . . . . . . . . . . . . . . . . . . . . . . . . . . . . . . . . . . . . . . . . . . . . . . . . . . . .9C. Examination of Cores from Boreholes . . . . . . . . . . . . . . . . . . . . . . . . . . . . . . . . . . . . . . . . . . .9D. Structural Analysis . . . . . . . . . . . . . . . . . . . . . . . . . . . . . . . . . . . . . . . . . . . . . . . . . . . . . . . . . .11E. Trench Logging . . . . . . . . . . . . . . . . . . . . . . . . . . . . . . . . . . . . . . . . . . . . . . . . . . . . . . . . . . . .11F. Notes on Units of Measure and Terminology . . . . . . . . . . . . . . . . . . . . . . . . . . . . . . . . . . . . . .11
IV. GEOLOGY . . . . . . . . . . . . . . . . . . . . . . . . . . . . . . . . . . . . . . . . . . . . . . . . . . . . . . . . . . . . . . . . . . . . .12A. Stratigraphy . . . . . . . . . . . . . . . . . . . . . . . . . . . . . . . . . . . . . . . . . . . . . . . . . . . . . . . . . . . . . . .12
1. Bedrock units of the Bandelier Tuff . . . . . . . . . . . . . . . . . . . . . . . . . . . . . . . . . . . . . .12a. Tshirege Member of the Bandelier Tuff (Qbt) . . . . . . . . . . . . . . . . . . . . . . . .13
2. Surficial geologic units . . . . . . . . . . . . . . . . . . . . . . . . . . . . . . . . . . . . . . . . . . . . . . . .16a. Older mesa-top alluvial deposits (Qoal) . . . . . . . . . . . . . . . . . . . . . . . . . . . . .16b. Older alluvial fan deposits (Qfo) . . . . . . . . . . . . . . . . . . . . . . . . . . . . . . . . . .17c. Intermediate-age alluvial fan deposits (Qfi) . . . . . . . . . . . . . . . . . . . . . . . . . .17d. El Cajete pumice (Qec) . . . . . . . . . . . . . . . . . . . . . . . . . . . . . . . . . . . . . . . . .17e. Younger alluvial fan deposits (Qfy) . . . . . . . . . . . . . . . . . . . . . . . . . . . . . . . .19f. Stream terraces (Qt) . . . . . . . . . . . . . . . . . . . . . . . . . . . . . . . . . . . . . . . . . . . .19g. Young alluvium along stream channels (Qal) . . . . . . . . . . . . . . . . . . . . . . . .19h. Colluvium (Qc) . . . . . . . . . . . . . . . . . . . . . . . . . . . . . . . . . . . . . . . . . . . . . . .19i. Artificial fill . . . . . . . . . . . . . . . . . . . . . . . . . . . . . . . . . . . . . . . . . . . . . . . . . .20
B. Geochemistry of Bedrock Units . . . . . . . . . . . . . . . . . . . . . . . . . . . . . . . . . . . . . . . . . . . . . . .20C. Structural Geology . . . . . . . . . . . . . . . . . . . . . . . . . . . . . . . . . . . . . . . . . . . . . . . . . . . . . . . . . .22
1. Subsidiary faults of the Pajarito fault zone . . . . . . . . . . . . . . . . . . . . . . . . . . . . . . . . .222. North-striking structures in the eastern part of the Pajarito fault zone . . . . . . . . . . . .223. Fractures and minor faults at Material Disposal Area P . . . . . . . . . . . . . . . . . . . . . . .294. Faults and folds in the easternmost part of the study area . . . . . . . . . . . . . . . . . . . . .32
V. DISCUSSION . . . . . . . . . . . . . . . . . . . . . . . . . . . . . . . . . . . . . . . . . . . . . . . . . . . . . . . . . . . . . . . . . . . .33A. Tshirege Member Stratigraphic Units . . . . . . . . . . . . . . . . . . . . . . . . . . . . . . . . . . . . . . . . . . .33B. Surficial Geologic Units . . . . . . . . . . . . . . . . . . . . . . . . . . . . . . . . . . . . . . . . . . . . . . . . . . . . .35C. Structural Geology . . . . . . . . . . . . . . . . . . . . . . . . . . . . . . . . . . . . . . . . . . . . . . . . . . . . . . . . . .36
Geology of the Western Part of Los Alamos National Laboratory
vi
TABLE OF CONTENTS CONTINUED
Page
1. Origin of fracturing at Material Disposal Area P . . . . . . . . . . . . . . . . . . . . . . . . . . . .362. Structural setting of the study area . . . . . . . . . . . . . . . . . . . . . . . . . . . . . . . . . . . . . . .403. Comparison of structure to previous studies . . . . . . . . . . . . . . . . . . . . . . . . . . . . . . . .414. Ages of faulting and related deformation . . . . . . . . . . . . . . . . . . . . . . . . . . . . . . . . . .43
D. Recommendations . . . . . . . . . . . . . . . . . . . . . . . . . . . . . . . . . . . . . . . . . . . . . . . . . . . . . . . . . .44
VI. ACKNOWLEDGMENTS . . . . . . . . . . . . . . . . . . . . . . . . . . . . . . . . . . . . . . . . . . . . . . . . . . . . . . . . . .44
VII. REFERENCES . . . . . . . . . . . . . . . . . . . . . . . . . . . . . . . . . . . . . . . . . . . . . . . . . . . . . . . . . . . . . . . . .45
APPENDIX A. WHOLE ROCK GEOCHEMISTRY . . . . . . . . . . . . . . . . . . . . . . . . . . . . . . . . . . . . . . . .53
APPENDIX B. STRUCTURAL ANALYSIS . . . . . . . . . . . . . . . . . . . . . . . . . . . . . . . . . . . . . . . . . . . . . .56
APPENDIX C. TOTAL STATION SURVEY DATA . . . . . . . . . . . . . . . . . . . . . . . . . . . . . . . . . . . . . . . .77

List of Figures and Plates
vii
LIST OF FIGURES AND PLATES
Page
FIGURES1. Map of the Rio Grande Rift in Northern New Mexico . . . . . . . . . . . . . . . . . . . . . . . . . . . . . . . . . . . . .32. The Pajarito Fault System . . . . . . . . . . . . . . . . . . . . . . . . . . . . . . . . . . . . . . . . . . . . . . . . . . . . . . . . . . .43. Generalized Bandelier Tuff Stratigraphy . . . . . . . . . . . . . . . . . . . . . . . . . . . . . . . . . . . . . . . . . . . . . . . .64. Bedrock Contacts, Boreholes, Traverses, and Fractures at MDA P . . . . . . . . . . . . . . . . . . . . . . . . . . .105. Bandelier Tuff Stratigraphy in the Study Area . . . . . . . . . . . . . . . . . . . . . . . . . . . . . . . . . . . . . . . . . . .146. Western Part of the TA-9 Trench . . . . . . . . . . . . . . . . . . . . . . . . . . . . . . . . . . . . . . . . . . . . . . . . . . . . . .187. Silica and Titania Variation in Bandelier Tuff . . . . . . . . . . . . . . . . . . . . . . . . . . . . . . . . . . . . . . . . . . .218a. Pajarito Canyon Profile . . . . . . . . . . . . . . . . . . . . . . . . . . . . . . . . . . . . . . . . . . . . . . . . . . . . . . . . . . .248b. Cañon de Valle Profile . . . . . . . . . . . . . . . . . . . . . . . . . . . . . . . . . . . . . . . . . . . . . . . . . . . . . . . . . . . .259a. Contoured Upper Surface of Unit 3T . . . . . . . . . . . . . . . . . . . . . . . . . . . . . . . . . . . . . . . . . . . . . . . . .269b. Contoured Upper Surface of Unit 3 . . . . . . . . . . . . . . . . . . . . . . . . . . . . . . . . . . . . . . . . . . . . . . . . . .2710. Profile of the TA-9 Trench Showing Surveyed Data . . . . . . . . . . . . . . . . . . . . . . . . . . . . . . . . . . . . .2811. Point Density Plots of Poles to Fracture Planes Measured at MDA P . . . . . . . . . . . . . . . . . . . . . . . .3012. Rose Diagrams of Strikes of Fracture Data from MDA P . . . . . . . . . . . . . . . . . . . . . . . . . . . . . . . . .3113. Fracture Aperture Distributions . . . . . . . . . . . . . . . . . . . . . . . . . . . . . . . . . . . . . . . . . . . . . . . . . . . . .3314. Apertures along Traverse 5 . . . . . . . . . . . . . . . . . . . . . . . . . . . . . . . . . . . . . . . . . . . . . . . . . . . . . . . .34
PLATES1. Geologic Map of the Western Part of Los Alamos National Laboratory . . . . . . . . . . .inside rear cover2. Cross Sections A-A' and B-B' . . . . . . . . . . . . . . . . . . . . . . . . . . . . . . . . . . . . . . . . . . . .inside rear cover

Geology of the Western Part of Los Alamos National Laboratory
viii
LIST OF TABLES
Page
1. Mean Values of Some Major Oxides in Tshirege Member Units . . . . . . . . . . . . . . . . . . . . . . . . . . . . .202. Fracture Density Along MDA P Traverses . . . . . . . . . . . . . . . . . . . . . . . . . . . . . . . . . . . . . . . . . . . . . .323. Elevation of Tshirege Member Contacts in Boreholes at Building TA-16-260 Outfall Area,
Cañon de Valle . . . . . . . . . . . . . . . . . . . . . . . . . . . . . . . . . . . . . . . . . . . . . . . . . . . . . . . . . . . . . . . . . . .354. Comparison of Results from Selected Pajarito Plateau Fracture Studies . . . . . . . . . . . . . . . . . . . . . . .37A-1. Locations of Bandelier Tuff Samples . . . . . . . . . . . . . . . . . . . . . . . . . . . . . . . . . . . . . . . . . . . . . . . .53A-2. Major and Trace Element Geochemistry of Bandelier Tuff . . . . . . . . . . . . . . . . . . . . . . . . . . . .54–55B-1. MDA P Fracture Data . . . . . . . . . . . . . . . . . . . . . . . . . . . . . . . . . . . . . . . . . . . . . . . . . . . . . . . . .58–75B-2. Eigenvectors and Uncertainties for MDA P Fracture Data . . . . . . . . . . . . . . . . . . . . . . . . . . . . . . .76C-1. TA-9 Trench Total Station Survey Data . . . . . . . . . . . . . . . . . . . . . . . . . . . . . . . . . . . . . . . . . . .77–94C-2. MDA P Total Station Survey Data . . . . . . . . . . . . . . . . . . . . . . . . . . . . . . . . . . . . . . . . . . . . . . .95–98

1
Abstract
GEOLOGY OF THE WESTERN PART OF LOS ALAMOS NATIONALLABORATORY (TA-3 TO TA-16), RIO GRANDE RIFT, NEW MEXICO
by
Claudia J. Lewis, Alexis Lavine, Steven L. Reneau, Jamie N. Gardner,Ryan Channell, and C. William Criswell
ABSTRACT
We present data that elucidate the stratigraphy, geomorphology, and structure in the westernpart of Los Alamos National Laboratory between Technical Areas 3 and 16 (TA-3 and TA-16).Data include those gathered by geologic mapping of surficial, post-Bandelier Tuff strata,conventional and high-precision geologic mapping and geochemical analysis of cooling unitswithin the Bandelier Tuff, logging of boreholes and a gas pipeline trench, and structuralanalysis using profiles, cross sections, structure contour maps, and stereographic projections.This work contributes to an improved understanding of the paleoseismic and geomorphic his-tory of the area, which will aid in future seismic hazard evaluations and other investigations.
The study area lies at the base of the main, 120-m (400-ft) high escarpment formed by thePajarito fault, an active fault of the Rio Grande rift that bounds Los Alamos NationalLaboratory on the west. Subsidiary fracturing, faulting, and folding associated with thePajarito fault zone extends at least 1,500 m (5,000 ft) to the east of the main Pajarito faultescarpment. Stratigraphic units in the study area include upper units of the Tshirege Memberof the early Pleistocene Bandelier Tuff, early Pleistocene alluvial fan deposits that predateincision of canyons on this part of the Pajarito Plateau, and younger Pleistocene andHolocene alluvium and colluvium that postdate drainage incision.
We discriminate four sets of structures in the area between TA-3 and TA-16: a) north-strik-ing faults and folds that mark the main zone of deformation, including a graben in the centralpart of the study area; b) north-northwest-striking fractures and rare faults that bound theeastern side of the principal zone of deformation and may be the surface expression of deep-seated faulting; c) rare northeast-striking structures near the northern limit of the area associ-ated with the southern end of the Rendija Canyon fault; and d) several small east-west-strik-ing faults. We consider all structures to be Quaternary in that they postdate the TshiregeMember (1.22 million years old) of the Bandelier Tuff. Older mesa-top alluvial deposits(Qoal), which may have a large age range but are probably in part about 1.13 million yearsold, are clearly faulted or deformed by many structures. At two localities, younger alluvialunits (Qfo and Qfi) appear to be truncated by faults, but field relations are obscure, and wecannot confirm the presence of fault contacts. The youngest known faulting in the study areaoccurred in Holocene time on a down-to-the-west fault, recently trenched at the site of a newLANL Emergency Operations Center (Reneau et al. 2002).

Geology of the Western Part of Los Alamos National Laboratory
2

I. INTRODUCTION
Los Alamos National Laboratory (LANL) lieswithin the Española basin of the Rio Grande rift, atectonically active zone of east-west crustal exten-sion (Fig. 1; e.g., Kelley 1979; Manley 1979;Golombek et al. 1983; Chapin and Cather 1994;Kelson and Olig 1995). The Rio Grande rift is amajor tectonic feature of the North American conti-nent and exhibits a long histo-ry of faulting, volcanism, andseismicity (e.g., Riecker 1979;Baldridge et al. 1984; Keller1986). Abundant data indicatethat the rift continues to betectonically and magmaticallyactive (e.g., Sanford et al.1991; Baldridge et al. 1995;Wolff and Gardner 1995;Machette et al. 1998; Steck etal. 1998). In the vicinity ofLos Alamos, the western mar-gin of the rift is locally definedby the Pajarito fault system,which comprises the potential-ly seismogenic Pajarito,Rendija Canyon, and GuajeMountain faults (Fig. 2).Paleoseismic studies indicatethat each of these faults hasgenerated multiple prehistoricearthquakes of approximatemagnitude 7 (Gardner et al.1990; Wong et al. 1995;Kelson et al. 1996; McCalpin1998, 1999). The frequencyand future likelihood of theselarge earthquakes are topicsbeing addressed by theLaboratory’s Seismic HazardsProgram.
The LANL Seismic HazardsProgram is focused in part onevaluating specific areas forseismic surface rupture poten-
tial through detailed studies to identify faults andgain understanding of the area’s structural geology(Olig et al. 1996; Gardner et al. 1998a, 1999, 2001;Krier et al. 1998a, 1998b; Reneau et al. 2002).Previous studies focused on the stratigraphy, geo-morphology, and structure in and around TA-55,TA-3, and TA-16 (Fig. 2) in relation to siting ofnew facilities or evaluation of existing facilities,particularly those that handle hazardous or radioac-
I. Introduction
3
UtahColorado
Arizona
Area ofFigure
New MexicoRio Grande
Rift
50 km0 San Luis Basin
Espanola Basin
~
Sangre de Cristo Mountains
Rift-fillSediments
Quaternary andTertiary Volcanic
Rocks
PrecambrianGranitic Rocks
Santo Domingo Basin
Albuquerque Basin
Santa Fe
LosAlamos
JemezMountains
VC
Albuquerque
N
Figure 1. Map of the Rio Grande Rift in Northern New Mexico.Major fault systems are shown schematically (ball on downthrownside). VC is the Valles-Toledo caldera complex, the source of theBandelier Tuff (modified from Gardner and Goff 1984).

Geology of the Western Part of Los Alamos National Laboratory
4
N
W E
S
0 2 4 km
1790000
1780000
1770000
1760000
1750000
1610000 1620000 1630000 1640000
Nor
thin
g (f
t)
Easting (ft)
EOC-2
97-2
DDGPF
RC
F
GM
F
TA-16
TA-67
PF
StudyArea TA-14
TA-40TA-9
TA-8
TA-69
TA-22TA-6
TA-63
TA-55
TA-58TA-3
Pajarito Canyon
Water Canyon
Cañon de Valle
Los Alamos town site
Landfill
Twomile Canyon
Los Alamos Canyon
Figure 2. The Pajarito Fault System. The map shows the study area and the faults and folds of thePajarito fault system (bold black lines) in the vicinity of Los Alamos National Laboratory. LANL is shadedlight gray. Fine, dark-gray lines are roads; broad, medium-gray lines are technical area boundaries. Bluelines are stream channels. Abbreviations: DDG, Diamond Drive graben; GMF, Guaje Mountain fault; PF,Pajarito fault; RCF, Rendija Canyon fault. Stars indicate sites of paleoseismic trench investigations in thePajarito fault zone (McCalpin 1998; Reneau et al. 2002). The structure in the northwest portion of LANLis from Gardner et al. (1999) and that in the southwest portion of LANL is from Gardner et al. (2001).Coordinates are northing and easting in State Plane Coordinate System, New Mexico Central Zone, 1983North American Datum.

tive materials and have a need for maintaining con-tainment integrity. Difficulties in correlation ofgeologic units among these areas and interpretationof structure in the western area of the Laboratoryhave arisen due to the absence of continuous, con-sistent, and detailed geologic mapping in the areaeast of the Pajarito fault escarpment between TA-3and TA-16. This area contains active facilities thathandle hazardous and radioactive materials, mater-ial disposal areas (MDAs), and sites of ongoingLANL Environmental Restoration (ER) Projectactivities. This area also contains outcrops that arekey to understanding the Quaternary geologic evo-lution of this part of the Pajarito Plateau.
The study area for this report (Fig. 2) covers about8 km2 (3 mi2) contained within a large number oftechnical areas: TA-6, -8, -9, -14, -16 (also knownas S-Site), -22, -40, -67, and -69. The mainemphasis of this study is the geology of the areathat lies between TA-3 and TA-16, including thenorthern part of TA-16 (Plate 1). The study area isdelimited on the north by Twomile Canyon, on thewest by West Jemez Road (NM 501), on the south-east by an arbitrary, northeast-striking boundaryeast of MDA P, and on the southwest by a north-west-striking boundary south of buildings TA-16-260 and TA-16-340 on the south side of Cañon deValle (Plate 1). Bedrock and surficial geologicmapping cover the entire study area. In addition,we have integrated bedrock data from a number ofboreholes that lie south of Cañon de Valle in thevicinity of MDA P and building TA-16-260. Inthis report, we present data on the stratigraphy,geomorphology, and structure of the western partof the Laboratory.
II. PREVIOUS WORK
The most obvious part of the Pajarito fault zone inthe vicinity of the study area is the > 120-m (400-ft) high escarpment west of the Laboratory.Significant advances in understanding the natureand style of deformation in the Pajarito fault zonewere provided by McCalpin (1997) with his recog-
nition that much of the prominent portion of thePajarito fault west of the Laboratory is expressed atthe surface as a large, north-trending, faulted mon-ocline. Along strike, the surface expression of thePajarito fault varies from a simple normal fault tobroad zones of small faults to faulted monoclinesand largely unfaulted monoclines (e.g., McCalpin1997, 1998; Gardner et al. 1999). These variedstyles of deformation are all considered expres-sions of deep-seated normal faulting. The work ofMcCalpin (1997), building on unpublished map-ping by S. Reneau and J. Gardner, also showed thatmuch of the main escarpment was extensivelymodified by mass wasting. Landslides in this areaare cut by pronounced aerial photographic linea-ments and other linear features that cannot be iden-tified as faults with certainty.
Geochemical correlations of Bandelier Tuff units(see Fig. 3 for generalized stratigraphy ofBandelier Tuff) across the main escarpment of thePajarito fault zone near Water Canyon (south of themap area, Fig. 2) indicate that stratigraphic separa-tion on the tuff exceeds 120 m (400 ft) down to theeast (Gardner et al. 2001). Where the fault zonecrosses upper Pajarito Canyon (west of the maparea, Fig. 2), stratigraphic separation on theTshirege Member of the Bandelier Tuff is about79 m (260 ft) down to the east across the mainescarpment [Gardner et al. 2001; shown as~ 155 m (~ 510 ft) by Olig et al. (1996)].
TA-3 to TA-55. Gardner et al. (1999) evaluated thestructure of the western part of the Los Alamostown site and the northwestern part of LANLbetween and including TA-3 and TA-55. North ofLANL and within the Los Alamos town site, thisarea includes two major potentially active normalfaults, the generally north-striking Pajarito andRendija Canyon faults, which bound the DiamondDrive graben (Fig. 2). Near the south side of theLos Alamos town site, the Rendija Canyon faultsplays to the southwest into a broad zone of defor-mation (Gardner et al. 1999). The fault zonewidens from about 610 m (2,000 ft) where it cross-es Los Alamos Canyon and passes through the Los
II. Previous Work
5

Alamos County landfill to about 1,500 m (5,000 ft)in Twomile Canyon. The fault zone appears to dieout just south of Twomile Canyon. In TA-3, theRendija Canyon fault is a zone of distributed defor-mation consisting largely of northeast-striking nor-mal faults with < 3 m (10 ft) of dip slip, mono-clines, and faulted monoclines with < 15 m (50 ft)of vertical deformation on Bandelier Tuff. Thiszone of distributed deformation, including gentlenorthward tilts of structural blocks, forms part ofthe approximate southern boundary of theDiamond Drive graben (Fig. 2). At Twomile
Canyon, net down-to-the-west displacement isabout 10 m (30 ft) on Bandelier Tuff.
Near the southern edge of Los Alamos Canyon,McCalpin (1998) found evidence for five to sevendisplacement events in a trench across one of sev-eral visible fault scarps of the Pajarito fault zone(trench 97-2, Fig. 2). None of these events couldbe dated precisely. All events postdate depositionof alluvium estimated to be several hundred thou-sand years old (thousand years old = ka). Allevents predate formation of a soil horizon that is at
Geology of the Western Part of Los Alamos National Laboratory
6
Qbt 4
1v
Qbt 3
Qbt 3T
Qbt 2
Qbt 1v
Qbt 1g
Qct
QboOtowiMember
TshiregeMember
GuajePumice Bed
TsankawiPumice Bed
Tephras andvolcaniclastic
sedimentsof the
CerroToledointerval
Ban
delie
r T
uff
Ban
delie
r T
uff
Surge beds
Intercalatedsurge beds
Surge beds
Surge beds
Vapor phase notch
Unit 4
Unit 3
Unit 3T
Unit 2
Unit 1Colonnade tuff (Qbt 1v-c)
Upper slope-forming tuffs (Qbt 1v-u)
}
Intercalatedsurge beds
}
Figure 3. Generalized Bandelier Tuff Stratigraphy. The figure shows the stratigraphy of the BandelierTuff and associated deposits (modified from Broxton and Reneau 1995).

least 40 ka. Downward tapering wedges of collu-vium fill what may be Holocene fissures associatedwith faulting. This down-to-the-east fault can betraced some 1,000 m (3,000 ft) to the south, nearlyto the edge of the present study area.
TA-16. In the vicinity of TA-16, deformation asso-ciated with the Pajarito fault extends at least1,500 m (5,000 ft) to the east of the Pajarito faultescarpment (Gardner et al. 2001). Numerousnorth- and northeast-striking faults and monoclineswith small amounts of dip slip, as well as monocli-nal folding of originally east-dipping stratigraphyto horizontal or westward dips, represent a zone ofdistributed faulting and folding that is likely defor-mation of the hanging wall of the Pajarito fault.East of West Jemez Road and about 150 to 500 m(500–1,500 ft) east of the base of the main Pajaritofault escarpment, several down-to-the-west faultsform the eastern side of a graben. A relativelybroad zone of deformation is associated with theeastern margin of this graben. Net down-to-the-west deformation across these faults, together withcontributions from monoclinal folding, is likelygreater than 30 m (100 ft) on Bandelier Tuff. Theeastern margin of the graben can be traced north-wards some 1,000 m (3,000 ft) by an abrupt disap-pearance of exposed bedrock at the surface, a sub-stantial thickness of post-Bandelier sediments, anda topographic anomaly. Gardner et al. (2001) alsoidentified a prominent north-northeast-trending fis-sured lineament that extends for about 760 m(2,500 ft) through TA-16. The northern part of thefissured lineament may have about 2 m (7 ft) of netdown-to-the-west separation on Bandelier Tuff.The fissured lineament is parallel to the local trendof the Pajarito fault escarpment and may locallymark an eastern margin of the zone of young defor-mation associated with the Pajarito fault.
Stratigraphy and structure logged in boreholes at theWeapons Engineering Tritium Facility (WETF) atTA-16 indicated the presence of at least two normalfaults and two fissures, all of which intersect bore-holes and strike north-northeast (Gardner et al.2001). Stratigraphic and structural relations in one
borehole (WETF-2C) indicated that a fissure-open-ing rupture or ruptures occurred sometime prior to8,000 radiocarbon years before present [8 14C ka, or ca. 8.7–9.2 calibrated 14C ka (cal ka)].Subsequently, fissure-fill sediments were faulted ina paleoseismic event or events either sometimebefore deposition of the dated part of the sequence[prior to ca. 8 14C ka (ca. 8.7–9.2 cal ka)], afterdeposition of the entire sequence [since ca. 6 14C ka(ca. 7.1–7.4 cal ka)], or during deposition of thedated sequence [ca. 6–8 14C ka (ca. 7.1–9.2 cal ka)].
In recent years, a great deal of geoscientific workhas been done in the vicinity of MDA P and thebuilding TA-16-260 outfall area (Plate 1) in sup-port of LANL ER Project efforts (e.g., Broxton etal. 1996, 2002; Warren et al. 1997; LANL ERProject 1998). LANL ER Project (1998) reportedresults from 16 boreholes drilled near Cañon deValle. The cores from the boreholes provided newdata important to characterizing units in the upperpart of the Tshirege Member of the Bandelier Tuff.Specifically, Warren et al. (1997) subdivided Unit 4(see below) into a number of petrologic subunits,but others have not been successful in applyingthese subunits consistently in the field (e.g.,Gardner et al. 2001). By correlating borehole logs,LANL ER Project (1998) constructed a three-dimensional subsurface model of the stratigraphyfor the building TA-16-260 outfall area.Subsequently, Broxton et al. (2002) drilled the 592-m (1,942-ft) deep characterization well R-25(Plate 1) on the mesa top south of Cañon de Valle.The R-25 well log provides subsurface data on ele-vations of contacts within the Tshirege Member aswell as underlying rock units.
Budding and Purtymun (1976) show a normalfault, which they termed “the Water Canyon fault,”skirting the eastern side of TA-16; they state thatthe fault exhibits about 9 m (30 ft) of down-to-the-east separation on an unspecified datum in thenorth wall of Water Canyon. Additionally,Reynolds [no date; reported and discussed inDransfield and Gardner (1985)] ran a seismicreflection line along the portion of State Road 4 at
II. Previous Work
7

the southern boundary of TA-16 and reported about15 m (50 ft) of down-to-the-east separation on thebase of the Bandelier Tuff in this area. However,mapping of Gardner et al. (2001) does not indicatethe existence of such a fault in Water Canyon.Brown et al. (1988) reported results from a seriesof shallow drill holes around MDA P, in the north-eastern corner of TA-16, and interpreted that “theWater Canyon fault” displaces the Bandelier Tuff 3to 5 m (10–15 ft) down to the east about 150 m(500 ft) east of MDA P. The existence of this faulthas not been confirmed.
Area between TA-3 and TA-16. A number of small-scale geologic maps encompass the study area(e.g., Griggs 1964; Smith et al. 1970; Gardner andHouse 1987). Previous geologic mapping in ornear the study area of sufficient detail for identifi-cation of geologic structures with respect to specif-ic facilities was done by Rogers (1995) and Reneauet al. (1995). Rogers (1995) identified some of thestructures that we document, but for many struc-tures, we differ from Rogers (1995) in their place-ment and interpretation of their style of deforma-tion (see “Origin of fracturing at Material DisposalArea P” below, page 36). In addition, Rogers(1995) did not recognize some of the structural fea-tures that we have identified by combining bedrockand geomorphic mapping, examination of corefrom boreholes, and detailed structural analysis.
Reneau et al. (1995) identified a fault zone in earlyPleistocene alluvium and Bandelier Tuff atPajarito Mesa, east of our study area. They docu-mented 1.2-m (4-ft) down-to-the-west offset in a20-m (66-ft) wide zone. In addition, they recog-nized 7–9-m (23–30-ft) down-to-the-west dip sep-aration across a 100–200-m (330–660-ft) widezone at a contact within the Tshirege Member.They also found a number of additional faults far-ther west on Pajarito Mesa and Twomile Mesa [upto 4 m (13 ft) separation], at the extreme easternend of our study area (Plate 1). The majority ofthese faults display a down-to-the-west sense ofdisplacement. The most recent faulting in this areaoccurred prior to 50 to 60 ka. The largest offset
faults are east of our study area.
Trenching at the proposed site of a new LANLEmergency Operations Center in the northwestcorner of the study area (Plate 1) characterized thestratigraphy and structure of the east side of agraben at the base of the Pajarito fault escarpment(Reneau et al. 2002). The main zone of faulting inthe trench, with evidence for both normal andstrike-slip displacement, displayed down-to-the-west stratigraphic separation and forms the easternedge of an approximately 160-m (525-ft) widegraben at the base of the east-facing Pajarito faultescarpment. Net vertical separation of 2.0 to 2.5 m(7–8 ft) on post-Bandelier Tuff strata was estimat-ed across the main fault zone in the trench althoughsamples from boreholes indicate a structural depthfor the graben of at least 8 m (24 ft). The addition-al vertical deformation may be accommodated byoffset on relatively old faults that were not exposedin the trench, by westward tectonic tilting, or by acombination of both. The trench exposures provid-ed evidence for a minimum of six surface-ruptur-ing events in the last 1.22 million years, demon-strating the recurring nature of surface faulting atthe site. The most recent event occurred sometimewithin the last 10,500 years.
III. METHODS
A. Geologic Mapping
We mapped bedrock and surficial geologic units inthe field at a scale of 1:1200, using topographicmaps with 2-ft contours derived from the LANL1991 digital elevation model (DEM). We thengenerated base maps from databases of the LANLGeographic Information Systems Laboratory andthe LANL Seismic Hazards Program.
The geologic map (Plate 1) was created usingArcView (© ESRI) and ArcMap (© ESRI). Fieldgeologic maps were digitized using ArcMap. Linesrepresenting geologic features and contacts wereconverted to points for which northing and easting
Geology of the Western Part of Los Alamos National Laboratory
8

coordinates were calculated. Elevations of thesepoints were then obtained from the 1991 DEM.Some geologic contacts were surveyed using a totalstation at MDA P in Cañon de Valle and a 1999 gaspipeline trench north of Cañon de Valle at TA-9[Plate 1; techniques described by Lavine et al.(1997, 1998) and Gardner et al. (1998a, 1999,2001)]. Coordinates of points from digitized geo-logic maps were then integrated and examined withthe surveyed data. We performed detailed comput-er-aided and field analyses of anomalies in pointelevations on certain geologic surfaces. Field datawere analyzed in profiles, geologic cross sections,three-dimensional surface diagrams, and maps con-structed with a variety of software packages. Thedifferent software packages are capable of generat-ing images of the same data at different scales andfrom varied perspectives, enabling exaggerationand identification of subtle elevation anomalies.
The basic soil-stratigraphic framework used in thesurficial mapping is partially derived from previ-ous investigations that included soil pits andtrenches on the western Pajarito Plateau, includingsites both inside and outside the map area (e.g.,Kolbe et al. 1994, 1995; Reneau et al. 1995, 1996a,1996b, 2002; Wong et al. 1995; Longmire et al.1996; McDonald et al. 1996; Reneau andMcDonald 1996; McCalpin 1998, 1999; Phillips etal. 1998; Gardner et al. 2001). Large parts of themap area have been disturbed by human activities,partially obscuring original geologic relations. Inaddition, there are extensive soil-covered areas oflow relief without natural or artificial exposures.Unit designations in these areas were in partinferred based on the lithology of any clasts in thesoil combined with evidence from adjacent areas.An improved map in these areas would requiresubsurface exploration using soil pits, trenches,and/or drilling.
B. Geochemistry
We collected samples of Bandelier Tuff for whole-rock x-ray fluorescence (XRF) analysis to furthersupport unit identification and stratigraphic corre-
lations (see, for example, Krier et al. 1998b;Gardner et al. 1999, 2001). We sampled one mea-sured section on the north side of Cañon de Valle(Plate 1), taking a total of ten samples from an out-crop depth of 5 to 10 cm (2–4 in) to avoid obviousweathering rinds. We also collected samples ofcore from boreholes at MDA P (Fig. 4), on thesouth side of Cañon de Valle, which were drilledby the LANL ER Project in September 2001. Thetwo deepest boreholes were sampled. Eight sam-ples were collected from borehole 273 and 10 fromborehole 257. Sample locations are tabulated inAppendix A, Table A-1.
Major and trace elements were analyzed in 28 bulksamples using an automated Rigaku wavelength-dispersive XRF spectrometer. Results are com-piled in Appendix A. Samples were first crushedand homogenized in 15–20-gram portions in atungsten-carbide shatterbox in accordance withYucca Mountain Project procedure LANL-EES-DP-130—Geologic Sample Preparation. Samplesplits were dehydrated at 110°C for 4 hours andthen allowed to equilibrate with ambient atmos-phere for 12 hours. One-gram splits were fused at1100°C with 9 grams of lithium tetraborate flux toobtain fusion disks. Additional one-gram splitswere heated at 1000°C to obtain the loss-on-igni-tion (LOI) measurements. Elemental concentra-tions were calculated by comparing x-ray intensi-ties for the samples to those for 21 standards ofknown composition, after correcting for absorp-tion. The XRF method employed calculates theconcentrations of ten major oxides (SiO2, TiO2,Al2O3, Fe2O3, MnO, MgO, CaO, Na2O, K2O, andP2O5), ten trace elements (V, Cr, Ni, Zn, Rb, Sr, Y,Zr, Nb, and Ba), and LOI (Appendix A, Table A-2).Elemental concentrations of V, Cr, and Ni in theBandelier Tuff are generally below detection limitsand therefore are not reported in Appendix A.
C. Examination of Cores from Boreholes
Borehole data from previous and parallel studies inthe vicinity have been integrated with our results(LANL ER Project 1998; Criswell et al., in prepa-
III. Methods
9

Geology of the W
estern Part of Los A
lamos N
ational Laboratory
10
8
TRAV 8
Fill
Fill
Cañon de Valle
Qt
Borehole 554
Fill
Qbt3T
Fill
TRAV 5
TRAV 2Fill
West AccessRoad
Fill
TRAV 1
Qbt4l
Borehole 557TRAV 6
Fill
TRAV 7
Qbt3
Fill
Borehole 257
FillFill
1615620 1615820
7350
Borehole 273
Qbt4l
1616020
FillGrid is in the State Plane Coordinate system (in ft), New Mexico Central Zone, 1983 North America Datum
N
0 25 50 100 150 ft
Fill
Qt
Qbt4l
Qbt3T
Qbt3
TRAV 3
TRAV 4Borehole 526
Fill
Fill Fill
Fill
Fill
7400
East AccessRoad
Boreholes
2-ft ContoursRoadStream Channel
Traverse Lines
FracturesSurveyed Fractures and Faults
Legend
Borehole 516
7400
TRAV X
7400
Easting (ft)
1764280
1764480
Nor
thin
g (f
t)
Figure 4. Bedrock Contacts, Boreholes, Traverses, and Fractures at MDA P. Each fracture shown is a schematic representation, showingthe total length accurately but not the shape of the fracture. Fractures measured with a tape are located with an accuracy of better than ± 1.5 m(5 ft). Uncertainty includes errors in surveyed grid points, measurement error, and digitizing error. Fractures and faults indicated with heavy blacklines were surveyed with a total station; accuracy is ± 1 cm. Abbreviation: TRAV, traverse. Stratigraphic units are as shown on Plate 1.Topography is from Carey and Cole (2002).

ration). Locations and stratigraphic data have beentaken from LANL ER Project documents. After re-examination of core from boreholes at the buildingTA-16-260 outfall area, we have modified thestratigraphy of LANL ER Project (1998) based onpetrographic and geochemical comparisons withour field units (see “Discussion,” page 33).
D. Structural Analysis
Across the study area, and much of the PajaritoPlateau, exposure of bedrock is excellent onsouth-facing cliffs in densely welded tuffs. Bycontrast, bedrock exposure is poor on north-fac-ing, colluvium-covered, and vegetated slopes andon mesa tops extensively modified by Laboratoryoperations. Mapping of surficial deposits in rela-tion to topography aids greatly in identification ofpossible faults. To further improve recognition offaults and related structures, we complementbedrock and geomorphic mapping with geometricanalysis of profiles, cross sections, and structurecontour maps.
Data obtained by conventional geologic mappingwere prepared for structural analysis by conversionof lines on the geologic map to points, followed bycalculation of x-y-z coordinates for these pointsusing the 1991 DEM. Inaccuracies in the DEMand the process of digitizing results in small uncer-tainties in point elevations. Profiles were createdby projecting points along a given mesa rim intothe orientation of profile lines shown on Plate 1.Ground-surface elevations were added to theseprofiles by projecting topography from the crown,or high part, of the mesa. This technique mayresult in inaccuracies in the profiles but allows usto project into the profiles the contact betweenBandelier Tuff and post-Bandelier strata where itexists. It also allows us to show the maximum pre-served thickness of post-Bandelier Tuff strata,highlighting thickness variations and, therefore,possible structure. Three-dimensional surfacemodels of selected geologic surfaces were interpo-lated using kriging (a linear regression techniquefor minimizing variance of unsampled values
between points; Deutsch and Journel 1998) andwere then contoured to examine anomalies andtrends in surfaces.
Rigorous geometric analysis of faults and fractureswas possible only at MDA P (Plate 1; Fig. 4)where the LANL ER Project removed 40,000cubic meters (52,000 cubic yards) of contaminatedfill, Bandelier Tuff, and post-Bandelier strata fromthe south side of Cañon de Valle. Restoration ofthe site provided exceptional exposures of thebedrock stratigraphy and the faults and fracturesthat cut it. The excellent exposure at MDA Pafforded an opportunity to measure a large numberof fractures in three different geologic units in athree-dimensional bedrock exposure (seeAppendix B for details on methods; data compiledin Table B-1). With the fracture data, we per-formed a statistical analysis of preferred direc-tions, fracture density, and apertures of fractures.The results can be compared to fracture analysesdone in other parts of the Laboratory (e.g., Kolbeet al. 1994, 1995; Reneau et al. 1995; Wohletz1995; Vaniman and Chipera 1995).
E. Trench Logging
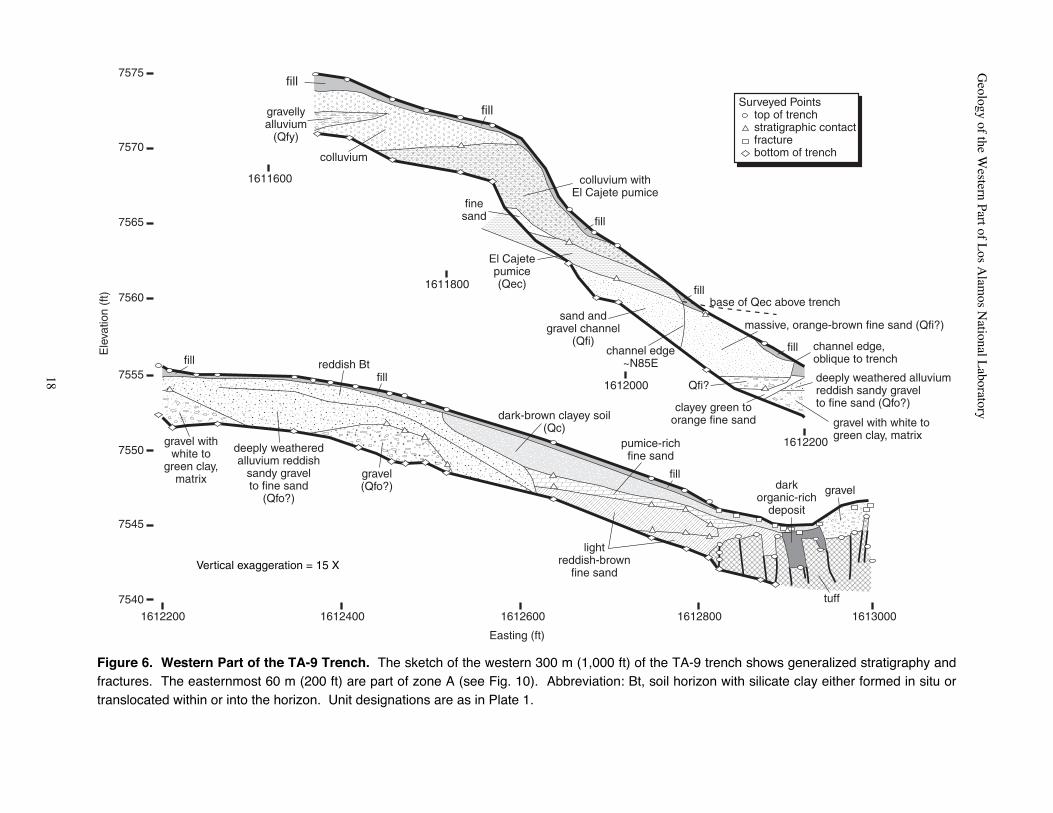
A shallow [~ 1.2-m (4-ft) deep] trench, excavatedin 1999 for a gas pipeline on the mesa top justnorth of Cañon de Valle in the southern part of TA-9 (cover photos; Plate 1; Fig. 2), exposedUnit 4 of the Tshirege Member of the BandelierTuff and post-Bandelier tuff stratigraphic units.The surface of the trench, the contact between allu-vium/colluvium and the upper surface of theBandelier Tuff, several post-Bandelier Tuff strati-graphic units, and fractures and possible smallfaults were surveyed using a total station (datacompiled in Appendix C).
F. Notes on Units of Measure and Terminology
We use a mixture of English and metric units inthis report. For maps and other georeferenced fig-ures, we employ English units because the three-dimensional reference framework for this area (the
III. Methods
11

State Plane Coordinate System, New MexicoCentral Zone, 1983 North American Datum) is infeet, as are most of the LANL engineering data-bases. In all other cases, we use the metric systemfollowing general scientific practice. For lengthmeasurements at the centimeter scale or greater,we provide English units in parentheses adjacentto the metric length.
We use several specialized geologic terms that wedefine here (Bates and Jackson 1980) for optimalunderstanding of the structural interpretations.
• slip—the relative displacement of formerlyadjacent points on opposite sides of a fault,measured in the fault surface. Synonym: totaldisplacement.
• throw—the vertical component of the net slip.
• separation—the distance between any twoparts of an index plane (e.g., bed, dike) dis-rupted by a fault.
• stratigraphic separation—the thickness ofstrata that originally separated two bedsbrought into contact at a fault.
• vertical separation—in a fault, the distancemeasured vertically between two parts of adisplaced marker (e.g., bed).
Where the orientation of a fault plane through stra-ta and the slip vector can be measured, the term slipmay be used. However, in an area such as this ofdominantly normal faulting, finding piercing points(e.g., two points along a faulted stream channel or adike displaced by a fault) is a rare occurrence. Insome cases, we apply the term apparent slip wherewe assume, for example, dip slip. Where we cansee that strata are faulted but cannot measure theorientation of the fault, we use throw or separation,either stratigraphic or vertical. We use displace-ment in the general case or where we wish to con-vey the effects of faulting but the specifics on themagnitude or direction of slip are unknown.
We also use the following terms:
• fracture—a general term for any break in arock, whether or not it causes displacement,due to mechanical failure by stress; the termfractures includes fissures, joints, and faults.
• fissure—a fracture along which there is dis-tinct horizontal opening.
• joint—a surface of fracture or parting in arock, without displacement. Note that thisterm is often applied to fractures in ash-flowtuffs produced by thermal contraction duringcooling, thus the term cooling joints.
• fault—a fracture or fractures along whichthere has been displacement of the sides rela-tive to one another parallel to the fracture.
• fold—a curve or bend of a planar structure,such as rock strata, bedding planes, or folia-tion. A fold is usually a product of deforma-tion, although its definition is descriptive andnot genetic and may include primary struc-tures.
• monocline—a local steepening in otherwiseuniformly dipping strata.
IV. GEOLOGY
A. Stratigraphy
The oldest exposed and most widespread unit inthe study area is the Pleistocene Bandelier Tuff,which forms the local, near-surface bedrock.Overlying the Bandelier Tuff is a variety of mostlyvolcaniclastic surficial units, including the 50 to60 ka El Cajete tephra deposits.
1. Bedrock units of the Bandelier TuffThe Bandelier Tuff consists of two members thatwere erupted as a series of ash flows during enor-mous, caldera-forming volcanic events at about
Geology of the Western Part of Los Alamos National Laboratory
12

1.61 Ma and 1.22 Ma [age from Izett andObradovich (1994)]. Figure 3 shows a general-ized stratigraphy of the Bandelier Tuff and associ-ated deposits. The younger member of theBandelier Tuff, the Tshirege Member, is exposedin the study area, whereas the older member, theOtowi, has been encountered in one relativelydeep hydrologic monitoring well in the study area(well R-25, south side of Cañon de Valle; Plate 1).Beneath the Otowi Member in well R-25 aresands and coarse gravels of the Puye Formation(Broxton et al. 2002), which ranges in age fromabout 7 Ma to about 1.6 Ma (Bailey et al. 1969;Gardner et al. 1986).
a. Tshirege Member of the Bandelier Tuff (Qbt)The stratigraphy for the Tshirege Member that weemploy is largely based on that first presented byBroxton and Reneau (1995) and later modified byGardner et al. (1999, 2001). The stratigraphy ofBroxton and Reneau (1995) is based on coolingunits in the central and eastern parts of theLaboratory and was modified from earlier work ofVaniman and Wohletz (1990). Mapping westwardsfrom central portions of the Laboratory (e.g.,Gardner et al. 1999, 2001) has identified a numberof other mappable Tshirege units not included inthe stratigraphy of Broxton and Reneau (1995).Furthermore, with increasing proximity to thecaldera source of the ignimbrites, the cooling-unitstratigraphy is increasingly difficult to apply ascooling breaks become less distinct. Where possi-ble, we employ the Broxton and Reneau (1995)stratigraphy with modifications and additionsbased on petrographic variations in the sequence(Fig. 3). Subdivisions of the Tshirege Memberhave been used in our bedrock mapping and inanalysis of boreholes at MDA P (Plate 1; Figs. 4and 5). In limited areas on Plate 1, Qbt representsundivided Tshirege Member of the Bandelier Tuff.These areas are mainly on mesa tops or on steepslopes where exposure was too poor to distinguishunits. Tshirege Member stratigraphic unitsexposed in the study area are Unit 3, Unit 3T, andUnit 4, which includes two principal subunits.Stratigraphic thickness was determined from
MDA P boreholes, a measured section north ofMDA P in Cañon de Valle, and map patterns(Figs. 4 and 5; Plate 1). Below are descriptions ofTshirege Member units exposed in the study area.
Unit 3: 21 to 34 m (70–110 ft) thick. The basalpart of Unit 3 and its contact with the underly-ing Unit 2 is exposed just beyond the northeast-ern-most part of the study area. Unit 3 in thatlocation is about 50 m (150 ft) thick. In theMDA P boreholes [where Unit 3 is at least 34 m(110 ft) thick], a lower, nonwelded portion ofUnit 3 exists. Drilling beyond this zone resultedin no recovery of core, likely due to the non-welded and crystal-rich aspect of the tuff in thispart of the section. The top of Unit 3 is markedlocally by a crystal-rich surge deposit. In a fewlocations, we have mapped surges withinUnit 3. The surge deposits are commonly crys-tal-rich (up to 90%), ash-poor, and composed ofsand-sized grains of crystals and both cognateand accidental lithic fragments. In outcrop, andeven in core, these deposits can exhibit sedi-mentary structures that include planar beds andlow-angle crossbeds. The top of Unit 3 is local-ly characterized by gas escape pipes that reachdiameters of more than 10 cm. Unit 3 ispumice-rich (about 30%) compared to theunderlying Unit 2 and contains relatively abun-dant (locally up to 5%) accidental lithic frag-ments, most of which are around 5 cm in diame-ter. In contrast to other units, Unit 3 is moreporphyritic, with at least 30% phenocrysts.Quartz and sanidine occur in subequal amounts,but fairly distinctive of the phenocryst popula-tion of Unit 3 is the relatively coarse crystalsize, with most phenocrysts 4 to 6 mm across.Phenocrysts are most commonly euhedra of sin-gle crystals or single-crystal fragments.
Unit 3T: 0 to 20 m (0–65 ft) thick. Unit 3T(Gardner et al. 1999) pinches out between Units3 and 4 in the eastern part of the study area andthickens progressively to the west. The pinch-out of Unit 3T occurs along a fairly straightnorth-south line (except for rare lenses farther
IV. Geology
13

Geology of the Western Part of Los Alamos National Laboratory
14
0
10
20
30
50
40
Uni
t 4l
Uni
t 3T
BH 273 (7453')TD 120'
60
70
80
90
100
110
120
Uni
t 3
7500'
7450'
7400' 7400'
7450'
7500'
NR
0
10
20
30
Uni
t 3T
BH 516(7420')TD 34'
Par
tly w
elde
d
Unit 4l
Uni
t 3
BH 557(7416')TD 70'
0
10
20
70
30
40
50
60
Uni
t 3T
Uni
t 3
Unit 4l0
10
20
30
40
50
Uni
t 3T
Uni
t 3
BH 554(7417')TD 90'
60
70
80
90
Uni
t 4l
BH 257(7464')TD 180'
0
10
20
30
40
50
Uni
t 3T
No
reco
very
120
110
100
90
80
70
60
130
140
150
160
170
Uni
t 3
180
0
10
BH 526(7413')TD 60'
20
30
40
50
60
Uni
t 3T
Uni
t 3
NR
0
10
20
30
40
50
Uni
t 4u(
npw
)U
nit 3
TMeasured
section(7502')T 167'
Cov
ered 60
70
80
90
100
110
120
130
140
150
160
Uni
t 3U
nit 4
u(w
)U
nit 4
l
?
7350' 7350'
nonweldedignimbritemoderately weldedignimbrite
densely weldedignimbrite
surge bed
breccia
sample
crystal clots
SS
S
S
No
reco
very
S
S
S
S
S
No
reco
very
No
reco
very
NR
No
reco
very
NR
NR
NR
NR
NR
No
reco
very
SS
SS
S
S
S
S
S
S
SS
S
S
SS
S
S
SS
S
NR
NR
NR
NR
Figure 5. Bandelier TuffStratigraphy in the StudyArea. This schematic ofstratigraphic sections showsunits of the Bandelier Tuffand sampling locations in ameasured section and bore-holes at MDA P. Measuredsection and boreholes areprojected into an east-westline and are aligned verticallyby elevation where the bore-hole penetrated the groundsurface. Depth scales are infeet. Units labeled 3, 3T, 4l,4u(npw), and 4u(w) are withinthe Tshirege Member (seetext for discussion). Abbre-viations: BH, borehole; S,geochemistry sample; T,thickness of stratigraphic sec-tion; TD, total depth of bore-hole; NR, no recovery. Thereis no horizontal scale.Borehole locations are indi-cated on Fig. 4 and the mea-sured section on Plate 1.

east) that runs from the Van de GraffAccelerator near the intersection of DiamondDrive and Pajarito Road in TA-3 to the easternedge of MDA P (Cross-section A-A', Plate 2,and map pattern on Plate 1). In several placesnear the eastern pinch-out, Unit 3T crops out inthin lenses before pinching out entirely (Cross-section A-A'). In the vicinity of MDA P, Unit3T is around 2 to 7 m (7–20 ft) thick in sixboreholes and in our measured section on thenorth slope of Cañon de Valle (Fig. 5). Unit 3Tis commonly moderately to densely welded toits top and bottom contacts. Locally, crystal-rich pyroclastic surges occur within Unit 3T aswell as at the contact with overlying Unit 4;however, none of these surges is as continuous,as widespread, or as traceable as those associat-ed with the unit in the TA-3 area to the north(Gardner et al. 1999). Unit 3T is moderatelyporphyritic with about 20 to 25% phenocrysts,but the phenocryst population includes bothlarge (4–6 mm) and small (2–3 mm) crystals.The contact between Unit 3T and the underly-ing Unit 3 is generally sharp where the top ofUnit 3 is partially or moderately welded orwhere the contact is marked by surge deposits(i.e., Pajarito Canyon). However, in outcropnear MDA P, Unit 3 is moderately to denselywelded, making identification of the Unit 3/3Tcontact quite difficult without careful examina-tion of the phenocryst, accidental lithic, andpumice content and/or geochemical analysis.
Unit 4: ~ 0 to 34 m (~ 0–110 ft) thick. Weinclude a number of distinctive packages ofcooling units in Unit 4. In the south-centralpart of the study area, in the vicinity of Cañonde Valle, Unit 4 includes two principal sub-units. The lower subunit, termed Unit 4l (l = lower) in this report, consists of poorly tomoderately welded, crystal-poor ignimbrites,correlative to Unit 4 mapped by Gardner et al.(1998a, 1999) at TA-3 and TA-55. The uppersubunit, termed Unit 4u (u = upper) in thisreport, consists of nonwelded to partially weld-ed ignimbrites [Unit 4u(npw)] with conspicuous
agglomerates of quartz and feldspar crystals(referred to herein as “clots”) and densely weld-ed ignimbrites [Unit 4u(w)] with conspicuouscrystal clots. Unit 4u locally has a nonweldedtop preserved. Units 4u(npw) and 4u(w) arecorrelative to clot-rich Unit 4 mapped byGardner et al. (2001) at TA-16. Some of thesesubunits have been divided out locally in thebedrock mapping, but some could not bemapped consistently throughout the study areabecause they are nonwelded slope formers andtend to be covered with colluvium and vegeta-tion. Where nonwelded Units 4l and 4u(npw)are co-extensive, for example, it is difficult tomap the contact between them. In such areason Plate 1, we have left these units undividedand map them as Unit 4.
Unit 4l, the basal part of Unit 4, is relativelypumice poor (less than 5% pumice) and crystalpoor (10–15% phenocrysts of mostly quartz andfeldspar 2–3 mm across) with rare accidentallithic fragments. Petrographically, this ig-nimbrite strongly resembles Unit 4 as mappedby Gardner et al. (1999) in the TA-3 area. Inaddition, mapping from this study connectedthis part of Unit 4 with that mapped by Gardneret al. (2001). The basal ignimbrite in this seriesis the most widespread part of Unit 4 in thestudy area, although poor exposure preventedus from differentiating it from the overlyingignimbrite where both occur together. Thethickness of Unit 4l varies from around 5 to22 m (15–72 ft), generally thickening to the eastbut with notably thick sections in the buildingTA-16-260 area (Cross-sections A-A' and B-B',Plate 2; also see below). Crystal-rich and ashysurge deposits typically, but not everywhere,mark the contact between Unit 4l and the over-lying clot-rich Unit 4u.
The central part of Unit 4 [Unit 4u(npw)] in thestudy area comprises nonwelded to partiallywelded ignimbrites [0 to 20 m (0–65 ft) thick]with conspicuous crystal clots. Maximumthickness occurs on the north side of Cañon de
IV. Geology
15

Valle near MDA P. The crystal clots are rela-tively large, up to 2 cm, and consist of inter-grown feldspar and quartz with minor amphi-bole and pyroxene. Thin sections reveal thatthese clots are commonly cored with plagio-clase (Gardner et al. 2001).
Unit 4u(npw) is overlain by the most distinctivepart of Unit 4. Unit 4u(w) consists of moder-ately to very densely welded ignimbrites thatcontain large vitrophyric fiamme commonly 15to 20 cm in length as well as abundant crystalclots as found in the underlying nonwelded topartially welded Unit 4u(npw). Unit 4u(w) canbe up to 14 m (45 ft) thick and forms the“caprock” on mesas in the south-central part ofthe study area. This three-part sequence [Units4l, 4u(npw), and 4u(w)] strongly resembles thesequence exposed at the east end of Camp-ground Mesa, above the sharp curves on StateRoad 4 (Gardner et al. 2001). A thin surgesequence [less than 60 cm (2 ft) thick] typically,but not everywhere, separates the principal clot-rich parts of Unit 4 [Units 4u(npw) and 4u(w)].Within the study area, Unit 4u pinches out tothe north and the east (Cross-section B-B',Plate 2, and map pattern on Plate 1). The mostnortherly exposures are located on the southside of Pajarito Canyon. Near the pinch-out,the upper part is only partially welded.
In the south-central part of the map area, oneadditional pyroclastic flow marks the weldingbreak at the base of Unit 4u(w). In westernCañon de Valle and the canyon north of buildingTA-16-340 (Plate 1), the surge sequencebetween Units 4u(npw) and 4u(w) includes athin ignimbrite that thickens to the west.Welding in this ignimbrite also increases to thewest, towards the source, such that the coolingbreak in Unit 4u lies above this thin ignimbriteto the east and below this ignimbrite to the west.
In a few localities, an upper nonwelded part ofUnit 4 is preserved on mesa tops on top of Unit4u(w). This subunit crops out, for example, in
the vicinity of well R-25 (Plate 1). We did notmap this part of Unit 4 as a distinct unit.
2. Surficial geologic unitsSurficial geologic units in the study area that post-date the Bandelier Tuff include a variety of alluvialfan deposits (Qoal, Qf), the El Cajete pumice(Qec), fluvial (Qt, Qal) and colluvial (Qc) deposits,as well as materials disturbed or added by anthro-pogenic works (e.g., fill). Qt and Qal representalluvial deposits along the modern stream channels.
a. Older mesa-top alluvial deposits (Qoal)Unit Qoal consists of dacite-rich alluvium com-monly found on drainage divides between the pre-sent-day watersheds, topographically higher thanthe top of the Bandelier Tuff. Qoal also includessome gravel deposits within shallow tributarycanyons that presently head on the Pajarito Plateau.Qoal varies greatly in thickness and has an estimat-ed maximum thickness of greater than 6 m (20 ft)north and south of Cañon de Valle (Gardner et al.2001) and similar thicknesses north and south ofPajarito Canyon (this study). At the other extreme,Qoal locally consists of discontinuous lag depositsof dacite gravels. Old, post-Bandelier Tuff pumicebeds, partially reworked, are present within themesa-top alluvial deposits at several sites on thePajarito Plateau, including the study area. Thehigh-percentage of pumice in these layers, alongwith their thickness and wide geographic distribu-tion, indicates that they were probably depositedrelatively soon after eruption of the pumice.Geochemical fingerprinting of the pumice indicatesthat the primary source is the Cerro del Mediodome complex in the Valles caldera (e.g.,Appendix D of Reneau et al. 2002). Cerro delMedio lavas have yielded 40Ar/39Ar ages of 1.21 to1.10 Ma [Spell and Harrison 1993; Izett andObradovich 1994; Spell and Harrison (1993) arguethat the most “reliable age” is 1.13 Ma], indicatingan early Pleistocene age for the mesa-top alluviumassociated with these pumice beds. Elsewhere,these gravels may be younger, but they are noyounger than the ca. 50 to 60 ka El Cajete pumice(see Qfi below). The base of Qoal has a gradient
Geology of the Western Part of Los Alamos National Laboratory
16

that is gentler than the modern stream channels inCañon de Valle and Water Canyon (Gardner et al.2001) and in Pajarito Canyon (this study), appar-ently roughly parallel to the original upper surfaceof the Tshirege Member of the Bandelier Tuff.Along Cañon de Valle near MDA P, a unit Qoal2 isdistinguished that is topographically lower thanother nearby gravels to the west and represents ayounger inset deposit. Similarly, Qoal alongPajarito Canyon in the western part of the studyarea is subdivided into three adjacent units of dif-ferent elevations (oldest to youngest: Qoal1,Qoal2, Qoal3).
b. Older alluvial fan deposits (Qfo)Unit Qfo consists of relatively old dacite-rich allu-vial deposits that are typically inset below the topof the Tshirege Member of the Bandelier Tuffalong major canyons in the western PajaritoPlateau; thus, these deposits postdate initialcanyon incision. Stratigraphic relations indicatethat these deposits are younger than nearbydeposits of Qoal and older than intermediate-agefan deposits (Qfi); however, the age range of Qfois unknown, and these deposits may overlap in agewith Qoal and Qfi. In the study area, Qfo occursas several distinct fan segments near Cañon deValle, inset about 6 m (20 ft) below the top ofQoal, with an apparent gradient roughly parallel toQoal (Gardner et al. 2001). Qfo has an estimatedmaximum thickness in the study area of greaterthan 3 m (10 ft).
c. Intermediate-age alluvial fan deposits (Qfi)Unit Qfi consists of intermediate-age alluvial fandeposits that predate the ca. 50 to 60 ka El Cajetepumice (Qec). Qfi includes abundant dacite gravelalong the main drainages that head in the Sierra delos Valles west of the study area but largely con-tains Bandelier Tuff clasts along smaller drainages.Qfi is locally buried beneath younger alluvial fans(Qfy) or colluvium (Qc) [e.g., trench EOC-2,Reneau et al. (2002), and soil pit WJR-4, Reneauand McDonald (1996), pp. 94–96], as well as Qec.Qfi probably includes deposits with a wide rangein age. Where exposed in a 1999 gas pipeline
trench in TA-9 north of Cañon de Valle (Plate 1;Fig. 6), the youngest Qfi deposits are apparentlyonly slightly older than the El Cajete pumicebecause there was only weak soil development inthe Qfi alluvium that directly underlay Qec. Themaximum age of Qfi is uncertain. The distinctionbetween Qfi and Qfo is based on local topographicrelations and is only consistently reliable within agiven drainage. Near Cañon de Valle, Qfi includesmultiple distinct fan lobes, some of which appearto have gradients roughly parallel to Qfy (seebelow) and others that appear to have gradientsroughly parallel to Qfo, supporting the inferencethat Qfi may span a considerable period of time(Gardner et al. 2001).
d. El Cajete pumice (Qec)Unit Qec consists of the El Cajete pumice, derivedfrom the youngest major eruptions from the Vallescaldera and dated at ca. 50 to 60 ka [age fromToyoda et al. (1995) and Reneau et al. (1996b)]. Inthe formal stratigraphy of the Jemez volcanic field,this unit is the El Cajete Member of the VallesRhyolite (Bailey et al. 1969; Gardner et al. 1986).Commonly, Qec consists of primary falloutdeposits of dominantly pumice lapilli that directlyoverlie the pre-eruption soil, but some locations onthe main escarpment of the Pajarito fault provideevidence for local reworking. Trench exposures innearby areas (Kolbe et al. 1994; Reneau et al.1995) have shown that deposits of undisturbedpumice can be quite discontinuous and that thepumice is often highly disrupted by burrowing ani-mals and other forms of bioturbation. The pumicebeds are also typically overlain by colluvial, allu-vial, or eolian deposits (Kolbe et al. 1994; Reneauet al. 1995, 1996a, 1996b; Wong et al. 1995;Reneau and McDonald 1996; Gardner et al. 2001).In the map area, the existence of Qec below thesurface soil can often be inferred from the presenceof abundant pumice in mounds adjacent to animalburrows. We generally made no attempt on Plate 1to separate Qec from overlying colluvium andeolian deposits. Instead, a composite “Qc/Qec”map unit is employed that indicates that Qec is atleast locally present in the shallow subsurface.
IV. Geology
17
Geology of the W
estern Part of Los A
lamos N
ational Laboratory
18
16130001612800161260016124001612200
1612200
1612000
1611800
1611600
7540
7545
7550
7555
7560
7565
7570
7575
Easting (ft)
Ele
vatio
n (f
t)
tuff
graveldarkorganic-rich
deposit
lightreddish-brown
fine sand
pumice-richfine sand
gravel(Qfo?)
reddish Bt
deeply weatheredalluvium reddish
sandy gravelto fine sand
(Qfo?)
deeply weathered alluviumreddish sandy gravelto fine sand (Qfo?)
gravel with white togreen clay, matrixgravel with
white togreen clay,
matrix
fillfill
fill
fill
fill
clayey green toorange fine sand
massive, orange-brown fine sand (Qfi?)
fill
fill
fill
dark-brown clayey soil(Qc)
base of Qec above trenchsand and
gravel channel(Qfi)
channel edge~N85E
colluvium withEl Cajete pumice
Surveyed Pointstop of trenchstratigraphic contactfracturebottom of trench
El Cajetepumice(Qec)
finesand
colluvium
gravellyalluvium
(Qfy)
Qfi?
channel edge,oblique to trench
Vertical exaggeration = 15 X
Figure 6. Western Part of the TA-9 Trench. The sketch of the western 300 m (1,000 ft) of the TA-9 trench shows generalized stratigraphy andfractures. The easternmost 60 m (200 ft) are part of zone A (see Fig. 10). Abbreviation: Bt, soil horizon with silicate clay either formed in situ ortranslocated within or into the horizon. Unit designations are as in Plate 1.

Importantly, previous trench studies (Kolbe et al.1994; Reneau et al. 1995) have shown that evenwhere no undisturbed pumice remains, the top ofthe pre-El Cajete soil can generally still be recog-nized in such areas and used as a key stratigraphichorizon in paleoseismic studies. Maximumobserved thickness of primary fallout El Cajetepumice at LANL is about 2.0 m (6.5 ft) along anorthern tributary to Water Canyon and about2.1 m (7 ft) on Frijoles Mesa about 4.8 km (3 mi)southeast of the study area (Reneau and McDonald1996, pp. 73–75; Gardner et al. 2001).
e. Younger alluvial fan deposits (Qfy)Unit Qfy consists of relatively young alluvial fandeposits that postdate the El Cajete pumice. Insome areas where there is no age control, the dis-tinction between Qfy and Qfi is arbitrary and willprobably require revision. Qfy includes stream ter-races along some drainages, as the distinctionbetween fan and terrace remnants is also oftenarbitrary. The thickness of Qfy is unknown in mostareas. Radiocarbon dates on detrital charcoal fromthe upper part of a 6-m (20-ft) thick section northof Water Canyon are ca. 9.3 to 9.6 14C ka (ca.10.3–10.9 cal ka) and probably closely constrainthe end of fan deposition at that site (Gardner et al.2001). Soils exposed in a pit in Qfy along Cañonde Valle (soil WJR-6, Reneau and McDonald 1996,pp. 93–95) suggest a similar age for that fan unit.A Qfy stream terrace along Water Canyon that wastrenched by Wong et al. (1995) may be of similarage (see also Reneau and McDonald 1996, p. 82).Qfy deposits are as young as 4.7 to 9.4 14C ka(5.5–10.7 cal ka) at trench EOC-2 in the westernpart of the study area (Reneau et al. 2002). In con-trast, at a soil pit on the south fork of PajaritoCanyon, the youngest Qfy depositional event isestimated at ca. 20 to 40 ka where Qfy overliespre-El Cajete (Qfi) fan deposits (soil WJR-4,Reneau and McDonald 1996, pp. 94–96). Qfyoccurs on the modern channel divide between theCañon de Valle and Pajarito Canyon watersheds atTA-9 (Fig. 6), indicating that the Cañon de Vallefan overtopped the drainage divide sometime with-in the past 50 to 60 ka. Along Cañon de Valle, Qfy
has a gradient that is slightly steeper than the mod-ern stream channel, being about 6 m (20 ft) higherthan the channel at the base of the Pajarito faultescarpment but converging with the channel about915 m (3,000 ft) to the east (Gardner et al. 2001).
f. Stream terraces (Qt)Unit Qt consists of stream terraces along the mod-ern drainages. Texturally, this unit includes coarsesand and gravel that represent bed-load sedimentdeposits, medium sand to silt that represents over-bank sediment deposits, and some colluviumderived from adjacent slopes. Based on work inother canyons on the Pajarito Plateau (e.g.,McDonald et al. 1996; Reneau and McDonald1996; Reneau et al. 1996a; Reneau 2000), Qt has aprobable age range from late Pleistocene to lateHolocene. In many areas, Qt was not broken outseparately from Qal. The thickness of Qt has notbeen determined in the map area but could rangefrom < 1 m to > 10 m (~ 3–33 ft).
g. Young alluvium along stream channels (Qal)Unit Qal consists of relatively young alluviumalong stream channels and includes presently activechannels and adjacent floodplains, low terraces,and associated colluvium. Qal also includes activechannels with little or no alluvium in some areas.Radiocarbon dates indicate a middle Holocene agefor a buried Qal terrace in one area in Cañon deValle near MDA P (Gardner et al. 2001).
h. Colluvium (Qc)Unit Qc includes deposits with a wide range in tex-ture, origin, and age that were not practical to sub-divide in this investigation. The term “colluvium”is used in this report to include both deposits onsteep slopes that record primarily gravity-driventransport and deposits on gentle slopes that recorddeposition by surface runoff. As used in this con-text, the distinction between colluvium and alluvi-um is somewhat arbitrary and is made solely forconvenience in mapping. In addition, Qc includesfine-grained deposits that are probably dominatedby eolian sediment, although this eolian sedimentmay be locally reworked by surface runoff and/or
IV. Geology
19

mixed with other material by bioturbation. Qc alsolocally includes dark organic-rich deposits, asexposed in the 1999 gas pipeline trench at TA-9(Fig. 6). Qc includes deposits that range in agefrom > 50 to 60 ka (pre-Qec) to present. Evidencefor the eolian origin of some early Holocene andlate Holocene deposits on Pajarito Mesa, east ofthe map area, is presented in Reneau et al. (1995,1996a), and eolian deposits of similar age may bewidespread in the study area. On Plate 1, Qc is inmany places included in other map units and notbroken out separately. Where possible, the unitdirectly underlying Qc is noted in the map designa-tion to aid in interpreting the distribution of differ-ent units; for example, “Qc/Qbt” indicates that thincolluvium overlies tuff.
i. Artificial fillArtificial fill and anthropogenic disturbances arewidespread in the map area. On Plate 1, this unitlocally includes highly disturbed areas such asroads, parking lots, and borrow pits. Many areasthat include patchy or thin fill were mapped insteadas the underlying stratigraphic unit.
B. Geochemisty of Bedrock Units
Geochemical compositions of samples obtained inthis study are similar to compositions of TshiregeMember samples from previous studies on thePajarito Plateau (Table 1; Appendix A). Silica(SiO2), titania (TiO2), zirconium (Zr), strontium(Sr), rubidium (Rb), and barium (Ba) concentra-tions are each strongly zoned with respect tostratigraphy and have been shown to effectivelydifferentiate among units within the TshiregeMember of the Bandelier Tuff (Broxton et al. 1996;Warren et al. 1997; Gardner et al. 1998a, 1999,2001; Krier et al. 1998a, 1998b; Stimac et al.1998). As demonstrated in previous work,Tshirege Member samples show systematic varia-tions from higher silica to slightly lower silica andfrom lower titania to higher titania toward the topof the section. Titania is the single most usefulmajor-element oxide used for unit identificationthroughout most of the Tshirege Member sequence.
The variation in SiO2 and TiO2 in the measuredsection and cores from MDA P show geochemicaltrends similar to those observed in areas to thenorth, west, and south of the present study area(Gardner et al. 1999, 2001; Fig. 7; Table 1).Table 1 shows trends towards lower SiO2 and high-er TiO2 upsection in the upper units of the TshiregeMember. The geochemical results in all cases con-firmed field petrographic calls.
The geochemical data reveal an unusual compo-nent of Unit 4 in MDA P boreholes 257 and 273(Figs. 4 and 7), identified previously in WaterCanyon on the adjacent Pajarito fault escarpment,and in the bedded-ash and surge sequence at thebase of Unit 4 in most of the WETF boreholes(Gardner et al. 2001). The lowermost three sam-ples of Unit 4 in MDA P borehole 257 and the sin-gle sample of Unit 4 in borehole 273 have distinc-tively high TiO2 (> 0.35 wt %), high Ba concentra-tions (490–600 ppm), and moderately high SiO2
(70–72 wt %). Basal portions of Unit 4 within thestudy area therefore exhibit the high Ba and highTiO2 but not the low SiO2 whole-rock chemistry ofbasal portions of Unit 4 observed in nearby areas(Gardner et al. 2001). Some of the samples fromMDA P boreholes could have artificially high Baconcentrations due to contamination from waste
Geology of the Western Part of Los Alamos National Laboratory
20
Table 1. Mean Values of Some Major Oxidesin Tshirege Member Units*
Number of Weight %Unit analyses SiO2 TiO2
Gardner et al. (2001):
4 71 71.96 ± 2.44 0.28 ± 0.08
3T 41 74.49 ± 1.15 0.20 ± 0.04
3 15 76.55 ± 1.27 0.14 ± 0.01
This study:
4 10 72.01 ± 1.44 0.28 ± 0.06
3T 5 75.27 ± 0.44 0.15 ± 0.01
3 4 75.58 ± 0.91 0.14 ± 0.01
*Mean of analyses with 2σ standard deviation.

IV. G
eology
21
Measured Section
7300
7400
7500
7600
70 72 74 76 78 80SiO2 (wt%) SiO2 (wt%) SiO2 (wt%)
Ele
vatio
n (ft
)
MDA P BH 273
7300
7400
7500
7600
70 72 74 76 78 80
MDA P BH 257
7300
7400
7500
7600
70 72 74 76 78 80
MDA P BH 257
7300
7400
7500
7600
0.0 0.1 0.2 0.3 0.4 0.5
MDA P BH 273
7300
7400
7500
7600
0.0 0.1 0.2 0.3 0.4 0.5
Measured Section
7300
7400
7500
7600
0.0 0.1 0.2 0.3 0.4 0.5
TiO2 (wt%) TiO2 (wt%) TiO2 (wt%)
Ele
vatio
n (f
t)
Unit 4l
Unit 3T Unit 3
Unit 4l
Unit 3
Unit 4l
Unit 3
Unit 4l
Unit 3TUnit 3
Unit 4u
Unit 4l
Unit 3T Unit 3
Unit 4u
Unit 4l
Unit 3T Unit 3
Unit 3T
Unit 3T
a) b)
d)
c)
e) f)
Figure 7. Silica and Titania Variation in Bandelier Tuff. Panels a) through c) show the variation in SiO2 with respect to elevation for samplesfrom the measured section and boreholes (BH) at MDA P. Panels d) through f) show the variation in TiO2 for samples from the same sites.Borehole locations are indicated on Fig. 4, and the location of the measured section is shown on Plate 1.

left over from high-explosives machining andstockpiled at MDA P (William Criswell, personalcommunication).
C. Structural Geology
1. Subsidiary faults of the Pajarito fault zoneThe northwestern corner of the study area encom-passes part of a 160-m (525-ft) wide graben at thebase of the Pajarito fault escarpment (G1, Plate 1).Part of this graben and its eastern bounding fault(F1, Plate 1) were trenched prior to construction ofthe new LANL Emergency Operations Center(Reneau et al. 2002; see “Previous Work,” page 8).Trench exposures provided evidence for Holocenefaulting on fault F1.
Along its southern continuation, fault F1 has ~ 6 m(20 ft) of throw on Bandelier Tuff contacts and thebase of Qoal (Plate 1). The footwall of this fault isthe east-dipping, steep limb of a monocline with asmuch as 23 m (75 ft) down-to-the-east displace-ment; the axis of this monocline appears to parallelAnchor Ranch Road (M1, Plate 1). Folding appar-ently occurred after deposition of Qoal, based onparallelism between the base of Qoal and the Unit3T/4 contact and the higher-than-usual dip of thebase of Qoal (~ 4° compared to ~ 2° elsewhere). Aprofile of stratigraphic contacts along the northside of Pajarito Canyon shows both the fault andthe monocline (Fig. 8a), whereas a structure con-tour map on the top surface of Unit 3T shows themonocline (Fig. 9a).
2. North-striking structures in the eastern partof the Pajarito fault zone
TA-9 Graben. The largest structure in the studyarea is a north-trending graben (here named theTA-9 graben, G2, Plate 1) whose western boundingfault is located about 1,200 m (4,000 ft) east of thePajarito escarpment. The graben is about 610 m(2,000 ft) wide at its southern mapped end betweenbuilding TA-16-260 and MDA P, narrowing toabout 305 m (1,000 ft) wide at its northernmostmapped extremity in Pajarito Canyon west ofbuilding TA-22-52. The total length of this struc-
ture appears to be about 1,200 m (4,000 ft), but themapped trace is discontinuous and must thereforebe inferred along part of its length. Structural dis-placements along graben bounding faults can bemeasured readily at the well-exposed weldingbreak in Unit 4u. The fairly continuous surgedeposits at that contact provide an outstandingstructural marker. The TA-9 trench also providedexcellent exposure of this graben (see below).
At Cañon de Valle, the eastern boundary of thegraben is a pair of north-northwesterly-strikingfaults with a total of ~ 3 m (10–11 ft) down-to-the-west apparent dip slip at the welding breakbetween Unit 4u(npw) and Unit 4u(w) (F2, Plate 1;Cross-section A-A', Plate 2; Fig. 8b). These twofaults intersect near the north rim of Cañon deValle and run northwards across the mesa top,forming a prominent break in slope in Qoal; theyappear to link with the eastern boundary of agraben identified in the TA-9 trench (see below).Beyond the trace of the TA-9 trench, the easternbounding fault can be traced another 150 m (500 ft) to the north. Aligned faults farther north,though not mapped as continuous through the area,may connect fault F2 to a zone of faulting on thenorth side of Pajarito Canyon that has about 3 m(10 ft) of down-to-the-west vertical separation onthe Unit 3T/4 contact (F3, Plate 1).
The western bounding fault of the TA-9 graben(G2) has 1.5 m (5 ft) of down-to-the-east verticalseparation on the welding break between Unit4u(npw) and Unit 4u(w) (F4, Plate 1). Like theeastern fault, the western fault can be traced north-wards across the mesa top, where it forms a promi-nent topographic step in Qoal, and through thetrace of the TA-9 trench, where it appears to formthe western bounding fault of the graben identifiedin the trench. The northward continuation of faultF4 beyond the TA-9 trench can only be inferreddue to abundant fill and anthropogenic works. Thefault may connect with a mapped fault northwestof building TA-9-48, which has 0.5 m (1.5 ft) ofdown-to-the-east throw on the Unit 3T/4 contactand apparently cuts Qfo (F5, Plate 1). Throw on
Geology of the Western Part of Los Alamos National Laboratory
22

the western bounding fault may diminish to thenorth, or deformation may become more diffuse.About 90 to 120 m (300–400 ft) east of fault F5,the narrow east-west-trending mesa capped by Unit4u(w) forms a syncline along the axis of the graben(Plate 1). Whether the graben continues to thesouth of Cañon de Valle is unknown due to exten-sive cover by anthropogenic works in the vicinityof building TA-16-260 and poor exposure on thenorth slope of Cañon de Valle near well R-25.
Topographic profiles of contacts between coolingunits show the structure of the TA-9 graben(Fig. 8b). Three, closely spaced, high-angle nor-mal faults on the east side account for a total of~ 6 m (20 ft) of down-to-the-west stratigraphicseparation. Synclinal folding adjacent to the east-ern bounding fault accounts for about 3 m (10 ft)more of down-to-the-west separation. The westernbounding fault (F4) appears as a high-angle normalfault with about 1.5 m (5 ft) of down-to-the-eastseparation. Directly west of the graben, beddingdips indicate an anticlinal fold contrasting with thegentle easterly dips in the graben and farther east.This folding is apparent in profiles of the topo-graphic surface of the mesa and within the TA-9trench (see below). A nearly parallel fault (F6,Plate 1) < 150 m (500 ft) to the east of fault F4 has1.2 m (4 ft) of down-to-the-west apparent dip slipand forms a small graben-within-a-graben struc-ture. Folding associated with graben G2 can bereadily appreciated from structure contour maps onthe top surface of Unit 3T (Fig. 9a). Dips flattenwest and east of the graben. The faults that makeup the eastern boundary of the graben coincidewith a zone of high conductivity in the canyon bot-tom identified in electrical resistivity surveys per-formed by the LANL ER Project (in preparation).There are also three springs in Cañon de Valleassociated with the graben (Plate 1), suggestingthat these faults influence the hydrology of thispart of Cañon de Valle.
A strong inflection in the upper surface of Qoal andthe underlying Bandelier Tuff on both sides ofCañon de Valle about 305 m (1,000 ft) east of
building TA-16-260 (Gardner et al. 2001) is consis-tent with the presence of the graben. Gradients inthe mesa top abruptly become gentler to the east atthe axis of the graben. Low gradients continue atleast as far as MDA P and a roadcut on R-site roadwhere a prominent surge within Unit 4 has a verygentle dip to the west. A prominent bench in thestructure contour maps on the top surfaces of bothUnit 3T and Unit 3 (Figs. 9a and 9b) coincideswith the inflections noted by Gardner et al. (2001).
Fractures (possible faults?) in the TA-9 trench.Figure 10 is an east-west profile of surveyed pointsin the TA-9 gas pipeline trench illustrating topogra-phy along the trench and major zones of fracturing.Stratigraphic contacts in post-Bandelier units weretraceable in much of the western part of the trench,and no faults were recognized there (Fig. 6).However, recognition of faults and fractures inpost-Bandelier clay-rich soils was not always pos-sible because of the locally massive character ofthe soils, and faults in these units may have beenmissed in some cases. The upper surface of theBandelier Tuff in the TA-9 trench had numeroussteps at the contact between tuff and overlyingalluvium/colluvium (cover photo; Fig. 6). Thisstepped contact may be partially or entirely deposi-tional and not associated with faulting; plucking ofQbt blocks prior to or during deposition of alluvi-um/colluvium may create the appearance of faultdisplacement where there is none.
Two prominent zones of fracturing were mapped inthe trench. Zone A (Fig. 10; cover photo) is char-acterized by numerous steps in the tuff surface,sediment- and clay-filled fractures, and possibledomino-style faulting, similar in form to faultsdescribed by McCalpin (1998) in tensional struc-tures on the main scarp of the Pajarito fault. Stepson the top surface of the tuff at fractures rangefrom 0.1 to > 1.2 m (0.3 ft to > 4 ft) high. Clay-and sediment-filled fractures are up to 1 m (3 ft)wide. Most fractures in the western portion ofzone A strike about N15E; however, strikes varyfrom N80E to N20W. The eastern end of zone A isdominated by fractures with northerly strikes. The
IV. Geology
23

Geology of the W
estern Part of Los A
lamos N
ational Laboratory
24
Ele
vatio
n (f
t)
7800
7700
7600
7500
7400
0 1000 2000 3000 4000 5000
Distance (ft)
6000 7000 8000 9000 10000
F3
F9
M1
F1G1
AnchorRanch Road
Qbt3Qbt3Qbt3
Qbt3T
Qbt3T
Qbt3T
Qbt3T
Qbt3T
Qbt3TQbt3T
Qbt4l
Qbt4l
Qbt4l
Qbt4l
Qoal
Qoal
QoalQoal
QoalQoal
QoalQoal
Qbt4lQbt4l
Qbt4l Qbt4l
Qbt4l
Qbt4l
?
West East
*
*Vertical exaggeration = 10 X
Figure 8a. Pajarito Canyon Profile. This composite profile along the north side of Pajarito Canyon, projected into profile lines on Plate 1, showsthe topography, contacts between Qbt units, and the base of Qoal. The profile was created as follows: bedrock contacts were digitized from fieldmaps; elevations along geologic contacts were derived from a DEM; points along contacts were projected from the mesa rim into the profile line;and topography was projected from the crown, or high part, of the mesa (see text for further discussion). Structural features are labeled as inPlate 1. Faults are shown with mostly vertical dips; steep measured dips (> 80°) are made steeper by vertical exaggeration of profiles. TshiregeMember unit designations are as in Plate 1. A large asterisk indicates possible inaccuracy due to projection.

upper surface of the tuff drops about3 m (10 ft) down to the east over a150-m (500-ft) wide zone. We cor-relate the eastern end of zone A withthe western bounding fault (F4,Plate 1) of the TA-9 graben. InCañon de Valle, fault F4 strikesN30E and has 1.5 m (5 ft) down-to-the-east dip separation on the weld-ing break between Units 4u(npw)and 4u(w).
Zone B (Fig. 10) is also character-ized by numerous steps in the tuffsurface and possible domino-stylefaulting. Steps on the top surface ofthe tuff at fractures are < 60 cm (2 ft)high. The surface of the BandelierTuff drops > 3 m (10 ft) down to thewest on the western side of thiszone, and black, organic-rich soilsare present west of the fracture zone.We correlate the west end of zone Bwith the eastern bounding fault (F2,Plate 1) of the TA-9 graben. InCañon de Valle, this fault strikesnorth-south to N5E and has a cumu-lative dip separation of 3 m (10 ft)down to the west. The number offractures falls off on the eastern sideof zone B. The 460-m (1,500-ft)width of the TA-9 graben and topog-raphy on the tuff surface across thebounding fracture zones (Fig. 10) aremarkedly similar to the same fea-tures in the profile of the north sideof Cañon de Valle (Fig. 8b).
Examination of post-Bandelier Tuffunits in the westernmost 300 m(1,000 ft) of the trench revealed noevidence of faulting (Fig. 6).However, because the trench wallswere not continuously cleaned orlogged, small faults may have beenmissed.
IV. Geology
25
Elevation (ft)
7500
7400
8000
7000
6000
5000
4000
3000
2000
1000
0
Dis
tanc
e (f
t)
F2
F4
F6
G2
Qbt
3Q
bt3
Qbt
3TQ
bt3T
Qbt
4Q
bt3
Qbt
4
Qbt
4
Qbt
3T
Qbt
4
Qbt
4u(w
)Q
bt4u
(w)
Qoa
l
Qbt
3T
Qbt
4
Qbt
4
Qbt
4u(w
)Q
bt4u
(w)
Qoa
lQ
oal
?
Wes
tE
ast
*
*V
ertic
al e
xagg
erat
ion
= 1
0 X
Fig
ure
8b
. C
año
n d
e V
alle
Pro
file
.T
his
com
posi
te p
rofil
e al
ong
the
nort
h si
de o
f C
añon
de
Val
le,
proj
ecte
d in
to p
rofil
e lin
es o
n P
late
1,
show
sto
pogr
aphy
, co
ntac
ts b
etw
een
Qbt
uni
ts,
and
the
base
of
Qoa
l. G
raph
ical
not
atio
n an
d m
etho
ds f
or c
reat
ion
of t
he p
rofil
e ar
e th
e sa
me
asde
scrib
ed in
the
capt
ion
for
Fig
. 8a.
A la
rge
aste
risk
indi
cate
s po
ssib
le in
accu
racy
due
to p
roje
ctio
n.
continued on page 28

Geology of the W
estern Part of Los A
lamos N
ational Laboratory
26
1620000161800016160001614000161200016100001608000
Easting (ft)
1770000
1768000
1766000
1764000
Nor
thin
g (f
t)
Limit of Data
Lim
it of
Dat
a
Figure 9a. Contoured Upper Surface of Unit 3T. Blue dots are mapped points on the Unit 3T-Unit 4 contact. Points were derived as for Fig. 8.Contour interval is 10 ft, and the surface was interpolated from a 100-ft grid of data from this study and from Gardner et al. (1999, 2001) using krig-ing. Mapped points constrain the contouring of the surface model; some spurious topography on the surface may result from limited data.Structural features, boreholes, and buildings are labeled as in Plate 1. Boreholes in the building TA-16-260 area are from LANL ER Project (1998).

IV. G
eology
27
1624000162200016200001618000
Easting (ft)
161600016140001612000
1770000
1768000
1766000
1764000
Nor
thin
g (f
t)
Lim
it of
Dat
a
Limit of D
ata
Figure 9b. Contoured Upper Surface of Unit 3. Green dots are mapped points on the Unit 3-Unit 3T contact. The other information is thesame as that for Fig. 8a. The surface model was created using the same techniques as Fig. 8a.

The easternmost surveyed part of the trench lay atthe top of a large colluvium-covered scarp thatdrops 18 m (60 ft) to the east (Fig. 10). The trenchin this location exposed the contact between Units4u(npw) and 4u(w). This scarp is not associatedwith a fault. Rather it represents the eastern limitof a welded flow lobe of Unit 4u. Outcrops of thispart of Unit 4 are sparse to absent east of here.
Small faults north and west of the TA-9 graben.Eight normal faults, all with apparent dip-slip dis-placements of < 5 m (16 ft), were identified northand west of the TA-9 graben. Their association, ifany, with the TA-9 graben is unclear. Several ofthese faults are somewhat aligned along a north-northeast trend. Two of them, located east andnortheast of building TA-8-21, have 3 m (10 ft) and> 1.5 m (5 ft) down-to-the-east separation on con-tacts in Bandelier Tuff (F7 and F8, Plate 1). Fault
F7 is associated with flattening of the mesa top andmay offset the post-Bandelier Tuff unit Qfi(deposited prior to 50–60 ka). Assuming this is thecase, this feature is the youngest fault offset identi-fied in the study area except for Holocene faultingin trench EOC-2 (Reneau et al. 2002). The otherfault (F8), with 1.5 m (5 ft) down-to-the-east sepa-ration, is exposed only in Bandelier Tuff, giving amaximum age for the faulting.
Two small faults along this north-northeast trendwere mapped in Pajarito Canyon (F9, Plate 1).One of these has 3 to 5 m (10–15 ft) apparentdown-to-the-east separation on Qoal, and the other1.5 to 3.0 m (5–10 ft) of apparent down-to-the-west separation on Qoal. Together, they form asmall graben about 60 m (200 ft) wide. Thesefaults are apparent in a profile of stratigraphic con-tacts along the north side of Pajarito Canyon
Geology of the Western Part of Los Alamos National Laboratory
28
continued from page 25
7440
7460
7480
7500
7520
7540
7560
7580
1612000 1613000 1614000 1615000 1616000
Easting (ft)
Ele
vatio
n (f
t)
Zone B
Zone A
G2
F2
F4
Vertical exaggeration = 20 X
Figure 10. Profile of the TA-9 Trench Showing Surveyed Data. The filled circles are points on theground surface at the edge of the trench. The X symbols are points at contact between Qbt and post-Qbtstrata. Gray bands indicate areas in the trench where Qbt was observed. In all other areas, post-Qbtstrata are thicker than the trench depth. Structural features F2, F4, and G2 are as in Plate 1.

(Fig. 8a; Plate 1). The faults are associated with anorth-trending tributary canyon that enters PajaritoCanyon at an anomalously high angle, suggestiveof structural control. The faults and the tributarycanyon trend north-northeast towards the trace of adown-to-the-east fault with > 1.5 m (5 ft) of slipon post-Bandelier Tuff strata beyond the northernlimit of the study area, about 460 m (1,500 ft)north of Pajarito Canyon (F10, Plate 1). Thisfault, where trenched on the south side of LosAlamos Canyon, experienced mid- to late-Pleistocene faulting and possibly Holocene fissur-ing, but time constraints are equivocal (McCalpin1998). The continuity among these short faults,none of them with mapped traces longer thanabout 60 m (200 ft), is difficult to prove. Severalsprings in the bottom of Pajarito Canyon and itstributaries may be fault-controlled (i.e., springslocated between faults F3 and F7 and faults F3 andF9, Plate 1). These springs may be associatedwith the G2 graben, as suggested above for springsin Cañon de Valle.
Four more small faults, between F9 and F3, offsetBandelier Tuff contacts and the base of Qoal far-ther east in Pajarito Canyon (Fig. 8a; Plate 1).None of these faults has more than 1.8 m (6 ft) ofseparation on Bandelier Tuff nor can they be tracedmore than about 60 m (200 ft) along strike. All ofthese faults are associated with north-trending trib-utary canyons that enter Pajarito Canyon at anom-alously high angles.
3. Fractures and minor faults at Material Disposal Area P
To help understand a zone of open and filled frac-tures of large aperture [up to 100 cm (3.3 ft) wide]at MDA P, we measured and analyzed 454 frac-tures to determine possible tectonic influences onfracturing there. We mapped 9 small-displacementfaults at MDA P using total station surveying(Fig. 4; Appendix C, Table C-2), including a faultzone with fissures and a small graben that cropsout on both sides of Cañon de Valle. None of thesefaults appears to have lateral continuity acrossMDA P. No single large fault transects the site
(Plate 1). Therefore, fracture analysis was used torecognize patterns in orientation, density, and aper-ture of fractures that might indicate their mode offormation.
We measured fractures in three units of theTshirege Member, the welded Units 3 and 3T andthe nonwelded Unit 4l (Fig. 4). Detailed methodsare described in Appendix B. Data are compiled inAppendix B, Table B-1. A point density plot (con-toured stereonet) of poles to all fracture planesshows a weakly developed clustering of data(Fig. 11a). The fracture set as a whole has a statis-tically significant north-northwest preferred orien-tation (mean direction of N15W ± 26°, Fig. 12a).Fracture dips vary from subhorizontal to steep.Despite considerable scatter in strike and dip, thesedata pass uniformity tests at the 95% confidencelevel (see Appendix B), indicating that the data arederived from a population of fractures with pre-ferred orientation.
We measured 212 fractures in nonwelded Unit 4l.A point density plot shows a moderately developedgirdle with cluster (Fig. 11b). These fractures havea statistically significant north-northwest preferredorientation (mean direction of N14W ± 16°,Fig. 12b). Dips of the Unit 4l fractures are gener-ally steep. The small uncertainty on the meandirection, compared to the fracture set as a whole,indicates less scatter in strike in the nonweldedUnit 4l.
In the densely welded Unit 3T, we measured 129fractures. A point density plot shows a weaklydeveloped cluster with girdle (Fig. 11c). Thesefractures have a statistically significant east-north-east preferred orientation (mean direction of N69E± 32°, Fig. 12c). Dips of the Unit 3T fractures aregenerally subhorizontal.
In densely welded Unit 3, we measured 113 frac-tures. A point density plot shows a weakly devel-oped cluster (Fig. 11d). These fractures have a sta-tistically significant north-northwest preferred ori-entation (mean direction of N25W ± 32°, Fig. 12d).
IV. Geology
29

Geology of the Western Part of Los Alamos National Laboratory
30
E
+2σ
+4σ
+6σ
+8σ
+10σ
+12σ
+14σ
+16σ
+18σ
+20σ
+22σ
NUnit 4, N = 212
255,1161,78
345,12
b)
NAll, N = 454
353,86
162,4
252,1
a)
NUnit 3, N = 113
240,3
331,16
141,74
d)
N Unit 3T, N = 129
262,6 153,71
354,18c)
Figure 11. Point Density Plots of Poles to Fracture Planes Measured at MDA P. The plots show a) all data collected, b) data from Unit 4, c) data from Unit 3T, and d) data from Unit 3. Lower hemi-sphere equal area stereonets are contoured using the Gaussian counting method of Robin and Jowett(1986). Contour intervals are equal to E + 2σ, E + 4σ, etc., where E is the number of points expected tobe found in the counting circle if points were extracted randomly from a uniform population and σ is thestandard deviation. The three orthogonal principal directions are shown with 95% confidence cones foreach data set; these show average clustering of each data set (see Appendix B, Table B-2). Only for alldata combined and Unit 4 alone do these principal directions have small cones of confidence. Data fromUnit 4 show a moderately strong preferred orientation. See Appendix B for further details on the method.Abbreviation: N, number of measurements.

Dips of the Unit 3 fractures are a mixture of steepand subhorizontal.
Approximately 37% of the measured fractures arecovered at both ends and about 13% at one end,which introduces some uncertainty in interpreta-tions of trace length and style of termination.Nevertheless, 56% of all measured fractures termi-nate at other fractures. Trace length of the mea-sured fractures in all three units is generally short(Appendix B, Table B-1). Mean trace length offractures with both ends exposed along our eighttraverses is < 3 m (10 ft). Maximum trace length is25 m (81 ft). The overall map pattern of fracturesin all units including Unit 4l is polygonal.
Fracture density (the number of fractures alongany one traverse divided by the length of traverse)in nonwelded Unit 4l [~ 20 fractures per 30 m(100 ft)] is significantly lower than in the otherunits (compare traverses 1 and 2 with traverses 6,7, and 8; Table 2). Fracture density withinUnits 3 and 3T [up to about 40 fractures per 30 m(100 ft)] is higher than in Unit 4l. There is amodest increase in fracture density from east towest across MDA P, shown by traverses 3, 4, and5; traverse 3, the most easterly, has the lowestvalue, whereas traverse 5, the most westerly, hasthe highest value. The highest densities wereencountered in a zone of abundant fractures in thewestern third of MDA P. In this zone, exempli-fied by traverse 8, we measured 40 fractures per30 m (100 ft).
Apertures (Fig. 13) follow a pattern similar to frac-ture densities; there are more large aperture frac-tures in the welded Units 3 and 3T than in the non-
IV. Geology
31
90
180
270
N
10%15%
90
180
270
N
10%15%
90
180
270
N
10%15%
Unit 4, N = 212R = N14W± 16.1°
Unit 3T, N = 129R = N69E± 31.6
Unit 3, N = 113R = N25W± 32.0°
90
180
270
N
10%15%
All, N = 454R = N15W± 25.9°
a)
b)
c)
d)
°
Figure 12. Rose Diagrams of Strikes ofFracture Data from MDA P. The inner circlesrepresent 10% of the data analyzed, and the outercircles 15%. The mean strike, indicated by thearrow, is accompanied by the 95% confidenceinterval. Abbreviations: R, resultant vector, ormean strike; N, number of measurements.

welded Unit 4l (Figs. 13 and 14). Apertures inUnit 4l are generally 1 to 2 mm but locally reachvalues of about 50 mm. Apertures in Units 3 and3T are as high as 100 mm. Fracture apertures arebimodal in all units; frequency distribution plotsshow a large peak at 0 to 5 mm and a smaller one,in all units, at 10 to 15 mm (Fig. 13). The meanaperture for the entire fracture set is 7 ± 10 mm;the large standard deviation is due to a small num-ber of fractures with apertures up to 100 mm(Appendix B, Table B-1).
No consistent, statistically defensible east-to-westspatial variation in aperture is apparent from thefracture set as a whole. Frequency distributionplots of aperture versus easting or northing for allfractures reveal no notable trends due to the dis-continuous nature of the sampling along traversesas opposed to uniform coverage of the rock mass.Examination of the outcrop, however, indicates atrend towards higher fracture apertures in westernparts of MDA P compared to eastern parts; wheretraverses 5, 6, and 8 intersect, there is a concentra-tion of fractures of large aperture filled with hori-zontally stratified sediment. This concentrationcorresponds to an area of MDA P where there is amappable, ~ 12-m (40-ft) long, north-northwest-striking fault with a small component of strike slipand a north-trending graben with a small compo-nent of dip slip that can be traced about 120 m
(400 ft). This spatial association of a fault, agraben, elevated fracture density, and fractures oflarge aperture appears to mark a north-northwester-ly axis of a zone of diffuse deformation.
About 50 of the measured fractures (10% of allmeasured fractures) at MDA P are filled with brec-ciated tuff and/or cataclasite (foliated fault materialproduced by mechanical crushing of host rock androtation of component grains). Approximatelytwenty-five of the fractures with cataclasite and/orbreccia are in Unit 4l; in some cases cataclasite andbreccia are both present. The foliated faults, all buttwo of which are in Unit 4l, have a preferred orien-tation of N14W ± 31°.
4. Faults and folds in the easternmost part of the study area
Only a few faults of small offset were identifiedeast of the TA-9 graben. One northeast-strikingfault in a tributary of Twomile Canyon has 2.4 m(8 ft) down-to-the-west apparent dip slip on theUnit 3/4 contact, which has prominent surgedeposits in the contact (F11, Plate 1). We couldidentify no structures associated with a nearby aer-ial photo linear noted by Gardner et al. (1999;Plate 1).
Several small faults displace prominent surgedeposits in the Unit 3/4 contact 60 cm (2 ft) or less
at Twomile Mesa (F12, Plate 1).However, Reneau et al. (1995) surveyedthis contact and identified more faultsthan we were able to map using tradi-tional field mapping techniques.
Within the study area east of MDA P, thedip on the upper surface of Unit 3increases eastward from < 1° to about 2°.From available data, it is not clearwhether this change in dip, apparent onthe Unit 3 structure contour map(Fig. 9b) and the Cañon de Valle profile(Fig. 8b), results from deposition on anuneven surface or post-depositional tec-tonic folding.
Geology of the Western Part of Los Alamos National Laboratory
32
Table 2. Fracture Density Along MDA P Traverses
Traverse Qbt Orientation of Fracture DensityNumber Unit Traverse (fractures/30 m)
1 4l N78E 21
2 4l N77E 19
3 4l, 3T N14W 17
4 4l, 3T, 3 N20W 19
5 4l, 3T, 3 N12W 27
6 3T, 3 N76E 31
7 3 N78E 30
8 3 N80E 40

V. DISCUSSION
A. Tshirege Member Stratigraphic Units
A number of other workers have also subdividedthe Tshirege Member of the Bandelier Tuff in ornear our study area into map units or into petrolog-ic units based on detailed petrographic, micro-probe, and geochemical studies of samples frommeasured sections and boreholes (Reneau et al.1995; Rogers 1995; Broxton et al. 1996, 2002;Warren et al. 1997; LANL ER Project 1998;Gardner et al. 1999, 2001). Most of our TshiregeMember units correlate well with the map units ofRogers (1995) in the study area: her Unit D corre-sponds to our Unit 3, although there are some dif-ferences in actual placement of contacts. Rogers’Unit E combines our Units 3T and 4. Within ourstudy area, Rogers’ Unit F corresponds with theupper part of our Unit 4 [clot-rich welded caprockUnit 4u(w)]. However, she carries Unit F well tothe north of where our mapping shows it pinchesout; we found none of this unit north of PajaritoCanyon.
Some descriptions of Unit 3T and Unit 4 are notentirely consistent with our usage (Warren et al.1997; LANL ER Project 1998; see discussion inGardner et al. 2001). We emphasize, however, thatour usage of these units is petrographically andchemically consistent over the areas mapped in thisstudy and by Gardner et al. (1999, 2001).
As discussed in Gardner et al. (2001), we defineUnit 3T based on its welding characteristics and itsphenocryst population. Where Units 3 and 3T areboth densely welded, characteristics of the phe-nocryst and lithic populations combined withmajor- and trace-element geochemistry provideuseful criteria for pinpointing the contact. A studydone prior to restoration of MDA P identified a
V. Discussion
33
0
100
200
300
0 20 40 60 80 100
Num
ber
of F
ract
ures
Aperture (mm)
Unit 3
0
100
200
300
0 20 40 60 80 100
Num
ber
of F
ract
ures
Unit 3T
0
100
200
300
0 20 40 60 80 100
Num
ber
of F
ract
ures
Unit 4
0
100
200
300
0 20 40 60 80 100
Num
ber
of F
ract
ures
All
d)
c)
b)
a)
Figure 13. Fracture Aperture Distributions. Thehistograms show the frequency distributions ofapertures taken from measured fractures at MDA P.

thick section of Unit 3 with no Unit 3T broken out(Broxton et al. 1996). Unit 3T had not beendefined, however, at the time that the preliminaryMDA P study was done. In well R-25, due west ofMDA P, a 21-m (70-ft) thick section of Unit 3T wasidentified (Broxton et al. 2002). However, based onre-examination of core and cuttings from the R-25 well, we place the contact between Units 3and 3T shallower in well R-25 [a depth of 36.6 ±0.6 m (120 ± 2 ft)], making Unit 3 thicker [~ 33.8 m(111 ft)] and Unit 3T thinner [~ 11 m (35 ft)] thanpreviously determined. The revised thickness ofUnit 3T is more consistent with mapped thicknessesand thickness trends in Cañon de Valle.
Mapping of the area between TA-3 (Gardner et al.1999) and TA-16 (Gardner et al. 2001) allows amore definitive interpretation than was possible ineither of these previous reports of the stratigraphicrelations among the various units near the top of
the Tshirege Member. Thebasal nonwelded ignimbritesof Unit 4l in the study areaare the same as Unit 4 ofGardner et al. (1999) in theTA-3 area. The physical andgeochemical characteristicsof these units, as well as theircontinuity with Unit 4 ofGardner et al. (1999) in thenorthern part of the studyarea (Plate 1), make themunequivocally the same unit.The poorly to densely weldedignimbrites with conspicuouscrystal clots [our Units4u(npw) and 4u(w) and theUnit 4 with conspicuous crys-tal clots of Gardner et al.(2001)] clearly overlie thephenocryst-poor Unit 4 char-acteristic of TA-3 (our Unit4l). The clot-rich Units4u(npw) and 4u(w) can betraced, in nearly continuousexposure, from Water Canyon
to Cañon de Valle, where they overlie Unit 4l.
The uppermost part of the Unit 4 sequence in thisstudy area, our Unit 4u(w), is the same as Unit 5 ofWarren et al. (1997) and, at least in part, Unit F ofRogers (1995). Unit 5 was defined informally byWarren et al. (1997) as the caprock above a promi-nent surge near the top of Unit 4 of Broxton andReneau (1995). The non- to partially welded, clot-rich Unit 4u(npw) and the densely welded Unit4u(w) are indistinguishable based on availablemajor- and trace-element geochemistry (Fig. 7). Inaddition, both units bear conspicuous crystal clots.On some of the mesa tops, a nonwelded, clot-richunit overlies the caprock (e.g., the mesa wherewell R-25 was drilled). We interpret this sequenceas a cooling unit, with a nonwelded base, denselywelded central portion, and a nonwelded top. Wetherefore map these three zones as one unit,Unit 4u (Plate 1).
Geology of the Western Part of Los Alamos National Laboratory
34
0
20
40
60
80
100
0 50 100 150 200
Traverse 5
Ape
rtur
e (m
m)
Distance (ft)
N S
Unit 3 Unit 3T Unit 4
Figure 14. Apertures along Traverse 5. The plot shows the variationin aperture among units of the Bandelier Tuff at MDA P. Data from tra-verse 5 are shown.

After viewing the cores from boreholes at thebuilding TA-16-260 outfall area (LANL ER Project1998), we revise the stratigraphy somewhat inaccordance with our field mapping results. Coresfrom four boreholes were examined: 2665, 2667,2668, and 2669 (Plate 1; Table 3). Generally, wemoved the upper contact of Unit 3T upwardsbecause we have not been able to reliably distin-guish densely welded Unit 4T of Warren et al.(1997) from densely welded Unit 3T (see discus-sion in Gardner et al. 2001). We place the top ofUnit 3T at the top of densely welded tuff in thispart of the core, corresponding to the top ofUnit 4T of LANL ER Project (1998). Generally,we place the Unit 3/3T contact at the same depth asLANL ER Project (1998) or < 3 m (10 ft) shallow-er. The thickness of Unit 3T in the boreholestherefore ranges from 11 to 16 m (37 to 54 ft)(37 ft, BH 2665; 54 ft, BH 2667; 52 ft, BH 2668;46 ft, BH 2669). We were able to distinguishUnits 4l and 4u in all boreholes; this division wasnot made by LANL ER Project (1998). The thick-ness of Unit 4l varies from around 5 to 22 m (14 to70 ft) (70 ft, BH 2665; 43 ft,BH 2667; 14 ft, BH 2668; 16 ft,BH 2669). In addition, we recog-nized Unit 4u(w) in all four bore-holes. However, Unit 4u(npw) ispresent in only two boreholes(2668 and 2669), where it is< 4.3 m (14 ft) thick (0 ft,BH 2665; 0 ft, BH 2667; 4 ft,BH 2668; 14 ft, BH 2669).Unit 4u(w) is up to 14 m (44 ft)thick in the building TA-16-260boreholes (1 ft, BH 2665; 15 ft,BH 2667; 44 ft, BH 2668; 26 ft,BH 2669). In boreholes 2665 and2667, Unit 4u(w) directly overliesthe nonwelded Unit 4l with nointervening Unit 4u(npw). Anadditional pyroclastic flow unitand surge are also present in thebuilding TA-16-260 outfall area, asseen in nearby Cañon de Valle.This unit is ~ 5.6 m (18 ft) thick in
borehole 2668 and partially to moderately welded.
Despite complexities of the upper TshiregeMember stratigraphy, we have been able to applyan internally consistent tuff stratigraphy over themap area. Most mapped contacts have beenwalked in their entirety and, together with morelocal stratigraphic markers, have provided a strongbasis for interpretations of geologic structures,their spatial relations, and the style of deformation.
B. Surficial Geologic Units
Units Qoal and Qf both represent post-Bandelieralluvial fan deposits, but a distinction can bemade, as we do here, based on lithologic andstratigraphic evidence as to whether the depositspredate or postdate initial Pleistocene incision ofdrainages on this part of the Pajarito Plateau.Unit Qoal, deposited by streams that emanatedfrom the Sierra de los Valles (west of the studyarea), constitute remnants of once-extensive allu-vial fans that predate development of the present
V. Discussion
35
Table 3. Elevation of Tshirege Member Contacts inBoreholes at Building TA-16-260 Outfall Area,Cañon de Valle* (modified from LANL ER 1998)
BH 2665 BH 2667 BH 2668 BH 2669
Elevation (ft)
Ground surface 7580 7532 7556 7575
Contact(lower/upper unit)
4u(w)/4u(nw)† — — — 7559
4u(npw)/4u(w) — — 7508 7533
4l/4u(w) 7577 7515 — —
4l/4u(npw) — — 7504 7519
3T/4l 7507 7472 7490 7503
3/3T 7470 7418 7438 7457
*“—” signifies not present. Tshirege Member unit designations are as shown in Fig. 5. The locations of boreholes are on Plate 1.
†The nonwelded top of unit 4u is preserved in one borehole.

main canyons (e.g., Reneau 1995; Reneau et al.1995; Reneau and McDonald 1996; Gardner et al.2001). Gravel deposits in shallow tributarycanyons that we mapped as Qoal are associatedwith early stages of canyon development but wereoriginally fed by distributary channels on fans thatdrained the Sierra de los Valles [Reneau (1995)discusses similar deposits in the Los AlamosCanyon watershed]. We interpret gravel lagdeposits mapped as Qoal as remnants of largelyeroded older alluvial deposits [Reneau et al.(1995) and Longmire et al. (1996) discuss analo-gous lag gravels on Pajarito Mesa and on TwomileMesa, respectively]. These gravels may varywidely in age depending on the local history ofcanyon development.
Whereas Qoal may be dominated by dacite clastsin a watershed that is completely underlain byBandelier Tuff, Qf includes clasts that are repre-sentative of the modern watersheds. In addition,Qf is topographically related to the moderndrainage system and typically inset below the mesatops. Qf deposits, therefore, postdate Quaternarycanyon incision. The occurrence of El Cajetepumice in some fan deposits establishes them aspost-El Cajete and therefore relatively young. Thesteep gradient of these Qfy deposits compared tothe modern stream channel is consistent with Qfyrecording a period of aggradation associated withan increase in sediment yield from the upper water-shed, causing a steepening of the stream channelthat was followed by incision. Gentler gradientsdeveloped after a subsequent decrease in sedimentsupply and incision.
C. Structural Geology
1. Origin of fracturing at Material Disposal Area P
Quantitative measures of fracture orientation,fracture density, and aperture from our detailedstructural analysis at MDA P differ in some signif-icant respects from previous fracture studies onthe Pajarito Plateau (Table 4). Results amongfracture studies are not directly comparable in all
cases due to variation in data collected and meth-ods of data analysis.
Most fractures in the Bandelier Tuff likely originat-ed by cooling contraction (Wohletz, in prepara-tion), and this origin is probably the case at MDA Pas well. The Bandelier Tuff was deposited as aseries of hot ash flows that compacted as theycooled, producing tension fractures (Ross andSmith 1961) commonly termed cooling joints.Cooling joints in the Bandelier Tuff are generallyvertical, evenly spaced cracks of short lateralextent [< 3 m (10 ft)] and sinuous strike that com-monly terminate at other joints, forming irregularpolygonal columns with diameters < 3 m (10 ft)(e.g., Rogers et al. 1996). These characteristicsalso hold at MDA P. The orientation of coolingjoints depends on the orientation of principalstresses in the tuff, a combination of regional tec-tonic stresses and local stresses imposed by under-lying topography and the processes of compactionand welding. In addition, pre-existing faults in thesubstrate may have played a role in formation ofcooling joints, imparting stresses in the tuff thatwere relieved as the tuff cooled and fractured.
Previous studies in the Bandelier Tuff (Table 4)have shown that fracture strikes are widely dis-persed but show, in some localities, a crudebimodal distribution that defines a conjugate sys-tem of northwesterly and northeasterly orientedfracture sets, resulting in many four-sidedcolumns (e.g., Purtyman et al. 1995; Wohletz1995, 1996, in preparation). The obtuse anglebetween these conjugate sets (~ 90–120°) may bebisected by the direction of the regional exten-sional stress (e.g., Aldrich et al. 1986; Walters1996). At a few localities, fractures show a strongpreferred orientation with little evidence for aconjugate set (Kolbe et al. 1994, 1995; Vanimanand Chipera 1995). The north-northwest pre-ferred orientation for fractures at MDA P (meanfor all data: N15W ± 26°) is atypical compared toaverage strikes at other localities on the PajaritoPlateau but not necessarily distinct within uncer-tainties (e.g., Kolbe et al. 1994, 1995; Vaniman
Geology of the Western Part of Los Alamos National Laboratory
36

V. D
iscussion
37
Table 4. Comparison of Results from Selected Pajarito Plateau Fracture Studies
Number Preferred Fracture Density Meanof Distance Qbt Orientation (fractures/30 m) Aperture
Authors Area Fractures (m [ft]) Unit Strike Dip Background Maximum (mm)
Vaniman and TA-55 (Pajarito Rd) 1,625 2,225 Units 2, 3 N16E 76 & 75 20 50 10Wohletz (1990) & E Jemez Rd [7,300] & N4E
Kolbe et al. (1994)*/ TA-67 390*/ 1,340 Units 3, 4 N4E 85 9.4–13.9*/ 13.9*/ 20.5Reneau et al. (1995) (Pajarito Mesa) 1,417 [4,400] 26.4–34.5 34.5
Kolbe et al. (1995)* TA-63 194* 685 Unit 3 NNE 90 ~ 8–22* 30* 15(Mesita del Buey) [2,247]
Vaniman and TA-67 591† 2,667 Unit 3 N17E ± 15 4† 7.5† 10Chipera (1995) (Pajarito Mesa) [8,750] to isotropic
Wohletz (1995) TA-21 1,662 2,229 Unit 2 N43E & N33W 70–73S 20 70 8–12.5[7,312] (all: N12E)
Purtyman et al.(1995) Near 343 165 Unit 3 N40E, N25W, 70–90 ~ 18 10TA-3 [540] N65W
Wohletz (1996) TA-2 & 1,496 1,833 Unit 2 N35W & N47E 75–82N 20 50 7TA-41 [6,013] (all: N8E ± 48)
Reneau and TA-54 438 ~ 192 Unit 2 E-W & 76–77 23–30 3–5Vaniman (1998) [~ 630] N20E
Lewis et al. (this study) MDA P 454 576 Units 3, N15W ± 26 20 40 7[1,891] 3T, 4
*Kolbe et al. (1994, 1995) measured “through-going fractures,” or fractures that were logged on both walls of trenches, which biases against fractures strongly oblique to trench walls.
The data for Kolbe et al. (1994) are presented above those for Reneau et al. (1995).†Vaniman and Chipera (1995) measured “mesa-penetrating fractures,” or fractures that penetrate both welded and nonwelded parts of Unit 3.
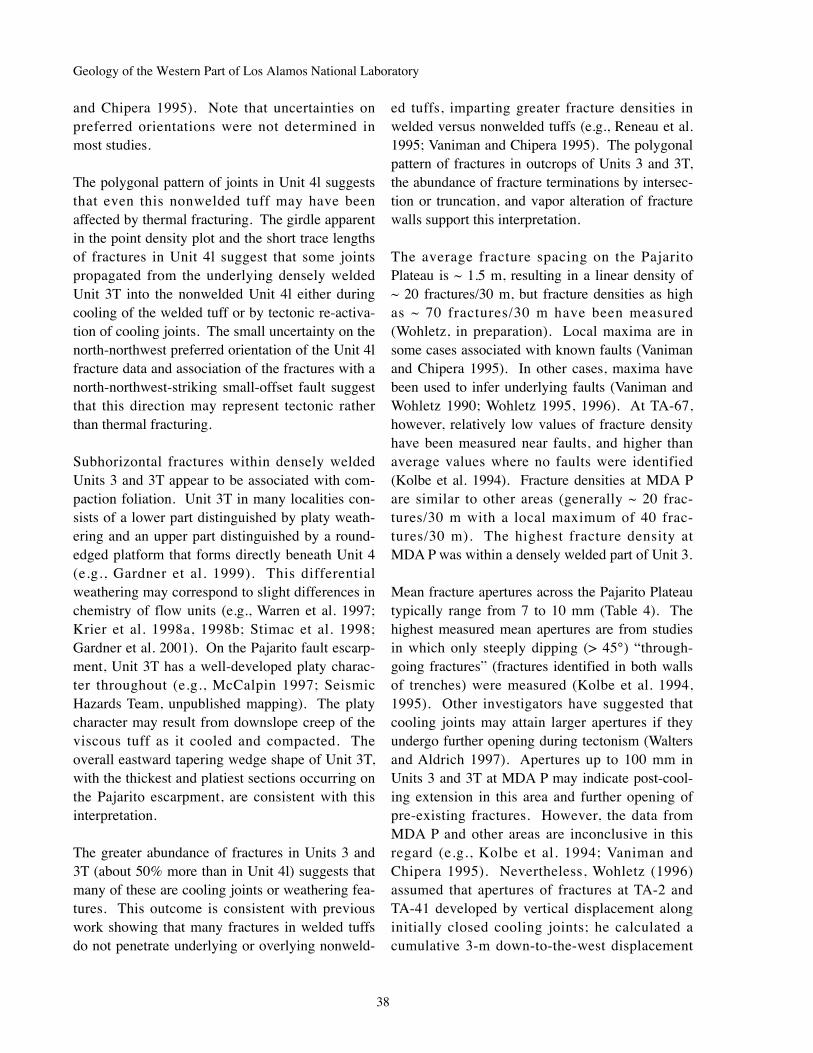
and Chipera 1995). Note that uncertainties onpreferred orientations were not determined inmost studies.
The polygonal pattern of joints in Unit 4l suggeststhat even this nonwelded tuff may have beenaffected by thermal fracturing. The girdle apparentin the point density plot and the short trace lengthsof fractures in Unit 4l suggest that some jointspropagated from the underlying densely weldedUnit 3T into the nonwelded Unit 4l either duringcooling of the welded tuff or by tectonic re-activa-tion of cooling joints. The small uncertainty on thenorth-northwest preferred orientation of the Unit 4lfracture data and association of the fractures with anorth-northwest-striking small-offset fault suggestthat this direction may represent tectonic ratherthan thermal fracturing.
Subhorizontal fractures within densely weldedUnits 3 and 3T appear to be associated with com-paction foliation. Unit 3T in many localities con-sists of a lower part distinguished by platy weath-ering and an upper part distinguished by a round-edged platform that forms directly beneath Unit 4(e.g., Gardner et al. 1999). This differentialweathering may correspond to slight differences inchemistry of flow units (e.g., Warren et al. 1997;Krier et al. 1998a, 1998b; Stimac et al. 1998;Gardner et al. 2001). On the Pajarito fault escarp-ment, Unit 3T has a well-developed platy charac-ter throughout (e.g., McCalpin 1997; SeismicHazards Team, unpublished mapping). The platycharacter may result from downslope creep of theviscous tuff as it cooled and compacted. Theoverall eastward tapering wedge shape of Unit 3T,with the thickest and platiest sections occurring onthe Pajarito escarpment, are consistent with thisinterpretation.
The greater abundance of fractures in Units 3 and3T (about 50% more than in Unit 4l) suggests thatmany of these are cooling joints or weathering fea-tures. This outcome is consistent with previouswork showing that many fractures in welded tuffsdo not penetrate underlying or overlying nonweld-
ed tuffs, imparting greater fracture densities inwelded versus nonwelded tuffs (e.g., Reneau et al.1995; Vaniman and Chipera 1995). The polygonalpattern of fractures in outcrops of Units 3 and 3T,the abundance of fracture terminations by intersec-tion or truncation, and vapor alteration of fracturewalls support this interpretation.
The average fracture spacing on the PajaritoPlateau is ~ 1.5 m, resulting in a linear density of~ 20 fractures/30 m, but fracture densities as highas ~ 70 fractures/30 m have been measured(Wohletz, in preparation). Local maxima are insome cases associated with known faults (Vanimanand Chipera 1995). In other cases, maxima havebeen used to infer underlying faults (Vaniman andWohletz 1990; Wohletz 1995, 1996). At TA-67,however, relatively low values of fracture densityhave been measured near faults, and higher thanaverage values where no faults were identified(Kolbe et al. 1994). Fracture densities at MDA Pare similar to other areas (generally ~ 20 frac-tures/30 m with a local maximum of 40 frac-tures/30 m). The highest fracture density atMDA P was within a densely welded part of Unit 3.
Mean fracture apertures across the Pajarito Plateautypically range from 7 to 10 mm (Table 4). Thehighest measured mean apertures are from studiesin which only steeply dipping (> 45°) “through-going fractures” (fractures identified in both wallsof trenches) were measured (Kolbe et al. 1994,1995). Other investigators have suggested thatcooling joints may attain larger apertures if theyundergo further opening during tectonism (Waltersand Aldrich 1997). Apertures up to 100 mm inUnits 3 and 3T at MDA P may indicate post-cool-ing extension in this area and further opening ofpre-existing fractures. However, the data fromMDA P and other areas are inconclusive in thisregard (e.g., Kolbe et al. 1994; Vaniman andChipera 1995). Nevertheless, Wohletz (1996)assumed that apertures of fractures at TA-2 andTA-41 developed by vertical displacement alonginitially closed cooling joints; he calculated acumulative 3-m down-to-the-west displacement
Geology of the Western Part of Los Alamos National Laboratory
38
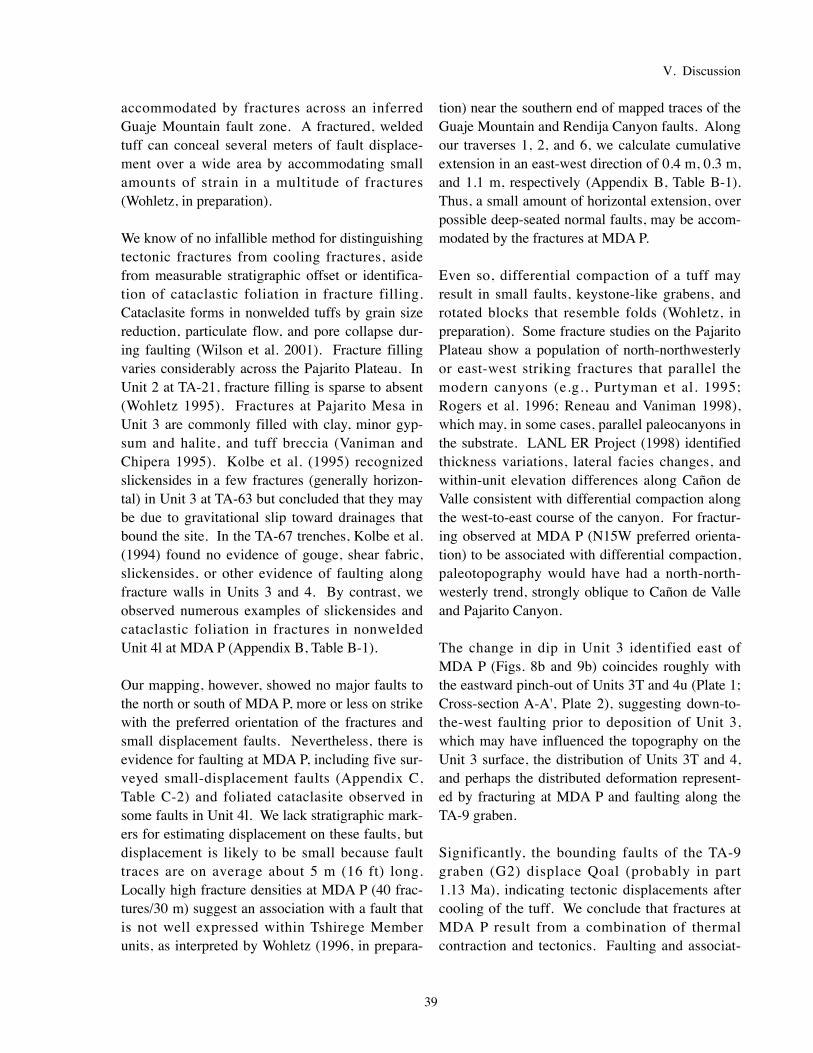
accommodated by fractures across an inferredGuaje Mountain fault zone. A fractured, weldedtuff can conceal several meters of fault displace-ment over a wide area by accommodating smallamounts of strain in a multitude of fractures(Wohletz, in preparation).
We know of no infallible method for distinguishingtectonic fractures from cooling fractures, asidefrom measurable stratigraphic offset or identifica-tion of cataclastic foliation in fracture filling.Cataclasite forms in nonwelded tuffs by grain sizereduction, particulate flow, and pore collapse dur-ing faulting (Wilson et al. 2001). Fracture fillingvaries considerably across the Pajarito Plateau. InUnit 2 at TA-21, fracture filling is sparse to absent(Wohletz 1995). Fractures at Pajarito Mesa inUnit 3 are commonly filled with clay, minor gyp-sum and halite, and tuff breccia (Vaniman andChipera 1995). Kolbe et al. (1995) recognizedslickensides in a few fractures (generally horizon-tal) in Unit 3 at TA-63 but concluded that they maybe due to gravitational slip toward drainages thatbound the site. In the TA-67 trenches, Kolbe et al.(1994) found no evidence of gouge, shear fabric,slickensides, or other evidence of faulting alongfracture walls in Units 3 and 4. By contrast, weobserved numerous examples of slickensides andcataclastic foliation in fractures in nonweldedUnit 4l at MDA P (Appendix B, Table B-1).
Our mapping, however, showed no major faults tothe north or south of MDA P, more or less on strikewith the preferred orientation of the fractures andsmall displacement faults. Nevertheless, there isevidence for faulting at MDA P, including five sur-veyed small-displacement faults (Appendix C,Table C-2) and foliated cataclasite observed insome faults in Unit 4l. We lack stratigraphic mark-ers for estimating displacement on these faults, butdisplacement is likely to be small because faulttraces are on average about 5 m (16 ft) long.Locally high fracture densities at MDA P (40 frac-tures/30 m) suggest an association with a fault thatis not well expressed within Tshirege Memberunits, as interpreted by Wohletz (1996, in prepara-
tion) near the southern end of mapped traces of theGuaje Mountain and Rendija Canyon faults. Alongour traverses 1, 2, and 6, we calculate cumulativeextension in an east-west direction of 0.4 m, 0.3 m,and 1.1 m, respectively (Appendix B, Table B-1).Thus, a small amount of horizontal extension, overpossible deep-seated normal faults, may be accom-modated by the fractures at MDA P.
Even so, differential compaction of a tuff mayresult in small faults, keystone-like grabens, androtated blocks that resemble folds (Wohletz, inpreparation). Some fracture studies on the PajaritoPlateau show a population of north-northwesterlyor east-west striking fractures that parallel themodern canyons (e.g., Purtyman et al. 1995;Rogers et al. 1996; Reneau and Vaniman 1998),which may, in some cases, parallel paleocanyons inthe substrate. LANL ER Project (1998) identifiedthickness variations, lateral facies changes, andwithin-unit elevation differences along Cañon deValle consistent with differential compaction alongthe west-to-east course of the canyon. For fractur-ing observed at MDA P (N15W preferred orienta-tion) to be associated with differential compaction,paleotopography would have had a north-north-westerly trend, strongly oblique to Cañon de Valleand Pajarito Canyon.
The change in dip in Unit 3 identified east ofMDA P (Figs. 8b and 9b) coincides roughly withthe eastward pinch-out of Units 3T and 4u (Plate 1;Cross-section A-A', Plate 2), suggesting down-to-the-west faulting prior to deposition of Unit 3,which may have influenced the topography on theUnit 3 surface, the distribution of Units 3T and 4,and perhaps the distributed deformation represent-ed by fracturing at MDA P and faulting along theTA-9 graben.
Significantly, the bounding faults of the TA-9graben (G2) displace Qoal (probably in part1.13 Ma), indicating tectonic displacements aftercooling of the tuff. We conclude that fractures atMDA P result from a combination of thermalcontraction and tectonics. Faulting and associat-
V. Discussion
39

ed fracturing at MDA P likely represent distrib-uted deformation associated with the Pajaritofault and may be associated with deep-seated,down-to-the-west normal faulting antithetic to thedominantly down-to-the east displacement on thePajarito fault. Differential compaction over pre-Bandelier Tuff topography does not appear toplay a major role.
2. Structural setting of the study areaWe have identified four sets of structures in thearea between TA-3 and TA-16 and east of thePajarito fault zone: a) north-striking faults (F2, F3,F4, F5) defining a graben (G2) in the central partof the study area; b) north-northwest-striking frac-tures and rare faults (at MDA P) that bound theeastern side of the principal zone of deformationwithin the study area and may be the surfaceexpression of a subsurface fault or faults; c) rarenortheast-striking structures near the northern limitof the area associated with the southern end of theRendija Canyon fault (F11 and nearby photo lin-ear); and d) several small east-west-striking faults(northwest of building TA-16-260; southwest ofMDA P).
The structures in the western half of the study areaat Cañon de Valle and Pajarito Canyon accommo-date most of the structural deformation that wedocument east of the main escarpment. We esti-mate net down-to-the-west throw on BandelierTuff to be more than 6 m (20 ft) in the westernhalf of the map area at Cañon de Valle. This esti-mate must be used with caution, however, due toextensive post-Bandelier deposits in the westernquarter of this swath; these deposits may concealfaults or folds of significant displacement.Furthermore, this estimate could be low if thechange in dip observed east of MDA P on the topof Unit 3 represents monoclinal folding rather thandraping of pre-Unit 3 topography. Farther north,along Pajarito Canyon, the zone of greatest defor-mation east of the main escarpment also occupiesthe western half of the study area. East of theAnchor Ranch Road monocline M1, we estimate3 m (10 ft) of net down-to-the-east throw on
Bandelier Tuff and ~ 5 m (16 ft) down-to-the-eastthrow on the base of Qoal. Monocline M1 andfaults west of Anchor Ranch Road account foradditional displacement, perhaps as much as 15 m(45 ft) of net down-to-the-east throw on Qbt andthe base of Qoal; this amount would be less if themonocline M1 is partly due to the eastward-taper-ing wedge shape of Unit 3T. However, the higher-than-usual dip of the base of Qoal on the flank ofthe monocline suggests significant tectonic fold-ing. Down-to-the-east deformation in the north-western part of the study area is likely associatedwith evolution of the Pajarito fault zone as a fault-ed monocline.
Within the Pajarito fault zone, monoclinal foldsassociated with normal faulting are common (e.g.,McCalpin 1997; Gardner et al. 1999, 2001).Analog modeling and field studies show that exten-sional fault-propagation folds form above steeplydipping normal faults (e.g., Hardy and McClay1999; Withjack and Callaway 2000; Willsey et al.2002). Especially where a distinct mechanicalcontrast exists between basement and cover, dis-crete normal faulting at depth may be linked to dis-tributed deformation, including folding, at higherlevels. Slow displacement rates and thin, strongstrata overlying active normal faults favor develop-ment of broad monoclines (Withjack and Callaway2000). Continued displacement can cause propa-gation of the fault into the cover, resulting in afaulted monocline (M1, for example).
Structures near MDA P, including discontinuoussmall-displacement faults and fractures, are notclearly associated with any major fault at the sur-face but may be the surficial expression of deeper-seated normal faulting. Hanging-wall synclinesand footwall anticlines adjacent to fault planes, asobserved in Cañon de Valle in graben G2, are com-mon in extensional zones and generally indicatebreaching of a monocline rather than drag folding(Hardy and McClay 1999).
In general, the structural setting of the study areaappears similar in many respects to the setting of
Geology of the Western Part of Los Alamos National Laboratory
40

TA-3 to the north (Gardner et al. 1999) and TA-16to the south (Gardner et al. 2001). At all threelocations, a relatively narrow but discontinuousgraben lies at the base of and parallel to the mainescarpment of the Pajarito fault. Structure to theeast of the narrow graben in both TA-3 and TA-16is dominated by north-northeast and northeast-striking normal faults and monoclines, all of whichshow significant net down-to-the-west displace-ments on Bandelier Tuff. At TA-3, the north-north-east and northeast-striking structures are caused byconvergence of the Rendija Canyon and Pajaritofault zones, forming the southern end of the 3,650-m (12,000-ft) wide Diamond Drive graben(Gardner et al. 1999) and giving rise to distributedfaulting between Los Alamos Canyon and TwomileCanyon. At TA-16, north-northeast-striking openfissure networks are associated with the tensionalupper hinge zones of monoclines (Gardner et al.2001) or with open framework fissure-fill brecciasdeveloped at fault surfaces (Wong et al. 1995;McCalpin 1997, 1998; Gardner et al. 1998b, 2001).In the vicinity of TA-16, deformation associatedwith the Pajarito fault extends at least 1,500 m(5,000 ft) to the east of the Pajarito fault escarp-ment (Gardner et al. 2001). The dominantly down-to-the-west deformation in that area may be due toaccomodation of the eastern, hanging-wall block ofthe Pajarito fault to either lateral changes in strikeor vertical changes in dip of the Pajarito fault.Faulting and fracturing between TA-3 and TA-16 isdominated by north-northeast to north-northwest-striking faults and associated folds with smallamounts of down-to-the-east and down-to-the-westdisplacement. Similar to the TA-16 area, deforma-tion in the present study area extends at least1,500 m (5,000 ft) to the east of the Pajarito faultescarpment. This deformation appears to be asso-ciated with the Pajarito fault and may be causedalso by vertical changes in its dip resulting in deep-seated, down-to-the-west normal faulting antitheticto the Pajarito fault.
3. Comparison of structure to previous studiesRogers (1995) recognized many of the larger struc-tures that we have mapped, but we differ in place-
ment and interpretation of the style of deformation.Rogers (1995) recognized the western boundingfault (F4, Plate 1) of the graben near building TA-16-260 (G2, Plate 1) but inferred the oppositesense of displacement on the fault. She recognizedpart of the eastern bounding fault where it crossesPajarito Canyon (F3, Plate 1) with the same senseof displacement we observed. However, Rogers(1995) depicts the connections among these faultsquite differently than we do. She further infers asyncline, which we have confirmed with field data,more or less along the axis of the TA-9 graben.She recognized a north-trending, west-dippingmonocline crossing Cañon de Valle west ofMDA P, but we interpret the horizontal or gentlewest dips in the tuffs here to result from down-to-the-west faulting at the east side of graben G2.
Rogers (1995) indicates a north-striking, down-to-the-east fault in the northwestern part of the studyarea, paralleling Anchor Ranch Road and then cut-ting directly east of building TA-8-23 (Plate 1).We agree that placing a down-to-the-east normalfault at the surface there is tempting, but the geolo-gy does not require it. The Unit 3T/4 contact isfolded and climbing steeply westwards there andgives the illusion of down-to-the-east fault offset.Confirmation of folding here comes from thesteeper-than-usual dip of the base of Qoal(Fig. 8a).
Rogers (1995) also shows a west-striking fault inthe mesa north of Cañon de Valle. We mapped ashort segment of a west-striking fault about 610 m(2,000 ft) northwest of building TA-16-260, but wewere not able to trace this fault nearly as far westor east as Rogers depicts it. Numerous west-strik-ing faults appear on the Rogers (1995) map in ourstudy area for which we have found no evidence.However, west-southwest of MDA P we identifiedshort segments of west-striking faults that were notmapped by Rogers. West-striking faults are clearlypresent on the Pajarito Plateau, but they are muchless numerous than north-striking faults and play aless important, or less obvious role, in the structur-al evolution of the area.
V. Discussion
41

Budding and Purtymun (1976) show the “WaterCanyon fault” skirting the east side of MDA P.The trace of the fault on their map appears to runfrom the topographic step at the east end ofCampground Mesa (Gardner et al. 2001) and alongan aerial photographic linear that Gardner andHouse (1987) show on their maps. Our mappingrevealed no major fault displacements in theBandelier Tuff contacts between MDA P and thelimit of our mapping more than 450 m (1,500 ft)east of MDA P. A major structure on the maps ofRogers (1995) is her “Water Canyon Arch.”Gardner et al. (2001) chose not to show this fea-ture in TA-16 because Bandelier Tuff contactsappear to form an arch where an east-southeast-striking fault zone displaces tuff contacts down tothe north. Near MDA P, the position of the “WaterCanyon Arch” may, in fact, mark a prominenttopographic step located at the eastern pinch-out ofUnit 4u. The step also corresponds to the pinch-out of Unit 3T. We agree with Gardner et al.(2001) that the topographic step and linear are ero-sional features formed near the edge of a flow lobein Unit 4 and not a fault as interpreted by previousworkers (Budding and Purtyman 1976). We fur-ther propose that lateral stratigraphic changes inthe Tshirege Member that give rise to the step andlinear may be controlled by deep-seated structure,perhaps down-to-the-west faulting in the underly-ing Otowi Member. Sufficient time elapsedbetween deposition of the Otowi Member at1.61 Ma and the Tshirege Member at 1.22 Ma fordeformation to have occurred. The distribution ofUnits 3T and 4u, especially their eastward pinch-outs, may be fault controlled. We recommend thatthe terms “Water Canyon fault” and “WaterCanyon Arch” be abandoned since they have notbeen observed either in Water Canyon or in thepresent study area.
Evidence for a broad north-south-trending grabenin the subsurface beneath the study area is sparsebut intriguing. Geologic mapping constrains thesoutherly termination of the Diamond Drivegraben, bounded by the Pajarito fault and theRendija Canyon fault, to lie more or less at TA-3
and the Los Alamos County landfill. However,gravity data (Biehler et al. 1991), fracture data(Wohletz 1996, in preparation), and fault and frac-ture data (Kolbe et al. 1994; Reneau et al. 1995)suggest possible southwards, subsurface continua-tions of the down-to-the-west Rendija Canyonand Guaje Mountain faults in the subsurface,although they are not expressed as major faults inBandelier Tuff (e.g., Gardner et al. 1999).Thickness variations in the Cerro Toledo intervalin the general vicinity of the study area are sug-gestive of faulting after deposition of the OtowiMember. The Cerro Toledo interval is ~ 27.5 m(75 ft) thick in well SHB-3 at TA-16 (Gardner etal. 1993), ~ 36.5 m (120 ft) thick in well R-25 atTA-16 (R-25, LANL ER Project 1998), ~ 42 m(137 ft) thick at TA-55 (Fig. 2; Gardner et al.1993), and only ~ 15.3 m (50 ft) thick in well R-37-2 [located about 900 m (3,000 ft) southeastof the southeastern corner of the present studyarea] (LANL ER Project, unpublished data). Thegreater thickness of the Cerro Toledo interval atwell R-25 and TA-55 may indicate down-to-the-west faulting beneath the present study area,which may have influenced the distribution andthickness of Tshirege Member units.
Previous investigators have interpreted a subsur-face graben beneath the Pajarito Plateau, but inmost cases, its inferred location lies to the east ofthe study area. Budding (1978) identified a promi-nent gravity low about 3 km (1.9 mi) east of thecity of Los Alamos and interpreted a north-north-east-trending graben in the subsurface that rangesfrom about 5 km (3.1 mi) wide north of the studyarea to about 7 km (4.4 mi) wide at Water Canyon.He interpreted the graben as partly syn-deposition-al and partly post-depositional with the Santa FeGroup, which he modeled as up to 2 km (1.3 mi)thick in the graben. Estimated stratigraphic separa-tion on the bounding normal faults totals more than2 km in the north, diminishing somewhat to thesouth. In the vicinity of the study area, the westernbounding fault of the graben would be locatedsome 3 km (1.9 mi) east of the Pajarito fault withthe eastern bounding fault about 8 km (5 mi) east
Geology of the Western Part of Los Alamos National Laboratory
42

of the fault. Electromagnetic sounding surveysalso defined a northeast-trending trough beneaththe Pajarito Plateau (Williston, McNeil, andAssociates 1979). Cordell (1979), as well, inter-preted from regional gravity data a northeast-trend-ing graben in about the same position, which hesuggested is the southern continuation of theVelarde graben. Modeling of gravity profiles byWilliams (1979) identified no graben structure,consistent with seismic reflection lines across thesame area. She interpreted the gravity gradient asresulting from a density contrast between theTschicoma Formation and the Bandelier Tuff andPuye Formation rather than the result of a largefault offset.
Subsequent work by Biehler et al. (1991) demon-strated a pronounced Bouguer gravity anomalydirectly east of the Pajarito fault. The deepest partof the anomaly lies due south of the mapped tracesof the Rendija Canyon and Guaje Mountain faultsand about 5 to 6 km (3–4 mi) east of the Pajaritofault. Thickness variations in Puye Formationbeneath the LANL site are consistent with a pre-Bandelier Tuff graben (Vaniman et al., in prepara-tion). The eastern edge of the graben is not welldelineated but likely lies well east of the studyarea. These relations, combined with our resultsimplying structural control of depositional patternsin the Tshirege Member, suggest that further inves-tigation of a possible graben in the subsurface iswarranted.
4. Ages of faulting and related deformationBounds on the timing of the structural deforma-tion in the study area are not particularly robust.All structures are Quaternary in age in that theypostdate the Tshirege Member (1.22 Ma) of theBandelier Tuff. For many faults (F2, F3, F4, F6,F8, and F9), the only other unit that is clearlyfaulted or deformed is Qoal, which is probably inpart ~ 1.13 million years old. The westernbounding fault of the TA-9 graben (F4) apparent-ly cuts Qfo. A small fault (F7) that is part of aseries of aligned north-northeast-striking faultsapparently cuts Qfi. This fault is aligned with
fault F10, which experienced mid- to late-Pleistocene rupture and possible Holocene fissur-ing (McCalpin 1998). The youngest-known fault-ing in the study area occurred on fault F1, recent-ly trenched at the site of a new LANL EmergencyOperations Center. The most recent paleoseismicevent on F1 occurred in Holocene time (Reneauet al. 2002).
The Rendija Canyon fault appears to die out nearthe northern limit of the study area (Gardner et al.1999). Paleoseismic trenching of the RendijaCanyon fault about 5 km (3.1 mi) northeast of thestudy area showed that the most recent earthquakeoccurred at about 9 or 23 ka (Wong et al. 1995;Kelson et al. 1996). No studies to date have defini-tively identified a southward continuation of theRendija Canyon fault south of Twomile Canyon.To the east of the study area, in trenches at PajaritoMesa, no offset of the buried soil beneath the ElCajete pumice was observed, indicating no faultingfor the last 50 to 60 thousand years (Reneau et al.1995). Therefore, young surface rupture docu-mented on the Rendija Canyon fault terminatednorth of Pajarito Mesa. Alternatively, displace-ment was transferred to other faults either east orwest of Pajarito Mesa.
To the south of the study area, evidence on the tim-ing of deformation is provided by four structures atTA-16 that are subsidiary to the Pajarito fault(Gardner et al. 2001). A fissured lineament, “fis 1”of Gardner et al. (2001), which projects toward thefault F4 of this study, deforms not only theTshirege Member of the Bandelier Tuff but possi-bly also Qoal, which is probably in part about 1.13million years old. Fault F2 of Gardner et al.(2001) is a down-to-the-west fault that parallelsAnchor Ranch Road and projects towards the pre-sent study area. This fault appears to truncatedeposits of the 50- to 60-thousand-year-old ElCajete pumice (Qec), but field relations areequivocal. Fault F9 of Gardner et al. (2001),which parallels West Jemez Road, appears to trun-cate an alluvial fan unit, Qfi, but again, field rela-tions are equivocal. Radiocarbon dates from a
V. Discussion
43

borehole at TA-16 led Gardner et al. (2001) tointerpret a seismic event on a fissure (their “fis 2”)sometime prior to 8.7 to 9.2 cal ka and at least oneadditional, younger paleoseismic event whose ageis not well constrained.
The occurrence of Holocene paleoseismic eventson fault F1 (Plate 1), fis 2 of Gardner et al. (2001),and possibly the northward continuation of F10(Plate 2) suggests that there may well be morestructures in the study area that have experiencedHolocene events, although we either lack the strati-graphic record or the exposure to demonstrate it.Prevalent fill and disturbed surficial geologic unitswould require trenching to determine the presenceor absence of faults in the western part of the studyarea, particularly in TA-8, TA-69, and the westernhalf of TA-9.
D. Recommendations
Based on the results of this study, we recommendthat the south slope of Pajarito Canyon directlyeast of building TA-8-21 at fault F7 (Plate 1) beconsidered as a possible trench site. The identifi-cation of faults that may cut post-Bandelier fanunits in this area suggests a more or less continu-ous fault system, at least in the subsurface, thatmay connect to the north with fault F10, which hasundergone 1.5 m (5 ft) down-to-the-east separationon Qbt with possible Holocene rupture (McCalpin1998). The best potential site for trenching, how-ever, is the site of a gas pipeline installed someyears ago.
We also recommend drilling in the area of TA-8 tolocate the bases of Units 3T and 3 to resolve theissue of whether steep dips at the Unit 4/3T con-tact are due to westwards thickening of Unit 3T orto structural deformation. Similarities or differ-ences in trends of the Unit 3/3T contact wouldbear on this question. In addition, locating theUnit 3/3T contact would give us better control onthe dip separation across the Pajarito fault. In thisarea as well, drilling could determine the thick-ness of fan units, identifying the depth of the
graben at the base of the Pajarito fault. We rec-ommend this action because it is key to under-standing the structural setting of the western partof LANL, which would directly aid future seismichazard evaluations.
The study area clearly lies within the Pajarito faultsystem, albeit a part of the system that is dominat-ed by subsidiary or distributed ruptures on themajor faults. As such, this is an area of generallyhigher potential for seismic surface rupture, rela-tive to locations farther removed from the Pajaritofault zone. Probabilistic analyses of surface rup-ture potential at TA-16 by Olig et al. (2001), how-ever, indicate that, even in consideration of 1-in-10,000-year events, seismic surface rupture onlybecomes a significant hazard on the principal ormain trace of the Pajarito fault.
VI. ACKNOWLEDGMENTS
This work was supported by the LANL SeismicHazards Program under the direction of LarryGoen with funding from the Office ofInfrastructure, Facilities, and Construction of theLANL Operations Directorate. We thank ScottGibbs, Jim Holt, Carolyn Zerkle, DonnaRichardson, and Craig Leasure for their support.Yolanda Frazier, from ESA-FM, and LucilleWesterholt, Ken Uher, Harvey Decker, and CathySmith from DX Division facilitated access to tech-nical areas. Dave Broxton, Rick Warren, DaveVaniman, and Ken Wohletz provided discussionsand insights on issues regarding the stratigraphy ofthe Bandelier Tuff. We thank Ken Bostick, MDA PClosure Team Leader, for providing resources,access to the site, access to core, and field person-nel. We thank Emily Kluk and Kellie Raven forgeochemical analyses, LANL’s GeographicInformation System Laboratory for invaluableassistance with cartography and database manage-ment, Bill Carey for assistance with calculation ofpoint elevations using the 1991 DEM, AnthonyGarcia for graphic design, and Ken Wohletz for ahelpful review.
Geology of the Western Part of Los Alamos National Laboratory
44

VII. REFERENCES
Aldrich, M. J., Jr., Chapin, C. E., and Laughlin,A. W. 1986. Stress history and tectonic develop-ment of the Rio Grande rift, New Mexico. Journalof Geophysical Research 91 (B6): 6199–6211.
Bailey, R. A., Smith, R. L., and Ross, C. S. 1969.Stratigraphic nomenclature of volcanic rocks in theJemez Mountains, New Mexico. U. S. GeologicalSurvey Bulletin 1274-P, 19 pp.
Baldridge, W. S., Dickerson, P. W., Riecker, R. E.,and Zidek, J., editors. 1984. Rio Grande rift:northern New Mexico. New Mexico GeologicalSociety Guidebook 35, 379 pp.
Baldridge, W. S., Keller, G. R., Haak, V.,Wendlandt, E., Jiracek, G. R., and Olsen, K. H.1995. The Rio Grande rift. In Continental Rifts:Evolution, Structure, Tectonics, Olsen, K. H., edi-tor, pp. 233–275. Amsterdam, Holland: Elsevier.
Bates, R. L., and Jackson, J. A. 1980. Glossary ofGeology. American Geological Institute, 749 pp.
Biehler, S., Ferguson, J., Baldridge, W. S., Jiracek,G. R., Aldern, J. L., Martinez, M., Fernandez, R.,Romo, J., Gilpin, B., Braile, L. W., Hersey, D. R.,Luyendyk, B. P., and Aiken, C. L. 1991. A geo-physical model of the Española basin, Rio Granderift, New Mexico. Geophysics 56 (3): 340–353.
Brown, F., Purtymun, W. D., Stoker, A., and Barr,A. 1988. Site geology and hydrology of TechnicalArea 16, Area P. Los Alamos National Laboratoryreport LA-11209-MS, 8 pp.
Broxton, D. E., and Reneau, S. L. 1995.Stratigraphic nomenclature of the Bandelier Tufffor the Environmental Restoration Project at LosAlamos National Laboratory. Los AlamosNational Laboratory report LA-13010-MS, 21 pp.
Broxton, D. E., Ryti, R. T., Carlson, D., Warren,R. G., Kluk, E., and Chipera, S. 1996. Natural
background geochemistry of the Bandelier Tuff atMDA P, Los Alamos National Laboratory. LosAlamos National Laboratory report LA-UR-96-1151, 42 pp.
Broxton, D., Warren, R., Longmire, P., Gilkeson,R., Johnson, S., Rogers, D., Stone, W., Newman,B., Everett, M., Vaniman, D., McLin, S., Skalski,J., and Larssen, D. 2002. Characterization Well R-25 completion report. Los Alamos NationalLaboratory report LA-13909-MS, 77 pp. with 8appendices.
Budding, A. J. 1978. Gravity survey of thePajarito Plateau, Los Alamos and Santa FeCounties, New Mexico. Los Alamos ScientificLaboratory report LA-7419-MS, 15 pp.
Budding, A. J., and Purtymun, W. D. 1976.Seismicity of the Los Alamos area based on geo-logic data. Los Alamos Scientific Laboratoryreport LA-6278-MS, 9 pp.
Carey, W. J., and Cole, G. 2002. Description ofthe Cerro Grande fire laser altimetry (LIDAR) dataset. Los Alamos National Laboratory report LA-13892-MS, 57 pp.
Chapin, C. E., and Cather, S. M. 1994. Tectonicsetting of the axial basins of the northern and cen-tral Rio Grande rift. In Basins of the Rio GrandeRift: Structure, Stratigraphy, and TectonicSetting, Keller, G. R., and Cather, S. M., editors.Geological Society of America Special Paper291: 5–25.
Cordell, L. 1979. Gravimetric expression ofgraben faulting in Santa Fe County and theEspañola basin, New Mexico. New MexicoGeological Society Guidebook 30: 59–64.
Criswell, C. W., Channell, R. A., and others. Inpreparation. Results of field investigation forbedrock characterization at Material Disposal AreaP, Los Alamos National Laboratory, New Mexico.Los Alamos National Laboratory report.
VII. References
45

Geology of the Western Part of Los Alamos National Laboratory
46
Davis, J. C. 1986. Statistics and Data Analysis inGeology. New York, NY: John Wiley and Sons,646 pp.
Deutsch, C. V., and Journel, A. G. 1998. GSLIBGeostatistical Software Library and Users Guide.New York, NY: Oxford University Press, 369 pp.
Dransfield, B. J., and Gardner, J. N. 1985.Subsurface geology of the Pajarito Plateau,Española basin, New Mexico. Los AlamosNational Laboratory report LA-10455-MS, 15 pp.
Gardner, J. N., and Goff, F. 1984. Potassium-argon dates from the Jemez volcanic field:Implications for tectonic activity in the north-cen-tral Rio Grande rift. New Mexico GeologicalSociety Guidebook 35: 75-81.
Gardner, J. N., and House, L. 1987. Seismic haz-ards investigations at Los Alamos NationalLaboratory, 1984 to 1985. Los Alamos NationalLaboratory report LA-11072-MS, 76 pp.
Gardner, J. N., Goff, F., Garcia, S., and Hagan,R. C. 1986. Stratigraphic relations and lithologicvariations in the Jemez volcanic field, NewMexico. Journal of Geophysical Research 91(B2): 1763–1778.
Gardner, J. N., Baldridge, W. S., Gribble, R.,Manley, K., Tanaka, K., Geissman, J. W.,Gonzalez, M., and Baron, G. 1990. Results fromSeismic Hazards Trench #1 (SHT-1), Los AlamosSeismic Hazards Investigations. Los AlamosNational Laboratory unpublished report EES1-SH90-19, 57 pp.
Gardner, J. N., Kolbe, T., and Chang, S. 1993.Geology, drilling, and some hydrologic aspects ofseismic hazards program core holes, Los AlamosNational Laboratory, New Mexico. Los AlamosNational Laboratory Report LA-12460-MS, 19 pp.
Gardner, J. N., Lavine, A., Vaniman, D., andWoldeGabriel, G. 1998a. High-precision geologic
mapping to evaluate the potential for seismic sur-face rupture at TA-55, Los Alamos NationalLaboratory. Los Alamos National Laboratoryreport LA-13456-MS, 13 pp.
Gardner, J. N., Lavine, A., WoldeGabriel, G.,Krier, D. J., Vaniman, D., and McCalpin, J. 1998b.Evolution of the western boundary of the RioGrande rift, northern New Mexico. EOS,Transactions of the American Geophysical Union79 (45): F614.
Gardner, J. N., Lavine, A., WoldeGabriel, G.,Krier, D., Vaniman, D., Caporuscio, F., Lewis, C.,Reneau, P., Kluk, E., and Snow, M. J. 1999.Structural geology of the northwestern portion ofLos Alamos National Laboratory, Rio Grande rift,New Mexico: Implications for seismic surfacerupture potential from TA-3 to TA-55. LosAlamos National Laboratory report LA-13589-MS, 112 pp.
Gardner, J. N., Reneau, S. L., Lewis, C. J.,Lavine, A., Krier, D., WoldeGabriel, G., andGuthrie, G. 2001. Geology of the Pajarito faultzone in the vicinity of S-Site (TA-16), LosAlamos National Laboratory, Rio Grande rift,New Mexico. Los Alamos National Laboratoryreport LA-13831-MS, 86 pp.
Golombek, M. P., McGill, G. E., and Brown, L.1983. Tectonic and geologic evolution of theEspañola basin, Rio Grande rift: Structure, rate ofextension, and relation to the state of stress in thewestern U. S. Tectonophysics 94: 483–507.
Griggs, R. L. 1964. Geology and ground waterresources of the Los Alamos area, New Mexico.U. S. Geological Survey Water-Supply Paper1753, 107 pp.
Hardy, S., and McClay, K. 1999. Kinematic mod-elling of extensional fault-propagation folding.Journal of Structural Geology 21 (7): 695–702.
Hext, G. R. 1963. The estimation of second-order

tensors, with related tests and designs. Biometrika50: 353–373.
Izett, G. A., and Obradovich, J. D. 1994.40Ar/39Ar age constraints for the Jaramillo NormalSubchron and the Matuyama-Brunhes geomagneticboundary. Journal of Geophysical Research 99(B2): 2925–2934.
Keller, G. R., editor. 1986. Special section on theRio Grande rift. Journal of Geophysical Research91 (B6): 6142–6345.
Kelley, V. C. 1979. Tectonics, middle RioGrande rift, New Mexico. In Rio Grande Rift:Tectonics and Magmatism, Riecker, R. E., editor,pp. 57–70. Washington, D.C.: AmericanGeophysical Union.
Kelson, K. I., and Olig, S. S. 1995. Estimatedrates of Quaternary crustal extension in the RioGrande rift, northern New Mexico. New MexicoGeological Society Guidebook 46: 9–12.
Kelson, K. I., Hemphill-Haley, M. A., Olig, S. S.,Simpson, G. D., Gardner, J. N., Reneau, S. L.,Kolbe, T. R., Forman, S. L., and Wong, I. G. 1996.Late-Pleistocene and possibly Holocene displace-ment along the Rendija Canyon fault, Los AlamosCounty, New Mexico. New Mexico GeologicalSociety Guidebook 47: 153–160.
Kolbe, T., Sawyer, J., Gorton, A., Olig, S.,Simpson, D., Fenton, C., Reneau, S., Carney, J.,Bott, J., and Wong, I. 1994. Evaluation of thepotential for surface faulting at the proposed MixedWaste Disposal Facility, TA-67. Unpublished con-sulting report prepared for Los Alamos NationalLaboratory by Woodward-Clyde Federal Services,Oakland, CA, 3 volumes.
Kolbe, T., Sawyer, J., Springer, J., Olig, S.,Reneau, S., Hemphill-Haley, M., and Wong, I.1995. Evaluation of the potential for surface fault-ing at TA-63. Unpublished consulting report pre-pared for Los Alamos National Laboratory by
Woodward-Clyde Federal Services, Oakland, CA.
Krier, D., Caporuscio, F., Lavine, A., and Gardner,J. N. 1998a. Stratigraphy and geologic structure atthe SCC and NISC building sites, Technical Area3, Los Alamos National Laboratory. Los AlamosNational Laboratory report LA-13507-MS, 23 pp.
Krier, D., Caporuscio, F., Gardner, J. N., andLavine, A. 1998b. Stratigraphy and geologicstructure at the Chemical and Metallurgy (CMR)building, Technical Area 3, Los Alamos NationalLaboratory. Los Alamos National Laboratoryreport LA-13522-MS, 32 pp.
LANL ER Project (Los Alamos National Labora-tory Environmental Restoration Project). 1998.RFI Report for Potential Release Site 16-021 (c).Los Alamos National Laboratory report LA-UR-98-4101, 3 volumes.
Lavine, A., Gardner, J. N., Vaniman, D., andWoldeGabriel, G. 1997. Southward splaying andtermination of the Rendija Canyon fault, PajaritoPlateau, New Mexico. Geological Society ofAmerica Abstracts with Programs 29 (6): A-259.
Lavine, A., Gardner, J. N., Reneau, S. L.,WoldeGabriel, G., Vaniman, D. T., and Carney, J.1998. High-precision geologic mapping to evalu-ate the potential for seismic surface rupture at LosAlamos National Laboratory, New Mexico. EOS,Transactions of the American Geophysical Union79 (45): F614.
Longmire, P. A., Reneau, S. L., Watt, P. M.,McFadden, L. D., Gardner, J. N., Duffy, C. J., andRyti, R. T. 1996. Natural background geochem-istry, geomorphology, and pedogenesis of selectedsoil profiles and Bandelier Tuff, Los Alamos, NewMexico. Los Alamos National Laboratory reportLA-12913-MS, 176 pp.
Machette, M. N., Personius, S. F., Kelson, K. I.,Haller, K. M., and Dart, R. L. 1998. Map and datafor Quaternary faults and folds in New Mexico.
VII. References
47

U. S. Geological Survey, open-file report 98-521,443 pp., 1 plate, scale 1:750,000.
Manley, K. 1979. Stratigraphy and structure ofthe Española basin, Rio Grande rift, New Mexico.In Rio Grande Rift: Tectonics and Magmatism,Riecker, R. E., editor, pp. 71–86. Washington,D.C.: American Geophysical Union.
Mardia, K. V. 1972. Statistics of DirectionalData. London: Academic Press, 357 pp.
McCalpin, J. P. 1997. Geomorphology and struc-ture of the Pajarito fault zone west of Los AlamosNational Laboratory, New Mexico. Unpublishedconsulting report prepared for Los AlamosNational Laboratory by GEO-HAZ Consulting,Inc., Estes Park, CO, 22 pp.
McCalpin, J. P. 1998. Late Quaternary faulting onthe Pajarito fault, west of Los Alamos NationalLaboratory, north-central New Mexico: Resultsfrom the seven-trench transect excavated in sum-mer of 1997. Unpublished consulting report pre-pared for Los Alamos National Laboratory byGEO-HAZ Consulting, Inc., Estes Park, CO,112 pp., 4 appendices.
McCalpin, J. P. 1999. Late Quaternary Faultingon the Pajarito Fault, west of Los Alamos NationalLaboratory, north-central New Mexico: Resultsfrom seven trenches excavated in summer of 1998.Unpublished consulting report prepared for LosAlamos National Laboratory by GEO-HAZConsulting, Inc., Estes Park, CO, 104 pp.
McDonald, E. V., Reneau, S. L., and Gardner, J. N.1996. Soil-forming processes on the PajaritoPlateau: Investigation of a soil chronosequence inRendija Canyon. New Mexico Geological SocietyGuidebook 47: 367–374.
Olig, S. S., Kelson, K. I., Gardner, J. N., Reneau,S. L., and Hemphill-Haley, M. 1996. The earth-quake potential of the Pajarito fault system, NewMexico. New Mexico Geological Society
Guidebook 47: 143–151.
Olig, S., Youngs, R., and Wong, I. 2001.Probabilistic seismic hazard analysis for surfacefault displacement at TA-16, Los Alamos NationalLaboratory. Unpublished report prepared for LosAlamos National Laboratory by URS ComputingCorporation, Oakland, CA.
Phillips, W. M., McDonald, E. V., Reneau, S. L.,and Poths, J. 1998. Dating soils and alluviumwith cosmogenic 21Ne depth profiles: Case studiesfrom the Pajarito Plateau, New Mexico. Earth andPlanetary Science Letters 160: 209–223.
Purtyman, W. D., Koenig, E., Morgan, T., andSagan, E. 1995. Joint orientation and character-istics as observed in a trench excavated near TA-3 and a basement excavated at TA-55. LosAlamos National Laboratory report LA-13036-MS, 42 pp.
Reneau, S. L. 1995. Geomorphic studies at DPMesa and vicinity. In “Earth science investiga-tions for environmental restoration—Los AlamosNational Laboratory Technical Area 21,” Broxton,D. E., and Eller, P. G., editors, Los AlamosNational Laboratory report LA-12934-MS,pp. 65–92.
Reneau, S. L. 2000. Stream incision and terracedevelopment in Frijoles Canyon, BandelierNational Monument, New Mexico, and the influ-ence of lithology and climate. Geomorphology32: 171–193.
Reneau, S. L., and McDonald, E. V. 1996.Landscape history and processes on the PajaritoPlateau, northern New Mexico. “Rocky MountainCell, Friends of the Pleistocene Field TripGuidebook,” unpublished Los Alamos NationalLaboratory report LA-UR-96-3035, 195 pp.
Reneau, S. L., and Vaniman, D. T. 1998. Fracturecharacteristics in a disposal pit on Mesita del Buey,Los Alamos National Laboratory. Los Alamos
Geology of the Western Part of Los Alamos National Laboratory
48

National Laboratory report LA-13539-MS, 21 pp.
Reneau, S. L., Kolbe, T., Simpson, D., Carney,J. S., Gardner, J. N., Olig, S. S., and Vaniman,D. T. 1995. Surficial materials and structure atPajarito Mesa. In “Geological site characterizationfor the proposed Mixed Waste Disposal Facility,Los Alamos National Laboratory,” Reneau, S. L.,and Raymond, R., editors, Los Alamos NationalLaboratory report LA-13089-MS, pp. 31–69.
Reneau, S. L., McDonald, E. V., Gardner, J. N.,Kolbe, T. R., Carney, J. S., Watt, P. M., andLongmire, P. A. 1996a. Erosion and deposition onthe Pajarito Plateau, New Mexico, and implicationsfor geomorphic responses to late Quaternary cli-matic changes. New Mexico Geological SocietyGuidebook 47: 391–397.
Reneau, S. L., Gardner, J. N., and Forman, S. L.1996b. New evidence for the age of the youngesteruptions in the Valles caldera, New Mexico.Geology 24: 7–10.
Reneau, S. L., Gardner, J. N., Lavine, A.,McDonald, E. V., Lewis, C., Katzman, D.,WoldeGabriel, G., Krier, D., Bergfeld, D., andHeikoop, J. 2002. Paleoseismic investigation ofTrench EOC-2, Pajarito fault zone, Los AlamosNational Laboratory, New Mexico. Los AlamosNational Laboratory report LA-13939-MS, 65 pp.
Riecker, R. E., editor. 1979. Rio Grande Rift:Tectonics and Magmatism. Washington, D.C.:American Geophysical Union, 438 pp.
Robin, P.-Y. F., and Jowett, E. C. 1986.Computerized density contouring and statisticalevaluation of orientation data using counting cir-cles and continuous weighting functions.Tectonophysics 121: 207–223.
Rogers, M. A. 1995. Geologic Map of Los AlamosNational Laboratory Reservation. Santa Fe, NM:State of New Mexico Environment Department,scale 1:400.
Rogers, M. A., Budding, K. E., and Christie,C. V. L. 1996. Distinguishing tectonic joints fromcooling joints in the Bandelier Tuff (Pleistocene),Pajarito Plateau, Los Alamos County, NewMexico. New Mexico Geological SocietyGuidebook 47: 293–301.
Ross, C. S., and Smith, R. L. 1961. Ash-flowtuffs: Their origin, geologic relations, and identifi-cation. U.S. Geological Survey Professional Paper366, 81 pp.
Sanford, A. R., Jaksha, L. H., and Cash, D. J.1991. Seismicity in the Rio Grande rift. InNeotectonics of North America, Decade MapVolume 1, Slemmons, D. B., Engdahl, E. R.,Zoback, M. D., and Blackwell, D. D., editors, pp.229–244. Boulder, CO: Geological Society ofAmerica.
Smith, R. L., Bailey, R. A., and Ross, C. S. 1970.Geologic map of the Jemez Mountains, NewMexico. U.S. Geological Survey miscellaneousinvestigations map I-571, scale 1:125,000.
Spell, T. L., and Harrison, T. M. 1993. 40Ar/39Argeochronology of post-Valles caldera rhyolites,Jemez volcanic field, New Mexico. Journal ofGeophysical Research 98: 8031–8051.
Starkey, J. 1977. The contouring of orientationdata represented in spherical projection. CanadianJournal of Earth Sciences 14: 268–277.
Steck, L. K., Thurber, C. H., Fehler, M. C.,Lutter, W. J., Roberts, P. M., Baldridge, W. S.,Stafford, D. G., and Sessions, R. 1998. Crustand upper mantle P-wave velocity structurebeneath Valles caldera, New Mexico: Resultsfrom the Jemez teleseismic tomography experi-ment. Journal of Geophysical Research 103(B10): 24,301–24,320.
Stimac, J. A., Broxton, D. E., Kluk, E. C., andChipera, S. J. 1998. Preliminary stratigraphy oftuffs from borehole 49-2-700-1 at Technical Area
VII. References
49
49. Los Alamos National Laboratory unpublishedreport, 21 pp.
Toyoda, S., Goff, F., Ikeda, S., and Ikeya, M. 1995.ESR dating of quartz phenocrysts in the El Cajeteand Battleship Rock Members of the VallesRhyolite, Valles caldera, New Mexico. Journal ofVolcanology and Geothermal Research 67: 29–40.
Vaniman, D., and Chipera, S. 1995. Mesa-pene-trating fractures, fracture mineralogy, and faulttraces at Pajarito Mesa. In “Geological SiteCharacterization for the Proposed Mixed WasteDisposal Facility,” Reneau, S. L., and Raymond,R., Jr., editors, Los Alamos National Laboratoryreport LA-13089-MS, pp. 71–85.
Vaniman, D., and Wohletz, K. 1990. Results ofgeological mapping/fracture studies: TA-55 area.Los Alamos National Laboratory Seismic HazardsProgram memo EES1-SH90-17, 25 pp., 3 plates,23 figures.
Vaniman, D., Cole, G., and Broxton, D. In prepa-ration. From drill-hole data to 3-D geologic mod-els. In “Groundwater Annual Status Report—2001,” Nylander, C., editor. Los Alamos NationalLaboratory report.
Walters, M. C. 1996. Fracture analysis of theBandelier Tuff, Pajarito Plateau, north-central RioGrande rift, New Mexico. M.S. thesis, TexasChristian University, Fort Worth, TX, 91 pp.
Walters, M. C., and Aldrich, M. J., Jr. 1997.Distinguishing cooling and tectonic joints in theBandelier Tuff, Pajarito Plateau, north-central RioGrande rift, New Mexico. Geological Society ofAmerica Abstracts with Programs 29 (6): A-417.
Warren, R. G., McDonald, E. V., and Ryti, R. T.1997. Baseline geochemistry of soil and bedrockTshirege Member of the Bandelier Tuff. Los AlamosNational Laboratory report LA-13330-MS, 69 pp.
Williams, L. M. 1979. Gravity study of the Los
Alamos area, New Mexico. Los Alamos ScientificLaboratory report LA-8154-MS, 18 pp.
Williston, McNeil, and Associates. 1979. A timedomain survey of the Los Alamos region, NewMexico. Los Alamos Scientific Laboratory reportLA-7657-MS, 32 pp.
Willsey, S. P., Umhoefer, P. J., and Hilley, G. E.2002. Early evolution of an extensional monoclineby a propagating normal fault: 3D analysis fromcombined field study and numerical modeling.Journal of Structural Geology 24 (4): 651–669.
Wilson, J. E., Goodwin, L. B., and Lewis, C. J.2001. Petrophysical controls on fault-zone defor-mation in ash-flow tuffs—Deformation bands ver-sus fractures and implications for fluid-fault inter-action. EOS, Transactions of the AmericanGeophysical Union 82: F1191.
Withjack, M. O., and Callaway, S. 2000. Activenormal faulting beneath a salt layer: An experimen-tal study of deformation patterns in the coversequence. American Association of PetroleumGeologists Bulletin 84 (5): 627–651.
Wohletz, K. H. 1995. Measurement and analysisof rock fractures in the Tshirege Member of theBandelier Tuff along Los Alamos Canyon adjacentto Technical Area-21. In “Earth Science Inves-tigations for Environmental Restoration—LosAlamos National Laboratory Technical Area 21,”Broxton, D. E., and Eller, P. G., editors, pp. 19–32.Los Alamos National Laboratory report LA-12934-MS.
Wohletz, K. H. 1996. Fracture characterization ofthe Bandelier Tuff in OU-1098 (TA-2 and TA-41).Los Alamos National Laboratory report LA-13194-MS, 19 pp.
Wohletz, K. H. In preparation. Fractures in weld-ed tuff. In The Tuff Handbook, Heiken, G., andBroxton, D. E., editors. Geological Society ofAmerica Special Paper. Los Alamos National
Geology of the Western Part of Los Alamos National Laboratory
50

Laboratory report LA-UR-99-6556.
Wolff, J. A., and Gardner, J. N. 1995. Is the Vallescaldera entering a new cycle of activity? Geology23: 411–414.
Wong, I., Kelson, K., Olig, S., Kolbe, T.,Hemphill-Haley, M., Bott, J., Green, R., Kanakari,H., Sawyer, J., Silva, W., Stark, C., Haraden, C.,Fenton, C., Unruh, J., Gardner, J., Reneau, S., andHouse, L. 1995. Seismic hazards evaluation of theLos Alamos National Laboratory. Unpublishedconsulting report prepared for Los AlamosNational Laboratory by Woodward-Clyde FederalServices, Oakland, CA, 3 volumes.
Woodcock, N. H. 1977. Specification of fabricshapes using an eigenvalue method. GeologicalSociety of American Bulletin 88: 1231–1236.
VII. References
51

Geology of the Western Part of Los Alamos National Laboratory
52

Appendix A. Whole Rock Geochemistry
53
APPENDIX A. WHOLE ROCK GEOCHEMISTRY
Table A-1. Locations of Bandelier Tuff Samples
Coordinates†
Sample Stratigraphic Northing Easting ElevationNumber* Unit (ft) (ft) (ft)
CDV-1 Qbt3 1764589 1615570 7336
CDV-2 Qbt3 1764702 1615684 7355
CDV-3 Qbt3 1764706 1615665 7377
CDV-4 Qbt3T 1764705 1615643 7381
CDV-5 Qbt3T 1764728 1615618 7397
CDV-6 Qbt4l 1764747 1615603 7402
CDV-7 Qbt4l 1764770 1615574 7417
CDV-8 Qbt4u 1764838 1615505 7465
CDV-9 Qbt4u 1764853 1615497 7477
CDV-10 Qbt4u 1764849 1615468 7494
MDAP-257-0.2 Qbt4? 1764163 1615576 7464
MDAP-257-9.8 Qbt4l 1764163 1615576 7454
MDAP-257-25.8 Qbt4l 1764163 1615576 7438
MDAP-257-40.2 Qbt4l 1764163 1615576 7424
MDAP-257-54.9 Qbt4l 1764163 1615576 7409
MDAP-257-55.3 Qbt3T 1764163 1615576 7409
MDAP-257-66.4 Qbt3T 1764163 1615576 7398
MDAP-257-70.1 Qbt3T 1764163 1615576 7394
MDAP-257-134.4 Qbt3 1764163 1615576 7330
MDAP-257-139.5 Qbt3 1764163 1615576 7325
MDAP-257-144.0 Qbt3 1764163 1615576 7320
MDAP-273-42.0 Qbt4 1764283 1616023 7411
MDAP-273-42.4 Qbt3T 1764283 1616023 7410
MDAP-273-49.8 Qbt3T 1764283 1616023 7403
MDAP-273-49.9 Qbt3T 1764283 1616023 7403
MDAP-273-82.1 Qbt3T 1764283 1616023 7371
MDAP-273-84.2 Qbt3T 1764283 1616023 7369
MDAP-273-96.7 Qbt3 1764283 1616023 7356
MDAP-273-117.0 Qbt3 1764283 1616023 7336
*Abbreviations as follows: CDV, Cañon de Valle; MDAP, Material Disposal Area P.†Northing and easting coordinates for CDV were digitized from topographic maps. The elevation for CDV-10 was drawn from the DEM, and the remaining sample elevations were calculated from the measured section. The coordinates for MDA P boreholes were surveyed by the LANL ER Project, and sample elevations were measured from cores. Northing and easting coordinates arein the State Plane Coordinate System, New Mexico Central Zone, 1983 North American Datum.

Geology of the W
estern Part of Los A
lamos N
ational Laboratory
54
Table A-2. Major and Trace Element Geochemistry of Bandelier Tuff (notes on page 55)
Sample Major Elements (wt %)† Trace Elements (ppm)
Number* SiO2 TiO2 Al2O3 Fe2O3T MnO MgO CaO Na2O K2O P2O5 LOI Total Zn Rb Sr Y Zr Nb Ba
CDV-1 75.99 0.128 12.17 1.57 0.052 BD 0.27 4.10 4.52 0.022 0.44 98.82 53.6 101.5 35.6 34.7 243.1 45.7 135.2
CDV-2 75.15 0.150 12.70 1.73 0.061 0.07 0.28 3.92 4.60 BD 0.73 98.66 52.1 97.5 45.7 31.3 254.8 47.1 231.3
CDV-3 74.56 0.151 12.94 1.72 0.056 0.07 0.26 3.99 4.66 0.027 0.64 98.43 72.3 104.7 40.3 45.1 273.6 53.2 255.5
CDV-4 74.62 0.147 12.78 1.95 0.049 BD 0.23 4.15 4.63 0.032 0.59 98.59 56.2 104.5 38.2 48.0 295.9 47.8 168.4
CDV-5 75.45 0.159 12.64 1.87 0.063 0.07 0.28 4.29 4.65 0.019 0.38 99.50 56.4 102.5 39.2 33.9 308.7 49.9 187.7
CDV-6 74.49 0.196 13.19 2.13 0.061 0.11 0.32 4.07 4.64 0.022 0.75 99.22 53.7 96.3 35.7 40.6 326.0 41.1 181.8
CDV-7 70.73 0.286 13.56 2.46 0.073 0.31 0.76 4.85 4.90 0.057 1.08 97.99 75.2 81.7 108.8 33.1 350.8 43.8 378.9
CDV-8 73.64 0.244 12.97 2.42 0.074 0.30 0.73 4.05 4.47 0.045 0.80 98.96 63.5 80.4 89.8 55.6 325.4 40.7 379.5
CDV-9 72.96 0.242 12.96 2.32 0.087 0.27 0.69 3.79 4.76 0.117 1.82 98.19 64.2 83.3 74.6 54.7 344.4 46.2 311.4
CDV-10 72.78 0.235 14.08 1.71 0.016 BD 0.33 4.75 4.84 0.053 0.48 98.80 25.3 78.5 90.6 22.0 361.7 34.2 467.3
MDAP-257-0.2 70.62 0.252 13.59 3.36 0.021 0.34 0.78 4.04 4.48 0.056 1.22 97.55 42.0 77.3 99.2 49.6 29.01 50.8 416.9
MDAP-257-9.8 72.04 0.288 13.58 2.46 0.077 0.26 0.81 4.64 4.56 0.053 0.45 98.77 71.7 80.6 96.2 27.3 353.0 33.0 466.7
MDAP-257-25.8 71.05 0.345 13.67 2.73 0.088 0.35 0.94 4.67 4.50 0.069 0.39 98.41 73.4 79.3 120.8 30.0 404.6 28.6 489.6
MDAP-257-40.2 70.05 0.370 14.26 2.86 0.091 0.37 1.17 4.87 4.41 0.086 0.41 98.54 63.8 73.7 144.8 41.1 384.8 35.3 600.8
MDAP-257-54.9 71.77 0.354 13.69 2.75 0.093 0.33 1.03 4.64 4.26 0.073 0.52 99.01 84.6 81.8 127.7 32.7 395.8 45.3 566.1
MDAP-257-55.3 75.38 0.150 12.41 1.70 0.060 0.06 0.33 4.34 4.61 0.013 0.15 99.05 58.5 102.7 37.8 34.4 277.3 43.1 236.7
MDAP-257-66.4 75.11 0.153 12.50 1.78 0.063 0.08 0.32 4.35 4.60 0.014 0.11 98.96 61.7 103.6 37.4 45.2 285.1 52.1 168.7
MDAP-257-70.1 75.81 0.147 12.19 1.70 0.056 0.08 0.33 4.18 4.42 0.014 0.19 98.92 54.8 84.4 39.8 50.3 267.3 49.0 188.4
MDAP-257-134.4 76.62 0.130 11.79 1.51 0.053 BD 0.24 4.10 4.33 0.000 0.20 98.76 55.2 92.6 36.5 41.3 240.5 45.8 183.6
MDAP-257-139.5 76.59 0.131 11.79 1.50 0.051 BD 0.24 4.09 4.39 0.000 0.14 98.78 62.7 96.9 33.9 37.4 232.6 47.7 96.5
MDAP-257-144.0 76.80 0.118 11.85 1.44 0.050 BD 0.23 4.04 4.34 0.011 0.19 98.89 55.2 92.8 32.6 35.7 234.6 35.3 183.9
MDAP-273-42.0 70.92 0.357 14.20 2.81 0.095 0.35 1.08 4.87 4.39 0.080 0.40 99.15 77.3 83.2 140.0 44.7 392.9 29.7 571.5
MDAP-273-42.4 74.89 0.157 12.69 1.80 0.055 0.09 0.36 4.31 4.59 0.015 0.25 98.96 51.1 96.6 31.4 48.7 278.4 43.2 173.6
MDAP-273-49.8 74.87 0.156 12.69 1.81 0.065 0.10 0.35 4.37 4.66 0.017 0.24 99.09 70.1 104.7 42.5 37.8 274.2 50.4 144.5
MDAP-273-49.9 74.58 0.163 12.98 1.88 0.055 0.14 0.38 3.99 4.40 0.018 0.70 98.59 64.6 95.0 49.7 39.9 240.6 40.1 182.7
MDAP-273-82.1 75.66 0.152 12.51 1.74 0.057 0.09 0.34 4.10 4.43 0.016 0.40 99.10 68.2 94.3 46.1 37.5 256.1 54.9 217.0

Appendix A
. Whole R
ock Geochem
istry
55
Table A-2 Continued. Major and Trace Element Geochemistry of Bandelier Tuff
Sample Major Elements (wt %)† Trace Elements (ppm)
Number* SiO2 TiO2 Al2O3 Fe2O3T MnO MgO CaO Na2O K2O P2O5 LOI Total Zn Rb Sr Y Zr Nb Ba
MDAP-273-84.2 76.33 0.137 12.16 1.66 0.055 0.08 0.26 4.00 4.36 0.014 0.38 99.05 59.2 94.0 39.0 40.3 236.0 41.3 144.6
MDAP-273-96.7 75.86 0.135 12.09 1.59 0.058 BD 0.22 4.20 4.42 0.015 0.17 98.58 95.7 101.0 37.1 41.6 248.0 45.8 135.1
MDAP-273-117.0 76.40 0.121 12.04 1.50 0.054 BD 0.23 4.11 4.37 0.010 0.14 98.84 51.4 94.5 28.8 28.3 233.4 45.8 154.8
*Abbreviations as follows: CDV, Cañon de Valle; MDAP, Material Disposal Area P.†Analytical uncertainties are available on request from the authors. V, Cr, and Ni concentrations are below detection limits and therefore not reported. Abbreviations: LOI, loss onignition; BD, below detection limits.

We performed a detailed fracture analysis of therestored MDA P site [~ 0.3 km2 (0.1 mi2)], takingadvantage of nearly complete (88%) exposure. Welocated and measured 454 fractures and faultsalong eight traverses covering 576 linear meters(1,891 linear ft) of exposure (Fig. 4; Table B-1).The longest individual traverse was 134 m (440 ft).Data collected for each fracture are as follows: dis-tance along traverse, strike, dip, trace length, aper-ture, and characteristics of the fracture terminationsand the material filling the fracture. End points oftraverses were located at grid points with an 18-m(60-ft) spacing surveyed by the LANL ER Project.Five traverses were oriented roughly east-west.Three were oriented approximately north-south.Distance along each traverse was measured with atape stretched between surveyed grid points.Fracture strike and dip were measured to an accu-racy of ± 2° with a Brunton compass. Aperture offractures was measured perpendicular to fracturefaces. In addition, fractures were mapped at ascale of 1:360 on a topographic base with 2-ft con-tours derived from the LANL ER Project 1991DEM. The fracture map was then digitized, geo-referenced, and imported into ArcGIS (© ESRI).Intersections of fractures and traverse lines werecalculated in ArcGIS.
With the fracture data, we performed a geometricanalysis, identifying preferred orientations in thedirectional data and spatial variation in aperture.Using the computer program Spheristat(© Pangaea Scientific), we determined preferredorientations using a Gaussian counting routine(Robin and Jowett 1986) that allows determinationof the principal directions of the strain ellipse with2σ uncertainties (Fig. 11). Point density is esti-mated by counting the number of data points(poles to fracture planes) within a certain angulardistance of the particular direction at which thepoint density is being estimated. We used aGaussian counting function in which counting isweighted according to angular distance from thecounting station. Specifically, we used the Fisher
function, w � ek(cosθ � 1), where θ is the angulardistance and k is the kurtosis. The value of kdetermines the rate at which the weighting func-tion decreases with angular distance. We chose a kvalue that produces a result equivalent to theStarkey method, which adjusts the size of thecounting circle according to sample size, resultingin statistically significant density estimates(Starkey 1977).
In addition to making graphical plots of contoureddensity distributions, which demonstrate visuallythe clustering of directions, we also calculated prin-cipal directions (eigenvectors), which show theaverage clustering of the whole sample, and the95% cones of confidence for each of the principaldirections (Fig. 11; Table B-2, page 76). The differ-ence between the point density distribution and theprincipal directions is similar to the differencebetween the mode (most frequent) and the mean(overall average). The smallest eigenvector pointsin the direction of the normal to the best-fittingplane through the set of poles to fracture planes.The largest eigenvector is in the direction of the sta-tistically greatest clustering. Quantitative compari-son can be made of eigenvectors and uncertaintiesfor different data sets, whereas only graphical com-parison can be made of contoured point densities.
As a further measure of preferred orientation, weplotted Rose diagrams of fracture strikes in 10°classes and calculated mean strikes with 95% con-fidence intervals (Fig. 12). Rose diagrams can becompared directly to the results of fracture analy-ses in other parts of the Laboratory (e.g., Wohletz1995; Vaniman and Chipera 1995).
We also applied a number of statistical tests thatanalyze whether a sample might have been takenfrom a uniform (random) population of directions.Due to the abundance of cooling joints in our mea-sured fracture data, there is a tendency for girdledistributions. Therefore, we used the Mardia testand the Woodcock/Maylor test (Mardia 1972;
Geology of the Western Part of Los Alamos National Laboratory
56
APPENDIX B. STRUCTURAL ANALYSIS

Woodcock 1977), avoiding uniformity tests that arenot reliable for girdle data.
We calculated mean fracture density at MDA P foreach traverse but did not perform running aver-ages of fracture density as done by Wohletz(1995). The short length of the traverses andsmall areas of colluvial cover (despite 88% expo-sure) resulted in spurious values of low density atthe ends of each traverse as well as within andadjacent to areas of cover.
Finally, we investigated changes in aperture acrossMDA P by frequency distribution analysis. Wefirst explored trends in aperture size by countingthe number of fractures of a certain aperture(Fig. 13). We then plotted aperture versus distancealong traverse to investigate variation amongstunits of the Bandelier Tuff and spatial variationsfrom east to west (Fig. 14).
Appendix B. Structural Analysis
57

Geology of the Western Part of Los Alamos National Laboratory
58
Table B-1. MDA P Fracture Data (notes on page 74)
Traverse 1, N78E Trend, 440' Total Length Start Grid Point 421*: 1764430, 1616108
End Grid Point 407+20': not surveyed
Distance Trace Termi-along Coordinates‡ Bed- Aper- Frac- length§ Total nation&
Fracture traverse Northing Easting rock ture ture (ft) length Type:Number† (ft) (ft) (ft) unit Strike# Dip (mm) filling¥ S N (ft) S N
1-1 3.0 1764430 1616108 4l 7 73 1 C 1.3 8.6 9.9 Te Sp
1-2 4.5 1764429 1616106 4l 343 43 1 C/R 1.1 4.1 5.2 Tr Tr
1-3 9.5 1764428 1616101 4l 352 69 1 C/R 1.2 5.3 6.5 Tr C
1-4 13.1 1764427 1616097 4l 313 80 10 C/R 10.7 38.0 48.7 Sp C
1-5 16.4 1764427 1616095 4l 202 48 > 10 C/R/OX 4.7 4.1 8.8 Tr Tr
1-6 22.1 1764425 1616089 4l 204 63 10 C/R 8.8 5.2 14.0 Tr Tr
1-7 36.3 1764421 1616074 4l 323 60 3 C/R 7.8 2.7 10.5 C Tr
1-8 40.6 1764420 1616071 4l 216 79 5 C/R 8.3 26.6 34.9 Sp Tr
1-9 44.7 1764419 1616068 4l 348 80 1 C/R 2.4 0.55 3.0 Tr Tr
47' to 50' Covered
1-10 51.2 1764418 1616062 4l 100 63 2 C/R/OX 2 4.4 6.4 C C
1-11 53.1 1764417 1616059 4l 202 74 2 C/R 3.2 1.0 4.2 Tr Tr
1-12 56.6 1764416 1616056 4l 22 78 2 C/R 4.6 9.4 14.0 C Tr
1-13 64.9 1764414 1616048 4l 150 58 3 C/R 4.7 2.6 7.3 C Tr
1-14 68.9 1764413 1616044 4l 28 76 2 C 1.0 6.0 7.0 Tr C
1-15 69.9 1764413 1616043 4l 303 75 5 C 5.4 4.9 10.3 C Tr
1-16 72.5 1764412 1616040 4l 349 90 2 C 1.8 2.4 4.2 Tr Tr
1-17 73.5 1764411 1616038 4l 338 90 2–4 C 1.8 2.4 4.2 Tr Tr
1-18 77.5 1764411 1616036 4l 345 56 2 C 2.7 3.1 5.8 Tr Tr
22.3' to 34.5' Covered
1-19 85.7 1764409 1616028 4l 23 50 2–3 C 0.6 5.7 6.3 C Tr
1-20 91.8 1764407 1616023 4l 16 43 5 C/R 0.2 4.2 4.4 Tr Tr
1-21 91.9 1764407 1616022 4l 131 84 4 C/R 0.0 4.6 4.6 C Tr
34.6' to 36.8' Covered
1-22 98.6 1764405 1616015 4l 140 53 1 C 3.2 3.3 6.5 Tr C
1-23 103.5 1764404 1616010 4l 332 85 10 F/C/B 5.8 3.8 9.6 C Tr
1-24 104.1 1764404 1616010 4l 174 83 5 C/R 0.0 3.6 3.6 C Tr
44.4' to 51.7' Covered
1-25 111.7 1764402 1616003 4l 300 80 2 C 0.0 1.5 1.5 Tr Te
1-26 113.9 1764401 1616001 4l 173 69 3 C/R 4.4 5.1 9.5 C Tr
53.9' to 56.5' Covered and likely brecciated
1-27 116.5 1764401 1615998 4l 334 88 10 F/B 7.0 4.5 11.5 C Tr
1-28 128.4 1764398 1615987 4l 51 90 1 C 6.2 7.3 13.5 Tr C
1-29 130.8 1764397 1615985 4l 322 90 1 C 1.3 10.7 12.0 Tr Tr
1-30 130.9 1764397 1615984 4l 210 86 1 C 3.5 3.0 6.5 Tr C

Table B-1 Continued. MDA P Fracture Data (notes on page 74)
Traverse 1 Continued
Distance Trace Termi-along Coordinates‡ Bed- Aper- Frac- length§ Total nation&
Fracture traverse Northing Easting rock ture ture (ft) length Type:Number† (ft) (ft) (ft) unit Strike# Dip (mm) filling¥ S N (ft) S N
1-31 135.7 1764396 1615979 4l 149 77 10 F/C/R 0.6 4.4 5.0 Tr Tr
1-32 138.0 1764395 1615978 4l 80 90 3 C 2.7 0.5 3.2 Tr Tr
1-33 138.8 1764395 1615977 4l 173 88 5 C 3.8 4.1 7.9 Tr Tr
1-34 170.1 1764387 1615945 4l 59 76 1 C 0.0 4.8 4.8 Tr Tr
1-35 170.4 1764386 1615945 4l 163 83 1 B/C/F 4.8 24.3 29.1 Tr Sp
1-36 172.0 1764386 1615944 4l 162 86 2 B/C 3.8 15.2 19.0 C Tr
1-37 178.6 1764385 1615939 4l 6 70 5 C/B/F 4.9 0.9 5.8 Tr Tr
5' to 12.6' Covered
1-38 193.3 1764381 1615925 4l 199 63 3 C/R 3.3 3.4 6.7 C Tr
14.2' to 18.0' Covered
1-39 205.8 1764378 1615912 4l 8 90 5 C 2.0 1.1 3.1 Tr Tr
1-40 207.3 1764379 1615919 4l NA 82 10 C 2.8 5.4 8.2 Sp Tr
34.3' to 41.3' Covered
1-41 224.9 1764373 1615894 4l 132 88 3 C 0.8 2.4 3.2 Tr Tr
1-42 226.5 1764372 1615892 4l 187 87 2 C/F 26.0 3.8 29.8 C Tr
1-43 228.0 1764372 1615891 4l 97 78 15 C 1.5 4.2 5.7 Tr Tr
1-44 234.8 1764370 1615884 4l 4 90 4 F/C 7.8 0.9 8.7 Te Tr
1-45 237.3 1764370 1615882 4l 359 90 1 C 14.2 2.55 16.8 Tr Tr
1-46 243.3 1615876 1764368 4l 2 72 2 C 5.5 2.6 8.1 Tr Sp
1-47 254.2 1615866 1764365 4l 133 63 1 C/R 1.9 3.0 4.9 Tr Tr
1-48 258.3 1615863 1764364 4l 10 80 1 C/R 3.6 2.5 6.1 Tr C
1-49 258.5 1615861 1764364 4l 175 64 2 C/R 1.8 2.0 3.8 Tr C
1-50 264.3 1615857 1764363 4l 19 60 1 C/R 1.3 3.8 5.1 T Tr
1-51 266.2 1615854 1764362 4l 170 79 1 C/R 1.8 4.2 6.0 Tr Tr
1-52 266.8 1615853 1764362 4l 128 70 1 OX/R 0.7 3.3 4.0 Tr Tr
1-53 269.4 1615851 1764361 4l 339 90 50 B/C 0.7 2.3 3.0 Sp Tr
1-54 270.6 1615850 1764361 4l 175 71 1 C 0.4 2.5 2.9 Tr Tr
1-55 271.1 1615849 1764361 4l 10 76 1 C 0.8 1.3 2.1 Tr Tr
1-56 281.2 1615840 1764358 4l 158 76 1 C 1.9 1.8 3.7 Tr Tr
1-57 282.6 1615838 1764358 4l 138 65 10 C/F 22.4 0.2 22.6 Tr Tr
1-58 283.0 1615838 1764358 4l 29 75 22 F/C/B 6.5 9.2 15.7 Tr Tr
1-59 288.0 1615833 1764356 4l 115 80 2 C 3.4 3.2 6.6 Tr Tr
1-60 291.6 1615829 1764355 4l 125 70 4 C 7.2 3.1 10.3 Sp C
1-61 293.8 1615826 1764355 4l 160 82 1 C 3.8 1.9 5.7 Tr Tr
1-62 302.3 1615818 1764353 4l 332 78 2 C/R 1.2 0.9 2.1 Tr Tr
59
Appendix B. Structural Analysis

Table B-1 Continued. MDA P Fracture Data (notes on page 74)
Traverse 1 Continued
Distance Trace Termi-along Coordinates‡ Bed- Aper- Frac- length§ Total nation&
Fracture traverse Northing Easting rock ture ture (ft) length Type:Number† (ft) (ft) (ft) unit Strike# Dip (mm) filling¥ S N (ft) S N
3.1' to 9.4' Covered
1-63 312.6 1764350 1615807 4l 240 69 2 C 10.9 1.6 12.5 Tr C
1-64 314.1 1764350 1615808 4l 170 67 1 C/B 0.9 9.9 10.8 Tr Tr
1-65 324.6 1764347 1615798 4l 174 71 1 C/R 11.9 6.7 18.6 Sp Tr
1-66 325.3 1764347 1615797 4l 345 90 1 C 14.0 6.4 20.4 Sp Tr
1-67 334.4 1764344 1615788 4 125 85 1 C 16.7 3.4 20.1 Tr Tr
1-68 339.6 1764343 1615783 4l 20 90 12 C/B 49.0 11.7 60.7 Sp Sp
1-69 340.5 1764343 1615782 4l 145 8 2 C 0.7 14.0 14.7 Tr Tr
1-70 352.8 1764340 1615770 4 135 77 1 C 10.4 15.3 25.7 Tr Sp
1-71 355.6 1764339 1615767 4l 121 72 6 C 7.0 5.9 12.9 Tr C
1-72 361.7 1764337 1615762 4l 150 89 1 C 4.1 4.5 8.6 Tr Tr
1-73 363.9 1764337 1615760 4l 187 83 4 C 7.4 1.6 9.0 Tr Te
1-74 368.2 1764336 1615755 4l 143 74 1 C/R 4.5 1.3 5.8 C Te
1-75 373.5 1764334 1615751 4l 165 72 1 C 13.0 4.7 17.7 C Sp
1-76 382.9 1764332 1615741 4l 341 74 1 C 5.5 1.0 6.5 Sp Tr
1-77 384.2 1764332 1615740 4l 15 90 22 C/R/F 32.7 16.1 48.8 Tr Tr
1-78 387.0 1764331 1615737 4l 297 90 1 C/R 2.5 7.0 9.5 Tr Tr
1-79 397.0 1764328 1615728 4l 20 78 4 C/R 0.6 6.0 6.6 Tr Tr
1-80 397.8 1764328 1615727 4l 5 83 6 C 0.3 3.5 3.8 Tr Tr
1-81 398.2 1764328 1615727 4l 292 90 8 C/F 14.0 2.0 16.0 Tr Tr
1-82 402.1 1764327 1615723 4l 54 90 8 C/R 0.2 12.0 12.2 Tr C
1-83 402.4 1764327 1615721 4l 155 80 2 C/R 3.2 11.6 14.8 Tr C
1-84 406.8 1764326 1615718 4l 132 67 1 R 3.0 3.3 6.3 Tr Tr
1-85 413.0 1764324 1615712 4l 190 71 1 C 1.5 8.7 10.2 Tr C
1-86 414.5 1764324 1615711 4l 309 84 4 C 4.7 3.5 8.2 Tr Tr
1-87 418.7 1764323 1615706 4l 348 70 2 C 5.9 0.7 6.6 Tr Tr
1-88 422.9 1764322 1615703 4l 25 72 4 C/F 3.1 2.9 6.0 Sp Tr
1-89 433.0 1764319 1615693 4l 322 90 16 C/R 3.7 11.7 15.4 Tr Tr
1-90 437.3 1764318 1615688 4l 310 84 1 C 15.5 2.7 18.2 Tr C
Aperture (mm): mean: 4 Trace length (ft): mean: 11.0
max: 50 max: 60.7
min: 1 min: 1.5
sum: 383
Cumulative extension: 0.4 m Fracture density: 21 fractures/100 ft
Geology of the Western Part of Los Alamos National Laboratory
60
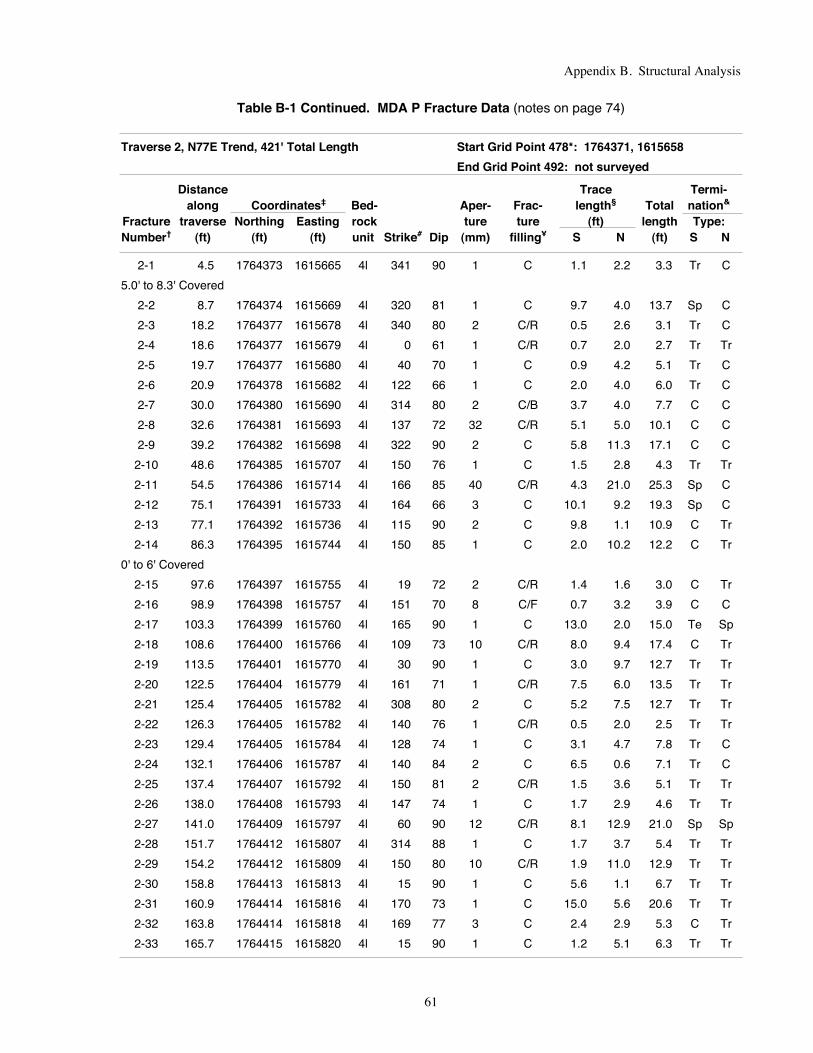
Table B-1 Continued. MDA P Fracture Data (notes on page 74)
Traverse 2, N77E Trend, 421' Total Length Start Grid Point 478*: 1764371, 1615658
End Grid Point 492: not surveyed
Distance Trace Termi-along Coordinates‡ Bed- Aper- Frac- length§ Total nation&
Fracture traverse Northing Easting rock ture ture (ft) length Type:Number† (ft) (ft) (ft) unit Strike# Dip (mm) filling¥ S N (ft) S N
2-1 4.5 1764373 1615665 4l 341 90 1 C 1.1 2.2 3.3 Tr C
5.0' to 8.3' Covered
2-2 8.7 1764374 1615669 4l 320 81 1 C 9.7 4.0 13.7 Sp C
2-3 18.2 1764377 1615678 4l 340 80 2 C/R 0.5 2.6 3.1 Tr C
2-4 18.6 1764377 1615679 4l 0 61 1 C/R 0.7 2.0 2.7 Tr Tr
2-5 19.7 1764377 1615680 4l 40 70 1 C 0.9 4.2 5.1 Tr C
2-6 20.9 1764378 1615682 4l 122 66 1 C 2.0 4.0 6.0 Tr C
2-7 30.0 1764380 1615690 4l 314 80 2 C/B 3.7 4.0 7.7 C C
2-8 32.6 1764381 1615693 4l 137 72 32 C/R 5.1 5.0 10.1 C C
2-9 39.2 1764382 1615698 4l 322 90 2 C 5.8 11.3 17.1 C C
2-10 48.6 1764385 1615707 4l 150 76 1 C 1.5 2.8 4.3 Tr Tr
2-11 54.5 1764386 1615714 4l 166 85 40 C/R 4.3 21.0 25.3 Sp C
2-12 75.1 1764391 1615733 4l 164 66 3 C 10.1 9.2 19.3 Sp C
2-13 77.1 1764392 1615736 4l 115 90 2 C 9.8 1.1 10.9 C Tr
2-14 86.3 1764395 1615744 4l 150 85 1 C 2.0 10.2 12.2 C Tr
0' to 6' Covered
2-15 97.6 1764397 1615755 4l 19 72 2 C/R 1.4 1.6 3.0 C Tr
2-16 98.9 1764398 1615757 4l 151 70 8 C/F 0.7 3.2 3.9 C C
2-17 103.3 1764399 1615760 4l 165 90 1 C 13.0 2.0 15.0 Te Sp
2-18 108.6 1764400 1615766 4l 109 73 10 C/R 8.0 9.4 17.4 C Tr
2-19 113.5 1764401 1615770 4l 30 90 1 C 3.0 9.7 12.7 Tr Tr
2-20 122.5 1764404 1615779 4l 161 71 1 C/R 7.5 6.0 13.5 Tr Tr
2-21 125.4 1764405 1615782 4l 308 80 2 C 5.2 7.5 12.7 Tr Tr
2-22 126.3 1764405 1615782 4l 140 76 1 C/R 0.5 2.0 2.5 Tr Tr
2-23 129.4 1764405 1615784 4l 128 74 1 C 3.1 4.7 7.8 Tr C
2-24 132.1 1764406 1615787 4l 140 84 2 C 6.5 0.6 7.1 Tr C
2-25 137.4 1764407 1615792 4l 150 81 2 C/R 1.5 3.6 5.1 Tr Tr
2-26 138.0 1764408 1615793 4l 147 74 1 C 1.7 2.9 4.6 Tr Tr
2-27 141.0 1764409 1615797 4l 60 90 12 C/R 8.1 12.9 21.0 Sp Sp
2-28 151.7 1764412 1615807 4l 314 88 1 C 1.7 3.7 5.4 Tr Tr
2-29 154.2 1764412 1615809 4l 150 80 10 C/R 1.9 11.0 12.9 Tr Tr
2-30 158.8 1764413 1615813 4l 15 90 1 C 5.6 1.1 6.7 Tr Tr
2-31 160.9 1764414 1615816 4l 170 73 1 C 15.0 5.6 20.6 Tr Tr
2-32 163.8 1764414 1615818 4l 169 77 3 C 2.4 2.9 5.3 C Tr
2-33 165.7 1764415 1615820 4l 15 90 1 C 1.2 5.1 6.3 Tr Tr
61
Appendix B. Structural Analysis

Geology of the Western Part of Los Alamos National Laboratory
62
Table B-1 Continued. MDA P Fracture Data (notes on page 74)
Traverse 2 Continued
Distance Trace Termi-along Coordinates‡ Bed- Aper- Frac- length§ Total nation&
Fracture traverse Northing Easting rock ture ture (ft) length Type:Number† (ft) (ft) (ft) unit Strike# Dip (mm) filling¥ S N (ft) S N
2-34 168.8 1764416 1615823 4l 178 83 1 C 3.3 2.9 6.2 C Sp
2-35 172.2 1764417 1615828 4l 276 85 8 C/F? 4.8 3.5 8.3 Tr Tr
2-36 176.7 1764418 1615831 4l 339 90 10 C 0.3 5.3 5.6 Tr Tr
2-37 176.9 1764418 1615832 4l 155 82 10 C 5.6 6.0 11.6 Tr C
2-38 181.1 1764419 1615835 4l 170 74 1 C 2.3 1.1 3.4 Tr Tr
2-39 183.7 1764420 1615839 4l 270 90 1 C 0.8 3.7 4.5 Tr C
2-40 184.2 1764420 1615839 4l 133 76 1 C 1.8 7.0 8.8 Tr Tr
2-41 187.6 1764421 1615841 4l 25 90 2 C 2.4 6.3 8.7 Tr C
98.3' to 117.4' Covered
2-42 209.7 1764426 1615863 4l 171 61 NA NA 5.2 1.2 6.4 C C
2-43 214.8 1764428 1615868 4l 0 74 1 C 11.3 5.7 17.0 Tr Tr
2-44 218.5 1764429 1615871 4l 176 76 1 C 0.9 4.3 5.2 Sp Tr
2-45 221.3 1764430 1615874 4l 305 63 1 C 0.8 7.5 8.3 Tr C
2-46 221.5 1764430 1615875 4l 25 44 1 C 0.8 1.7 2.5 Tr C
2-47 222.8 1764430 1615876 4l 175 40 1 C 0.9 2.6 3.5 Tr C
2-48 226.2 1764431 1615879 4l 336 90 4 C 8.0 11.3 19.3 C Te
2-49 227.2 1764431 1615879 4l 234 81 10 C 1.4 15.0 16.4 Tr Tr
2-50 229.6 1764432 1615882 4l 20 69 2 C 3.6 2.0 5.6 Tr Tr
2-51 239.7 1764434 1615891 4l 172 86 1 C 2.9 2.2 5.1 Tr Te
2-52 240.2 1764434 1615892 4l 169 75 8 C/R 9.8 4.6 14.4 C Sp
2-53 248.3 1764437 1615902 4l 286 77 2 C 2.0 7.5 9.5 Tr Tr
2-54 250.4 1764437 1615902 4l 5 77 1 C 1.2 2.5 3.7 Tr Tr
2-55 254.0 1764438 1615907 4l 290 90 10 C 2.2 15.4 17.6 Tr Tr
2-56 257.3 1764439 1615908 4l 230 71 10 C 7.0 6.7 13.7 Tr Te
2-57 281.8 1764445 1615932 4l 11 90 1 C 13.0 1.6 14.6 C Tr
2-58 284.6 1764446 1615935 4l 178 71 1 C 3.0 0.5 3.5 Te Tr
2-59 285.8 1764447 1615937 4l 290 70 1 C 6.3 3.7 10.0 Sp Tr
2-60 295.3 1764449 1615945 4l 349 43 1 C 4.2 2.4 6.6 Tr C
2-61 309.2 1764451 1615955 4l 57 50 2 Ca 3.3 3.0 6.3 Te Tr
2-62 313.0 1764453 1615963 4l 303 30 2 C/R 0.7 2.6 3.3 Tr Tr
2-63 315.1 1764454 1615965 4l 325 50 2 C/R 6.0 4.8 10.8 Tr Tr
2-64 312.0 1764453 1615960 4l 19 90 1 Ca/R 9.2 7.4 16.6 Tr Tr
2-65 317.8 1764455 1615967 4l 323 50 2 C/R 4.6 6.6 11.2 Tr Tr
2-66 323.3 1764456 1615971 4l 3 90 2 F/B 4.7 3.9 8.6 Tr C
2-67 325.4 1764456 1615974 4l 3 90 1 C 9.3 8.0 17.3 Tr Tr
2-68 333.6 1764459 1615983 4l 303 90 2 C/R 0.6 6.5 7.1 Tr Tr

Appendix B. Structural Analysis
63
Table B-1 Continued. MDA P Fracture Data (notes on page 74)
Traverse 2 Continued
Distance Trace Termi-along Coordinates‡ Bed- Aper- Frac- length§ Total nation&
Fracture traverse Northing Easting rock ture ture (ft) length Type:Number† (ft) (ft) (ft) unit Strike# Dip (mm) filling¥ S N (ft) S N
2-69 338.3 1764459 1615984 4l 50 58 1 C/R 2.4 0.6 3.0 Tr Te
2-70 348.2 1764463 1615997 4l 310 63 4 F/B 10.6 4.0 14.6 C Te
2-71 356.1 1764464 1616003 4l 350 54 4 C/R 3.6 1.6 5.2 C C
59' to 60' Covered
0' to 2' Covered
2-72 366.0 1764467 1616014 4l 326 90 2 F 15.0 2.0 17.0 Tr Tr
2-73 370.9 1764468 1616018 4l 23 62 1 R 3.0 2.4 5.4 Tr Tr
2-74 371.8 1764469 1616019 4l 18 90 1 R 3.1 1.8 4.9 Tr Tr
2-75 374.2 1764469 1616022 4l 300 80 2 C 3.0 20.0 23.0 Tr Sp
2-76 377.3 1764470 1616024 4l 18 90 2 C 0.4 13.3 13.7 Tr
20' to 34' Covered
40' to 41' Covered
45' to 56' Covered
2-77 418.2 1764481 1616064 4l 27 66 2 C/R 2.5 1.3 3.8 C Tr
2-78 420.6 1764481 1616066 4l 347 84 5 F/B 20.0 0.6 20.6 Tr C
Aperture (mm): mean: 4 Trace length (ft): mean: 9.7
max: 40 max: 25.3
min: 1 min: 2.5
sum: 280
Cumulative extension: 0.3 m Fracture density: 19 fractures/100 ft

Geology of the Western Part of Los Alamos National Laboratory
64
Table B-1 Continued. MDA P Fracture Data (notes on page 74)
Traverse 3, N14W Trend, 207' Total Length Start Grid Point 418*: 1764407, 1616021
End Grid Point 562: 1764523, 1615990
Distance Trace Termi-along Coordinates‡ Bed- Aper- Frac- length§ Total nation&
Fracture traverse Northing Easting rock ture ture (ft) length Type:Number† (ft) (ft) (ft) unit Strike# Dip (mm) filling¥ S N (ft) S N
3-1 4.1 1764411 1616022 4l 309 90 4 C/R/F 3.0 9.7 12.7 Te Sp
3-2 9.5 1764417 1616021 4l 44 90 2 C/R 7.0 3.6 10.6 C Tr
3-3 12.0 1764419 1616020 4l 305 65 1 C/R 2.4 2.3 4.7 Tr Tr
3-4 14.7 1764421 1616020 4l 67 90 1 C 14.3 7.1 21.4 Tr Tr
3-5 22.9 1764430 1616017 4l 284 64 1 C/R 5.3 6.5 11.8 Sp Sp
3-6 27.2 1764433 1616016 4l 148 36 2 R 2.4 1.4 3.8 C Tr
3-7 30.1 1764436 1616016 4l 116 60 2 C 3.7 3.0 6.7 Tr C
3-8 30.4 1764438 1616015 4l 11 59 1 C/R 4.8 0.6 5.4 Tr Tr
3-9 34.2 1764441 1616014 4l 15 48 1 R 1.4 4.0 5.4 Tr Tr
3-10 35.5 1764441 1616014 4l 101 80 1 C 9.3 5.2 14.5 C Sp
3-11 39.7 1764447 1616013 4l 22 53 3 C/R 2.5 4.3 6.8 Tr Tr
3-12 43.9 1764450 1616012 4l 65 90 1 C 8.1 1.9 10.0 Sp Sp
3-13 48.0 1764455 1616011 4l 355 82 1 C 2.0 3.5 5.5 Te Sp
3-14 58.0 1764463 1616008 4l 355 79 1 C 7.6 0.6 8.2 Te Sp
3-15 67.1 1764472 1616006 4l 75 32 2 R/B 5.9 7.6 13.5 Tr Tr
3-16 69.1 1764474 1616006 4l 103 60 3 R 9.1 6.2 12.3 Tr Tr
3-17 75.7 1764481 1616004 4l 225 72 1 R 3.4 6.6 10.0 C Sp
3-18 76.6 1764482 1616003 4l 266 70 1 R 1.2 4.1 5.3 Tr C
3-19 83.6 1764488 1616002 4l 296 90 1 C 5.2 1.7 6.9 C C
3-20 92.5 1764497 1615999 4l 243 79 3 C/R 4.5 9.7 14.2 Te Tr
3-21 104.4 1764508 1615996 4l 190 64 10 C/R/B 12.1 2.2 14.3 C C
3-22 114.3 1764518 1615994 3T 260 72 1 C 1.5 0.7 2.2 Tr C
86.4' to 91.2' Covered
0' to 5.8' Trench
5.8' to 13.0' Covered
3-23 133.3 1764536 1615989 3T 261 81 10 C 8.0 9.0 17.0 C C
3-24 138.6 1764541 1615988 3T 276 90 3 C 1.9 8.7 10.6 Tr C
3-25 140.8 1764547 1615986 3T 72 90 1 O 2.4 0.9 3.3 Tr Tr
3-26 141.7 1764544 1615987 3T 260 33 1 C 2.5 0.7 3.2 Tr C
3-27 143.2 1764544 1615987 3T 279 90 8 C/R 16.2 7.6 23.8 Tr Tr
3-28 148.6 1764552 1615985 3T 86 84 4 C/R 1.3 8.1 9.4 C C
3-29 162.1 1764565 1615981 3T 41 41 1 C 0.9 2.0 2.9 C C
3-30 166.0 1764567 1615980 3T 274 90 2 C 2.0 2.9 4.9 C C
3-31 167.7 1764569 1615980 3T 48 35 5 C/R 6.3 1.7 8.0 C Tr
3-32 176.2 1764578 1615978 3T 200 64 6 C 4.0 9.5 13.5 Te C
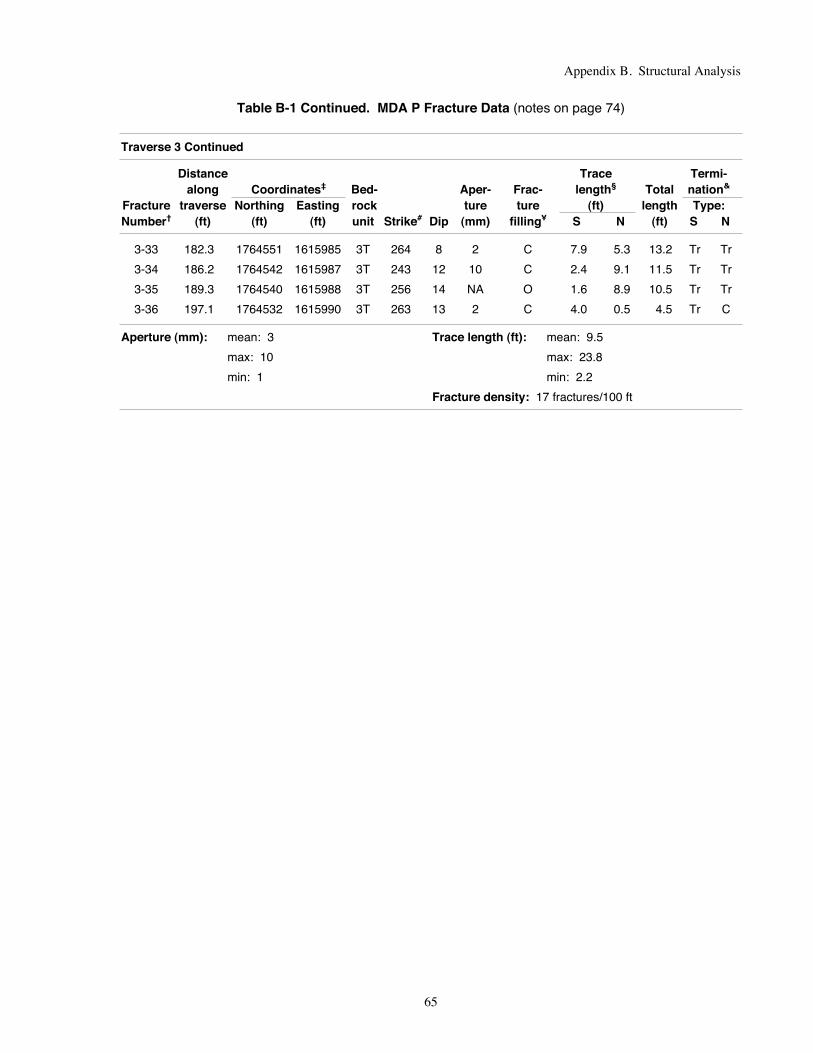
Appendix B. Structural Analysis
65
Table B-1 Continued. MDA P Fracture Data (notes on page 74)
Traverse 3 Continued
Distance Trace Termi-along Coordinates‡ Bed- Aper- Frac- length§ Total nation&
Fracture traverse Northing Easting rock ture ture (ft) length Type:Number† (ft) (ft) (ft) unit Strike# Dip (mm) filling¥ S N (ft) S N
3-33 182.3 1764551 1615985 3T 264 8 2 C 7.9 5.3 13.2 Tr Tr
3-34 186.2 1764542 1615987 3T 243 12 10 C 2.4 9.1 11.5 Tr Tr
3-35 189.3 1764540 1615988 3T 256 14 NA O 1.6 8.9 10.5 Tr Tr
3-36 197.1 1764532 1615990 3T 263 13 2 C 4.0 0.5 4.5 Tr C
Aperture (mm): mean: 3 Trace length (ft): mean: 9.5
max: 10 max: 23.8
min: 1 min: 2.2
Fracture density: 17 fractures/100 ft

Geology of the Western Part of Los Alamos National Laboratory
66
Table B-1 Continued. MDA P Fracture Data (notes on page 74)
Traverse 4, N20W Trend, 165' Total Length Start Grid Point 667+15.2'*: not surveyed
End Grid Point 595: 1764528, 1615895
Distance Trace Termi-along Coordinates‡ Bed- Aper- Frac- length§ Total nation&
Fracture traverse Northing Easting rock ture ture (ft) length Type:Number† (ft) (ft) (ft) unit Strike# Dip (mm) filling¥ S N (ft) S N
4-1 6.0 1764595 1615880 3 82 57 1 C 2.2 5.2 7.4 Tr C
4-2 9.6 1764592 1615881 3 99 37 1 C/R 2.5 7.1 9.6 C C
4-3 16.3 1764586 1615883 3 130 72 1 C 5.0 7.3 12.3 Tr Te
4-4 21.0 1764580 1615884 3 75 90 1 R 4.1 1.7 5.8 Tr Sp
4-5 21.7 1764579 1615884 3 70 63 1 C 3.2 0.5 3.7 Tr Tr
4-6 24.5 1764577 1615885 3 234 87 10 C/R 9.4 11.5 20.9 Tr C
4-7 29.0 1764570 1615887 3 168 70 20 C/R 6.2 5.1 11.3 Tr Tr
4-8 42.1 1764561 1615889 3T 138 75 10 C/R 31.5 9.3 40.8 C Tr
4-9 46.8 1764557 1615890 3T 250 39 4 C 0.3 5.1 5.4 C C
4-10 51.3 1764553 1615891 3T 271 88 10 C/B 1.1 13.4 14.5 Tr Tr
4-11 55.3 1764548 1615893 3T 72 90 25 C/R 8.0 21.0 29.0 Tr Tr
4-12 67.5 1764537 1615896 3T 255 18 1 C 6.3 10.4 16.7 C Tr
4-13 68.3 1764530 1615898 3T 85 63 1 C 1.9 4.8 6.7 Tr Te
4-14 74.7 1764535 1615896 3T 62 65 1 C 1.6 0.7 2.3 Sp C
4-15 75.7 1764522 1615900 3T 82 90 8 C/R/B 4.9 3.3 8.2 Tr C
4-16 81.3 1764526 1615899 3T 42 90 100 C/R/B 4.6 0.4 5.0 Tr C
4-17 78.5 1764526 1615899 3T 271 9 6 C 2.0 1.5 3.5 Tr C
4-18 75.2 1764528 1615898 3T 275 10 1 C 2.2 3.9 6.1 Tr C
4-19 77.2 1764526 1615899 3T 314 90 2 C 8.2 1.4 9.6 C Tr
4-20 76.8 1764527 1615899 3T 252 4 20 C 2.7 1.1 3.8 Tr Tr
4-21 77.8 1764524 1615899 3T 215 80 50 C/R/B 8.4 12.4 20.8 C C
4-22 79.7 1764522 1615900 3T 252 9 10 C/R/B 1.1 3.4 4.5 Tr Tr
4-23 81.6 1764520 1615900 3T 50 82 35 C 1.8 1.1 2.9 Tr Tr
4-24 82.6 1764521 1615900 3T 124 64 14 C 3.4 4.1 7.5 Tr Tr
10.1' to 20.3' Covered
4-25 98.9 1764505 1615905 4l 49 74 1 C 3.2 1.3 4.5 Tr C
4-26 105.1 1764500 1615906 4l 309 46 2 R 2.0 2.3 4.3 C C
4-27 124.8 1764481 1615911 4l 310 62 2 C 0.8 1.0 1.8 C Sp
4-28 126.9 1764476 1615913 4l 70 90 1 C 0.3 3.0 3.3 Tr C
4-29 149.2 1764457 1615918 4l 129 80 4 C 4.1 1.7 5.8 Tr C
4-30 153.2 1764454 1615919 4l 51 67 2 C 8.0 5.2 13.2 C Tr
4-31 163.1 1764445 1615921 4l 57 90 1 C 7.2 4.7 11.9 Sp Tr
Aperture (mm): mean: 11 Trace length (ft): mean: 9.8
max: 100 max: 40.8
min: 1 min: 1.8
Fracture density: 19 fractures/100 ft

Appendix B. Structural Analysis
67
Table B-1 Continued. MDA P Fracture Data (notes on page 74)
Traverse 5, N12W Trend, 165' Total Length Start Grid Point 662*: 1764547, 1615735
End Grid Point 482: 1764403, 1615773
Distance Trace Termi-along Coordinates‡ Bed- Aper- Frac- length§ Total nation&
Fracture traverse Northing Easting rock ture ture (ft) length Type:Number† (ft) (ft) (ft) unit Strike# Dip (mm) filling¥ S N (ft) S N
5-1 9.7 1764541 1615739 3 320 90 8 C/R 1.2 1.3 2.5 C C
5-2 12.9 1764537 1615740 3 104 56 1 C 0.4 11.7 12.1 Tr C
5-3 13.5 1764535 1615741 3 347 35 1 C/OX 0.6 9.2 9.8 C Tr
5-4 14.7 1764534 1615741 3 240 43 1 OX/R 0.6 1.2 1.8 Te Tr
5-5 22.5 1764528 1615743 3 94 84 2 C 7.8 8.3 16.1 Tr C
5-6 22.7 1764526 1615743 3 218 79 14 C/R/F 6.0 2.7 8.7 C Tr
5-7 23.7 1764526 1615743 3 139 55 1 C 3.5 0.2 3.7 Tr Tr
5-8 25.3 1764524 1615743 3 119 64 1 C/R 2.3 2.4 4.7 Te Tr
5-9 27.6 1764522 1615744 3 296 90 6 C/R/B 12.0 7.4 19.4 Tr Tr
5-10 31.2 1764518 1615745 3 29 67 1 C 3.1 6.6 9.7 Tr Tr
5-11 33.0 1764518 1615745 3 268 59 1 C 3.4 1.6 5.0 Tr Tr
5-12 35.8 1764515 1615746 3 293 16 2 R 0.5 1.7 2.2 Tr Te
5-13 36.1 1764512 1615747 3 51 76 1 R 2.0 3.3 5.3 Tr Tr
5-14 41.3 1764510 1615747 3 295 90 16 C/B/OX 2.1 1.4 3.5 Tr Tr
5-15 42.3 1764507 1615748 3 245 88 6 C/R/OX 9.0 16.0 25.0 Tr C
5-16 45.7 1764504 1615749 3 22 2 1 C 4.9 7.0 11.9 Tr Tr
5-17 56.7 1764495 1615751 3 303 90 50 C/R/B 11.0 18.0 29.0 Tr C
5-18 59.7 1764491 1615752 3 265 82 10 C/R 10.6 15.0 25.6 Tr C
5-19 64.6 1764485 1615754 3T 227 11 25 C/R 5.2 7.1 12.3 Tr C
5-20 67.8 1764481 1615755 3T 220 11 0 O 2.4 2.6 5.0 Tr Tr
5-21 71.5 1764479 1615756 3T 238 88 30 C 1.5 11.0 12.5 Tr Tr
5-22 73.9 1764477 1615756 3T 245 11 10 C 0.3 3.7 4.0 Tr Tr
5-23 75.6 1764476 1615756 3T 98 70 12 C/R 2.8 1.0 3.8 C C
5-24 76.7 1764472 1615758 3T 1 79 10 C/R/B 21.0 7.0 28.0 C C
5-25 82.8 1764469 1615758 3T 262 8 0 O 0.9 1.8 2.7 Tr Te
5-26 85.0 1764466 1615759 3T 260 83 10 C 2.0 5.5 7.5 Tr C
5-27 89.0 1764462 1615760 3T 254 7 4 C/R 4.0 5.0 9.0 Tr C
5-28 93.8 1764458 1615761 4l 311 80 10 C 6.0 3.1 9.1 C C
5-29 99.8 1764452 1615763 4l 45 69 4 C 1.0 2.1 3.1 C C
5-30 101.5 1764449 1615764 4l 25 1 1 C 0.9 1.6 2.5 C C
5-31 104.5 1764446 1615765 4l 29 81 3 C 3.6 2.9 6.5 C C
5.0' to 24.4' Covered
5-32 130.7 1764436 1615767 4l 52 30 20 R 2.4 2.1 4.5 C C
26.0' to 31.0' Covered
5-33 136.8 1764430 1615769 4l 39 45 10 R 2.1 8.5 10.6 C Tr
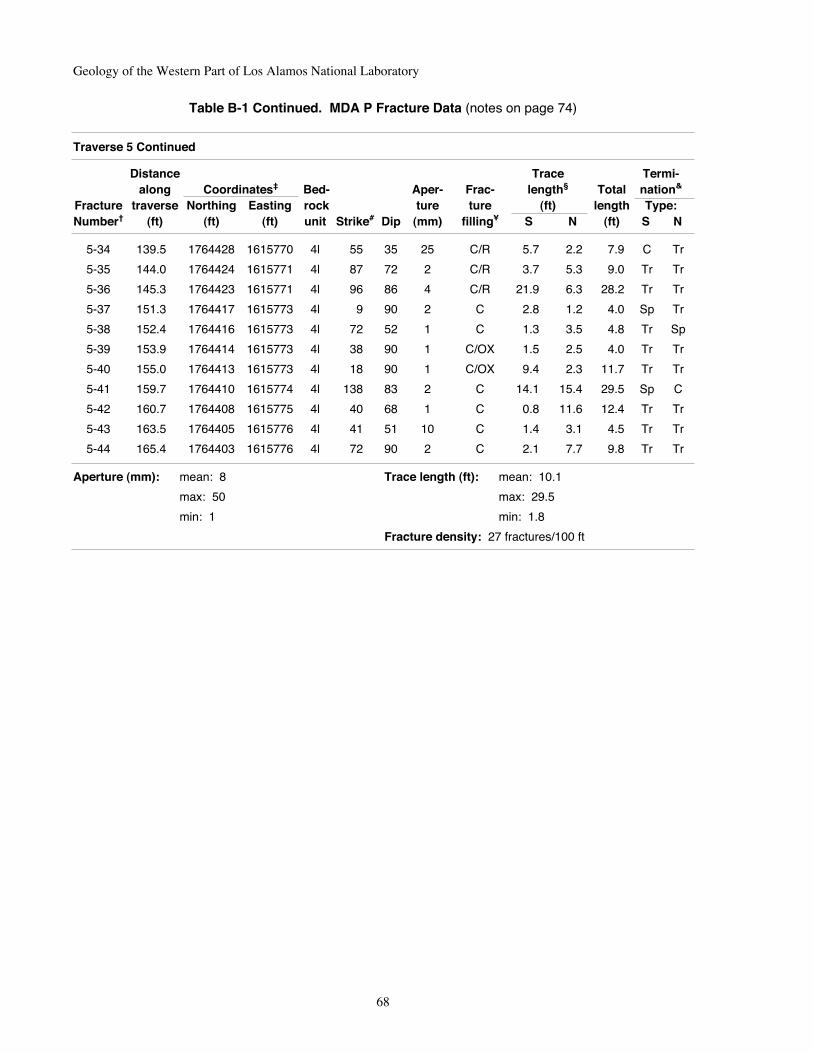
Geology of the Western Part of Los Alamos National Laboratory
68
Table B-1 Continued. MDA P Fracture Data (notes on page 74)
Traverse 5 Continued
Distance Trace Termi-along Coordinates‡ Bed- Aper- Frac- length§ Total nation&
Fracture traverse Northing Easting rock ture ture (ft) length Type:Number† (ft) (ft) (ft) unit Strike# Dip (mm) filling¥ S N (ft) S N
5-34 139.5 1764428 1615770 4l 55 35 25 C/R 5.7 2.2 7.9 C Tr
5-35 144.0 1764424 1615771 4l 87 72 2 C/R 3.7 5.3 9.0 Tr Tr
5-36 145.3 1764423 1615771 4l 96 86 4 C/R 21.9 6.3 28.2 Tr Tr
5-37 151.3 1764417 1615773 4l 9 90 2 C 2.8 1.2 4.0 Sp Tr
5-38 152.4 1764416 1615773 4l 72 52 1 C 1.3 3.5 4.8 Tr Sp
5-39 153.9 1764414 1615773 4l 38 90 1 C/OX 1.5 2.5 4.0 Tr Tr
5-40 155.0 1764413 1615773 4l 18 90 1 C/OX 9.4 2.3 11.7 Tr Tr
5-41 159.7 1764410 1615774 4l 138 83 2 C 14.1 15.4 29.5 Sp C
5-42 160.7 1764408 1615775 4l 40 68 1 C 0.8 11.6 12.4 Tr Tr
5-43 163.5 1764405 1615776 4l 41 51 10 C 1.4 3.1 4.5 Tr Tr
5-44 165.4 1764403 1615776 4l 72 90 2 C 2.1 7.7 9.8 Tr Tr
Aperture (mm): mean: 8 Trace length (ft): mean: 10.1
max: 50 max: 29.5
min: 1 min: 1.8
Fracture density: 27 fractures/100 ft
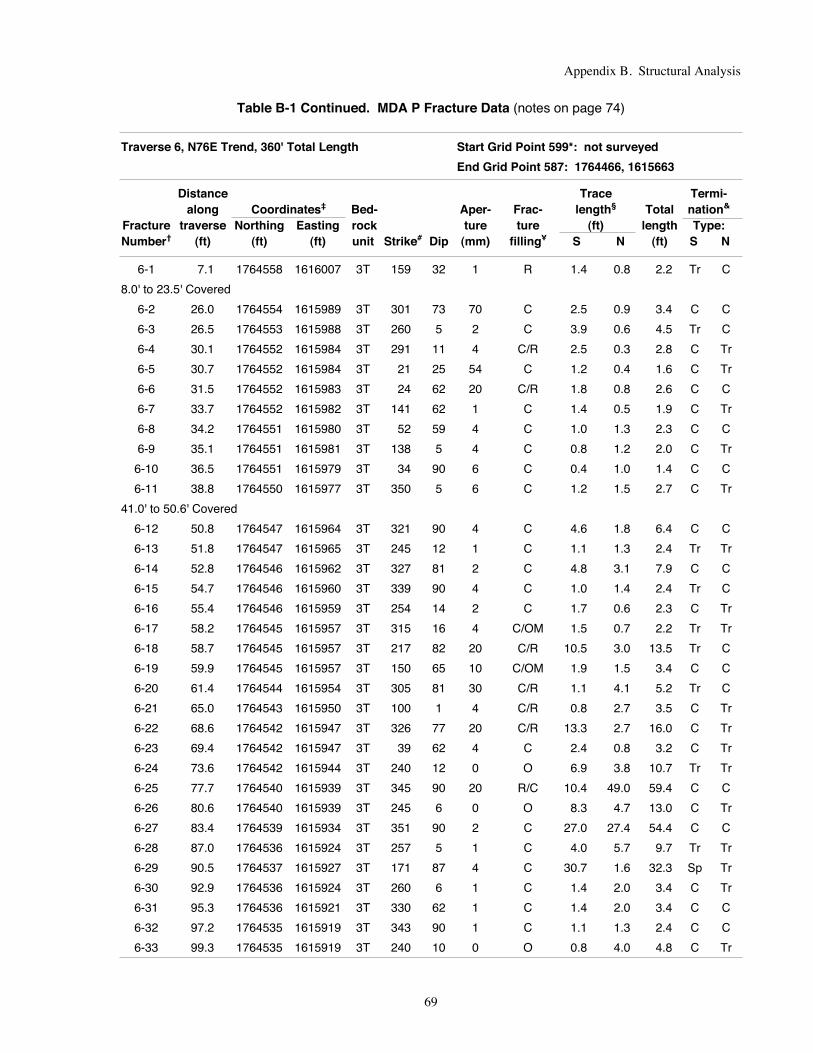
Appendix B. Structural Analysis
69
Table B-1 Continued. MDA P Fracture Data (notes on page 74)
Traverse 6, N76E Trend, 360' Total Length Start Grid Point 599*: not surveyed
End Grid Point 587: 1764466, 1615663
Distance Trace Termi-along Coordinates‡ Bed- Aper- Frac- length§ Total nation&
Fracture traverse Northing Easting rock ture ture (ft) length Type:Number† (ft) (ft) (ft) unit Strike# Dip (mm) filling¥ S N (ft) S N
6-1 7.1 1764558 1616007 3T 159 32 1 R 1.4 0.8 2.2 Tr C
8.0' to 23.5' Covered
6-2 26.0 1764554 1615989 3T 301 73 70 C 2.5 0.9 3.4 C C
6-3 26.5 1764553 1615988 3T 260 5 2 C 3.9 0.6 4.5 Tr C
6-4 30.1 1764552 1615984 3T 291 11 4 C/R 2.5 0.3 2.8 C Tr
6-5 30.7 1764552 1615984 3T 21 25 54 C 1.2 0.4 1.6 C Tr
6-6 31.5 1764552 1615983 3T 24 62 20 C/R 1.8 0.8 2.6 C C
6-7 33.7 1764552 1615982 3T 141 62 1 C 1.4 0.5 1.9 C Tr
6-8 34.2 1764551 1615980 3T 52 59 4 C 1.0 1.3 2.3 C C
6-9 35.1 1764551 1615981 3T 138 5 4 C 0.8 1.2 2.0 C Tr
6-10 36.5 1764551 1615979 3T 34 90 6 C 0.4 1.0 1.4 C C
6-11 38.8 1764550 1615977 3T 350 5 6 C 1.2 1.5 2.7 C Tr
41.0' to 50.6' Covered
6-12 50.8 1764547 1615964 3T 321 90 4 C 4.6 1.8 6.4 C C
6-13 51.8 1764547 1615965 3T 245 12 1 C 1.1 1.3 2.4 Tr Tr
6-14 52.8 1764546 1615962 3T 327 81 2 C 4.8 3.1 7.9 C C
6-15 54.7 1764546 1615960 3T 339 90 4 C 1.0 1.4 2.4 Tr C
6-16 55.4 1764546 1615959 3T 254 14 2 C 1.7 0.6 2.3 C Tr
6-17 58.2 1764545 1615957 3T 315 16 4 C/OM 1.5 0.7 2.2 Tr Tr
6-18 58.7 1764545 1615957 3T 217 82 20 C/R 10.5 3.0 13.5 Tr C
6-19 59.9 1764545 1615957 3T 150 65 10 C/OM 1.9 1.5 3.4 C C
6-20 61.4 1764544 1615954 3T 305 81 30 C/R 1.1 4.1 5.2 Tr C
6-21 65.0 1764543 1615950 3T 100 1 4 C/R 0.8 2.7 3.5 C Tr
6-22 68.6 1764542 1615947 3T 326 77 20 C/R 13.3 2.7 16.0 C Tr
6-23 69.4 1764542 1615947 3T 39 62 4 C 2.4 0.8 3.2 C Tr
6-24 73.6 1764542 1615944 3T 240 12 0 O 6.9 3.8 10.7 Tr Tr
6-25 77.7 1764540 1615939 3T 345 90 20 R/C 10.4 49.0 59.4 C C
6-26 80.6 1764540 1615939 3T 245 6 0 O 8.3 4.7 13.0 C Tr
6-27 83.4 1764539 1615934 3T 351 90 2 C 27.0 27.4 54.4 C C
6-28 87.0 1764536 1615924 3T 257 5 1 C 4.0 5.7 9.7 Tr Tr
6-29 90.5 1764537 1615927 3T 171 87 4 C 30.7 1.6 32.3 Sp Tr
6-30 92.9 1764536 1615924 3T 260 6 1 C 1.4 2.0 3.4 C Tr
6-31 95.3 1764536 1615921 3T 330 62 1 C 1.4 2.0 3.4 C C
6-32 97.2 1764535 1615919 3T 343 90 1 C 1.1 1.3 2.4 C C
6-33 99.3 1764535 1615919 3T 240 10 0 O 0.8 4.0 4.8 C Tr
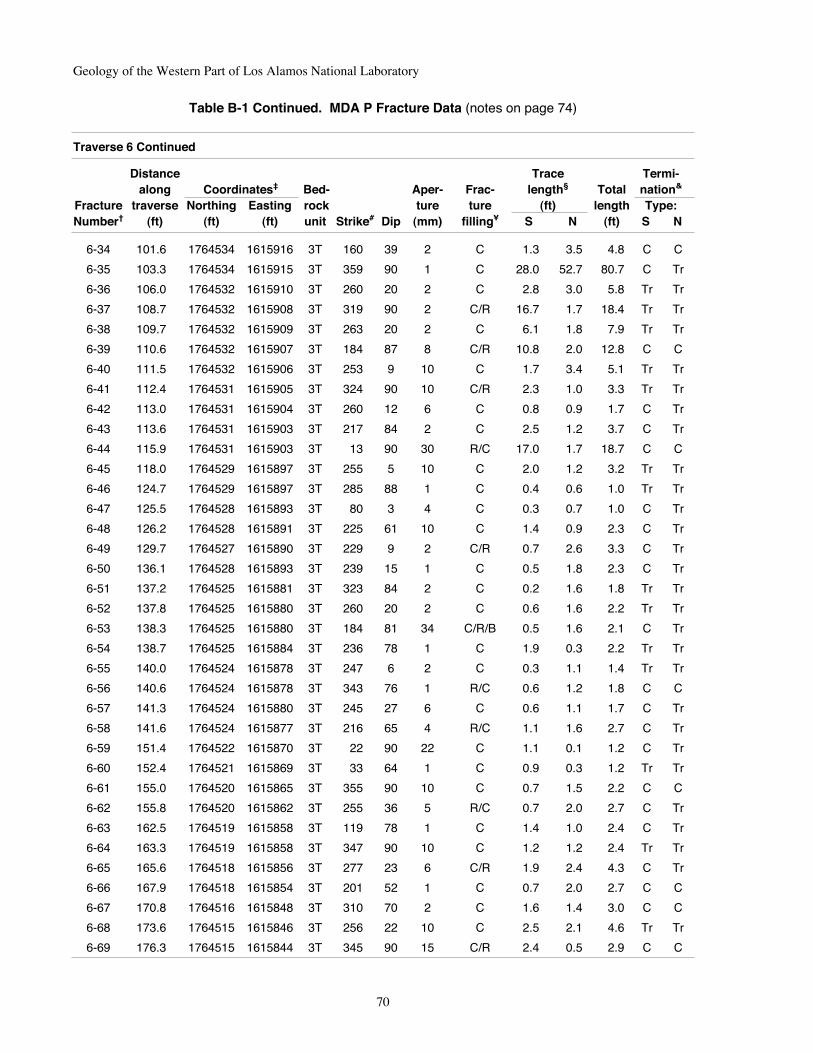
Geology of the Western Part of Los Alamos National Laboratory
70
Table B-1 Continued. MDA P Fracture Data (notes on page 74)
Traverse 6 Continued
Distance Trace Termi-along Coordinates‡ Bed- Aper- Frac- length§ Total nation&
Fracture traverse Northing Easting rock ture ture (ft) length Type:Number† (ft) (ft) (ft) unit Strike# Dip (mm) filling¥ S N (ft) S N
6-34 101.6 1764534 1615916 3T 160 39 2 C 1.3 3.5 4.8 C C
6-35 103.3 1764534 1615915 3T 359 90 1 C 28.0 52.7 80.7 C Tr
6-36 106.0 1764532 1615910 3T 260 20 2 C 2.8 3.0 5.8 Tr Tr
6-37 108.7 1764532 1615908 3T 319 90 2 C/R 16.7 1.7 18.4 Tr Tr
6-38 109.7 1764532 1615909 3T 263 20 2 C 6.1 1.8 7.9 Tr Tr
6-39 110.6 1764532 1615907 3T 184 87 8 C/R 10.8 2.0 12.8 C C
6-40 111.5 1764532 1615906 3T 253 9 10 C 1.7 3.4 5.1 Tr Tr
6-41 112.4 1764531 1615905 3T 324 90 10 C/R 2.3 1.0 3.3 Tr Tr
6-42 113.0 1764531 1615904 3T 260 12 6 C 0.8 0.9 1.7 C Tr
6-43 113.6 1764531 1615903 3T 217 84 2 C 2.5 1.2 3.7 C Tr
6-44 115.9 1764531 1615903 3T 13 90 30 R/C 17.0 1.7 18.7 C C
6-45 118.0 1764529 1615897 3T 255 5 10 C 2.0 1.2 3.2 Tr Tr
6-46 124.7 1764529 1615897 3T 285 88 1 C 0.4 0.6 1.0 Tr Tr
6-47 125.5 1764528 1615893 3T 80 3 4 C 0.3 0.7 1.0 C Tr
6-48 126.2 1764528 1615891 3T 225 61 10 C 1.4 0.9 2.3 C Tr
6-49 129.7 1764527 1615890 3T 229 9 2 C/R 0.7 2.6 3.3 C Tr
6-50 136.1 1764528 1615893 3T 239 15 1 C 0.5 1.8 2.3 C Tr
6-51 137.2 1764525 1615881 3T 323 84 2 C 0.2 1.6 1.8 Tr Tr
6-52 137.8 1764525 1615880 3T 260 20 2 C 0.6 1.6 2.2 Tr Tr
6-53 138.3 1764525 1615880 3T 184 81 34 C/R/B 0.5 1.6 2.1 C Tr
6-54 138.7 1764525 1615884 3T 236 78 1 C 1.9 0.3 2.2 Tr Tr
6-55 140.0 1764524 1615878 3T 247 6 2 C 0.3 1.1 1.4 Tr Tr
6-56 140.6 1764524 1615878 3T 343 76 1 R/C 0.6 1.2 1.8 C C
6-57 141.3 1764524 1615880 3T 245 27 6 C 0.6 1.1 1.7 C Tr
6-58 141.6 1764524 1615877 3T 216 65 4 R/C 1.1 1.6 2.7 C Tr
6-59 151.4 1764522 1615870 3T 22 90 22 C 1.1 0.1 1.2 C Tr
6-60 152.4 1764521 1615869 3T 33 64 1 C 0.9 0.3 1.2 Tr Tr
6-61 155.0 1764520 1615865 3T 355 90 10 C 0.7 1.5 2.2 C C
6-62 155.8 1764520 1615862 3T 255 36 5 R/C 0.7 2.0 2.7 C Tr
6-63 162.5 1764519 1615858 3T 119 78 1 C 1.4 1.0 2.4 C Tr
6-64 163.3 1764519 1615858 3T 347 90 10 C 1.2 1.2 2.4 Tr Tr
6-65 165.6 1764518 1615856 3T 277 23 6 C/R 1.9 2.4 4.3 C Tr
6-66 167.9 1764518 1615854 3T 201 52 1 C 0.7 2.0 2.7 C C
6-67 170.8 1764516 1615848 3T 310 70 2 C 1.6 1.4 3.0 C C
6-68 173.6 1764515 1615846 3T 256 22 10 C 2.5 2.1 4.6 Tr Tr
6-69 176.3 1764515 1615844 3T 345 90 15 C/R 2.4 0.5 2.9 C C

Appendix B. Structural Analysis
71
Table B-1 Continued. MDA P Fracture Data (notes on page 74)
Traverse 6 Continued
Distance Trace Termi-along Coordinates‡ Bed- Aper- Frac- length§ Total nation&
Fracture traverse Northing Easting rock ture ture (ft) length Type:Number† (ft) (ft) (ft) unit Strike# Dip (mm) filling¥ S N (ft) S N
6-70 178.2 1764515 1615843 3T 265 16 2 R/C 1.7 5.7 7.4 Tr Tr
6-71 185.7 1764512 1615835 3T 152 87 20 C/R 14.9 16.5 31.4 C C
6-72 186.3 1764512 1615834 3T 169 36 30 R/C 1.8 6.0 7.8 C C
6-73 190.6 1764511 1615830 3T 42 54 15 C 2.5 4.0 6.5 Tr Tr
6-74 195.2 1764510 1615826 3T 251 23 2 C/R 1.1 1.2 2.3 C Tr
6-75 196.2 1764510 1615825 3T 354 90 10 C 0.4 1.1 1.5 C Tr
17.5' to 36.0' Covered
6-76 216.4 1764509 1615823 3T 276 90 2 C 0.3 1.9 2.2 C C
6-77 223.4 1764505 1615805 3T 148 78 2 C 0.8 5.7 6.5 C C
6-78 223.6 1764504 1615804 3T 46 62 40 C 0.7 2.1 2.8 C Tr
46.4' to 55.5' Covered
6-79 237.3 1764499 1615786 3T 238 15 0 O 1.3 1.0 2.3 Tr Tr
6-80 238.5 1764499 1615784 3T 186 75 6 C 1.9 0.3 2.2 C C
6-81 241.9 1764498 1615781 3T 306 90 40 C/B/R 24.1 18.0 42.1 C C
6-82 244.3 1764498 1615780 3T 245 20 2 R/C 2.8 2.3 5.1 C Tr
6-83 246.8 1764497 1615775 3T 36 90 10 C 16.8 4.3 21.1 Tr Tr
6-84 252.6 1764495 1615771 3T 240 19 2 C 3.7 5.7 9.4 C Tr
6-85 258.3 1764494 1615765 3T 358 85 12 C/R/OM 10.7 16.8 27.5 C C
6-86 260.7 1764493 1615762 3T 233 10 10 C/R 4.0 1.5 5.5 C Tr
6-87 262.9 1764492 1615760 3T 17 90 8 R/C/OM 10.7 1.0 11.7 C Tr
6-88 266.0 1764492 1615757 3T 314 15 2 C 3.8 4.0 7.8 Tr Tr
6-89 269.0 1764491 1615754 3 355 73 40 C/R 11.5 14.6 26.1 C C
6-90 271.4 1764490 1615752 3 225 9 4 C/R 3.0 2.6 5.6 Tr Tr
6-91 273.8 1764490 1615750 3 350 38 10 B/R/C 1.1 1.0 2.1 C C
6-92 274.9 1764489 1615749 3 356 20 15 C 2.2 3.0 5.2 C C
6-93 275.8 1764489 1615747 3 210 6 2 C 2.0 1.9 3.9 C Tr
6-94 276.6 1764489 1615746 3 208 43 1 R/OM 1.8 9.8 11.6 C Tr
39.0' to 51.4' Covered
6-95 298.0 1764483 1615726 3 323 90 12 O/C 3.1 4.0 7.1 C C
6-96 300.0 1764483 1615725 3 308 90 1 O 0.7 1.5 2.2 C Tr
6-97 301.5 1764482 1615722 3 197 77 2 C 0.9 1.3 2.2 C C
6-98 303.6 1764482 1615722 3 333 90 1 C 1.1 2.0 3.1 C C
6-99 306.8 1764481 1615719 3 60 42 2 O 1.8 3.3 5.1 C Tr
6-100 310.8 1764481 1615716 3 330 82 44 O 0.8 2.2 3.0 C Tr
6-101 311.9 1764480 1615715 3 301 90 30 O 0.7 1.7 2.4 C Tr
6-102 312.4 1764480 1615714 3 302 90 34 O 1.0 1.3 2.3 C Tr

Geology of the Western Part of Los Alamos National Laboratory
72
Table B-1 Continued. MDA P Fracture Data (notes on page 74)
Traverse 6 Continued
Distance Trace Termi-along Coordinates‡ Bed- Aper- Frac- length§ Total nation&
Fracture traverse Northing Easting rock ture ture (ft) length Type:Number† (ft) (ft) (ft) unit Strike# Dip (mm) filling¥ S N (ft) S N
6-103 313.4 1764480 1615713 3 210 50 20 O 2.7 4.0 6.7 C C
6-104 319.8 1764478 1615707 3 20 84 1 C/R 1.7 1.4 3.1 C C
6-105 324.2 1764477 1615702 3 31 60 4 O 3.7 2.5 6.2 C C
6-106 326.8 1764477 1615700 3 298 90 50 O 2.0 4.0 6.0 Tr C
6-107 330.5 1764475 1615696 3 259 10 0 O 1.5 1.3 2.8 C Tr
6-108 334.4 1764474 1615692 3 338 62 2 C/R 0.9 7.3 8.2 C C
6-109 337.0 1764474 1615690 3 254 14 0 O 1.9 4.0 5.9 C Tr
6-110 345.9 1764472 1615682 3 308 90 20 C/R 3.1 2.4 5.5 Tr Tr
6-111 348.6 1764471 1615679 3 168 78 40 O 2.3 0.9 3.2 C Tr
6-112 351.9 1764470 1615676 3 16 85 2 O 1.2 0.5 1.7 C Tr
Aperture (mm): mean: 10 Trace length (ft): mean: 7.6
max: 70 max: 80.7
min: 1 min: 1.0
sum: 1097
Cumulative extension: 1.1 m Fracture density: 31 fractures/100 ft

Appendix B. Structural Analysis
73
Table B-1 Continued. MDA P Fracture Data (notes on page 74)
Traverse 7, N78E Trend, 137' Total Length Start Grid Point 670*: 1764610, 1615966
End Grid Point 666+17': not surveyed
Distance Trace Termi-along Coordinates‡ Bed- Aper- Frac- length§ Total nation&
Fracture traverse Northing Easting rock ture ture (ft) length Type:Number† (ft) (ft) (ft) unit Strike# Dip (mm) filling¥ S N (ft) S N
7-1 25.8 1764603 1615944 3 282 11 0 O 1.5 3.8 5.3 C Tr
7-2 31.4 1764602 1615939 3 288 3 0 O 1.0 3.1 4.1 Tr Tr
7-3 32.6 1764602 1615938 3 219 72 1 C/R 2.7 1.9 4.6 Tr Tr
7-4 34.1 1764601 1615937 3 355 90 10 C/R/B 6.4 7.0 13.4 Sp Tr
7-5 34.9 1764601 1615936 3 213 13 0 O 0.6 1.2 1.8 Tr Tr
7-6 35.7 1764601 1615935 3 355 90 1 C 3.3 3.5 6.8 Te Tr
7-7 37.8 1764600 1615933 3 182 83 6 C/R 5.8 4.0 9.8 Sp Sp
7-8 39.6 1764600 1615931 3 155 62 2 C 9.8 9.5 19.3 C C
7-9 41.0 1764599 1615928 3 60 90 2 C/R 5.6 1.3 6.9 Tr Tr
7-10 47.5 1764598 1615925 3 305 77 10 C/R/B 0.4 3.5 3.9 Sp C
7-11 51.4 1764597 1615921 3 350 24 1 C 2.8 3.0 5.8 Te C
7-12 53.4 1764596 1615917 3 141 48 12 C/R 4.0 9.1 13.1 C C
7-13 57.4 1764595 1615914 3 155 31 1 C 2.8 0.7 3.5 C Tr
7-14 57.7 1764595 1615914 3 170 44 6 C 3.4 5.0 8.4 C Sp
7-15 60.0 1764595 1615912 3 222 35 0 O 0.7 0.8 1.5 Tr Tr
7-16 61.2 1764594 1615910 3 161 51 20 C/R 5.8 8.6 14.4 C Tr
7-17 63.0 1764594 1615908 3 260 72 15 C/R 1.8 2.9 4.7 Tr Tr
7-18 65.9 1764593 1615906 3 174 41 2 C 2.9 3.8 6.7 Te Tr
7-19 67.1 1764593 1615904 3 315 86 15 C/R 3.2 17.1 20.3 C Tr
7-20 71.4 1764592 1615900 3 326 90 6 C/R/B 1.7 11.0 12.7 Sp C
7-21 72.1 1764591 1615899 3 250 21 10 C 1.9 5.0 6.9 Tr Tr
7-22 77.0 1764590 1615895 3 330 73 20 C/R/B 4.7 4.4 9.1 Tr Tr
7-23 80.3 1764589 1615892 3 239 56 2 C/R 0.8 1.1 1.9 Tr Tr
7-24 81.0 1764590 1615893 3 240 25 4 C/R 1.9 1.6 3.5 Tr Tr
7-25 82.9 1764589 1615889 3 318 90 6 C/R/B 16.2 1.2 17.4 C Tr
7-26 84.6 1764588 1615889 3 16 90 4 C/R 12.8 9.3 22.1 Tr Sp
7-27 87.9 1764587 1615884 3 330 90 1 C 0.5 5.9 6.4 Sp Tr
7-28 95.3 1764585 1615877 3 330 90 28 C/R 0.9 13.1 14.0 Sp C
7-29 96.4 1764585 1615875 3 148 67 1 C 6.2 6.7 12.9 Tr C
7-30 112.4 1764581 1615861 3 300 73 30 C/R/B 1.5 9.1 10.6 C C
7-31 113.3 1764581 1615860 3 355 90 60 C/R/B 2.1 1.3 3.4 C Tr
7-32 115.4 1764580 1615858 3 353 90 10 C/R 1.1 1.6 2.7 C Te
7-33 116.0 1764580 1615857 3 261 9 2 C/R 1.4 1.3 2.7 C Tr
7-34 120.6 1764579 1615854 3 178 21 1 C/R 5.8 0.7 6.5 Tr Tr
7-35 121.0 1764579 1615852 3 155 69 1 C/R 1.9 5.2 7.1 Te C

Geology of the Western Part of Los Alamos National Laboratory
74
Table B-1 Continued. MDA P Fracture Data (notes below)
Traverse 7 Continued
Distance Trace Termi-along Coordinates‡ Bed- Aper- Frac- length§ Total nation&
Fracture traverse Northing Easting rock ture ture (ft) length Type:Number† (ft) (ft) (ft) unit Strike# Dip (mm) filling¥ S N (ft) S N
7-36 122.5 1764578 1615851 3 141 58 2 C/R 0.9 0.7 1.6 Te Tr
7-37 126.0 1764577 1615847 3 297 71 20 C/R/B 2.4 11.2 13.6 Tr C
7-38 127.2 1764577 1615846 3 305 90 2 C 2.4 0.3 2.7 Tr Tr
7-39 128.5 1764577 1615846 3 65 85 2 C 5.2 0.9 6.1 Tr Sp
7-40 134.5 1764575 1615840 3 323 90 4 C 12.3 3.5 15.8 C C
7-41 135.7 1764575 1615838 3 301 90 4 C 3.9 2.3 6.2 Tr C
Aperture (mm): mean: 9 Trace length (ft): mean: 8.3
max: 60 max: 22.1
min: 1 min: 1.5
Fracture density: 30 fractures/100 ft
*Grid points surveyed by LANL ER Project; coordinates are northing and easting in State Plane Coordinate System, New Mexico Central Zone, 1983 North American Datum.
†The fracture number is the traverse number followed by the fracture number counting from the beginning of traverse.‡The northing and easting coordinates are of the intersection between the fracture and the traverse.#Fracture orientations are presented according to the right hand rule. Abrreviation: NA, not available.¥Fracture filling abbreviations: B, breccia; C, clay; Ca, cataclasite; F, foliated; O, open; OM, organic matter; OX, oxidized; R, roots; NA, not available.
§Trace lengths are measured to the south (S) and to the north (N) of the line of traverse.&Termination abbreviations: C, covered; SP, splays; Te, terminates by dying out; Tr, truncates.
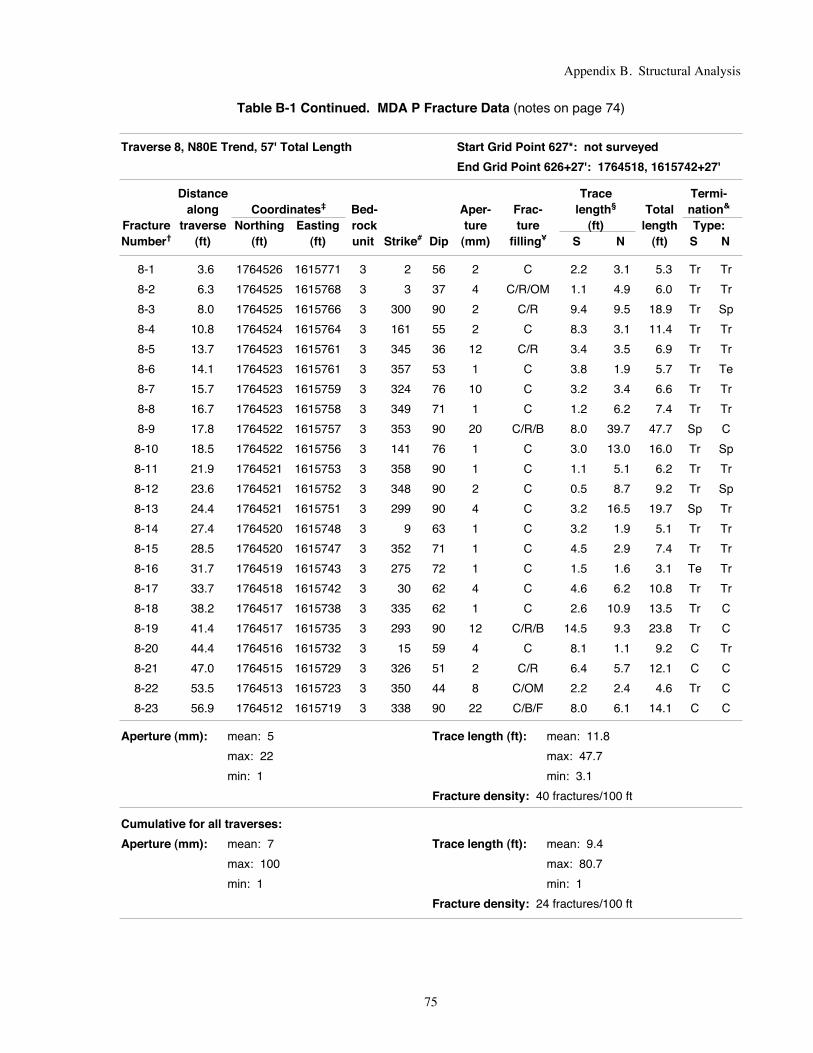
Appendix B. Structural Analysis
75
Table B-1 Continued. MDA P Fracture Data (notes on page 74)
Traverse 8, N80E Trend, 57' Total Length Start Grid Point 627*: not surveyed
End Grid Point 626+27': 1764518, 1615742+27'
Distance Trace Termi-along Coordinates‡ Bed- Aper- Frac- length§ Total nation&
Fracture traverse Northing Easting rock ture ture (ft) length Type:Number† (ft) (ft) (ft) unit Strike# Dip (mm) filling¥ S N (ft) S N
8-1 3.6 1764526 1615771 3 2 56 2 C 2.2 3.1 5.3 Tr Tr
8-2 6.3 1764525 1615768 3 3 37 4 C/R/OM 1.1 4.9 6.0 Tr Tr
8-3 8.0 1764525 1615766 3 300 90 2 C/R 9.4 9.5 18.9 Tr Sp
8-4 10.8 1764524 1615764 3 161 55 2 C 8.3 3.1 11.4 Tr Tr
8-5 13.7 1764523 1615761 3 345 36 12 C/R 3.4 3.5 6.9 Tr Tr
8-6 14.1 1764523 1615761 3 357 53 1 C 3.8 1.9 5.7 Tr Te
8-7 15.7 1764523 1615759 3 324 76 10 C 3.2 3.4 6.6 Tr Tr
8-8 16.7 1764523 1615758 3 349 71 1 C 1.2 6.2 7.4 Tr Tr
8-9 17.8 1764522 1615757 3 353 90 20 C/R/B 8.0 39.7 47.7 Sp C
8-10 18.5 1764522 1615756 3 141 76 1 C 3.0 13.0 16.0 Tr Sp
8-11 21.9 1764521 1615753 3 358 90 1 C 1.1 5.1 6.2 Tr Tr
8-12 23.6 1764521 1615752 3 348 90 2 C 0.5 8.7 9.2 Tr Sp
8-13 24.4 1764521 1615751 3 299 90 4 C 3.2 16.5 19.7 Sp Tr
8-14 27.4 1764520 1615748 3 9 63 1 C 3.2 1.9 5.1 Tr Tr
8-15 28.5 1764520 1615747 3 352 71 1 C 4.5 2.9 7.4 Tr Tr
8-16 31.7 1764519 1615743 3 275 72 1 C 1.5 1.6 3.1 Te Tr
8-17 33.7 1764518 1615742 3 30 62 4 C 4.6 6.2 10.8 Tr Tr
8-18 38.2 1764517 1615738 3 335 62 1 C 2.6 10.9 13.5 Tr C
8-19 41.4 1764517 1615735 3 293 90 12 C/R/B 14.5 9.3 23.8 Tr C
8-20 44.4 1764516 1615732 3 15 59 4 C 8.1 1.1 9.2 C Tr
8-21 47.0 1764515 1615729 3 326 51 2 C/R 6.4 5.7 12.1 C C
8-22 53.5 1764513 1615723 3 350 44 8 C/OM 2.2 2.4 4.6 Tr C
8-23 56.9 1764512 1615719 3 338 90 22 C/B/F 8.0 6.1 14.1 C C
Aperture (mm): mean: 5 Trace length (ft): mean: 11.8
max: 22 max: 47.7
min: 1 min: 3.1
Fracture density: 40 fractures/100 ft
Cumulative for all traverses:
Aperture (mm): mean: 7 Trace length (ft): mean: 9.4
max: 100 max: 80.7
min: 1 min: 1
Fracture density: 24 fractures/100 ft

Geology of the Western Part of Los Alamos National Laboratory
76
Table B-2. Eigenvectors and Uncertainties for MDA P Fracture Data
Data Eigenvector* Eigen- Maximum Minimum Average StandardSet Trend Plunge value Angle Angle Angle Orientation Deviation
All data 1 353 86 111.2 35.22 5.87 20.54 –0.42 0.2874
N = 454 2 162 4 125.1 35.22 9.17 22.19 –0.26 0.3511
3 252 1 217.8 9.25 5.78 7.52 –4.79 0.3251
Unit 4 1 161 78 24.2 8.72 4.36 6.54 –1.10 0.2755
N = 212 2 345 12 62.8 10.60 8.60 9.60 6.75 0.3020
3 255 1 125.0 10.51 4.37 7.44 0.01 0.1667
Unit 3T 1 354 18 31.6 40.69 11.52 26.11 0.02 0.3001
N = 129 2 262 6 39.5 40.74 14.35 27.54 –1.67 0.3539
3 153 71 57.9 15.06 10.86 12.96 12.39 0.4273
Unit 3 1 331 16 27.7 62.06 14.74 38.40 0.47 0.2721
N = 113 2 141 74 30.4 62.06 13.70 37.88 0.55 0.3487
3 240 3 54.9 14.87 13.80 14.33 –6.07 0.3291
*For each data set (with N data points), trends and plunges of eigenvectors are listed in that section from the smallest to largesteigenvalue (1, 2, 3). For a full explanation of eigenvector analysis, see, for example, Davis (1986) and Hext (1963).

Appendix C. Total Station Survey Data
77
Table C-1. TA-9 Trench Total Station Survey Data (notes on page 94)
Mapped Coordinates†
Contact* Northing (ft) Easting (ft) Elevation (ft) Comments‡
BTR 1766795.15 1611654.02 7571.04
BTR 1766773.81 1611691.38 7570.71
BTR 1766722.11 1611737.76 7569.21
BTR 1766643.46 1611817.41 7568.39
BTR 1766605.59 1611853.14 7567.87
BTR 1766516.14 1611939.65 7562.44
BTR 1766490.17 1611967.64 7560.04
BTR 1766470.51 1611990.49 7559.92
BTR 1766381.11 1612090.21 7555.45
BTR 1766284.09 1612198.29 7552.34
BTR 1766271.19 1612211.51 7551.43
BTR 1766229.80 1612262.10 7551.63
BTR 1766184.69 1612348.54 7551.16
BTR 1766149.45 1612418.28 7550.24
BTR 1766129.87 1612456.33 7549.20
BTR 1766122.07 1612470.06 7549.08
BTR 1766109.54 1612494.43 7549.25
BTR 1766098.11 1612517.31 7548.44
BTR 1766034.92 1612640.95 7546.73
BTR 1765978.38 1612750.07 7544.16
BTR 1765958.96 1612786.97 7543.36
BTR 1765942.91 1612817.33 7542.88
BTR 1765938.59 1612826.32 7542.02
BTR 1765915.78 1612870.38 7541.21
BTR 1765909.05 1612884.52 7540.95
BTR 1765816.26 1613068.02 7541.73
BTR 1765777.42 1613211.81 7538.68
BTR 1765769.76 1613265.71 7536.33
BTR 1765768.87 1613270.55 7536.42
BTR 1765747.31 1613399.42 7534.15
BTR 1765736.53 1613468.86 7535.11
BTR 1765732.88 1613491.74 7535.36
BTR 1765724.10 1613545.76 7534.18
BTR 1765714.64 1613605.49 7533.00
BTR 1765699.88 1613692.29 7529.54
BTR 1765680.60 1613782.60 7527.51
APPENDIX C. TOTAL STATION SURVEY DATA

Geology of the Western Part of Los Alamos National Laboratory
78
Table C-1 Continued. TA-9 Trench Total Station Survey Data (notes on page 94)
Mapped Coordinates†
Contact* Northing (ft) Easting (ft) Elevation (ft) Comments‡
BTR 1765660.07 1613906.07 7522.97
BTR 1765649.18 1613999.39 7519.55
BTR 1765634.95 1614090.61 7516.62
BTR 1765617.80 1614172.38 7514.06
BTR 1765598.83 1614296.40 7509.99
BTR 1765596.81 1614336.61 7508.28
BTR 1765582.02 1614407.24 7506.25
BTR 1765565.36 1614517.38 7505.58
BTR 1765553.57 1614616.79 7505.55
BTR 1765519.78 1614804.71 7508.84
BTR 1765489.11 1614986.79 7510.06
BTR 1765488.36 1614998.05 7510.20
BTR 1765469.73 1615248.26 7506.40
BTR 1765483.36 1615285.36 7506.25
BTR 1765516.58 1615373.10 7503.88
BTR 1765534.45 1615406.28 7503.30
BTR 1765538.05 1615415.07 7503.03
BTR 1765618.71 1615619.79 7501.21
BTR 1765648.25 1615701.23 7499.21
F 1765938.59 1612826.32 7545.82 S55W 80NE; fracture zone 0.3 m (1 ft) wide
F 1765928.42 1612846.02 7545.56 N42E 66SE
F 1765915.78 1612870.38 7545.21 N15E 85–90NW
F 1765908.03 1612888.39 7544.92 N15E > 60NW; fissure fill 0.8 m (2.5 ft) wide with clay-rich matrix and Qbt blocks
F 1765899.76 1612903.11 7544.70 S55W 90
F 1765897.34 1612908.10 7544.60 N65E 90
F 1765893.27 1612915.60 7544.45 N15W 90
F 1765882.09 1612938.91 7544.94 S15W 90
F 1765860.84 1612977.50 7546.03 N12E 68NW
F 1765853.84 1612991.71 7545.88 N60E > 60SE; fissure fill 0.9 m (3 ft) wide
F 1765850.90 1612997.91 7546.05 N20W; fissure fill
F 1765846.14 1613007.49 7545.89 N55E > 45SE; fissure fill
F 1765816.26 1613066.02 7545.73
F 1765814.05 1613070.50 7545.70
F 1765808.27 1613081.65 7545.36 N50E 90
F 1765806.40 1613086.17 7545.27 N30W > 45NE
F 1765787.69 1613126.20 7544.92 N80E 85–90NW

Appendix C. Total Station Survey Data
79
Table C-1 Continued. TA-9 Trench Total Station Survey Data (notes on page 94)
Mapped Coordinates†
Contact* Northing (ft) Easting (ft) Elevation (ft) Comments‡
F 1765790.53 1613132.63 7544.46 N7W 90; graben/fissure fill 0.5 m (1.5 ft) wide; no tuff in bottom
F 1765786.18 1613135.55 7544.74 N35W 86SW
F 1765785.10 1613164.50 7543.77
F 1765778.27 1613207.66 7542.39 N70W 74SW
F 1765777.42 1613211.81 7542.28 N14W 90; fissure fill 0.6 m (2 ft) wide
F 1765775.74 1613224.92 7541.95 N20E 66SW; fissure fill < 0.3 m (1 ft) wide
F 1765774.64 1613229.97 7541.86 N5W 90; fissure 1.5 m (5 ft) wide at T-C and 0.3 m (1 ft) in tuff
F 1765772.53 1613242.39 7541.27 N5W 90; fissure 1.5 m (5 ft) wide at T-C and0.3 m (1 ft) in tuff
F 1765768.16 1613244.88 7541.68 N20W 80SW; fissure fill
F 1765771.89 1613248.85 7541.00 N70E 85SE; fissure fill
F 1765767.44 1613251.81 7541.05 N13E 86NW
F 1765766.69 1613257.35 7540.96 N70W 90
F 1765770.12 1613259.31 7540.62 N55W 52SW
F 1765766.17 1613260.95 7540.85 N17E 87SE
F 1765769.76 1613265.71 7540.33 N28W 28–75SW
F 1765768.87 1613270.55 7540.12 N37E 44–87NW; alluvium 0.5 m (1.5 ft) thick over tuff
F 1765766.56 1613285.20 7539.16 N3E 72SE
F 1765766.28 1613287.88 7539.39 N27E 84NW
F 1765763.06 1613308.58 7538.32 N3W 90
F 1765759.97 1613324.03 7537.67 N20W 85–90SW
F 1765759.61 1613328.66 7537.97 N15W 70NE; W side of channel incised into top of tuff; channel fill up to 0.9 m (3 ft) thick
F 1765758.58 1613333.97 7537.99 N20W 90; E side of channel
F 1765755.76 1613350.55 7538.10 center of 0.9-m (3-ft) wide rubble zone; clay-filled shear planes N15W 80SW and N50E 70NW
F 1765751.57 1613375.74 7538.00 N60E 68NW
F 1765750.95 1613378.15 7538.00 N37E 87NW; fissure fill
F 1765749.18 1613388.20 7538.01 N3W 55NE
F 1765749.18 1613390.20 7538.01
F 1765551.68 1614633.96 7509.78
F 1765550.17 1614637.16 7510.15 N15E 85SE; clay-filled fracture
F 1765548.75 1614647.65 7510.48 clay-filled fracture; 18.3-cm (7.2-in) wide fissurewith large block in clay
F 1765547.94 1614653.27 7510.62 N4W 84NE; clay-filled fracture
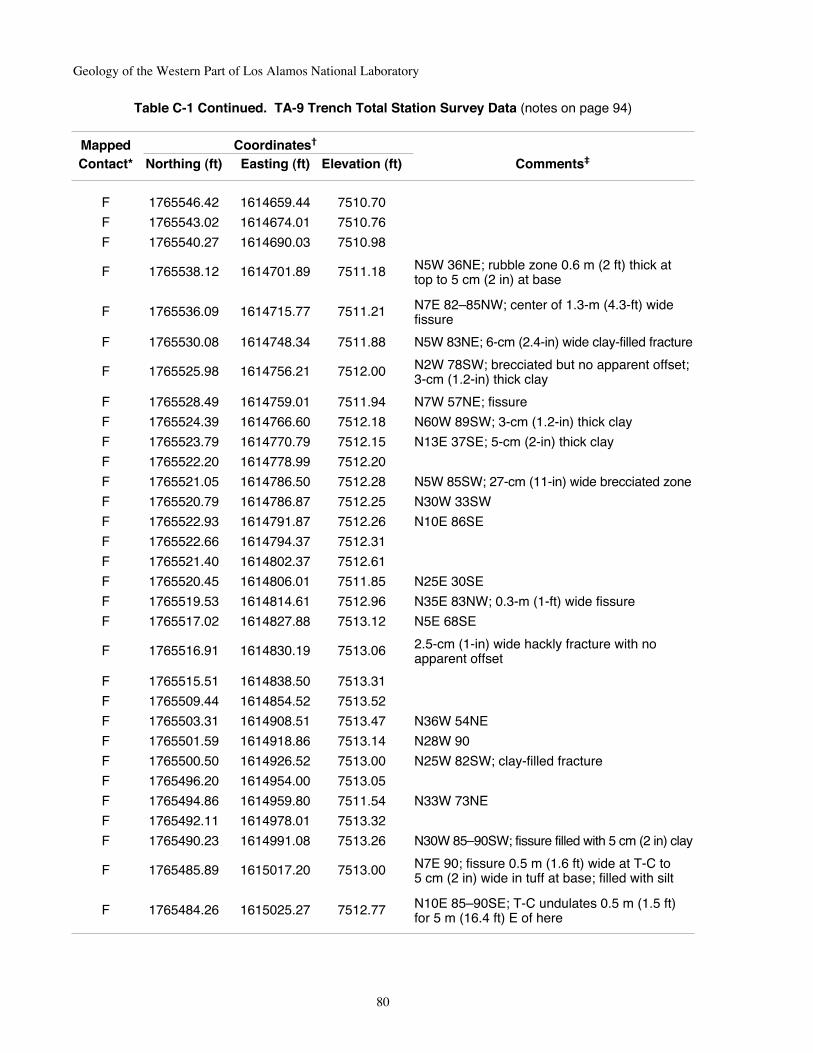
Geology of the Western Part of Los Alamos National Laboratory
80
Table C-1 Continued. TA-9 Trench Total Station Survey Data (notes on page 94)
Mapped Coordinates†
Contact* Northing (ft) Easting (ft) Elevation (ft) Comments‡
F 1765546.42 1614659.44 7510.70
F 1765543.02 1614674.01 7510.76
F 1765540.27 1614690.03 7510.98
F 1765538.12 1614701.89 7511.18 N5W 36NE; rubble zone 0.6 m (2 ft) thick at top to 5 cm (2 in) at base
F 1765536.09 1614715.77 7511.21 N7E 82–85NW; center of 1.3-m (4.3-ft) wide fissure
F 1765530.08 1614748.34 7511.88 N5W 83NE; 6-cm (2.4-in) wide clay-filled fracture
F 1765525.98 1614756.21 7512.00 N2W 78SW; brecciated but no apparent offset;3-cm (1.2-in) thick clay
F 1765528.49 1614759.01 7511.94 N7W 57NE; fissure
F 1765524.39 1614766.60 7512.18 N60W 89SW; 3-cm (1.2-in) thick clay
F 1765523.79 1614770.79 7512.15 N13E 37SE; 5-cm (2-in) thick clay
F 1765522.20 1614778.99 7512.20
F 1765521.05 1614786.50 7512.28 N5W 85SW; 27-cm (11-in) wide brecciated zone
F 1765520.79 1614786.87 7512.25 N30W 33SW
F 1765522.93 1614791.87 7512.26 N10E 86SE
F 1765522.66 1614794.37 7512.31
F 1765521.40 1614802.37 7512.61
F 1765520.45 1614806.01 7511.85 N25E 30SE
F 1765519.53 1614814.61 7512.96 N35E 83NW; 0.3-m (1-ft) wide fissure
F 1765517.02 1614827.88 7513.12 N5E 68SE
F 1765516.91 1614830.19 7513.06 2.5-cm (1-in) wide hackly fracture with no apparent offset
F 1765515.51 1614838.50 7513.31
F 1765509.44 1614854.52 7513.52
F 1765503.31 1614908.51 7513.47 N36W 54NE
F 1765501.59 1614918.86 7513.14 N28W 90
F 1765500.50 1614926.52 7513.00 N25W 82SW; clay-filled fracture
F 1765496.20 1614954.00 7513.05
F 1765494.86 1614959.80 7511.54 N33W 73NE
F 1765492.11 1614978.01 7513.32
F 1765490.23 1614991.08 7513.26 N30W 85–90SW; fissure filled with 5 cm (2 in) clay
F 1765485.89 1615017.20 7513.00 N7E 90; fissure 0.5 m (1.6 ft) wide at T-C to 5 cm (2 in) wide in tuff at base; filled with silt
F 1765484.26 1615025.27 7512.77 N10E 85–90SE; T-C undulates 0.5 m (1.5 ft) for 5 m (16.4 ft) E of here

Appendix C. Total Station Survey Data
81
Table C-1 Continued. TA-9 Trench Total Station Survey Data (notes on page 94)
Mapped Coordinates†
Contact* Northing (ft) Easting (ft) Elevation (ft) Comments‡
F 1765480.66 1615046.99 7512.25 N20E 22NW; 2.5-cm (1-in) wide clay-filled fracture; next to 2–3 other fractures
F 1765480.10 1615050.43 7512.14 N32E 90; 10-cm (4-in) wide clay filled
F 1765478.90 1615058.15 7512.14 N8E 34NW clay-filled fracture and N8W 67NE 15-cm (6-in) wide clay-filled fracture
F 1765476.59 1615070.11 7509.79 N25W 17SW
F 1765476.40 1615071.60 7509.96 N65W 87NE
F 1765544.29 1615431.54 7507.25 N70W 48NE; 15 cm (6 in) wide at T-C; W edge of cobbly Holocene colluvium
F 1765581.72 1615526.33 7505.29 N50E 55SE
F 1765590.08 1615546.81 7507.14 colluvium 0.7–1.0 m (2.4–3.4 ft) thick
F 1765607.07 1615597.35 7501.93 N2W 90; fissure 12 cm (4.8 in) wide
F 1765612.82 1615605.23 7505.70 N75W vertical to steep NE; fissure 2.5–6.4 cm (1–2.5 in) wide
N2E 90; fissure 0.3 m (1 ft) wide filled with F 1765618.71 1615619.79 7505.11 sandy orange silt; tuff bleached to 2.5 cm (1 in)
depth
F 1765679.36 1615782.82 7500.59 N33W 62NE
F 1765686.71 1615795.57 7500.55 N36E 90
F 1765699.06 1615826.73 7500.18 N18W 52NE; U-shaped fracture; 3 m (10 ft) wide
F 1765709.84 1615852.65 7499.69 N10E 85SE; fracture filled with silty clay
F 1765713.96 1615864.82 7499.68 N20W 80NE; fracture 5 cm (2 in) wide
F 1765723.47 1615890.36 7499.61
F 1765730.14 1615906.60 7499.24 N48E 68SE; fissure filled with sandy silt
F 1765729.79 1615911.22 7496.93 N20W 90; fissure at T-C 15 cm (6 in) widefilled with clayey sand
F 1765740.02 1615935.55 7497.92 N6E 65SE; fissure < 14 cm (5.4 in) wide; lower0.5 m (1.5 ft) clay filled; upper part, sand and tuff
F 1765745.04 1615945.12 7493.99 0.3-m (1-ft) wide fissure with angular tuff blocks in clay; 3 main vertical fractures in zone
F 1765751.57 1615970.17 7496.91 N23E 88–90SE; fracture 10.2 cm (4 in) wide filled with Holocene colluvium
G 1765508.86 1614893.01 7513.42
S 1765767.29 1616007.92 7490.03 sample from 0.6 m (2 ft) above surge within Unit 4
S 1765768.86 1616012.29 7487.05 sample from below surge
S 1765807.84 1616121.73 7457.31 sample of tuff
S4 1765772.83 1616015.44 7488.23 attitude on surge within Unit 4: N20W 3SW
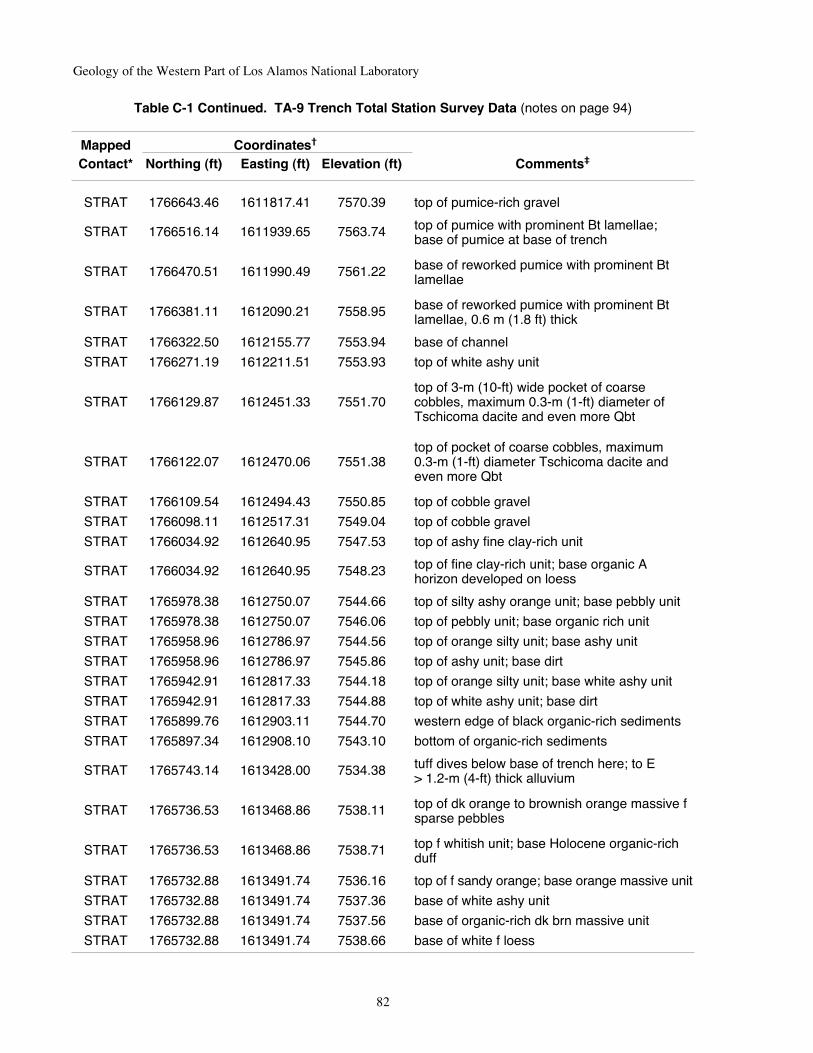
Geology of the Western Part of Los Alamos National Laboratory
82
Table C-1 Continued. TA-9 Trench Total Station Survey Data (notes on page 94)
Mapped Coordinates†
Contact* Northing (ft) Easting (ft) Elevation (ft) Comments‡
STRAT 1766643.46 1611817.41 7570.39 top of pumice-rich gravel
STRAT 1766516.14 1611939.65 7563.74 top of pumice with prominent Bt lamellae; base of pumice at base of trench
STRAT 1766470.51 1611990.49 7561.22 base of reworked pumice with prominent Bt lamellae
STRAT 1766381.11 1612090.21 7558.95 base of reworked pumice with prominent Bt lamellae, 0.6 m (1.8 ft) thick
STRAT 1766322.50 1612155.77 7553.94 base of channel
STRAT 1766271.19 1612211.51 7553.93 top of white ashy unit
top of 3-m (10-ft) wide pocket of coarse STRAT 1766129.87 1612451.33 7551.70 cobbles, maximum 0.3-m (1-ft) diameter of
Tschicoma dacite and even more Qbt
top of pocket of coarse cobbles, maximum STRAT 1766122.07 1612470.06 7551.38 0.3-m (1-ft) diameter Tschicoma dacite and
even more Qbt
STRAT 1766109.54 1612494.43 7550.85 top of cobble gravel
STRAT 1766098.11 1612517.31 7549.04 top of cobble gravel
STRAT 1766034.92 1612640.95 7547.53 top of ashy fine clay-rich unit
STRAT 1766034.92 1612640.95 7548.23 top of fine clay-rich unit; base organic A horizon developed on loess
STRAT 1765978.38 1612750.07 7544.66 top of silty ashy orange unit; base pebbly unit
STRAT 1765978.38 1612750.07 7546.06 top of pebbly unit; base organic rich unit
STRAT 1765958.96 1612786.97 7544.56 top of orange silty unit; base ashy unit
STRAT 1765958.96 1612786.97 7545.86 top of ashy unit; base dirt
STRAT 1765942.91 1612817.33 7544.18 top of orange silty unit; base white ashy unit
STRAT 1765942.91 1612817.33 7544.88 top of white ashy unit; base dirt
STRAT 1765899.76 1612903.11 7544.70 western edge of black organic-rich sediments
STRAT 1765897.34 1612908.10 7543.10 bottom of organic-rich sediments
STRAT 1765743.14 1613428.00 7534.38 tuff dives below base of trench here; to E > 1.2-m (4-ft) thick alluvium
STRAT 1765736.53 1613468.86 7538.11 top of dk orange to brownish orange massive f sparse pebbles
STRAT 1765736.53 1613468.86 7538.71 top f whitish unit; base Holocene organic-rich duff
STRAT 1765732.88 1613491.74 7536.16 top of f sandy orange; base orange massive unit
STRAT 1765732.88 1613491.74 7537.36 base of white ashy unit
STRAT 1765732.88 1613491.74 7537.56 base of organic-rich dk brn massive unit
STRAT 1765732.88 1613491.74 7538.66 base of white f loess
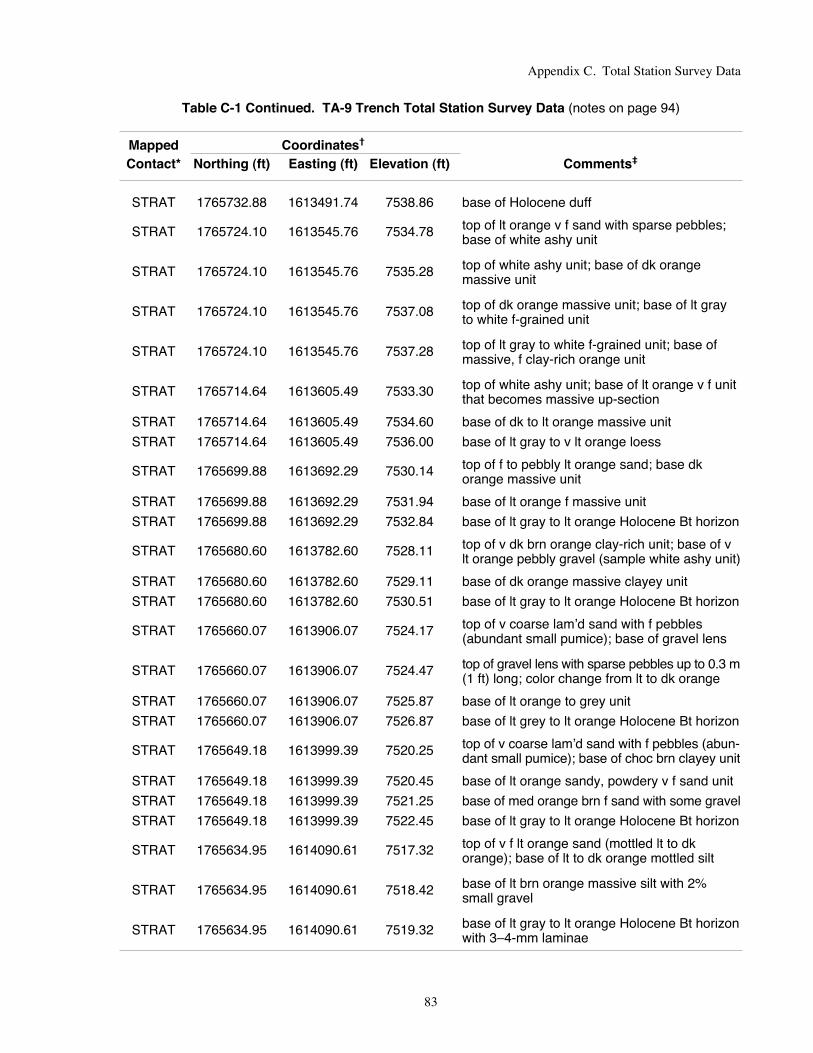
Appendix C. Total Station Survey Data
83
Table C-1 Continued. TA-9 Trench Total Station Survey Data (notes on page 94)
Mapped Coordinates†
Contact* Northing (ft) Easting (ft) Elevation (ft) Comments‡
STRAT 1765732.88 1613491.74 7538.86 base of Holocene duff
STRAT 1765724.10 1613545.76 7534.78 top of lt orange v f sand with sparse pebbles;base of white ashy unit
STRAT 1765724.10 1613545.76 7535.28 top of white ashy unit; base of dk orange massive unit
STRAT 1765724.10 1613545.76 7537.08 top of dk orange massive unit; base of lt grayto white f-grained unit
STRAT 1765724.10 1613545.76 7537.28 top of lt gray to white f-grained unit; base ofmassive, f clay-rich orange unit
STRAT 1765714.64 1613605.49 7533.30 top of white ashy unit; base of lt orange v f unitthat becomes massive up-section
STRAT 1765714.64 1613605.49 7534.60 base of dk to lt orange massive unit
STRAT 1765714.64 1613605.49 7536.00 base of lt gray to v lt orange loess
STRAT 1765699.88 1613692.29 7530.14 top of f to pebbly lt orange sand; base dk orange massive unit
STRAT 1765699.88 1613692.29 7531.94 base of lt orange f massive unit
STRAT 1765699.88 1613692.29 7532.84 base of lt gray to lt orange Holocene Bt horizon
STRAT 1765680.60 1613782.60 7528.11 top of v dk brn orange clay-rich unit; base of v lt orange pebbly gravel (sample white ashy unit)
STRAT 1765680.60 1613782.60 7529.11 base of dk orange massive clayey unit
STRAT 1765680.60 1613782.60 7530.51 base of lt gray to lt orange Holocene Bt horizon
STRAT 1765660.07 1613906.07 7524.17 top of v coarse lam’d sand with f pebbles (abundant small pumice); base of gravel lens
STRAT 1765660.07 1613906.07 7524.47 top of gravel lens with sparse pebbles up to 0.3 m (1 ft) long; color change from lt to dk orange
STRAT 1765660.07 1613906.07 7525.87 base of lt orange to grey unit
STRAT 1765660.07 1613906.07 7526.87 base of lt grey to lt orange Holocene Bt horizon
STRAT 1765649.18 1613999.39 7520.25 top of v coarse lam’d sand with f pebbles (abun-dant small pumice); base of choc brn clayey unit
STRAT 1765649.18 1613999.39 7520.45 base of lt orange sandy, powdery v f sand unit
STRAT 1765649.18 1613999.39 7521.25 base of med orange brn f sand with some gravel
STRAT 1765649.18 1613999.39 7522.45 base of lt gray to lt orange Holocene Bt horizon
STRAT 1765634.95 1614090.61 7517.32 top of v f lt orange sand (mottled lt to dk orange); base of lt to dk orange mottled silt
STRAT 1765634.95 1614090.61 7518.42 base of lt brn orange massive silt with 2% small gravel
STRAT 1765634.95 1614090.61 7519.32 base of lt gray to lt orange Holocene Bt horizon with 3–4-mm laminae

Geology of the Western Part of Los Alamos National Laboratory
84
Table C-1 Continued. TA-9 Trench Total Station Survey Data (notes on page 94)
Mapped Coordinates†
Contact* Northing (ft) Easting (ft) Elevation (ft) Comments‡
STRAT 1765617.80 1614172.38 7514.96 top of v f lt orange massive hard sand; base of lt orange to choc brn mottled gravel
STRAT 1765617.80 1614172.38 7516.16 base of choc brn massive silt with 1–3% gravel
STRAT 1765617.80 1614172.38 7516.96 base of massive lt orange brn eolian silt
STRAT 1765617.80 1614172.38 7517.46 base of lt gray to lt orange Holocene Bt horizon with 3–4-mm laminae
STRAT 1765598.83 1614296.40 7510.59 top of v f choc brn wet sand; base of v f lt orange sand
STRAT 1765598.83 1614296.40 7511.09 base of massive v f med orange sand
STRAT 1765598.83 1614296.40 7511.99 base of lt orange to med orange platy porous and striped (from root mats) unit
STRAT 1765598.83 1614296.40 7512.19 base of choc brn massive silty clay
STRAT 1765598.83 1614296.40 7512.59 base of lt orange-brn massive eolian silt
STRAT 1765598.83 1614296.40 7513.19 base of lt orange-brn massive platy eolian silt
STRAT 1765596.81 1614336.61 7509.98 top of dk orange to choc brn massive unit with good peds; base of v lt gray to lt gray porous unit
STRAT 1765596.81 1614336.61 7510.38 base of unit grading from v lt orange at base to v dk orange at top
STRAT 1765596.81 1614336.61 7510.88 base of unit grading into black organic bog deposit
STRAT 1765596.81 1614336.61 7511.88 base of v lt orange stripped Holocene Bt horizon
STRAT 1765582.02 1614407.24 7507.25 top of v dk brn orange to choc brn clay-rich unit; base of black organic-rich deposit
STRAT 1765582.02 1614407.24 7508.15 base of unit grading from v dk gray to dk orange silt
STRAT 1765582.02 1614407.24 7509.55 base of v lt orange silty Holocene Bt horizon
STRAT 1765565.36 1614517.38 7505.88 top of v dk brn orange to choc brn clay-rich unit; base of black organic-rich deposit
STRAT 1765565.36 1614517.38 7507.38 base of unit grading from v dk gray to dk orange silt
STRAT 1765565.36 1614517.38 7508.58 base of v lt gray silty competent loess
base of unit with silt to f sand matrix and STRAT 1765553.57 1614616.79 7506.75 15–25% gravel—large dacite and tuff clasts up
to 15 cm (6 in)
STRAT 1765553.57 1614616.79 7507.75 base of massive choc brn v clayey unit with 10% gravel [clasts up to 15 cm (6 in) on long axis]
STRAT 1765553.57 1614616.79 7508.05 base of porous lt brn silty loess with cobbles up to 7.6 cm (3 in) long

Appendix C. Total Station Survey Data
85
Table C-1 Continued. TA-9 Trench Total Station Survey Data (notes on page 94)
Mapped Coordinates†
Contact* Northing (ft) Easting (ft) Elevation (ft) Comments‡
STRAT 1765553.57 1614616.79 7508.55 base of fill
STRAT 1765469.73 1615248.26 7507.90 top of mottled lt orange to orange massive silt with med-coarse sand; base of lt orange silt
base of brownish orange massive clay-rich STRAT 1765469.73 1615248.26 7508.30 porous silt with 2–3% sand with roots; pinches
out to the W
STRAT 1765469.73 1615248.26 7509.40 base of lt orange massive eolian silt
STRAT 1765469.73 1615248.26 7509.80 base of grayish orange platy silt
STRAT 1765483.36 1615285.36 7508.95 top of brn orange massive clayey porous unit; base of massive lt orange eolian silt
STRAT 1765483.36 1615285.36 7509.25 base of greyish orange platy silt
top of pumice-rich lt orange–med brn unit with STRAT 1765516.58 1615373.10 7503.88 50% pumice (same stratigraphic position as
white ashy); base is massive
STRAT 1765516.58 1615373.10 7503.88 top of massive dk brn base to lt orange top silty sandy 5–10% pumice; base of lt orange eolian silt
STRAT 1765516.58 1615373.10 7503.88 base of lt brn platy silt
STRAT 1765538.05 1615415.07 7504.53 base of sandy unit with 10–30% clayey matrix
STRAT 1765538.05 1615415.07 7504.93 base of red-brn clayey-silty mottled unit
T-C 1765942.91 1612817.33 7543.08
T-C 1765938.59 1612825.02 7543.22
T-C 1765937.60 1612825.88 7543.66
T-C 1765938.59 1612827.02 7542.72
T-C 1765927.61 1612845.13 7544.16
T-C 1765916.54 1612867.14 7544.38
T-C 1765909.05 1612884.52 7542.95
T-C 1765905.81 1612890.47 7544.29
T-C 1765893.27 1612915.60 7542.15
T-C 1765884.34 1612932.69 7544.08 organic-rich sediments 24 cm (9.6 in) thick over tuff
T-C 1765882.09 1612938.91 7543.24
T-C 1765867.64 1612964.54 7544.35
T-C 1765860.84 1612977.50 7544.53
T-C 1765853.49 1612990.68 7545.62
T-C 1765851.92 1612994.00 7543.51
T-C 1765849.69 1612998.28 7542.56
T-C 1765847.05 1613004.04 7545.56

Geology of the Western Part of Los Alamos National Laboratory
86
Table C-1 Continued. TA-9 Trench Total Station Survey Data (notes on page 94)
Mapped Coordinates†
Contact* Northing (ft) Easting (ft) Elevation (ft) Comments‡
T-C 1765845.56 1613006.08 7545.33 alluvium 0.3 m (1 ft) thick over tuff in brecciated zone with slabby tuff in orange matrix
T-C 1765825.43 1613046.55 7543.60 alluvium 0.76 m (2.5 ft) thick over tuff
T-C 1765816.26 1613065.02 7543.43
T-C 1765796.63 1613101.84 7542.63 alluvium 0.9 m (3 ft) thick over tuff
T-C 1765777.42 1613210.81 7540.18
T-C 1765769.76 1613265.71 7539.13
T-C 1765768.87 1613270.55 7538.62
T-C 1765747.31 1613399.42 7535.95 clay-rich alluvium over tuff
base of lt orange to med orange v coarse sand T-C 1765553.57 1614616.79 7505.95 with 5–10% pumice and 90–95% crystals;
v porous
T-C 1765548.00 1614624.97 7506.90
T-C 1765547.26 1614631.00 7507.77
T-C 1765550.17 1614637.16 7508.65
T-C 1765545.36 1614642.33 7509.31
T-C 1765545.01 1614644.26 7509.45
T-C 1765547.94 1614653.27 7509.12
T-C 1765543.18 1614656.53 7509.65
T-C 1765543.06 1614657.20 7509.01
T-C 1765542.37 1614661.04 7509.69
T-C 1765540.85 1614669.74 7510.19
T-C 1765543.02 1614674.01 7510.56
T-C 1765542.23 1614674.82 7510.13
T-C 1765539.12 1614679.79 7510.36 vertical fracture
T-C 1765538.71 1614682.07 7510.14
T-C 1765538.59 1614682.73 7509.20
T-C 1765538.58 1614683.39 7510.24
T-C 1765536.40 1614696.40 7510.16
T-C 1765534.13 1614709.70 7510.90
T-C 1765533.41 1614713.69 7510.68
T-C 1765533.34 1614714.49 7510.16
T-C 1765533.14 1614715.63 7510.85
T-C 1765532.81 1614718.55 7511.01
T-C 1765532.41 1614719.54 7510.47
T-C 1765531.97 1614722.54 7510.77
T-C 1765531.06 1614729.28 7509.98
T-C 1765530.86 1614729.62 7509.62 fissure 9.1 cm (3.6 in) wide
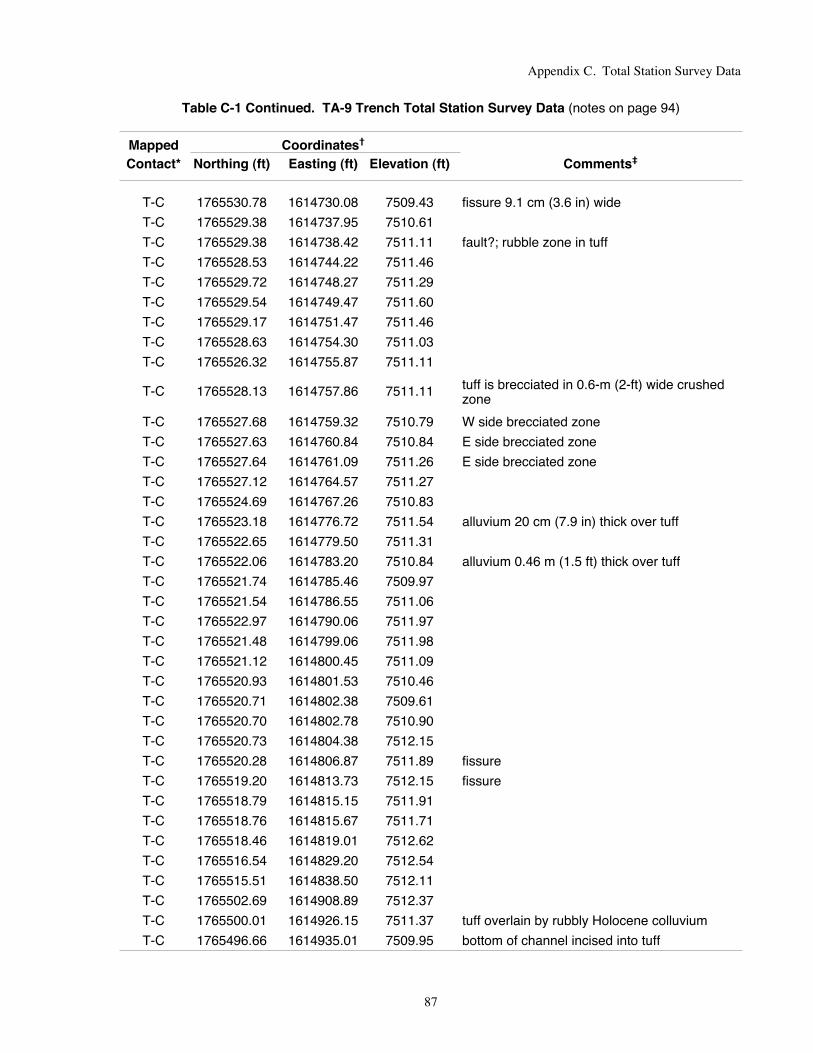
Appendix C. Total Station Survey Data
87
Table C-1 Continued. TA-9 Trench Total Station Survey Data (notes on page 94)
Mapped Coordinates†
Contact* Northing (ft) Easting (ft) Elevation (ft) Comments‡
T-C 1765530.78 1614730.08 7509.43 fissure 9.1 cm (3.6 in) wide
T-C 1765529.38 1614737.95 7510.61
T-C 1765529.38 1614738.42 7511.11 fault?; rubble zone in tuff
T-C 1765528.53 1614744.22 7511.46
T-C 1765529.72 1614748.27 7511.29
T-C 1765529.54 1614749.47 7511.60
T-C 1765529.17 1614751.47 7511.46
T-C 1765528.63 1614754.30 7511.03
T-C 1765526.32 1614755.87 7511.11
T-C 1765528.13 1614757.86 7511.11 tuff is brecciated in 0.6-m (2-ft) wide crushed zone
T-C 1765527.68 1614759.32 7510.79 W side brecciated zone
T-C 1765527.63 1614760.84 7510.84 E side brecciated zone
T-C 1765527.64 1614761.09 7511.26 E side brecciated zone
T-C 1765527.12 1614764.57 7511.27
T-C 1765524.69 1614767.26 7510.83
T-C 1765523.18 1614776.72 7511.54 alluvium 20 cm (7.9 in) thick over tuff
T-C 1765522.65 1614779.50 7511.31
T-C 1765522.06 1614783.20 7510.84 alluvium 0.46 m (1.5 ft) thick over tuff
T-C 1765521.74 1614785.46 7509.97
T-C 1765521.54 1614786.55 7511.06
T-C 1765522.97 1614790.06 7511.97
T-C 1765521.48 1614799.06 7511.98
T-C 1765521.12 1614800.45 7511.09
T-C 1765520.93 1614801.53 7510.46
T-C 1765520.71 1614802.38 7509.61
T-C 1765520.70 1614802.78 7510.90
T-C 1765520.73 1614804.38 7512.15
T-C 1765520.28 1614806.87 7511.89 fissure
T-C 1765519.20 1614813.73 7512.15 fissure
T-C 1765518.79 1614815.15 7511.91
T-C 1765518.76 1614815.67 7511.71
T-C 1765518.46 1614819.01 7512.62
T-C 1765516.54 1614829.20 7512.54
T-C 1765515.51 1614838.50 7512.11
T-C 1765502.69 1614908.89 7512.37
T-C 1765500.01 1614926.15 7511.37 tuff overlain by rubbly Holocene colluvium
T-C 1765496.66 1614935.01 7509.95 bottom of channel incised into tuff

Geology of the Western Part of Los Alamos National Laboratory
88
Table C-1 Continued. TA-9 Trench Total Station Survey Data (notes on page 94)
Mapped Coordinates†
Contact* Northing (ft) Easting (ft) Elevation (ft) Comments‡
T-C 1765498.27 1614938.16 7510.28
T-C 1765497.78 1614942.17 7510.98
T-C 1765496.94 1614946.75 7511.11
T-C 1765496.74 1614948.35 7511.68 W edge of zone of subhorizontal fractures that create slabby tuff
T-C 1765496.27 1614951.92 7512.14
T-C 1765495.34 1614956.43 7511.92
T-C 1765494.84 1614959.05 7512.06
T-C 1765493.99 1614962.92 7511.58
T-C 1765493.53 1614965.54 7511.48
T-C 1765492.68 1614971.09 7511.47
T-C 1765491.91 1614976.08 7511.33
T-C 1765491.30 1614980.48 7511.29
T-C 1765490.39 1614984.81 7512.08
T-C 1765490.01 1614987.40 7511.93
T-C 1765489.42 1614991.07 7511.30 silt 18 cm (7 in) thick overlain by Holocene colluvium
T-C 1765488.39 1614997.92 7512.06
T-C 1765479.44 1615051.36 7510.84
T-C 1765477.22 1615065.22 7511.05
T-C 1765476.70 1615067.80 7510.39
T-C 1765475.89 1615074.33 7510.02
T-C 1765474.97 1615079.00 7510.54
T-C 1765459.56 1615185.50 7508.52 domino blocks and clay-filled fractures N10W 44SW and N15E 50NW
T-C 1765459.56 1615217.73 7507.29 T-C disappears under base of trench
T-C 1765534.45 1615406.28 7503.30 tuff appears at base of trench
T-C 1765538.05 1615415.07 7504.13 base angular to subangular cobbles up to 0.6 m(2 ft) long in silty-clayey matrix
T-C 1765544.29 1615431.54 7505.45
T-C 1765554.32 1615464.55 7503.09 base of trench
T-C 1765557.41 1615472.61 7504.15
T-C 1765561.85 1615483.27 7504.11
T-C 1765567.15 1615495.91 7503.77 tuff overlain by cobbly colluvium with blocks upto 0.51 m (1.7 ft) long imbricated towards west
T-C 1765572.94 1615510.01 7504.04
T-C 1765576.45 1615518.54 7504.36 blocks of tuff up to 0.85 m (2.8 ft) long in colluvium over tuff

Appendix C. Total Station Survey Data
89
Table C-1 Continued. TA-9 Trench Total Station Survey Data (notes on page 94)
Mapped Coordinates†
Contact* Northing (ft) Easting (ft) Elevation (ft) Comments‡
T-C 1765597.17 1615574.15 7503.16 colluvium 1.1 m (3.5 ft) thick on S side and 0.57 m (1.9 ft) thick on N side
T-C 1765601.46 1615584.10 7502.54 colluvium 1.2 m (3.9 ft) thick
T-C 1765618.71 1615619.79 7504.81
colluvium 0.98 m (3.2 ft) thick on S side of T-C 1765623.32 1615638.67 7501.57 trench, 0.54 m (1.8 ft) on N side; blocks up to
0.79 m (2.6 ft) long
possible low angle fault N50W 25SW; clayT-C 1765631.99 1615655.73 7502.58 layer and colluvium on top on S side, tuff blk
on N side
T-C 1765635.61 1615671.36 7501.06 colluvium 0.7 m (2.3 ft) thick with blocks of tuff up to 1.2 m (3.8 ft) long
T-C 1765645.10 1615690.97 7500.47 colluvium 0.73 m (2.4 ft) thick on N side, 0.98 m (3.2 ft) thick on S side
T-C 1765659.17 1615725.08 7500.64
T-C 1765662.45 1615733.03 7500.21 N32W 74NE; rare clay-filled fracture
T-C 1765668.79 1615749.02 7500.81 middle of 3-m (10-ft) wide zone of massive structureless tuff
T-C 1765676.97 1615769.16 7499.62 N61W 25SW and N27E 28SE; clay-filled fractures
T-C 1765686.71 1615795.57 7500.55 colluvium < 9.1 cm (3.6 in) thick
T-C 1765692.49 1615811.71 7499.70 N48W 60NE; fracture
T-C 1765697.49 1615823.05 7500.23 colluvium 0.3–0.5 m (1–1.5 ft) thick
T-C 1765704.73 1615840.09 7499.84 colluvium 0.33 m (1.1 ft) thick on N, 0.49 m (1.6 ft) thick on S
T-C-F 1765546.86 1614633.30 7507.99
T-C-F 1765546.96 1614633.65 7508.23
T-C-F 1765544.60 1614647.33 7507.90 clay-filled fissure 24.4 cm (9.6 in) wide
T-C-F 1765544.48 1614648.54 7509.41 clay-filled fissure 24.4 cm (9.6 in) wide
T-C-F 1765543.78 1614651.55 7509.55
T-C-F 1765543.75 1614652.19 7509.02
T-C-F 1765541.64 1614665.05 7510.21
T-C-F 1765541.73 1614665.45 7509.74
T-C-F 1765540.26 1614673.43 7509.64
T-C-F 1765540.17 1614673.98 7510.06
T-C-F 1765539.73 1614676.67 7510.47
T-C-F 1765539.50 1614677.64 7510.18
T-C-F 1765537.57 1614689.01 7510.94
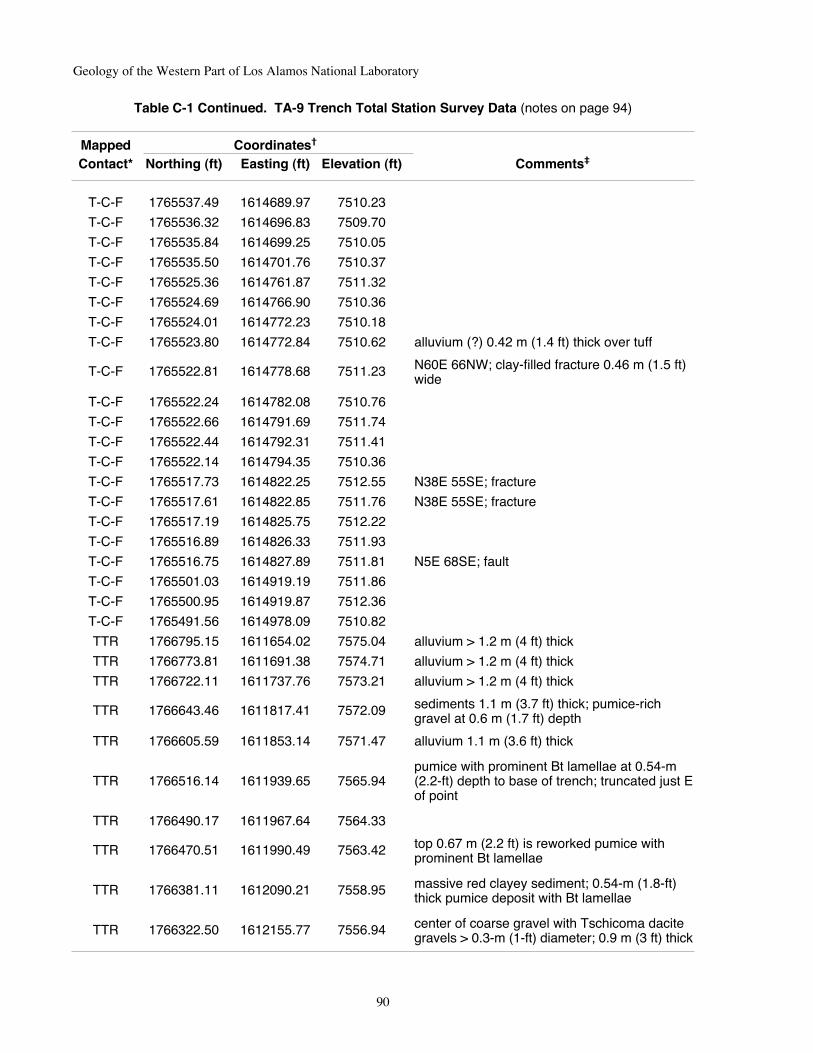
Geology of the Western Part of Los Alamos National Laboratory
90
Table C-1 Continued. TA-9 Trench Total Station Survey Data (notes on page 94)
Mapped Coordinates†
Contact* Northing (ft) Easting (ft) Elevation (ft) Comments‡
T-C-F 1765537.49 1614689.97 7510.23
T-C-F 1765536.32 1614696.83 7509.70
T-C-F 1765535.84 1614699.25 7510.05
T-C-F 1765535.50 1614701.76 7510.37
T-C-F 1765525.36 1614761.87 7511.32
T-C-F 1765524.69 1614766.90 7510.36
T-C-F 1765524.01 1614772.23 7510.18
T-C-F 1765523.80 1614772.84 7510.62 alluvium (?) 0.42 m (1.4 ft) thick over tuff
T-C-F 1765522.81 1614778.68 7511.23 N60E 66NW; clay-filled fracture 0.46 m (1.5 ft) wide
T-C-F 1765522.24 1614782.08 7510.76
T-C-F 1765522.66 1614791.69 7511.74
T-C-F 1765522.44 1614792.31 7511.41
T-C-F 1765522.14 1614794.35 7510.36
T-C-F 1765517.73 1614822.25 7512.55 N38E 55SE; fracture
T-C-F 1765517.61 1614822.85 7511.76 N38E 55SE; fracture
T-C-F 1765517.19 1614825.75 7512.22
T-C-F 1765516.89 1614826.33 7511.93
T-C-F 1765516.75 1614827.89 7511.81 N5E 68SE; fault
T-C-F 1765501.03 1614919.19 7511.86
T-C-F 1765500.95 1614919.87 7512.36
T-C-F 1765491.56 1614978.09 7510.82
TTR 1766795.15 1611654.02 7575.04 alluvium > 1.2 m (4 ft) thick
TTR 1766773.81 1611691.38 7574.71 alluvium > 1.2 m (4 ft) thick
TTR 1766722.11 1611737.76 7573.21 alluvium > 1.2 m (4 ft) thick
TTR 1766643.46 1611817.41 7572.09 sediments 1.1 m (3.7 ft) thick; pumice-rich gravel at 0.6 m (1.7 ft) depth
TTR 1766605.59 1611853.14 7571.47 alluvium 1.1 m (3.6 ft) thick
pumice with prominent Bt lamellae at 0.54-m TTR 1766516.14 1611939.65 7565.94 (2.2-ft) depth to base of trench; truncated just E
of point
TTR 1766490.17 1611967.64 7564.33
TTR 1766470.51 1611990.49 7563.42 top 0.67 m (2.2 ft) is reworked pumice with prominent Bt lamellae
TTR 1766381.11 1612090.21 7558.95 massive red clayey sediment; 0.54-m (1.8-ft) thick pumice deposit with Bt lamellae
TTR 1766322.50 1612155.77 7556.94 center of coarse gravel with Tschicoma dacite gravels > 0.3-m (1-ft) diameter; 0.9 m (3 ft) thick

Appendix C. Total Station Survey Data
91
Table C-1 Continued. TA-9 Trench Total Station Survey Data (notes on page 94)
Mapped Coordinates†
Contact* Northing (ft) Easting (ft) Elevation (ft) Comments‡
TTR 1766284.09 1612198.29 7555.54 white ashy unit in bottom 0.3 m (1 ft); pinches out W but thickens E
TTR 1766271.19 1612211.51 7555.13 white ashy unit is 0.76 m (2.5 ft) thick; gravel isthinner
TTR 1766248.10 1612238.27 7554.90 white ashy unit is 2 cm (5 in) thick and pinches out E; overlain by clay-rich matrix gravels
TTR 1766229.80 1612262.10 7554.83 0.98-m (3.2-ft) clay-rich matrix gravels
TTR 1766184.69 1612348.54 7554.76 gravels with orange sandy matrix; cobbles 0.46-m (1.5-ft) long Tschicoma dacite and Qbt
extremely clay-rich deposit with sparse cobbles TTR 1766149.45 1612418.28 7554.14 [< 9.1-cm (3.6-in) diameter]; bottom 0.6 m (2 ft)
is more cobbly
center of 3-m (10-ft) wide pocket of coarse
TTR 1766129.87 1612456.33 7553.70 cobbles in bottom 0.76 m (2.5 ft) of trench; cobbles are maximum 0.3-m (1-ft) diameter Tschicoma and more Qbt
center of pocket of coarse cobbles in bottom
TTR 1766122.07 1612470.06 7553.48 0.7 m (2.3 ft) [average 0.5 m (1.6 ft) thick]; maximum 0.3-m (1-ft) diameter Tschicoma and more Qbt
TTR 1766109.54 1612494.43 7553.05 bottom 0.49 m (1.6 ft) is clayey cobble-rich deposit
TTR 1766098.11 1612517.31 7552.64 cobble-rich layer is 0.18 m (0.6 ft) from bottom and pinches out to E
TTR 1766034.92 1612640.95 7550.43
TTR 1765978.38 1612750.07 7547.96 sample of pumice from pebbly unit
TTR 1765958.96 1612786.97 7547.16
TTR 1765942.91 1612817.33 7546.38
TTR 1765909.05 1612884.52 7544.95
TTR 1765884.34 1612932.69 7544.88 organic-rich sediment 24-cm (10-in) thick over tuff
W margin of channel; alluvium 0.5 m (1.7 ft) TTR 1765867.64 1612964.54 7546.05 thick over tuff; alluvium > 0.9 m (3 ft) thick in
center of channel
TTR 1765780.98 1613162.72 7544.06
TTR 1765754.96 1613330.45 7538.22
TTR 1765747.31 1613399.42 7537.95 clay-rich alluvium 0.6 m (2 ft) thick
TTR 1765741.14 1613411.18 7538.25 N30E 10SE; bedding
TTR 1765740.32 1613414.55 7538.26
TTR 1765743.14 1613428.00 7538.38 alluvium > 1.2 m (4-ft) thick
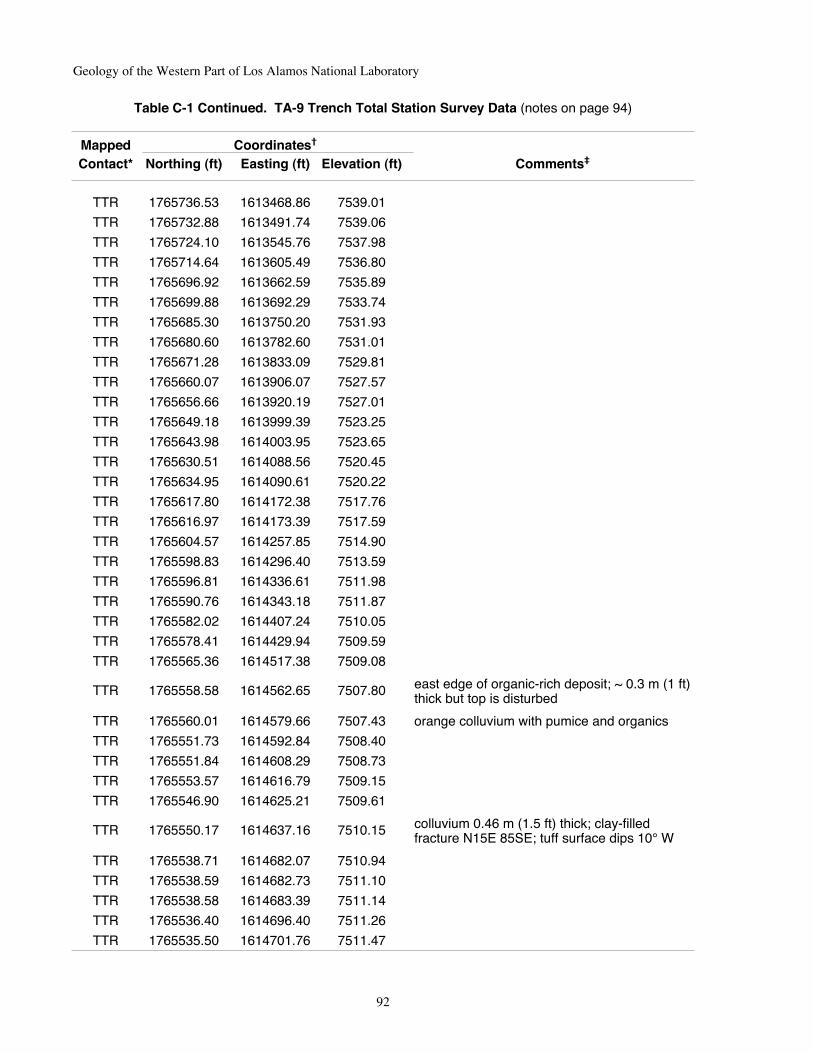
Geology of the Western Part of Los Alamos National Laboratory
92
Table C-1 Continued. TA-9 Trench Total Station Survey Data (notes on page 94)
Mapped Coordinates†
Contact* Northing (ft) Easting (ft) Elevation (ft) Comments‡
TTR 1765736.53 1613468.86 7539.01
TTR 1765732.88 1613491.74 7539.06
TTR 1765724.10 1613545.76 7537.98
TTR 1765714.64 1613605.49 7536.80
TTR 1765696.92 1613662.59 7535.89
TTR 1765699.88 1613692.29 7533.74
TTR 1765685.30 1613750.20 7531.93
TTR 1765680.60 1613782.60 7531.01
TTR 1765671.28 1613833.09 7529.81
TTR 1765660.07 1613906.07 7527.57
TTR 1765656.66 1613920.19 7527.01
TTR 1765649.18 1613999.39 7523.25
TTR 1765643.98 1614003.95 7523.65
TTR 1765630.51 1614088.56 7520.45
TTR 1765634.95 1614090.61 7520.22
TTR 1765617.80 1614172.38 7517.76
TTR 1765616.97 1614173.39 7517.59
TTR 1765604.57 1614257.85 7514.90
TTR 1765598.83 1614296.40 7513.59
TTR 1765596.81 1614336.61 7511.98
TTR 1765590.76 1614343.18 7511.87
TTR 1765582.02 1614407.24 7510.05
TTR 1765578.41 1614429.94 7509.59
TTR 1765565.36 1614517.38 7509.08
TTR 1765558.58 1614562.65 7507.80 east edge of organic-rich deposit; ~ 0.3 m (1 ft) thick but top is disturbed
TTR 1765560.01 1614579.66 7507.43 orange colluvium with pumice and organics
TTR 1765551.73 1614592.84 7508.40
TTR 1765551.84 1614608.29 7508.73
TTR 1765553.57 1614616.79 7509.15
TTR 1765546.90 1614625.21 7509.61
TTR 1765550.17 1614637.16 7510.15 colluvium 0.46 m (1.5 ft) thick; clay-filled fracture N15E 85SE; tuff surface dips 10° W
TTR 1765538.71 1614682.07 7510.94
TTR 1765538.59 1614682.73 7511.10
TTR 1765538.58 1614683.39 7511.14
TTR 1765536.40 1614696.40 7511.26
TTR 1765535.50 1614701.76 7511.47

Appendix C. Total Station Survey Data
93
Table C-1 Continued. TA-9 Trench Total Station Survey Data (notes on page 94)
Mapped Coordinates†
Contact* Northing (ft) Easting (ft) Elevation (ft) Comments‡
TTR 1765534.13 1614709.70 7511.40
TTR 1765532.46 1614714.23 7511.51
TTR 1765533.34 1614714.49 7511.46
TTR 1765533.14 1614715.63 7511.55
TTR 1765529.38 1614738.42 7512.41
TTR 1765528.63 1614754.30 7511.93
TTR 1765526.32 1614755.87 7512.11
TTR 1765527.63 1614760.84 7512.04
TTR 1765527.12 1614764.57 7512.07
TTR 1765524.69 1614766.90 7512.16
TTR 1765495.90 1614934.16 7513.15
TTR 1765499.17 1614936.94 7512.99 axis of channel
TTR 1765495.27 1614959.94 7513.08
TTR 1765489.24 1614998.08 7513.19
axis of channel trending S35E; 2 m (6.6 ft) TTR 1765487.75 1615005.52 7513.30 wide at T-C contact filled with sandy gravel
> 1.2 m (4 ft) deep
TTR 1765477.41 1615067.96 7512.01
TTR 1765476.81 1615071.74 7512.06
TTR 1765459.56 1615185.50 7510.92
TTR 1765459.49 1615210.88 7510.17 tuff overlain by 0.5-cm (0.2-in) thick white powder overlain by mottled unit
TTR 1765459.56 1615212.73 7510.29
TTR 1765469.73 1615248.26 7510.30
TTR 1765483.36 1615285.36 7509.75
TTR 1765516.58 1615373.10 7507.88
TTR 1765534.45 1615406.28 7507.20
TTR 1765538.05 1615415.07 7507.03
colluvium 0.85 m (2.8 ft) thick over tuff, above TTR 1765550.89 1615457.03 7507.22 N75W 50NE clay-filled fracture 6.1 cm (2.4 in)
wide
TTR 1765557.89 1615475.75 7507.11
TTR 1765557.84 1615475.79 7507.15
TTR 1765584.50 1615531.44 7507.18
TTR 1765609.83 1615597.37 7506.00
TTR 1765641.07 1615676.84 7503.48
TTR 1765659.84 1615724.98 7502.38 colluvium 0.54 m (1.8 ft) thick with blocks up to 1.3 (4.2 ft) long
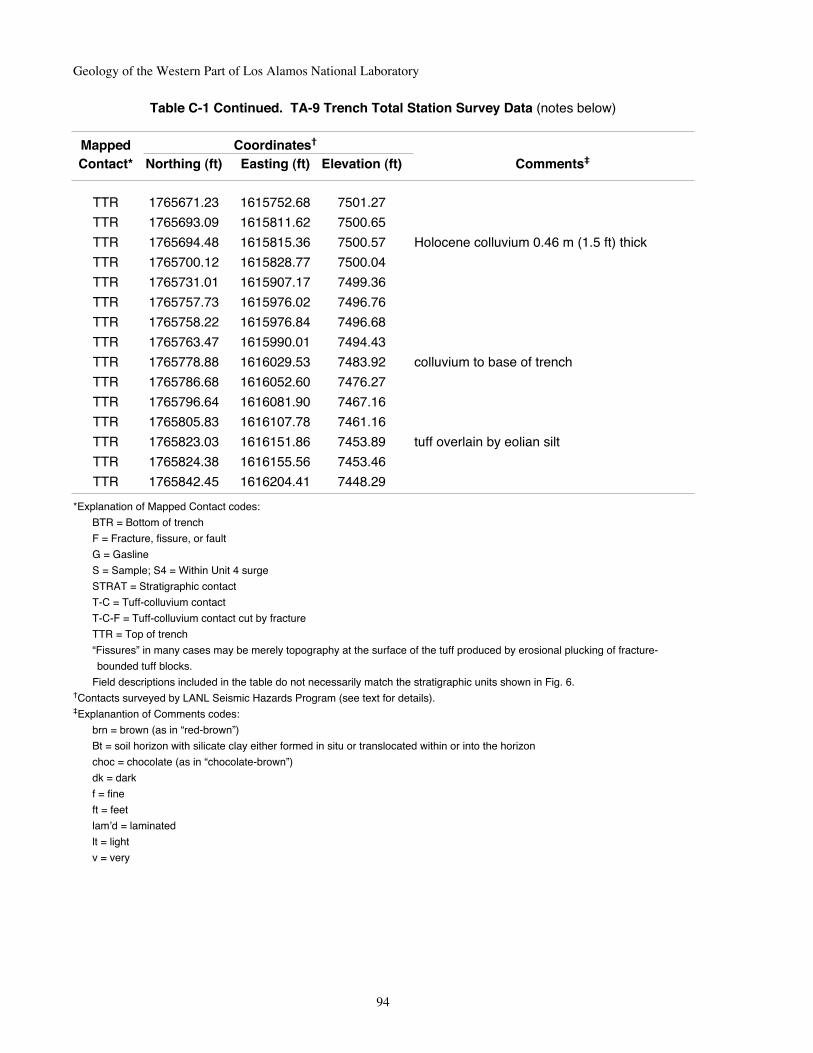
Table C-1 Continued. TA-9 Trench Total Station Survey Data (notes below)
Mapped Coordinates†
Contact* Northing (ft) Easting (ft) Elevation (ft) Comments‡
TTR 1765671.23 1615752.68 7501.27
TTR 1765693.09 1615811.62 7500.65
TTR 1765694.48 1615815.36 7500.57 Holocene colluvium 0.46 m (1.5 ft) thick
TTR 1765700.12 1615828.77 7500.04
TTR 1765731.01 1615907.17 7499.36
TTR 1765757.73 1615976.02 7496.76
TTR 1765758.22 1615976.84 7496.68
TTR 1765763.47 1615990.01 7494.43
TTR 1765778.88 1616029.53 7483.92 colluvium to base of trench
TTR 1765786.68 1616052.60 7476.27
TTR 1765796.64 1616081.90 7467.16
TTR 1765805.83 1616107.78 7461.16
TTR 1765823.03 1616151.86 7453.89 tuff overlain by eolian silt
TTR 1765824.38 1616155.56 7453.46
TTR 1765842.45 1616204.41 7448.29
*Explanation of Mapped Contact codes:
BTR = Bottom of trench
F = Fracture, fissure, or fault
G = Gasline
S = Sample; S4 = Within Unit 4 surge
STRAT = Stratigraphic contact
T-C = Tuff-colluvium contact
T-C-F = Tuff-colluvium contact cut by fracture
TTR = Top of trench
“Fissures” in many cases may be merely topography at the surface of the tuff produced by erosional plucking of fracture-
bounded tuff blocks.
Field descriptions included in the table do not necessarily match the stratigraphic units shown in Fig. 6. †Contacts surveyed by LANL Seismic Hazards Program (see text for details).‡Explanantion of Comments codes:
brn = brown (as in “red-brown”)
Bt = soil horizon with silicate clay either formed in situ or translocated within or into the horizon
choc = chocolate (as in “chocolate-brown”)
dk = dark
f = fine
ft = feet
lam’d = laminated
lt = light
v = very
Geology of the Western Part of Los Alamos National Laboratory
94

Appendix C. Total Station Survey Data
95
Table C-2. MDA P Total Station Survey Data (notes on page 98)
Mapped Coordinates†
Contact* Northing (ft) Easting (ft) Elevation (ft)‡ Comments
3T 1764476 1615778 7413
4 1764469 1615784 7415
3T-4 1764477 1615794 7414
3T-4 1764480 1615808 7415
3T-4 1764483 1615819 7415
3T-4 1764482 1615835 7415
3T-4 1764485 1615859 7414
3T-4 1764504 1615893 7412
3T-4 1764512 1615908 7410
3T-4 1764511 1615929 7411
3T-4 1764515 1615958 7411
3T-4 1764517 1615994 7411
3 1764584 1615944 7388
3-3T 1764572 1615922 7390
3-3T 1764566 1615894 7390
3-3T 1764559 1615875 7391
3-3T 1764539 1615834 7395
3-3T 1764548 1615851 7393
3-3T 1764517 1615783 7397
F1 1764500 1615759 7396
F1 1764550 1615740 7365
F1 1764536 1615751 7375
3-3T 1764494 1615756 7397
F1 1764527 1615753 7381
F1 1764519 1615758 7386
F1-2 1764516 1615760 7387
F2 1764504 1615761 7396
F2 1764495 1615762 7398
F1 1764511 1615764 7391
F2 1764482 1615762 7403
F1 1764507 1615765 7394
F1 1764498 1615776 7402
F1 1764487 1615784 7408
F1 1764479 1615790 7414
3-3T 1764462 1615725 7399
3-3T 1764475 1615735 7395
F1 1764473 1615794 7415
F 1764458 1615698 7399 N70E

Geology of the Western Part of Los Alamos National Laboratory
96
Table C-2 Continued. MDA P Total Station Survey Data (notes on page 98)
Mapped Coordinates†
Contact* Northing (ft) Easting (ft) Elevation (ft)‡ Comments
3T-4 1764483 1615816 7415
3T-4 1764478 1615799 7415
3T-4 1764476 1615790 7414
3T-4 1764466 1615776 7415
3T-4 1764449 1615753 7417
3T-4 1764432 1615723 7419
3T-4 1764414 1615694 7419
3T-4 1764400 1615663 7420
3T-4 1764394 1615639 7420
3-3T 1764449 1615692 7401
F 1764462 1615713 7399
3-3T 1764448 1615679 7400
F3 1764512 1615765 7391
F3 1764508 1615762 7392
3 1764434 1615640 7400
3-3T 1764492 1615758 7398
3-3T 1764507 1615780 7399
3-3T 1764498 1615764 7399
3 1764465 1615719 7399
F 1764497 1615700 7375 N70E
3T 1764463 1615713 7399
F4 1764465 1615711 7398
F4 1764457 1615730 7402
F 1764490 1615734 7390
F 1764485 1615730 7390
F 1764501 1615714 7376 fault N50W 90
F 1764470 1615716 7396
F 1764497 1615748 7391 N85E 90
F 1764496 1615755 7395
F 1764500 1615747 7391 N60W 90
F 1764496 1615756 7397
F5 1764511 1615745 7383
F5 1764522 1615718 7371 N70W 85NE
F5 1764530 1615705 7361
3WB 1764542 1615729 7367
3WB 1764561 1615762 7367
3WB 1764570 1615774 7366

Appendix C. Total Station Survey Data
97
Table C-2 Continued. MDA P Total Station Survey Data (notes on page 98)
Mapped Coordinates†
Contact* Northing (ft) Easting (ft) Elevation (ft)‡ Comments
F5 1764555 1615761 7371 N27W
3WB 1764581 1615801 7366
3WB 1764591 1615840 7363
3WB 1764600 1615876 7368
3WB 1764607 1615901 7367
3WB 1764615 1615921 7368
3WB 1764628 1615950 7363
BH 557 1764475 1615848 7415
F 1764704 1615684 7372 fault N17E 85SE with grooves
F 1764727 1615694 7383 fault N17E 85SE with grooves
3WB 1764730 1615744 7370
F 1764725 1615714 7373
F 1764730 1615735 7371
F 1764767 1615736 7398 fault zone with fissures
F 1764764 1615718 7401 N5E 87NW
TG 1764811 1615891 7363
F 1764921 1615898 7396 fault N7W 90
3-3T 1764870 1615858 7400
3-3T 1764838 1615817 7399
3-3T 1764790 1615762 7400
F 1764817 1615732 7417
3-3T 1764768 1615750 7395
3T-4 1764819 1615724 7418
3-3T 1764741 1615689 7397
3T-4 1764800 1615689 7420
3-3T 1764706 1615651 7398
3T-4 1764778 1615649 7419
3-3T 1764689 1615600 7396
3T-4 1764742 1615599 7419
3-3T 1764675 1615572 7398
3T-4 1764722 1615562 7420
3-3T 1764655 1615521 7397
3T-4 1764706 1615518 7420
3-3T 1764635 1615496 7393
3T 1764696 1615468 7425
3-3T 1764614 1615400 7400
3-3T 1764591 1615330 7401
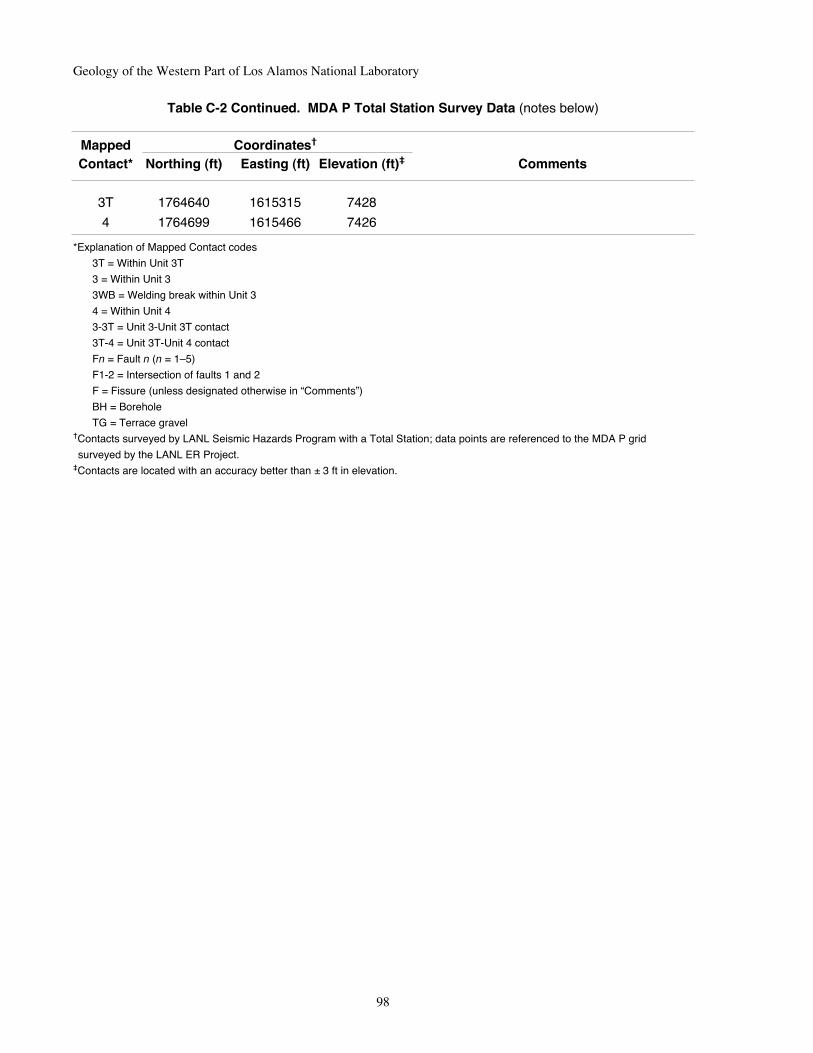
Geology of the Western Part of Los Alamos National Laboratory
98
Table C-2 Continued. MDA P Total Station Survey Data (notes below)
Mapped Coordinates†
Contact* Northing (ft) Easting (ft) Elevation (ft)‡ Comments
3T 1764640 1615315 7428
4 1764699 1615466 7426
*Explanation of Mapped Contact codes
3T = Within Unit 3T
3 = Within Unit 3
3WB = Welding break within Unit 3
4 = Within Unit 4
3-3T = Unit 3-Unit 3T contact
3T-4 = Unit 3T-Unit 4 contact
Fn = Fault n (n = 1–5)
F1-2 = Intersection of faults 1 and 2
F = Fissure (unless designated otherwise in “Comments”)
BH = Borehole
TG = Terrace gravel†Contacts surveyed by LANL Seismic Hazards Program with a Total Station; data points are referenced to the MDA P grid
surveyed by the LANL ER Project.‡Contacts are located with an accuracy better than ± 3 ft in elevation.

This report has been reproduced directly from the best available copy. It is available electronically on the Web (http://www.doe.gov/bridge).
Copies are available for sale to U.S. Department of Energy employees and contractors from:
Office of Scientific and Technical InformationP.O. Box 62Oak Ridge, TN 37831(865) 576-8401
Copies are available for sale to the public from:National Technical Information ServiceU.S. Department of Commerce5285 Port Royal RoadSpringfield, VA 22161(800) 553-6847