Geology for Civil Engineers - McLean & Gribble
348
www.angoothachaap.blogspot.com www.angoothachaap.blogspot.com
description
geology
Transcript of Geology for Civil Engineers - McLean & Gribble
www.angoothachaap.blogspot.com
www.angoothachaap.blogspot.com

GEOLOGY FOR CIVIL ENGINEERS
www.angoothachaap.blogspot.com
www.angoothachaap.blogspot.com
TITLES OF RELATED INTEREST
Construction Methods and Planning J.R.Illingworth
Contaminated Land—Problems and Solutions Edited by T.Cairney
Engineering the Channel Tunnel Edited by C.Kirkland
Engineering Treatment of Soils F.G.Bell
Foundations of Engineering Geology A.C.Waltham
Geology of Construction Materials J.F.Prentice
Pile Design and Construction Practice M.J.Tomlinson
Piling Engineering W.G.K.Fleming, A.J.Weltman, M.F.Randolph and W.K.Elson
Rock Mechanics for Underground Mining B.H.G.Brady and E.T.Brown
Rock Slope Engineering E.Hoek and J.W.Bray
Rutley’s Elements of Mineralogy C.D.Gribble
The Stability of Slopes E.N.Bromhead
www.angoothachaap.blogspot.com
www.angoothachaap.blogspot.com

Soil Mechanics R.F.Craig
Underground Excavations in Rock E.Hoek and E.T.Brown
For details of these and other titles, contact the Marketing Department E & FN Spon, 11 New Fetter Lane, London EC4P 4EE, UK. Tel: +44(0) 171 842 2180
www.angoothachaap.blogspot.com
www.angoothachaap.blogspot.com
GEOLOGY FOR CIVIL ENGINEERS
Second Edition
A.C.McLean C.D.Gribble University of Glasgow
www.angoothachaap.blogspot.com
www.angoothachaap.blogspot.com

First published 1979 by E & FN Spon, an imprint of Chapman & Hall Second edition 1985
This edition published in the Taylor & Francis e-Library, 2005.
“To purchase your own copy of this or any of Taylor & Francis or Routledge's collection of thousands of eBooks please go to
www.eBookstore.tandf.co.uk.”
© 1979 A.C.McLean; 1979, 1985 C.D.Gribble
All rights reserved. No part of this book may be reprinted or reproduced or utilized in any form or by any electronic, mechanical, or other means, now known or hereafter invented, including photocopying and recording, or in any information storage or retrieval system, without permission in writing
from the publishers.
British Library Cataloguing in Publication Data A catalogue record for this book is available from the British Library
ISBN 0-203-36215-2 Master e-book ISBN
ISBN 0-203-37473-8 (Adobe e-Reader Format) ISBN 0-419-16000-0 (pbk)
www.angoothachaap.blogspot.com
www.angoothachaap.blogspot.com

zvvii
This book is dedicated to the memory of
Dr Adam McLean
www.angoothachaap.blogspot.com
www.angoothachaap.blogspot.com
zvviii
Preface to the second edition
Adam McLean and I were asked by Roger Jones of Allen & Unwin to consider producinga second edition of our book after the first edition had been published for a few years.Critical appraisals of the first edition were sought, and I am most grateful to ProfessorVan Dine and Dr Drummond for their many detailed and helpful comments. I should alsoparticularly like to thank Dr Bill French, who pointed out where corrections wererequired and also where additions (and subtractions) to the text could gainfully be madewithout changing the original flavour of our book. I have incorporated most of thesehelpful suggestions and hope that the text has been improved, but any mistakes andinaccuracies are mine.
At the beginning of the revision Adam McLean became ill, and the illness gotprogressively worse until, in March 1983, he died. In memory of all the enjoyment wehad with the first edition, I should like to dedicate the second edition to Adam with myrespect.
Colin Gribble Glasgow, September 1983
www.angoothachaap.blogspot.com
www.angoothachaap.blogspot.com
zvix
Preface to the first edition
The impulse to write this book stemmed from a course of geology given by us toengineering undergraduates at the University of Glasgow. The course has changed, andwe hope improved, during the twenty years since one of us was first involved with it. Itwas essentially a scaled-down version of an introductory course to science undergraduates; it is now radically different both in content and in the mode of teachingit. Our main thought, as we gradually reshaped it, was to meet the special interests andprofessional needs of budding civil engineers. It is a matter for serious debate as towhether time should be found within an engineering course for classes of a broad culturalnature. Our experience in teaching indicates that the relevance of subject matter to the vocation of those taught usually increases their interest and enthusiasm. Furthermore, inengineering curricula which are being crowded by new and professionally useful topics,we doubt whether a place would have been found for a general course on geology whichdiscussed, for example, the evolution of the vertebrates or the genetic relationship of thevarious basic plutonic rocks. On the other side of the scale, we have firm beliefs thateducated men and women should be aware of the Theory of Natural Selection and itssupport from the fossil record, and should be aware of other major scientific conceptssuch as plate tectonics. We have found some space for both of these in our book. Otherapparent digressions from what is obviously relevant may serve a professional purpose.For example, civil engineers must have an insight into how geologists reach conclusionsin making a geological map, in order to evaluate the finished map. Similarly, they shouldappreciate how and why geologists differentiate between (say) gabbro and diorite, notbecause these differences are important for most engineering purposes but so that theycan read a geological report sensibly and with the ability to sift the relevant from theirrelevant information.
Our course and this book are essentially an introduction to geology for civil engineers,which is adequate for the needs of their later careers, and on which further courses ofengineering geology, soil mechanics or rock mechanics can be based. They are notconceived as a course and text on engineering geology. We have, however, extended thescope of the book beyond what is geology in the strict sense to include engineeringapplications of geology. This is partly to demonstrate the relevance of geology toengineering, and partly in the expectation that the book, with its appendices, will alsoserve as a useful handbook of facts and methods for qualified engineers and otherprofessionals who use geology. The reactions of the majority of those who reviewed ourfirst draft reassured us that our ideas were not peculiar to ourselves, and that we were notthe zvx only teachers of geology who felt the need for a textbook tailored to them. Otherviews ranged from a preference for altering the book to make it a comprehensive accountof the whole of geology largely devoid of material on engineering, to a preference for a
www.angoothachaap.blogspot.com
www.angoothachaap.blogspot.com

more radical change along the lines we were following, which would have produced anintroductory text in engineering geology rather than geology. The balance of opinionseemed reasonably close to our own prescription, though we are grateful for the manyconstructive suggestions that have led to major changes of content and arrangement aswell as minor amendments. If we have not ended at the centre of the many opinions thatcolleagues and friends have kindly given us, it is because at the end of the day we havespecial interests and views ourselves, and it is our book. We hope that you will find ituseful and readable.
ADAM McLEAN COLIN GRIBBLE
Glasgow, August 1978
www.angoothachaap.blogspot.com
www.angoothachaap.blogspot.com
zvxi
Acknowledgements
We wish to thank the friends and colleagues who assisted us generously and patiently bytheir advice, by their critical reading of our text and by their encouragement. Weconsidered carefully all the points that they made, and many significant improvementsfrom our original draft are witness to this, just as any persistent failings, and any errors,are our own responsibility. A special thank you is due to Professor W.Dearman of theUniversity of Newcastle, Professor P.McL.Duff of the University of Strathclyde, DrI.Hamilton of Paisley College of Technology, Dr D. Wilson of the University ofLiverpool, and Professor Boyd of the University of Adelaide, for reading critically theentire text and making a host of useful comments. We were fortunate in being able todiscuss particular sections of the book with friends, whose specialised knowledge was asource of expert opinion and information, and we thank all of them sincerely. Theyinclude Mr R.Eden, Assistant Director BGS; Mr N. Dron of Ritchies Equipment Limited,Stirling; Mr C.I.Wilson, Dunblane; and Dr G.Maxwell of the University of Strathclyde.We are grateful to Professor B.E.Leake of our own department at the University ofGlasgow for help and encouragement; to other colleagues there, particularly Dr J. Hall,Dr B.J.Bluck and Dr W.D.I.Rolfe; to the two typists, Mrs D.Rae and MrsD.MacCormick, who prepared the draft copy; and to the wife of one of us, Mrs BeatriceMcLean, who did most of the preparation of the Index-Glossary as well as offering help at all stages. Last, but not least, we acknowledge the courteous shepherding of Mr RogerJones of George Allen & Unwin from the start of it all, to this point.
The second edition could not have been produced without the very great help and guidance I received from Roger Jones and Geoffrey Palmer of George Allen & Unwin. Ialso wish to thank Mary Sayers, whose careful editing of the revised text unquestionablyimproved the final product, and Beatrice McLean who helped with the Index-Glossary for this edition. Finally I should like to thank Professor Bernard Leake of my owndepartment for his help and encouragement at a particularly difficult time, Dr BrianBluck for his guidance on sedimentary rocks and processes, the secretaries of GlasgowUniversity Geology Department—Irene Wells, Dorothy Rae, Irene Elder and MaryFortune—who typed the entire book a second time, and my sister, Elizabeth, who proof read the entire book.
C.D.G.
www.angoothachaap.blogspot.com
www.angoothachaap.blogspot.com
zvxii
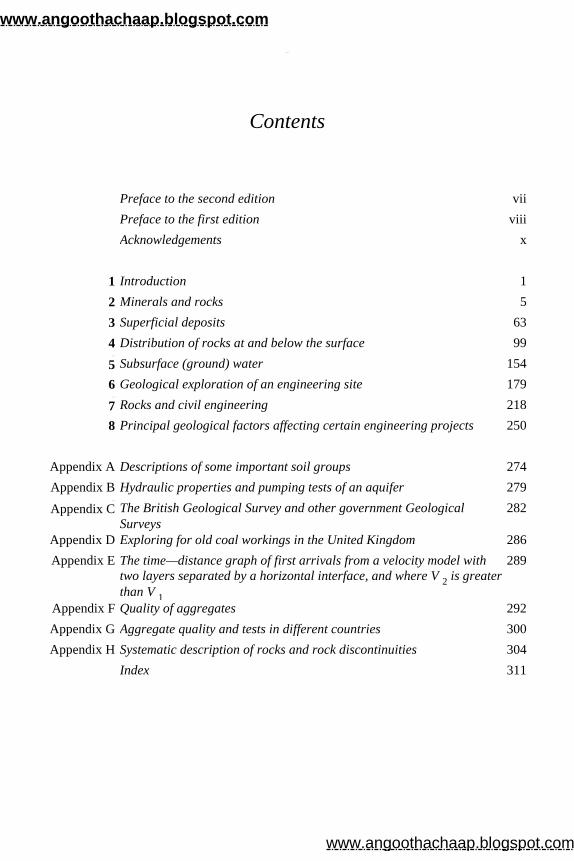
Contents
Preface to the second edition vii
Preface to the first edition viii
Acknowledgements x
1 Introduction 12 Minerals and rocks 53 Superficial deposits 634 Distribution of rocks at and below the surface 99
zvxiv
5 Subsurface (ground) water 1546 Geological exploration of an engineering site 179
zvxv
7 Rocks and civil engineering 2188 Principal geological factors affecting certain engineering projects 250
Appendix A Descriptions of some important soil groups 274Appendix B Hydraulic properties and pumping tests of an aquifer 279
zvxvi
Appendix C The British Geological Survey and other government Geological Surveys 282
Appendix D Exploring for old coal workings in the United Kingdom 286Appendix E
The time—distance graph of first arrivals from a velocity model with two layers separated by a horizontal interface, and where V 2 is greater than V 1
289
Appendix F Quality of aggregates 292Appendix G Aggregate quality and tests in different countries 300Appendix H Systematic description of rocks and rock discontinuities 304
Index 311
www.angoothachaap.blogspot.com
www.angoothachaap.blogspot.com
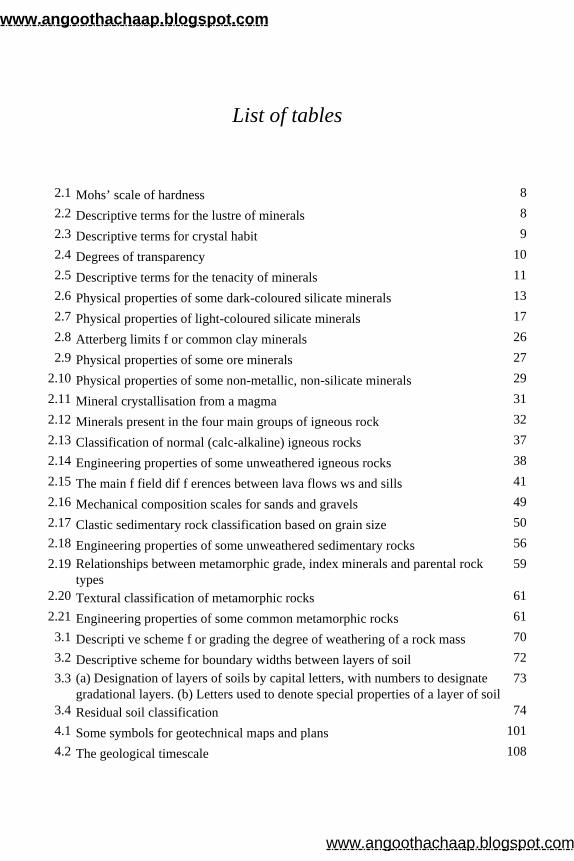
List of tables
2.1 Mohs’ scale of hardness 82.2 Descriptive terms for the lustre of minerals 82.3 Descriptive terms for crystal habit 92.4 Degrees of transparency 102.5 Descriptive terms for the tenacity of minerals 112.6 Physical properties of some dark-coloured silicate minerals 132.7 Physical properties of light-coloured silicate minerals 172.8 Atterberg limits f or common clay minerals 262.9 Physical properties of some ore minerals 27
2.10 Physical properties of some non-metallic, non-silicate minerals 292.11 Mineral crystallisation from a magma 312.12 Minerals present in the four main groups of igneous rock 322.13 Classification of normal (calc-alkaline) igneous rocks 372.14 Engineering properties of some unweathered igneous rocks 382.15 The main f field dif f erences between lava flows ws and sills 412.16 Mechanical composition scales for sands and gravels 492.17 Clastic sedimentary rock classification based on grain size 502.18 Engineering properties of some unweathered sedimentary rocks 562.19 Relationships between metamorphic grade, index minerals and parental rock
types 59
2.20 Textural classification of metamorphic rocks 612.21 Engineering properties of some common metamorphic rocks 613.1 Descripti ve scheme f or grading the degree of weathering of a rock mass 703.2 Descriptive scheme for boundary widths between layers of soil 723.3 (a) Designation of layers of soils by capital letters, with numbers to designate
gradational layers. (b) Letters used to denote special properties of a layer of soil 73
3.4 Residual soil classification 744.1 Some symbols for geotechnical maps and plans 1014.2 The geological timescale 108
www.angoothachaap.blogspot.com
www.angoothachaap.blogspot.com
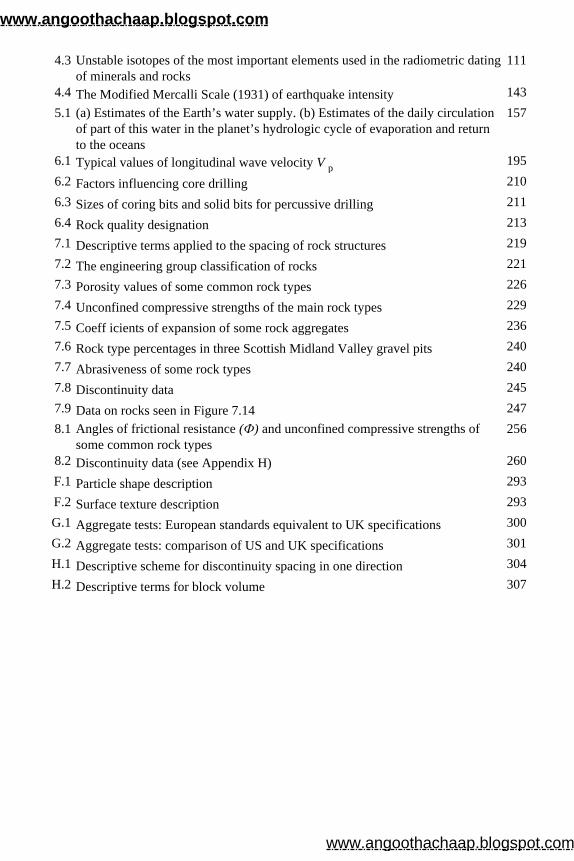
4.3 Unstable isotopes of the most important elements used in the radiometric dating of minerals and rocks 111
4.4 The Modified Mercalli Scale (1931) of earthquake intensity 1435.1
(a) Estimates of the Earth’s water supply. (b) Estimates of the daily circulation of part of this water in the planet’s hydrologic cycle of evaporation and return to the oceans
157
6.1 Typical values of longitudinal wave velocity V p 1956.2 Factors influencing core drilling 2106.3 Sizes of coring bits and solid bits for percussive drilling 2116.4 Rock quality designation 2137.1 Descriptive terms applied to the spacing of rock structures 2197.2 The engineering group classification of rocks 2217.3 Porosity values of some common rock types 2267.4 Unconfined compressive strengths of the main rock types 2297.5 Coeff icients of expansion of some rock aggregates 2367.6 Rock type percentages in three Scottish Midland Valley gravel pits 2407.7 Abrasiveness of some rock types 2407.8 Discontinuity data 2457.9 Data on rocks seen in Figure 7.14 2478.1 Angles of frictional resistance (Ф) and unconfined compressive strengths of
some common rock types 256
8.2 Discontinuity data (see Appendix H) 260F.1 Particle shape description 293F.2 Surface texture description 293G.1 Aggregate tests: European standards equivalent to UK specifications 300G.2 Aggregate tests: comparison of US and UK specifications 301H.1 Descriptive scheme for discontinuity spacing in one direction 304H.2 Descriptive terms for block volume 307
www.angoothachaap.blogspot.com
www.angoothachaap.blogspot.com
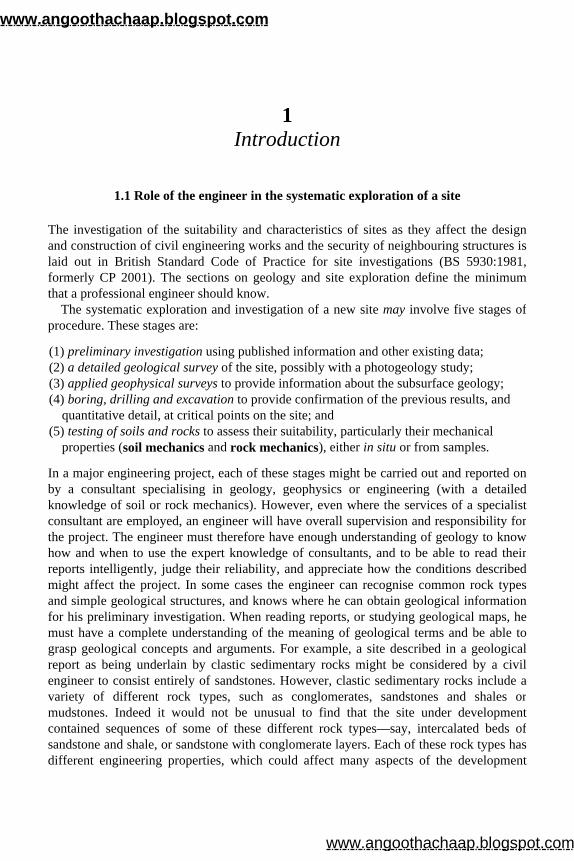
1 Introduction
1.1 Role of the engineer in the systematic exploration of a site
The investigation of the suitability and characteristics of sites as they affect the designand construction of civil engineering works and the security of neighbouring structures islaid out in British Standard Code of Practice for site investigations (BS 5930:1981,formerly CP 2001). The sections on geology and site exploration define the minimumthat a professional engineer should know.
The systematic exploration and investigation of a new site may involve five stages of procedure. These stages are:
(1) preliminary investigation using published information and other existing data; (2) a detailed geological survey of the site, possibly with a photogeology study; (3) applied geophysical surveys to provide information about the subsurface geology; (4) boring, drilling and excavation to provide confirmation of the previous results, and
quantitative detail, at critical points on the site; and (5) testing of soils and rocks to assess their suitability, particularly their mechanical
properties (soil mechanics and rock mechanics), either in situ or from samples.
In a major engineering project, each of these stages might be carried out and reported onby a consultant specialising in geology, geophysics or engineering (with a detailedknowledge of soil or rock mechanics). However, even where the services of a specialistconsultant are employed, an engineer will have overall supervision and responsibility forthe project. The engineer must therefore have enough understanding of geology to knowhow and when to use the expert knowledge of consultants, and to be able to read theirreports intelligently, judge their reliability, and appreciate how the conditions describedmight affect the project. In some cases the engineer can recognise common rock typesand simple geological structures, and knows where he can obtain geological informationfor his preliminary investigation. When reading reports, or studying geological maps, hemust have a complete understanding of the meaning of geological terms and be able tograsp geological concepts and arguments. For example, a site described in a geologicalreport as being underlain by clastic sedimentary rocks might be considered by a civilengineer to consist entirely of sandstones. However, clastic sedimentary rocks include avariety of different rock types, such as conglomerates, sandstones and shales ormudstones. Indeed it would not be unusual to find that the site under developmentcontained sequences of some of these different rock types—say, intercalated beds of sandstone and shale, or sandstone with conglomerate layers. Each of these rock types hasdifferent engineering properties, which could affect many aspects of the development
www.angoothachaap.blogspot.com
www.angoothachaap.blogspot.com
work such as core drilling into, and excavation of, the rock mass, and deep piling into theunderlying strata.
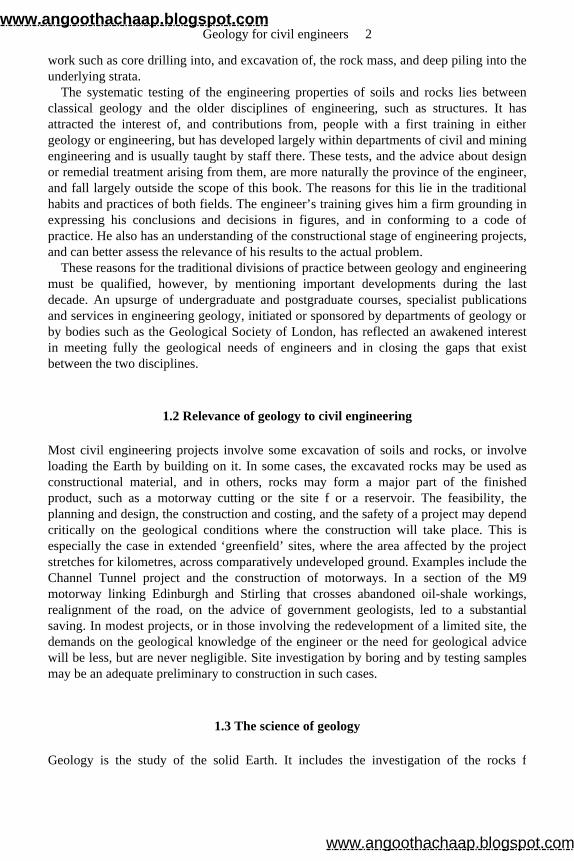
The systematic testing of the engineering properties of soils and rocks lies between classical geology and the older disciplines of engineering, such as structures. It hasattracted the interest of, and contributions from, people with a first training in eithergeology or engineering, but has developed largely within departments of civil and miningengineering and is usually taught by staff there. These tests, and the advice about designor remedial treatment arising from them, are more naturally the province of the engineer,and fall largely outside the scope of this book. The reasons for this lie in the traditionalhabits and practices of both fields. The engineer’s training gives him a firm grounding in expressing his conclusions and decisions in figures, and in conforming to a code ofpractice. He also has an understanding of the constructional stage of engineering projects,and can better assess the relevance of his results to the actual problem.
These reasons for the traditional divisions of practice between geology and engineering must be qualified, however, by mentioning important developments during the lastdecade. An upsurge of undergraduate and postgraduate courses, specialist publicationsand services in engineering geology, initiated or sponsored by departments of geology orby bodies such as the Geological Society of London, has reflected an awakened interestin meeting fully the geological needs of engineers and in closing the gaps that existbetween the two disciplines.
1.2 Relevance of geology to civil engineering
Most civil engineering projects involve some excavation of soils and rocks, or involveloading the Earth by building on it. In some cases, the excavated rocks may be used asconstructional material, and in others, rocks may form a major part of the finishedproduct, such as a motorway cutting or the site f or a reservoir. The feasibility, theplanning and design, the construction and costing, and the safety of a project may dependcritically on the geological conditions where the construction will take place. This isespecially the case in extended ‘greenfield’ sites, where the area affected by the project stretches for kilometres, across comparatively undeveloped ground. Examples include theChannel Tunnel project and the construction of motorways. In a section of the M9motorway linking Edinburgh and Stirling that crosses abandoned oil-shale workings, realignment of the road, on the advice of government geologists, led to a substantialsaving. In modest projects, or in those involving the redevelopment of a limited site, thedemands on the geological knowledge of the engineer or the need for geological advicewill be less, but are never negligible. Site investigation by boring and by testing samplesmay be an adequate preliminary to construction in such cases.
1.3 The science of geology
Geology is the study of the solid Earth. It includes the investigation of the rocks f
Geology for civil engineers 2
www.angoothachaap.blogspot.com
www.angoothachaap.blogspot.com
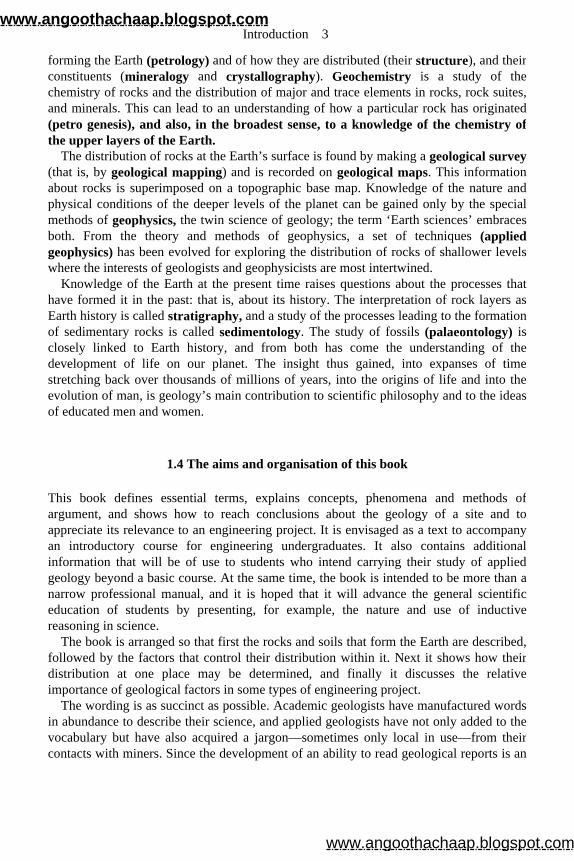
forming the Earth (petrology) and of how they are distributed (their structure), and their constituents (mineralogy and crystallography). Geochemistry is a study of the chemistry of rocks and the distribution of major and trace elements in rocks, rock suites,and minerals. This can lead to an understanding of how a particular rock has originated(petro genesis), and also, in the broadest sense, to a knowledge of the chemistry ofthe upper layers of the Earth.
The distribution of rocks at the Earth’s surface is found by making a geological survey (that is, by geological mapping) and is recorded on geological maps. This information about rocks is superimposed on a topographic base map. Knowledge of the nature andphysical conditions of the deeper levels of the planet can be gained only by the specialmethods of geophysics, the twin science of geology; the term ‘Earth sciences’ embraces both. From the theory and methods of geophysics, a set of techniques (applied geophysics) has been evolved for exploring the distribution of rocks of shallower levels where the interests of geologists and geophysicists are most intertwined.
Knowledge of the Earth at the present time raises questions about the processes thathave formed it in the past: that is, about its history. The interpretation of rock layers asEarth history is called stratigraphy, and a study of the processes leading to the formationof sedimentary rocks is called sedimentology. The study of fossils (palaeontology) is closely linked to Earth history, and from both has come the understanding of thedevelopment of life on our planet. The insight thus gained, into expanses of timestretching back over thousands of millions of years, into the origins of life and into theevolution of man, is geology’s main contribution to scientific philosophy and to the ideasof educated men and women.
1.4 The aims and organisation of this book
This book defines essential terms, explains concepts, phenomena and methods ofargument, and shows how to reach conclusions about the geology of a site and toappreciate its relevance to an engineering project. It is envisaged as a text to accompanyan introductory course for engineering undergraduates. It also contains additionalinformation that will be of use to students who intend carrying their study of appliedgeology beyond a basic course. At the same time, the book is intended to be more than anarrow professional manual, and it is hoped that it will advance the general scientificeducation of students by presenting, for example, the nature and use of inductivereasoning in science.
The book is arranged so that first the rocks and soils that form the Earth are described, followed by the factors that control their distribution within it. Next it shows how theirdistribution at one place may be determined, and finally it discusses the relativeimportance of geological factors in some types of engineering project.
The wording is as succinct as possible. Academic geologists have manufactured words in abundance to describe their science, and applied geologists have not only added to thevocabulary but have also acquired a jargon—sometimes only local in use—from their contacts with miners. Since the development of an ability to read geological reports is an
Introduction 3
www.angoothachaap.blogspot.com
www.angoothachaap.blogspot.com
aim of the book, it would be contradictory to omit ruthlessly every geological term thatseems inessential to the concept or general argument under discussion, however temptingsuch drastic editing may be. To guide the student in acquiring a basic geologicalvocabulary, the important terms are printed in bold type, usually at their first occurrence.In addition they are listed in the index, which therefore also serves as a glossary. Again,since the book is meant to serve the double purpose of reading and later reference, thereare appendices of some factual details that might otherwise have clogged the text. Withmuch of this information, it is enough that the engineer should understand, for example,how and why properties vary among the common rock types, with only a sense of theorder of magnitude of numerical values.
References and selected reading
British Standards Institution 1981. Code of Practice for Site Investigations. BS 5930:1981 (formerly CP 2001).
Edwards, R.J. G. 1971. The engineering geologist. Q. J. Engng Geol . 4 , 283–316. Glossop, R. 1969. Engineering geology and soil mechanics. Q. J. Engng Geol . 2 , 1–5. Military Engineering 1976. Applied geology for engineers . Vol. 15. London: HMSO. Rawlings, G.E. 1971. The role of the engineering geologist during construction.Q. J.
Engng Geol . 4 , 209–20. Taylor, R.K. 1971. The functions of the engineering geologist in urban development. Q.
J. Engng Geol . 4 , 221–40.
Geology for civil engineers 4
www.angoothachaap.blogspot.com
www.angoothachaap.blogspot.com
2 Minerals and rocks
2.1 The common rock-forming minerals
2.1.1 The properties of minerals
A mineral is a naturally occurring inorganic substance which has a definite chemicalcomposition, normally uniform throughout its volume. In contrast, rocks are collectionsof one or more minerals. In order to understand how rocks vary in composition andproperties, it is necessary to know the variety of minerals that commonly occur in them,and to identify a rock it is necessary to know which minerals are present in it. Twotechniques are employed to identify minerals:
(a) the study of a hand specimen of the mineral, or the rock in which it occurs, using a hand lens (×8 or ×10) and observing diagnostic features; and
(b) the examination of a thin slice of the mineral, ground down to a thickness of 0.03 mm, using a microscope, the rock slice being mounted in transparent resin on a glass slide.
The former method is by far the most useful to an engineer, since proficiency in the useof a microscope requires an amount of study out of proportion to its future benefit, exceptfor the specialist engineering geologist. However, examination of rocks in thin sectionwill provide excellent details of rock textures, some of which are difficult to see in thehand specimen. In hand-specimen identification, some features are purely visual (forexample, the colour of the mineral) but others, such as hardness, have to be assessed bysimple tests. (If the mineral grains are large enough, and an accurate value is needed, theymay be removed from the rock and measured in a laboratory.)
A mineral specimen can be an object of beauty in those occasional circumstanceswhere it forms a single crystal or cluster of crystals. The requirements are that the mineralhas been free to grow outwards into the solution or melt from which it formed, notobstructed by other solid matter, nor hindered anywhere around it by a shortage of theconstituents needed for growth. In such an environment, it develops a regular pattern offaces and angles between the faces, which is characteristic of a particular mineral. Thestudy of this regularity of f form, and of the internal structure of the mineral to which it isrelated, is called crystallography. In most mineral specimens, the local conditions have hindered or prevented some of the faces from developing, or the surface of the mineral is formed simply from the fractures along which it was broken off when collected. Even inthese specimens, there is the same regular internal arrangement of atoms as in a perfect
www.angoothachaap.blogspot.com
www.angoothachaap.blogspot.com
crystal of the same mineral. The specimen is crystalline even though it is not a crystal. Furthermore, in an imperfect crystal, where some faces have developed more than othersto produce a distorted external form, the angles between the faces are still the same as ina perfect crystal.
A study of the regularity of crystal forms, including the values of interfacial angles,shows that all crystals possess certain elements of symmetry. These elements include:
(a) a centre of symmetry, which a crystal possesses when all its faces occur in parallel pairs on opposite sides of the crystal. A cube, for example, possesses a centre of symmetry but a tetrahedron does not.
(b) an axis of symmetry, which is a line through a crystal such that a complete rotation of 360° about it produces more than one identical view. There are four types of axis of symmetry: a diad axis, when the same view is seen twice (every 180°); a triad axis, when the same view is seen three times (every 120°); a tetrad axis (four times—every 90°), and finally a hexad axis (six times—every 60°).
(c) a plane of symmetry, which divides the crystal into halves, each of which is a mirror image of the other without rotation.
On the basis of the number and type of symmetry elements present in naturally formedcrystals, seven crystal systems have been proposed, to which all minerals can be assigned.
Twinning in crystals occurs where one part of a crystal has grown or has beendeformed such that its atomic structure is rotated or reversed compared with the otherpart. Multiple twinning occurs and is a diagnostic property in the plagioclase feldspars(see Section 2.1.3).
As well as crystallography (form) and twinning, other important properties are used toidentify minerals in hand specimens, as follows:
COLOUR AND STREAK
The colour of a mineral is that seen on its surface by the naked eye. It may depend on the impurities present in light-coloured minerals, and one mineral specimen may even show gradation of colour or different colours. For these reasons, colour is usually a generalrather than specific guide to which mineral is present. Iridescence is a play of colourscharacteristic of certain minerals. The streak is the colour of the powdered mineral. Thisis most readily seen by scraping the mineral across a plate of unglazed hard porcelain andobserving the colour of any mark left. It is a diagnostic property of many ore minerals.For example, the lead ore, galena, has a metallic grey colour but a black streak.
Geology for civil engineers 6
www.angoothachaap.blogspot.com
www.angoothachaap.blogspot.com
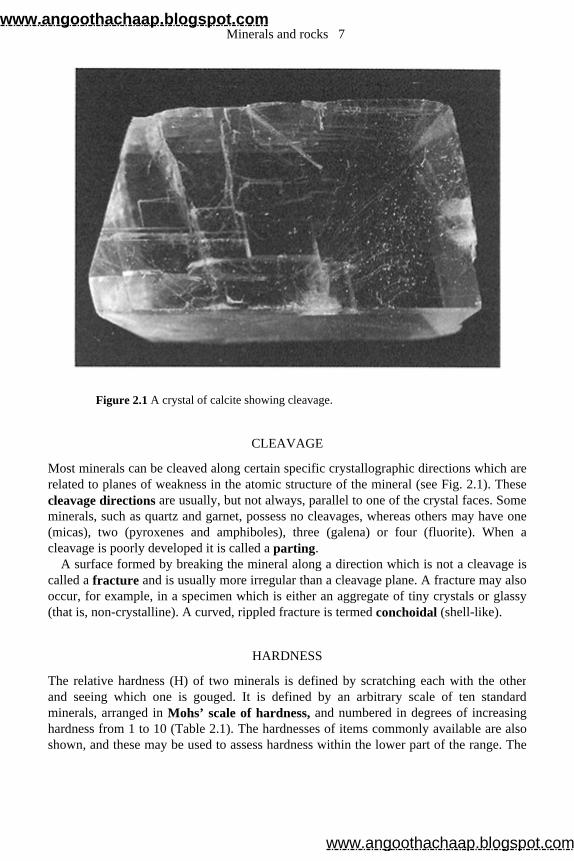
Figure 2.1 A crystal of calcite showing cleavage.
CLEAVAGE
Most minerals can be cleaved along certain specific crystallographic directions which arerelated to planes of weakness in the atomic structure of the mineral (see Fig. 2.1). These cleavage directions are usually, but not always, parallel to one of the crystal faces. Some minerals, such as quartz and garnet, possess no cleavages, whereas others may have one(micas), two (pyroxenes and amphiboles), three (galena) or four (fluorite). When acleavage is poorly developed it is called a parting.
A surface formed by breaking the mineral along a direction which is not a cleavage iscalled a fracture and is usually more irregular than a cleavage plane. A fracture may also occur, for example, in a specimen which is either an aggregate of tiny crystals or glassy(that is, non-crystalline). A curved, rippled fracture is termed conchoidal (shell-like).
HARDNESS
The relative hardness (H) of two minerals is defined by scratching each with the otherand seeing which one is gouged. It is defined by an arbitrary scale of ten standardminerals, arranged in Mohs’ scale of hardness, and numbered in degrees of increasinghardness from 1 to 10 (Table 2.1). The hardnesses of items commonly available are alsoshown, and these may be used to assess hardness within the lower part of the range. The
Minerals and rocks 7
www.angoothachaap.blogspot.com
www.angoothachaap.blogspot.com
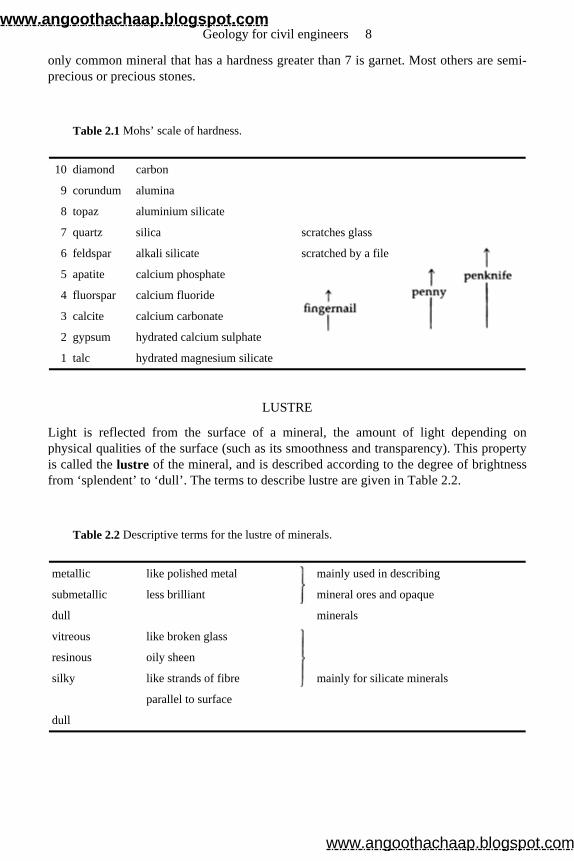
only common mineral that has a hardness greater than 7 is garnet. Most others are semi-precious or precious stones.
LUSTRE
Light is reflected from the surface of a mineral, the amount of light depending onphysical qualities of the surface (such as its smoothness and transparency). This propertyis called the lustre of the mineral, and is described according to the degree of brightnessfrom ‘splendent’ to ‘dull’. The terms to describe lustre are given in Table 2.2.
Table 2.1 Mohs’ scale of hardness.
10 diamond carbon
9 corundum alumina
8 topaz aluminium silicate
7 quartz silica scratches glass
6 feldspar alkali silicate scratched by a file
5 apatite calcium phosphate
4 fluorspar calcium fluoride
3 calcite calcium carbonate
2 gypsum hydrated calcium sulphate
1 talc hydrated magnesium silicate
Table 2.2 Descriptive terms for the lustre of minerals.
metallic like polished metal
mainly used in describing
submetallic less brilliant mineral ores and opaque
dull minerals
vitreous like broken glass
resinous oily sheen
silky like strands of fibre mainly for silicate minerals
parallel to surface
dull
Geology for civil engineers 8
www.angoothachaap.blogspot.com
www.angoothachaap.blogspot.com
CRYSTAL HABIT
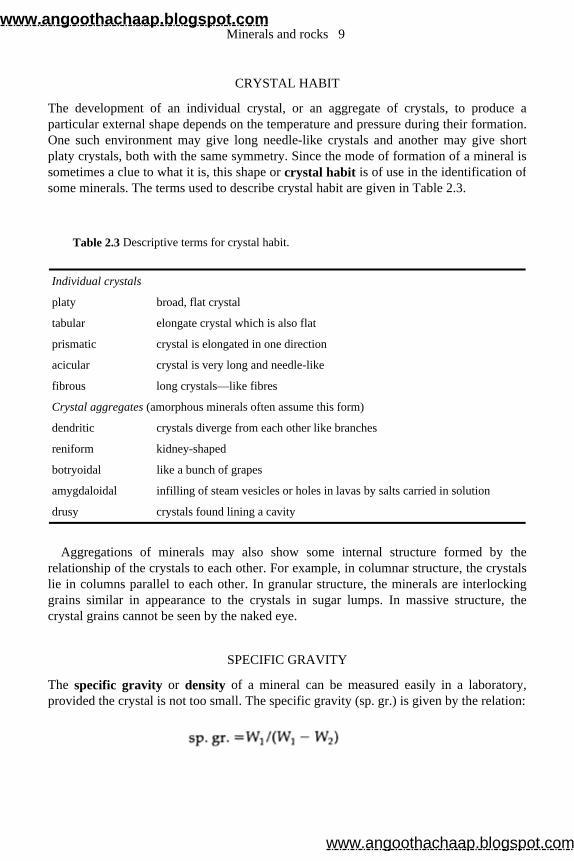
The development of an individual crystal, or an aggregate of crystals, to produce aparticular external shape depends on the temperature and pressure during their formation.One such environment may give long needle-like crystals and another may give shortplaty crystals, both with the same symmetry. Since the mode of formation of a mineral issometimes a clue to what it is, this shape or crystal habit is of use in the identification of some minerals. The terms used to describe crystal habit are given in Table 2.3.
Aggregations of minerals may also show some internal structure formed by therelationship of the crystals to each other. For example, in columnar structure, the crystalslie in columns parallel to each other. In granular structure, the minerals are interlockinggrains similar in appearance to the crystals in sugar lumps. In massive structure, thecrystal grains cannot be seen by the naked eye.
SPECIFIC GRAVITY
The specific gravity or density of a mineral can be measured easily in a laboratory, provided the crystal is not too small. The specific gravity (sp. gr.) is given by the relation:
Table 2.3 Descriptive terms for crystal habit.
Individual crystals
platy broad, flat crystal
tabular elongate crystal which is also flat
prismatic crystal is elongated in one direction
acicular crystal is very long and needle-like
fibrous long crystals—like fibres
Crystal aggregates (amorphous minerals often assume this form)
dendritic crystals diverge from each other like branches
reniform kidney-shaped
botryoidal like a bunch of grapes
amygdaloidal infilling of steam vesicles or holes in lavas by salts carried in solution
drusy crystals found lining a cavity
Minerals and rocks 9
www.angoothachaap.blogspot.com
www.angoothachaap.blogspot.com
where W 1 is the weight of the mineral grain in air, and W 2 is the weight in water. A steelyard apparatus such as the Walker Balance is commonly used. In the field such ameans of precision is not available, and the specific gravity of a mineral is estimated aslow, medium or high by the examiner. It is important to know which minerals havecomparable specific gravities:
(a) low specific gravity minerals include silicates, carbonates, sulphates and halides, with specific gravities ranging between 2.2 and 4.0;
(b) medium specific gravity minerals include metallic ores such as sulphides and oxides, with specific gravities between 4.5 and 7.5;
(c) high specific gravity minerals include native metallic elements such as pure copper, gold and silver; but these are rare minerals and are very unlikely to be encountered.
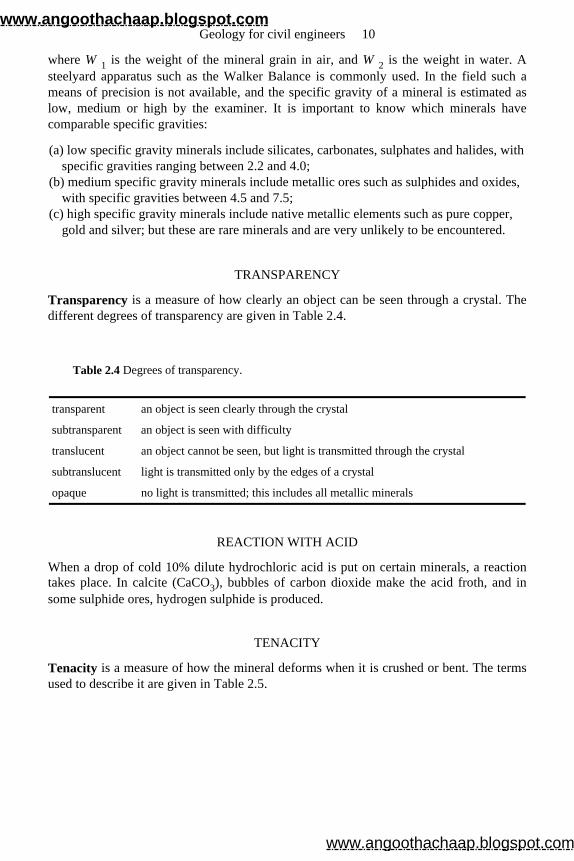
TRANSPARENCY
Transparency is a measure of how clearly an object can be seen through a crystal. The different degrees of transparency are given in Table 2.4.
REACTION WITH ACID
When a drop of cold 10% dilute hydrochloric acid is put on certain minerals, a reactiontakes place. In calcite (CaCO3), bubbles of carbon dioxide make the acid froth, and insome sulphide ores, hydrogen sulphide is produced.
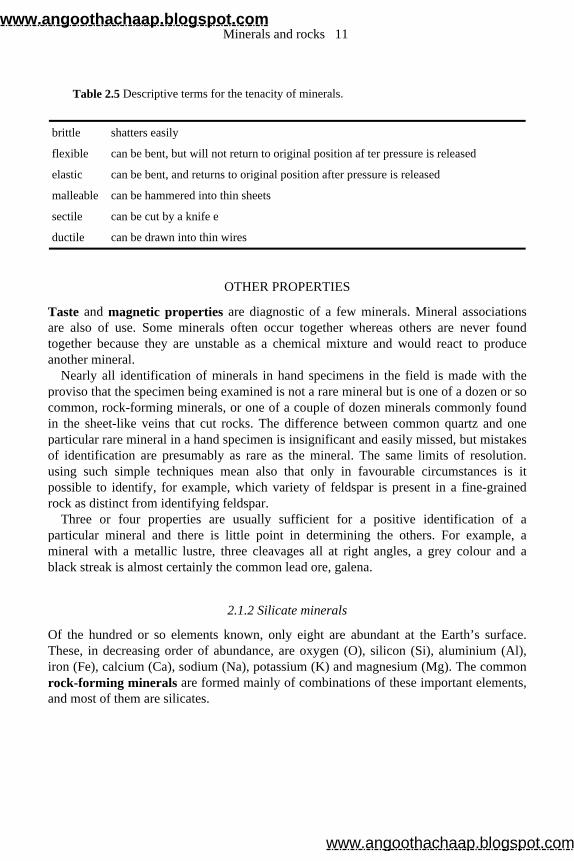
TENACITY
Tenacity is a measure of how the mineral deforms when it is crushed or bent. The termsused to describe it are given in Table 2.5.
Table 2.4 Degrees of transparency.
transparent an object is seen clearly through the crystal
subtransparent an object is seen with difficulty
translucent an object cannot be seen, but light is transmitted through the crystal
subtranslucent light is transmitted only by the edges of a crystal
opaque no light is transmitted; this includes all metallic minerals
Geology for civil engineers 10
www.angoothachaap.blogspot.com
www.angoothachaap.blogspot.com
OTHER PROPERTIES
Taste and magnetic properties are diagnostic of a few minerals. Mineral associationsare also of use. Some minerals often occur together whereas others are never foundtogether because they are unstable as a chemical mixture and would react to produceanother mineral.
Nearly all identification of minerals in hand specimens in the field is made with theproviso that the specimen being examined is not a rare mineral but is one of a dozen or socommon, rock-forming minerals, or one of a couple of dozen minerals commonly found in the sheet-like veins that cut rocks. The difference between common quartz and one particular rare mineral in a hand specimen is insignificant and easily missed, but mistakesof identification are presumably as rare as the mineral. The same limits of resolution.using such simple techniques mean also that only in favourable circumstances is itpossible to identify, for example, which variety of feldspar is present in a fine-grained rock as distinct from identifying feldspar.
Three or four properties are usually sufficient for a positive identification of a particular mineral and there is little point in determining the others. For example, amineral with a metallic lustre, three cleavages all at right angles, a grey colour and ablack streak is almost certainly the common lead ore, galena.
2.1.2 Silicate minerals
Of the hundred or so elements known, only eight are abundant at the Earth’s surface. These, in decreasing order of abundance, are oxygen (O), silicon (Si), aluminium (Al),iron (Fe), calcium (Ca), sodium (Na), potassium (K) and magnesium (Mg). The commonrock-forming minerals are formed mainly of combinations of these important elements,and most of them are silicates.
Table 2.5 Descriptive terms for the tenacity of minerals.
brittle shatters easily
flexible can be bent, but will not return to original position af ter pressure is released
elastic can be bent, and returns to original position after pressure is released
malleable can be hammered into thin sheets
sectile can be cut by a knife e
ductile can be drawn into thin wires
Minerals and rocks 11
www.angoothachaap.blogspot.com
www.angoothachaap.blogspot.com
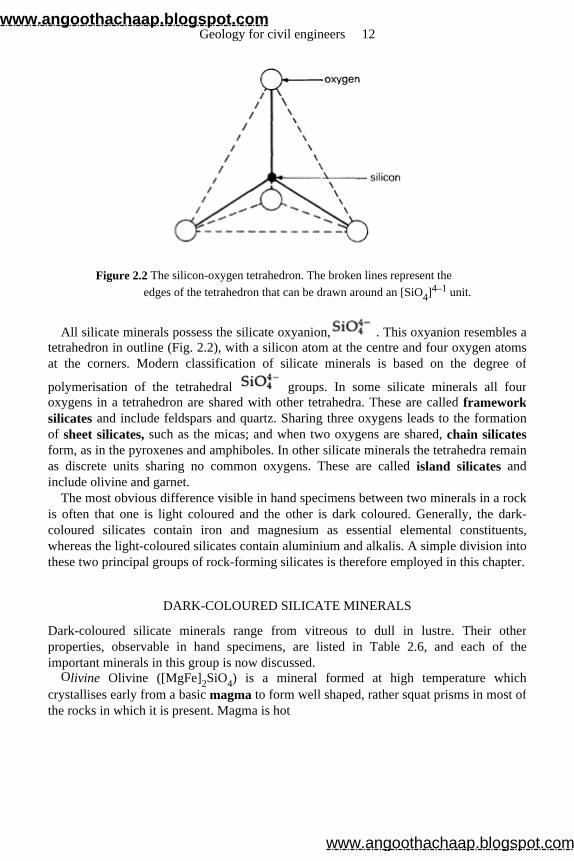
Figure 2.2 The silicon-oxygen tetrahedron. The broken lines represent the edges of the tetrahedron that can be drawn around an [SiO4]4–1 unit.
All silicate minerals possess the silicate oxyanion, . This oxyanion resembles a tetrahedron in outline (Fig. 2.2), with a silicon atom at the centre and four oxygen atomsat the corners. Modern classification of silicate minerals is based on the degree of
polymerisation of the tetrahedral groups. In some silicate minerals all four oxygens in a tetrahedron are shared with other tetrahedra. These are called framework silicates and include feldspars and quartz. Sharing three oxygens leads to the formationof sheet silicates, such as the micas; and when two oxygens are shared, chain silicatesform, as in the pyroxenes and amphiboles. In other silicate minerals the tetrahedra remainas discrete units sharing no common oxygens. These are called island silicates and include olivine and garnet.
The most obvious difference visible in hand specimens between two minerals in a rock is often that one is light coloured and the other is dark coloured. Generally, the dark-coloured silicates contain iron and magnesium as essential elemental constituents,whereas the light-coloured silicates contain aluminium and alkalis. A simple division intothese two principal groups of rock-forming silicates is therefore employed in this chapter.
DARK-COLOURED SILICATE MINERALS
Dark-coloured silicate minerals range from vitreous to dull in lustre. Their otherproperties, observable in hand specimens, are listed in Table 2.6, and each of the important minerals in this group is now discussed.
Olivine Olivine ([MgFe]2SiO4) is a mineral formed at high temperature which crystallises early from a basic magma to form well shaped, rather squat prisms in most of the rocks in which it is present. Magma is hot
Geology for civil engineers 12
www.angoothachaap.blogspot.com
www.angoothachaap.blogspot.com
liquid rock which, when consolidated, is known as igneous rock. Some crystals in igneous rocks may, however, show corroded crystal faces because of a reaction with thesurrounding magma before solidification was complete.
Pyroxene Pyroxene (X2Y2O6), where X may be calcium, iron or magnesium, and Y is silicon or aluminium, exists in many varieties, but the most important one in igneousrocks is the mineral augite, the properties of which are listed in Table 2.6. The atomic structure of augite consists of single chains of tetrahedra [SiO3] n linked laterally by calcium (Ca), magnesium (Mg) and iron (Fe) cations. The bonds between individualchains are relatively weak and the cleavage directions are parallel to the chains. Augitehas two cleavages parallel to the length of the mineral, which are seen to intersect at about 90° on the basal face of its crystal (Figs 2.3, 4 & 5). Augite is common in igneous rocks which have a relatively low percentage of silica, and frequently occurs with olivine.No hydroxyl group (OH) is present in either augite or olivine and both can be describedas ‘dry’ minerals. These minerals are rarely found in sediments since they alter easilywhen exposed to water and air (Section 2.1.5). They may be present in somemetamorphic rocks.
Hornblende Hornblende (x2–3Y5Z8O22(OH)2), where X may be calcium or sodium, Y may be magnesium or iron, and Z may be silicon or aluminium, belongs to the amphibolegroup of minerals, and its main physical properties are shown in Table 2.6. Its structure resembles that of augite and it has two cleavages parallel to its length, which are seen tointersect at about 124° on the basal face of its crystal (Figs 2.6 & 7). This angle of cleavage intersection is the most certain way of distinguishing hornblende from augite ina hand specimen.
Hornblende is a common mineral in igneous rocks (see Section 2.2.2) with average amounts of silica. It crystallises from magma containing appreciable amounts of waterand can be said to be a ‘wet’ mineral, since it contains hydroxyl groups in its structure. It is not very stable when weathered at the Earth’s surface and is rarely found in sediments. It is, however, a common constituent of metamorphic rocks (Section 2.2.5).
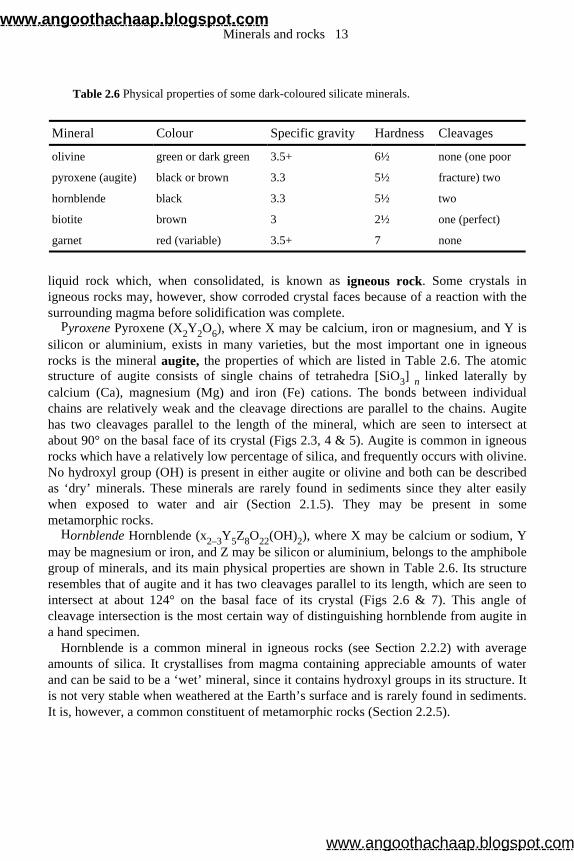
Table 2.6 Physical properties of some dark-coloured silicate minerals.
Mineral Colour Specific gravity Hardness Cleavages
olivine green or dark green 3.5+ 6½ none (one poor
pyroxene (augite) black or brown 3.3 5½ fracture) two
hornblende black 3.3 5½ two
biotite brown 3 2½ one (perfect)
garnet red (variable) 3.5+ 7 none
Minerals and rocks 13
www.angoothachaap.blogspot.com
www.angoothachaap.blogspot.com
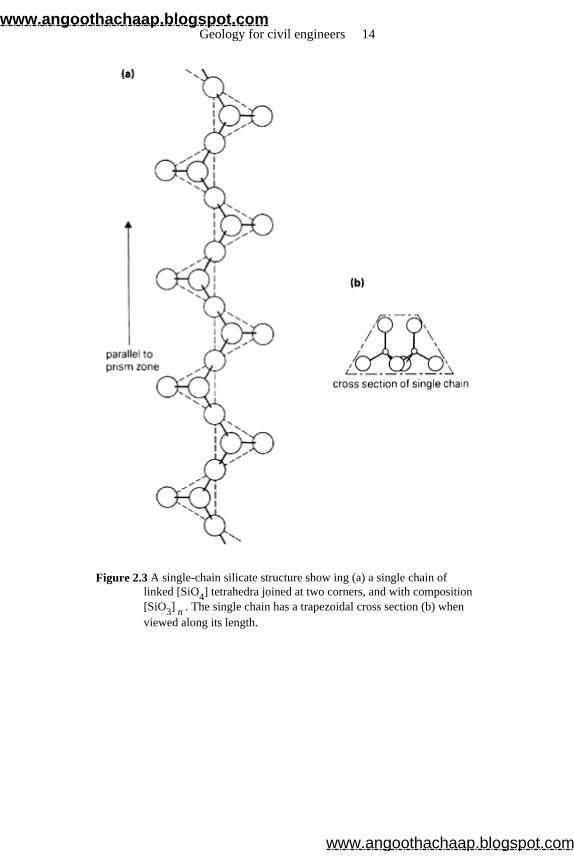
Figure 2.3 A single-chain silicate structure show ing (a) a single chain of linked [SiO4] tetrahedra joined at two corners, and with composition [SiO3] n . The single chain has a trapezoidal cross section (b) when viewed along its length.
Geology for civil engineers 14
www.angoothachaap.blogspot.com
www.angoothachaap.blogspot.com
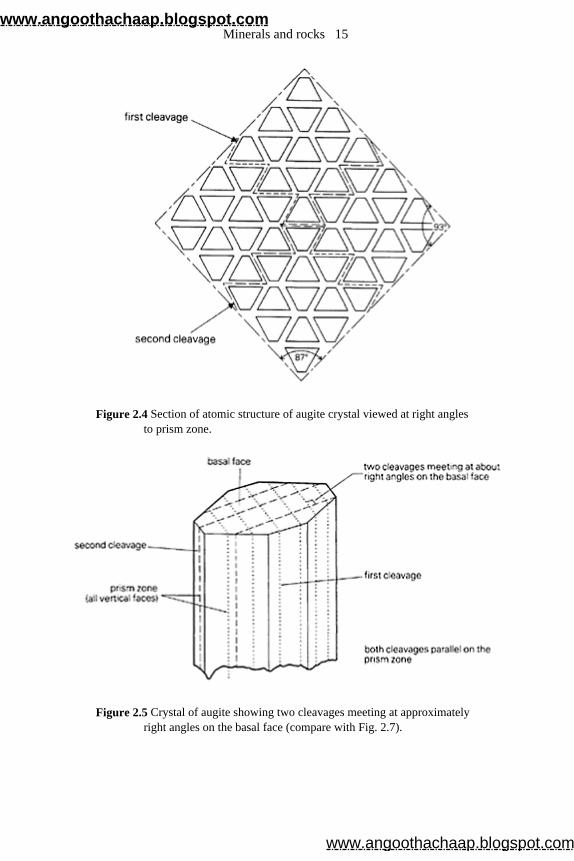
Figure 2.4 Section of atomic structure of augite crystal viewed at right angles to prism zone.
Figure 2.5 Crystal of augite showing two cleavages meeting at approximately right angles on the basal face (compare with Fig. 2.7).
Minerals and rocks 15
www.angoothachaap.blogspot.com
www.angoothachaap.blogspot.com
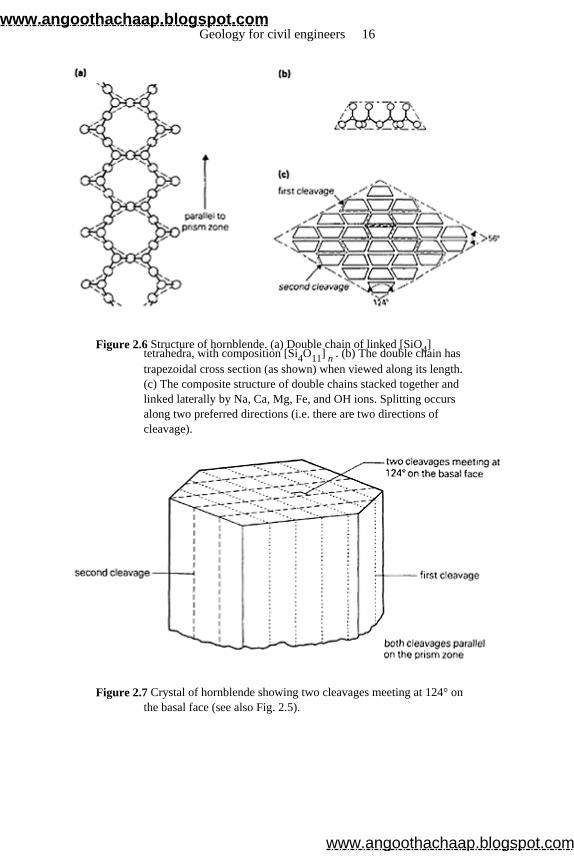
Figure 2.6 Structure of hornblende. (a) Double chain of linked [SiO4] tetrahedra, with composition [Si4O11] n . (b) The double chain has trapezoidal cross section (as shown) when viewed along its length. (c) The composite structure of double chains stacked together and linked laterally by Na, Ca, Mg, Fe, and OH ions. Splitting occurs along two preferred directions (i.e. there are two directions of cleavage).
Figure 2.7 Crystal of hornblende showing two cleavages meeting at 124° on the basal face (see also Fig. 2.5).
Geology for civil engineers 16
www.angoothachaap.blogspot.com
www.angoothachaap.blogspot.com
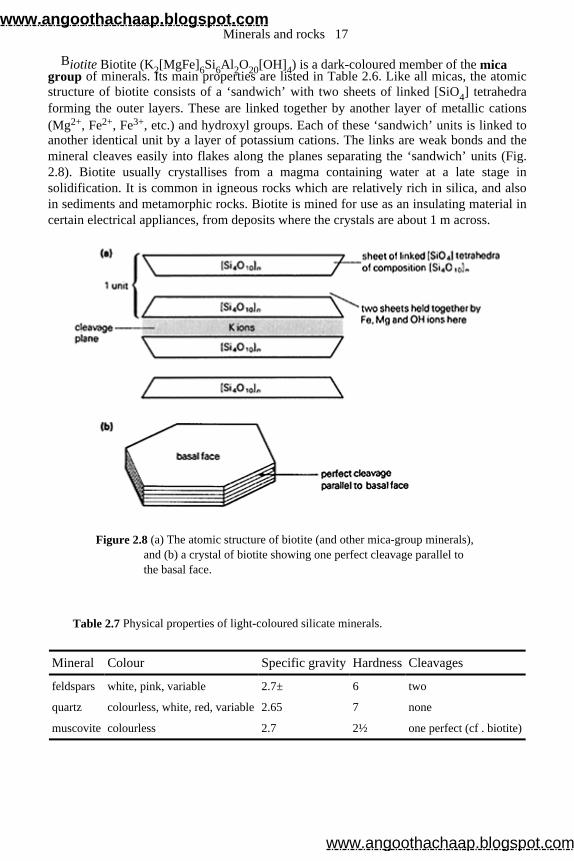
Biotite Biotite (K2[MgFe]6Si6Al2O20[OH]4) is a dark-coloured member of the mica group of minerals. Its main properties are listed in Table 2.6. Like all micas, the atomic structure of biotite consists of a ‘sandwich’ with two sheets of linked [SiO4] tetrahedra forming the outer layers. These are linked together by another layer of metallic cations(Mg2+, Fe2+, Fe3+, etc.) and hydroxyl groups. Each of these ‘sandwich’ units is linked to another identical unit by a layer of potassium cations. The links are weak bonds and themineral cleaves easily into flakes along the planes separating the ‘sandwich’ units (Fig. 2.8). Biotite usually crystallises from a magma containing water at a late stage in solidification. It is common in igneous rocks which are relatively rich in silica, and alsoin sediments and metamorphic rocks. Biotite is mined for use as an insulating material incertain electrical appliances, from deposits where the crystals are about 1 m across.
Figure 2.8 (a) The atomic structure of biotite (and other mica-group minerals), and (b) a crystal of biotite showing one perfect cleavage parallel to the basal face.
Table 2.7 Physical properties of light-coloured silicate minerals.
Mineral Colour Specific gravity Hardness Cleavages
feldspars white, pink, variable 2.7± 6 two
quartz colourless, white, red, variable 2.65 7 none
muscovite colourless 2.7 2½ one perfect (cf . biotite)
Minerals and rocks 17
www.angoothachaap.blogspot.com
www.angoothachaap.blogspot.com
Garnet Garnet , where R2+ may be ferrous iron, magnesium, calcium and manganese, and R3+ may be ferric iron, aluminium or chromium, has adistribution restricted largely to metamorphic rocks (Section 2.2.5). Its principal properties are given in Table 2.6. The most useful criteria to identify it in a hand specimen are its lack of cleavage and its hardness, which exceeds that of quartz. Thismakes it a useful high-quality abrasive in such applications as garnet (sand) paper.
LIGHT-COLOURED SILICATE MINERALS
The more important properties of light-coloured silicate minerals are listed in Table 2.7. Feldspars The chief members of the feldspar group of rock-forming silicates are K-
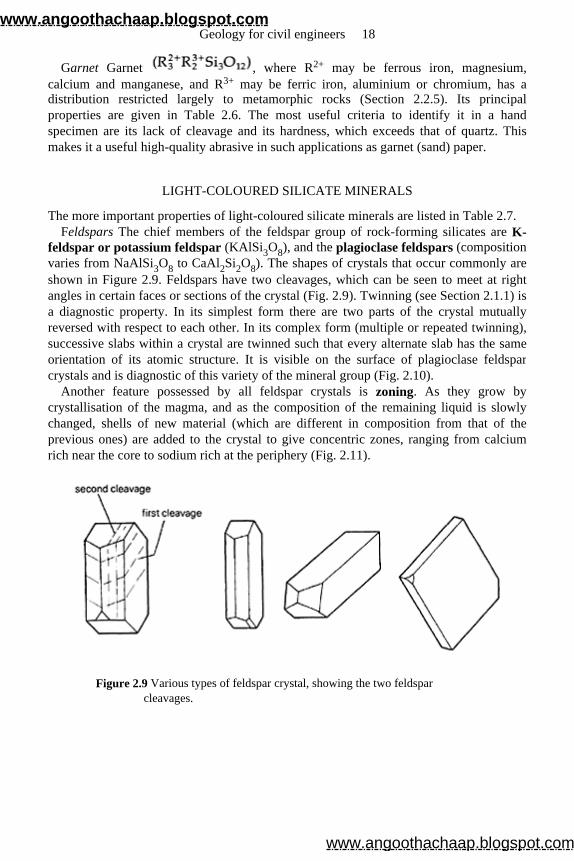
feldspar or potassium feldspar (KAlSi3O8), and the plagioclase feldspars (composition varies from NaAlSi3O8 to CaAl2Si2O8). The shapes of crystals that occur commonly areshown in Figure 2.9. Feldspars have two cleavages, which can be seen to meet at rightangles in certain faces or sections of the crystal (Fig. 2.9). Twinning (see Section 2.1.1) is a diagnostic property. In its simplest form there are two parts of the crystal mutuallyreversed with respect to each other. In its complex form (multiple or repeated twinning),successive slabs within a crystal are twinned such that every alternate slab has the sameorientation of its atomic structure. It is visible on the surface of plagioclase feldsparcrystals and is diagnostic of this variety of the mineral group (Fig. 2.10).
Another feature possessed by all feldspar crystals is zoning. As they grow by crystallisation of the magma, and as the composition of the remaining liquid is slowlychanged, shells of new material (which are different in composition from that of theprevious ones) are added to the crystal to give concentric zones, ranging from calciumrich near the core to sodium rich at the periphery (Fig. 2.11).
Figure 2.9 Various types of feldspar crystal, showing the two feldspar cleavages.
Geology for civil engineers 18
www.angoothachaap.blogspot.com
www.angoothachaap.blogspot.com
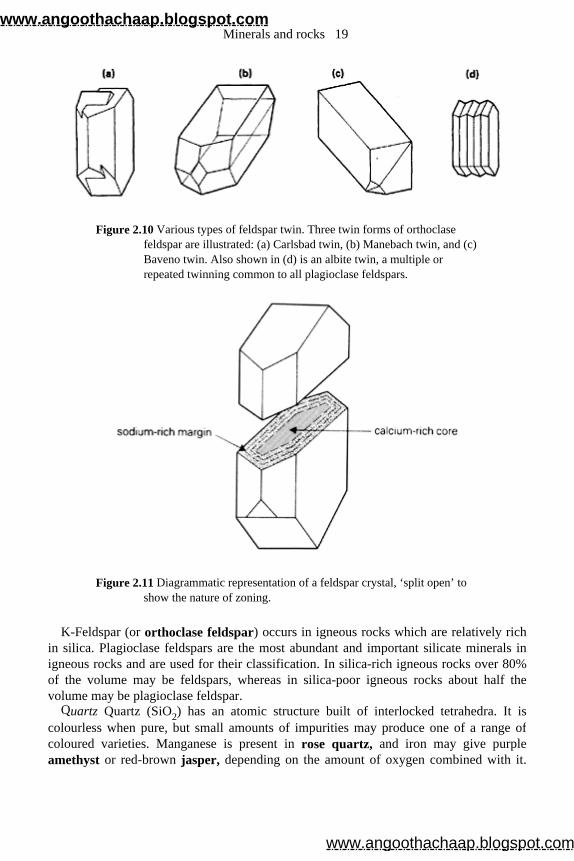
Figure 2.10 Various types of feldspar twin. Three twin forms of orthoclase feldspar are illustrated: (a) Carlsbad twin, (b) Manebach twin, and (c) Baveno twin. Also shown in (d) is an albite twin, a multiple or repeated twinning common to all plagioclase feldspars.
Figure 2.11 Diagrammatic representation of a feldspar crystal, ‘split open’ to show the nature of zoning.
K-Feldspar (or orthoclase feldspar) occurs in igneous rocks which are relatively richin silica. Plagioclase feldspars are the most abundant and important silicate minerals inigneous rocks and are used for their classification. In silica-rich igneous rocks over 80% of the volume may be feldspars, whereas in silica-poor igneous rocks about half the volume may be plagioclase feldspar.
Quartz Quartz (SiO2) has an atomic structure built of interlocked tetrahedra. It is colourless when pure, but small amounts of impurities may produce one of a range ofcoloured varieties. Manganese is present in rose quartz, and iron may give purple amethyst or red-brown jasper, depending on the amount of oxygen combined with it.
Minerals and rocks 19
www.angoothachaap.blogspot.com
www.angoothachaap.blogspot.com
Other varieties of silica are aggregates of very fine crystals, known in general aschalcedonic silica and, specifically, according to their lustre, colour and colour banding,as chert, flint, opal or agate. One of the differences between them lies in the watercontent.
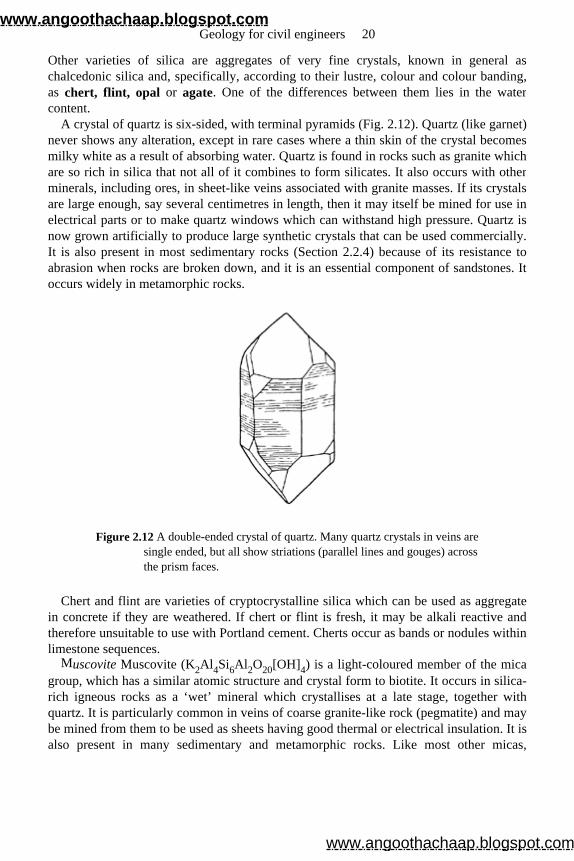
A crystal of quartz is six-sided, with terminal pyramids (Fig. 2.12). Quartz (like garnet) never shows any alteration, except in rare cases where a thin skin of the crystal becomesmilky white as a result of absorbing water. Quartz is found in rocks such as granite whichare so rich in silica that not all of it combines to form silicates. It also occurs with otherminerals, including ores, in sheet-like veins associated with granite masses. If its crystals are large enough, say several centimetres in length, then it may itself be mined for use inelectrical parts or to make quartz windows which can withstand high pressure. Quartz isnow grown artificially to produce large synthetic crystals that can be used commercially.It is also present in most sedimentary rocks (Section 2.2.4) because of its resistance to abrasion when rocks are broken down, and it is an essential component of sandstones. Itoccurs widely in metamorphic rocks.
Figure 2.12 A double-ended crystal of quartz. Many quartz crystals in veins are single ended, but all show striations (parallel lines and gouges) across the prism faces.
Chert and flint are varieties of cryptocrystalline silica which can be used as aggregatein concrete if they are weathered. If chert or flint is fresh, it may be alkali reactive andtherefore unsuitable to use with Portland cement. Cherts occur as bands or nodules withinlimestone sequences.
Muscovite Muscovite (K2Al4Si6Al2O20[OH]4) is a light-coloured member of the mica group, which has a similar atomic structure and crystal form to biotite. It occurs in silica-rich igneous rocks as a ‘wet’ mineral which crystallises at a late stage, together withquartz. It is particularly common in veins of coarse granite-like rock (pegmatite) and may be mined from them to be used as sheets having good thermal or electrical insulation. It isalso present in many sedimentary and metamorphic rocks. Like most other micas,
Geology for civil engineers 20
www.angoothachaap.blogspot.com
www.angoothachaap.blogspot.com
muscovite alters to clay minerals, particularly illite and montmorillonite. Sericite is a term used to describe fine-grained white micas. Such white micas are chemically similar to muscovite.
ALTERATION MINERALS
Many silicate minerals alter in the presence of air and water to form new, stable products.The most commonly altered minerals include the ferromagnesian silicates and thefeldspars.
Serpentine Serpentine (Mg3Si2O5[OH]4) is an alteration product which forms mainlyfrom olivine. Serpentine is green in colour with low specific gravity (2.6) and hardness(3½). The fibrous variety of serpentine (chrysotile) is a type of asbestos. Serpentine forms from olivine in the presence of water and free silica as follows:
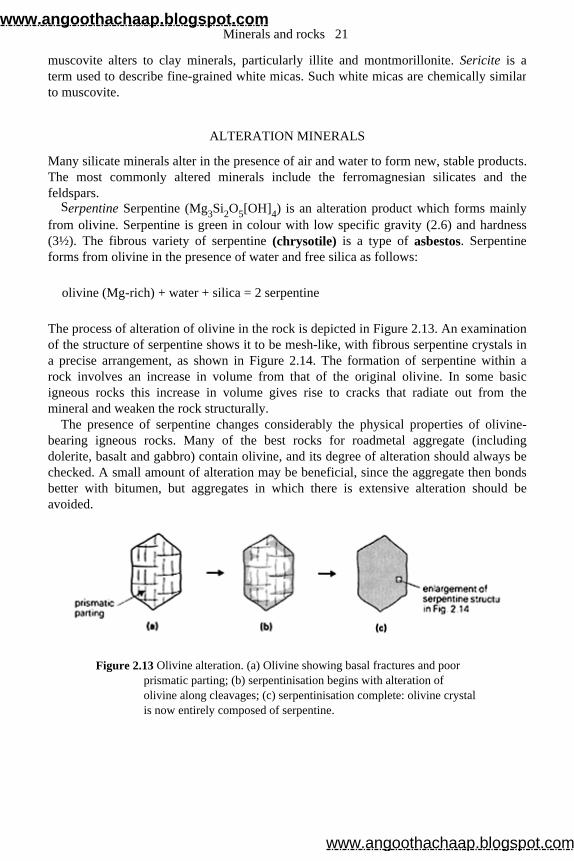
The process of alteration of olivine in the rock is depicted in Figure 2.13. An examination of the structure of serpentine shows it to be mesh-like, with fibrous serpentine crystals in a precise arrangement, as shown in Figure 2.14. The formation of serpentine within a rock involves an increase in volume from that of the original olivine. In some basicigneous rocks this increase in volume gives rise to cracks that radiate out from themineral and weaken the rock structurally.
The presence of serpentine changes considerably the physical properties of olivine-bearing igneous rocks. Many of the best rocks for roadmetal aggregate (includingdolerite, basalt and gabbro) contain olivine, and its degree of alteration should always bechecked. A small amount of alteration may be beneficial, since the aggregate then bondsbetter with bitumen, but aggregates in which there is extensive alteration should beavoided.
Figure 2.13 Olivine alteration. (a) Olivine showing basal fractures and poor prismatic parting; (b) serpentinisation begins with alteration of olivine along cleavages; (c) serpentinisation complete: olivine crystal is now entirely composed of serpentine.
olivine (Mg-rich) + water + silica = 2 serpentine
Minerals and rocks 21
www.angoothachaap.blogspot.com
www.angoothachaap.blogspot.com
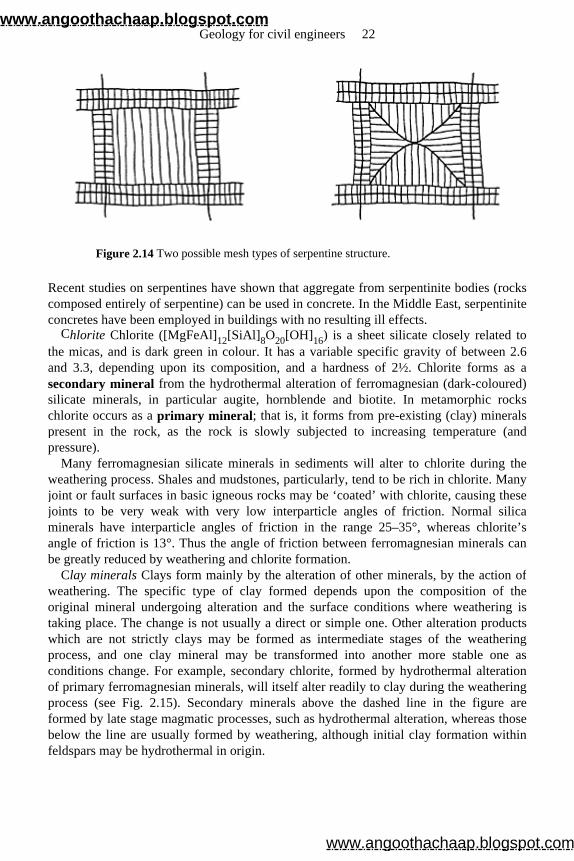
Figure 2.14 Two possible mesh types of serpentine structure.
Recent studies on serpentines have shown that aggregate from serpentinite bodies (rockscomposed entirely of serpentine) can be used in concrete. In the Middle East, serpentiniteconcretes have been employed in buildings with no resulting ill effects.
Chlorite Chlorite ([MgFeAl]12[SiAl]8O20[OH]16) is a sheet silicate closely related tothe micas, and is dark green in colour. It has a variable specific gravity of between 2.6and 3.3, depending upon its composition, and a hardness of 2½. Chlorite forms as a secondary mineral from the hydrothermal alteration of ferromagnesian (dark-coloured) silicate minerals, in particular augite, hornblende and biotite. In metamorphic rockschlorite occurs as a primary mineral; that is, it forms from pre-existing (clay) minerals present in the rock, as the rock is slowly subjected to increasing temperature (andpressure).
Many ferromagnesian silicate minerals in sediments will alter to chlorite during theweathering process. Shales and mudstones, particularly, tend to be rich in chlorite. Manyjoint or fault surfaces in basic igneous rocks may be ‘coated’ with chlorite, causing these joints to be very weak with very low interparticle angles of friction. Normal silicaminerals have interparticle angles of friction in the range 25–35°, whereas chlorite’s angle of friction is 13°. Thus the angle of friction between ferromagnesian minerals can be greatly reduced by weathering and chlorite formation.
Clay minerals Clays form mainly by the alteration of other minerals, by the action of weathering. The specific type of clay formed depends upon the composition of theoriginal mineral undergoing alteration and the surface conditions where weathering istaking place. The change is not usually a direct or simple one. Other alteration productswhich are not strictly clays may be formed as intermediate stages of the weatheringprocess, and one clay mineral may be transformed into another more stable one asconditions change. For example, secondary chlorite, formed by hydrothermal alterationof primary ferromagnesian minerals, will itself alter readily to clay during the weatheringprocess (see Fig. 2.15). Secondary minerals above the dashed line in the figure areformed by late stage magmatic processes, such as hydrothermal alteration, whereas thosebelow the line are usually formed by weathering, although initial clay formation withinfeldspars may be hydrothermal in origin.
Geology for civil engineers 22
www.angoothachaap.blogspot.com
www.angoothachaap.blogspot.com
Clay minerals are sheet silicates with densities betwen 2.5 and 3.0, depending on thetype of clay and its composition, and with low hardness (2 to 2½ (kaolin) and 1 to 2 for all other clays).
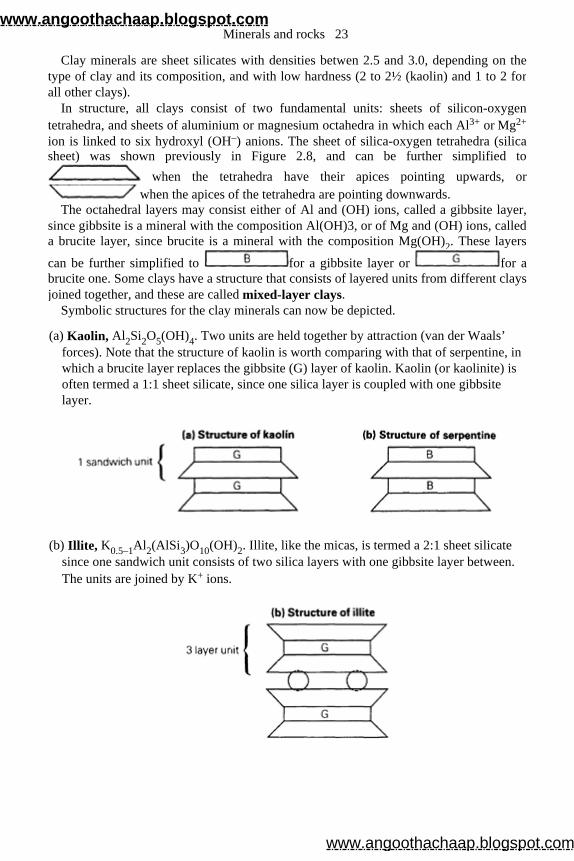
In structure, all clays consist of two fundamental units: sheets of silicon-oxygen tetrahedra, and sheets of aluminium or magnesium octahedra in which each Al3+ or Mg2+
ion is linked to six hydroxyl (OH–) anions. The sheet of silica-oxygen tetrahedra (silica sheet) was shown previously in Figure 2.8, and can be further simplified to
when the tetrahedra have their apices pointing upwards, or when the apices of the tetrahedra are pointing downwards.
The octahedral layers may consist either of Al and (OH) ions, called a gibbsite layer, since gibbsite is a mineral with the composition Al(OH)3, or of Mg and (OH) ions, calleda brucite layer, since brucite is a mineral with the composition Mg(OH)2. These layers
can be further simplified to for a gibbsite layer or for a brucite one. Some clays have a structure that consists of layered units from different claysjoined together, and these are called mixed-layer clays.
Symbolic structures for the clay minerals can now be depicted.
(a) Kaolin, Al2Si2O5(OH)4. Two units are held together by attraction (van der Waals’ forces). Note that the structure of kaolin is worth comparing with that of serpentine, in which a brucite layer replaces the gibbsite (G) layer of kaolin. Kaolin (or kaolinite) is often termed a 1:1 sheet silicate, since one silica layer is coupled with one gibbsite layer.
(b) Illite, K0.5–1Al2(AlSi3)O10(OH)2. Illite, like the micas, is termed a 2:1 sheet silicate since one sandwich unit consists of two silica layers with one gibbsite layer between. The units are joined by K+ ions.
Minerals and rocks 23
www.angoothachaap.blogspot.com
www.angoothachaap.blogspot.com
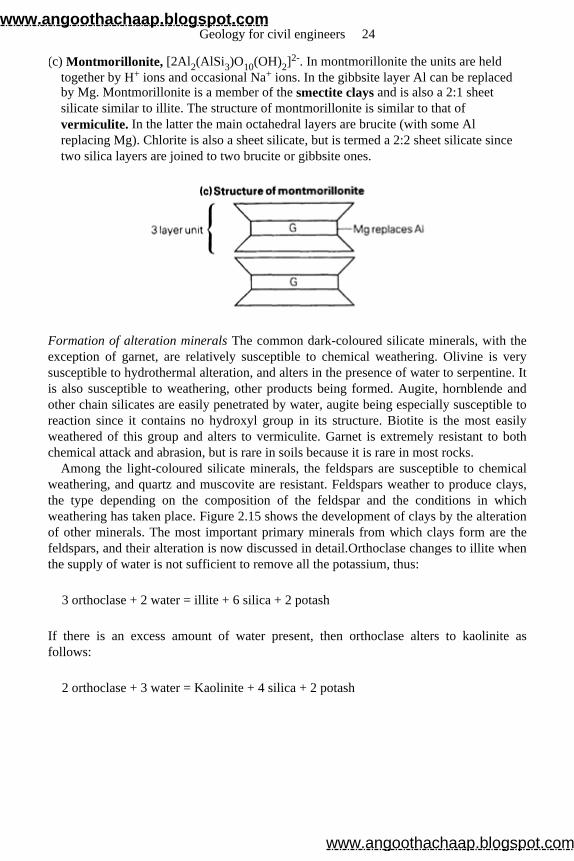
(c) Montmorillonite, [2Al2(AlSi3)O10(OH)2]2-. In montmorillonite the units are held together by H+ ions and occasional Na+ ions. In the gibbsite layer Al can be replaced by Mg. Montmorillonite is a member of the smectite clays and is also a 2:1 sheet silicate similar to illite. The structure of montmorillonite is similar to that of vermiculite. In the latter the main octahedral layers are brucite (with some Al replacing Mg). Chlorite is also a sheet silicate, but is termed a 2:2 sheet silicate since two silica layers are joined to two brucite or gibbsite ones.
Formation of alteration minerals The common dark-coloured silicate minerals, with the exception of garnet, are relatively susceptible to chemical weathering. Olivine is verysusceptible to hydrothermal alteration, and alters in the presence of water to serpentine. Itis also susceptible to weathering, other products being formed. Augite, hornblende andother chain silicates are easily penetrated by water, augite being especially susceptible toreaction since it contains no hydroxyl group in its structure. Biotite is the most easily weathered of this group and alters to vermiculite. Garnet is extremely resistant to bothchemical attack and abrasion, but is rare in soils because it is rare in most rocks.
Among the light-coloured silicate minerals, the feldspars are susceptible to chemicalweathering, and quartz and muscovite are resistant. Feldspars weather to produce clays,the type depending on the composition of the feldspar and the conditions in whichweathering has taken place. Figure 2.15 shows the development of clays by the alteration of other minerals. The most important primary minerals from which clays form are thefeldspars, and their alteration is now discussed in detail.Orthoclase changes to illite whenthe supply of water is not sufficient to remove all the potassium, thus:
If there is an excess amount of water present, then orthoclase alters to kaolinite asfollows:
3 orthoclase + 2 water = illite + 6 silica + 2 potash
2 orthoclase + 3 water = Kaolinite + 4 silica + 2 potash
Geology for civil engineers 24
www.angoothachaap.blogspot.com
www.angoothachaap.blogspot.com
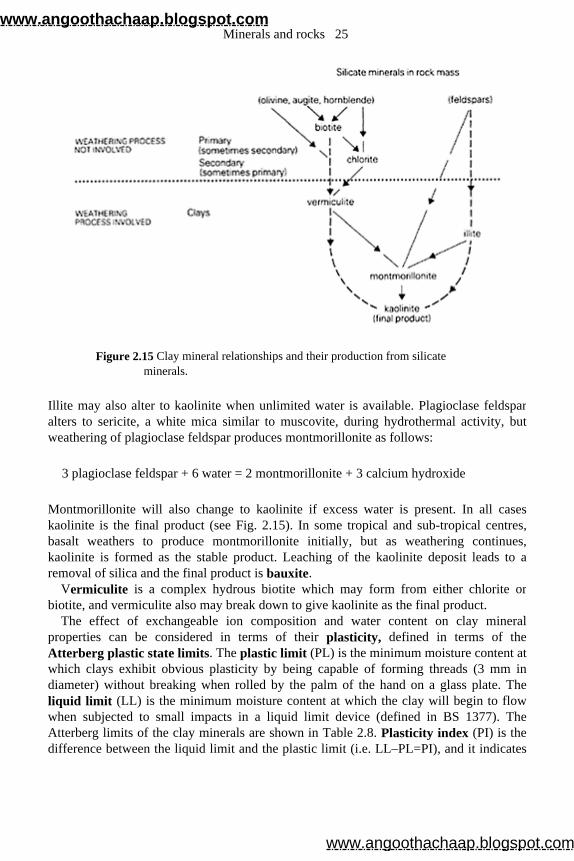
Figure 2.15 Clay mineral relationships and their production from silicate minerals.
Illite may also alter to kaolinite when unlimited water is available. Plagioclase feldsparalters to sericite, a white mica similar to muscovite, during hydrothermal activity, butweathering of plagioclase feldspar produces montmorillonite as follows:
Montmorillonite will also change to kaolinite if excess water is present. In all caseskaolinite is the final product (see Fig. 2.15). In some tropical and sub-tropical centres, basalt weathers to produce montmorillonite initially, but as weathering continues,kaolinite is formed as the stable product. Leaching of the kaolinite deposit leads to aremoval of silica and the final product is bauxite.
Vermiculite is a complex hydrous biotite which may form from either chlorite or biotite, and vermiculite also may break down to give kaolinite as the final product.
The effect of exchangeable ion composition and water content on clay mineral properties can be considered in terms of their plasticity, defined in terms of the Atterberg plastic state limits. The plastic limit (PL) is the minimum moisture content at which clays exhibit obvious plasticity by being capable of forming threads (3 mm indiameter) without breaking when rolled by the palm of the hand on a glass plate. Theliquid limit (LL) is the minimum moisture content at which the clay will begin to flow when subjected to small impacts in a liquid limit device (defined in BS 1377). TheAtterberg limits of the clay minerals are shown in Table 2.8. Plasticity index (PI) is the difference between the liquid limit and the plastic limit (i.e. LL–PL=PI), and it indicates
3 plagioclase feldspar + 6 water = 2 montmorillonite + 3 calcium hydroxide
Minerals and rocks 25
www.angoothachaap.blogspot.com
www.angoothachaap.blogspot.com
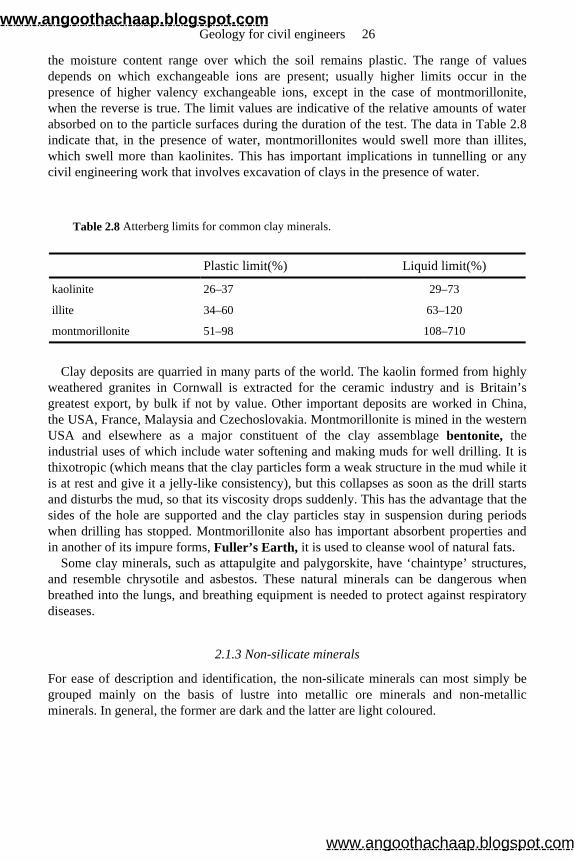
the moisture content range over which the soil remains plastic. The range of valuesdepends on which exchangeable ions are present; usually higher limits occur in thepresence of higher valency exchangeable ions, except in the case of montmorillonite,when the reverse is true. The limit values are indicative of the relative amounts of waterabsorbed on to the particle surfaces during the duration of the test. The data in Table 2.8indicate that, in the presence of water, montmorillonites would swell more than illites,which swell more than kaolinites. This has important implications in tunnelling or anycivil engineering work that involves excavation of clays in the presence of water.
Clay deposits are quarried in many parts of the world. The kaolin formed from highlyweathered granites in Cornwall is extracted for the ceramic industry and is Britain’s greatest export, by bulk if not by value. Other important deposits are worked in China,the USA, France, Malaysia and Czechoslovakia. Montmorillonite is mined in the western USA and elsewhere as a major constituent of the clay assemblage bentonite, the industrial uses of which include water softening and making muds for well drilling. It isthixotropic (which means that the clay particles form a weak structure in the mud while itis at rest and give it a jelly-like consistency), but this collapses as soon as the drill startsand disturbs the mud, so that its viscosity drops suddenly. This has the advantage that thesides of the hole are supported and the clay particles stay in suspension during periodswhen drilling has stopped. Montmorillonite also has important absorbent properties andin another of its impure forms, Fuller’s Earth, it is used to cleanse wool of natural fats.
Some clay minerals, such as attapulgite and palygorskite, have ‘chaintype’ structures, and resemble chrysotile and asbestos. These natural minerals can be dangerous whenbreathed into the lungs, and breathing equipment is needed to protect against respiratorydiseases.
2.1.3 Non-silicate minerals
For ease of description and identification, the non-silicate minerals can most simply begrouped mainly on the basis of lustre into metallic ore minerals and non-metallic minerals. In general, the former are dark and the latter are light coloured.
Table 2.8 Atterberg limits for common clay minerals.
Plastic limit(%) Liquid limit(%)
kaolinite 26–37 29–73
illite 34–60 63–120
montmorillonite 51–98 108–710
Geology for civil engineers 26
www.angoothachaap.blogspot.com
www.angoothachaap.blogspot.com
METALLIC ORE MINERALS
Nearly all ore minerals are chemically simple substances such as native elements,sulphides (where a metallic element is combined with sulphur), or oxides (where a metalis combined with oxygen). Native elements, such as copper, silver or gold, occur onlyrarely. Sulphides, except for pyrite, are not quite as rare, but are of importance only whenthey are relatively concentrated into veins in quantities where they can be worked assources of metals. The common ore minerals, present in most rocks in small quantities,are oxides, although argillaceous sedimentary rocks and low-grade fissile metamorphic rocks usually contain sulphides.
If iron ores are present in large quantities (>5%) in aggregates from crushed igneous rock, they may weather and discolour any concrete made from them. Magnetite is oftenpresent in large quantities in basic igneous rocks (basalts, dolerites) and its presence mayaffect electrical equipment and compasses.
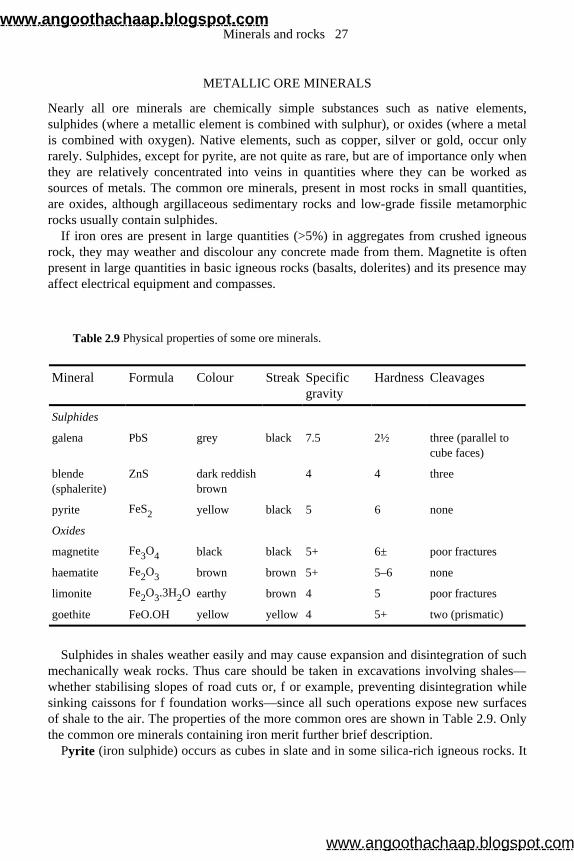
Sulphides in shales weather easily and may cause expansion and disintegration of such mechanically weak rocks. Thus care should be taken in excavations involving shales—whether stabilising slopes of road cuts or, f or example, preventing disintegration whilesinking caissons for f foundation works—since all such operations expose new surfacesof shale to the air. The properties of the more common ores are shown in Table 2.9. Only the common ore minerals containing iron merit further brief description.
Pyrite (iron sulphide) occurs as cubes in slate and in some silica-rich igneous rocks. It
Table 2.9 Physical properties of some ore minerals.
Mineral Formula Colour Streak Specific gravity
Hardness Cleavages
Sulphides
galena PbS grey black 7.5 2½ three (parallel to cube faces)
blende (sphalerite)
ZnS dark reddish brown
4 4 three
pyrite FeS2 yellow black 5 6 none
Oxides
magnetite Fe3O4 black black 5+ 6± poor fractures
haematite Fe2O3 brown brown 5+ 5–6 none
limonite Fe2O3.3H2O earthy brown 4 5 poor fractures
goethite FeO.OH yellow yellow 4 5+ two (prismatic)
Minerals and rocks 27
www.angoothachaap.blogspot.com
www.angoothachaap.blogspot.com
has been worked for its sulphur content (not its iron) in the past, but the large amount ofsulphur obtained as a by-product of gas or oil refining has changed this. Another sulphidemineral, pyrrhotite, is found in slates and shales and can weather easily.
Magnetite occurs in most igneous rocks, especially basic varieties such as gabbro andbasalt, where it may constitute up to 15% of the rock’s volume. In an acid rock such as granite, magnetite constitutes only about 1% by volume. It is present in metamorphicrocks but is rarely an important constituent. Magnetite grains are present in sandstonesand other sedimentary rocks and may be concentrated by natural panning (it has a higherspecific gravity than most mineral grains in sand) to a degree to which it may, in rarecases, form the bulk of the deposit and be worth exploiting as a source of iron.
Haematite occurs widely in all sorts of rocks and is also concentrated into veins, where it may be exploited as an economic iron ore. It is the cement that binds grainstogether in red sandstones. Limonite and goethite are formed by the combination of iron oxide with water.
NON-METALLIC, NON-SILICATE MINERALS
The most common minerals in this group are calcite (a carbonate) and gypsum (asulphate). All have white or colourless streaks. They are often found in veins, togetherwith metallic ores. In veins such minerals, together with fluorite and barite, are calledgangue minerals, in contrast to the metallic ores. The properties of the more importantminerals in this group are listed in Table 2.10.
Calcite is an essential mineral in limestones and may be present in many sedimentary rocks as the cement matrix. It is the principal constituent of marble. Limestone depositsmay be crushed to a fine powder and used as agricultural lime. The neutralising value ofany calcite limestone deposit must be known for this purpose, and in many regionsagricultural lime with a higher MgO content may be preferred; that is, the limestone willbe composed of both calcite and dolomite. In many countries of the Middle East,limestones are widespread and may be the only material available to use as a crushedrock aggregate for concrete or roads. Limestones are also the most important constituentin the manufacture of cement.
Gypsum and its associated mineral, anhydrite, are called evaporites, being formed by precipitation of salts from sea water that has evaporated. These evaporite deposits arecommon in rock formations of Permo-Trias age. In desert regions, gypsum may be found on the surface of the desert as clusters of flat crystals called desert roses. Salt-flats (sabkhas or sebchas) are widespread in desert regions (see Section 2.2.4), particularly on the coast, and the engineer must be wary of using any such material in building works.Gypsum is mined throughout the world and has many uses; for example ‘panelling’ made of crushed gypsum (gyproc) is widely used in buildings for inner wall claddings becauseof its excellent fire-resistant and soundproofing qualities. Calcium sulphate is also usedas plaster of Paris.
Geology for civil engineers 28
www.angoothachaap.blogspot.com
www.angoothachaap.blogspot.com
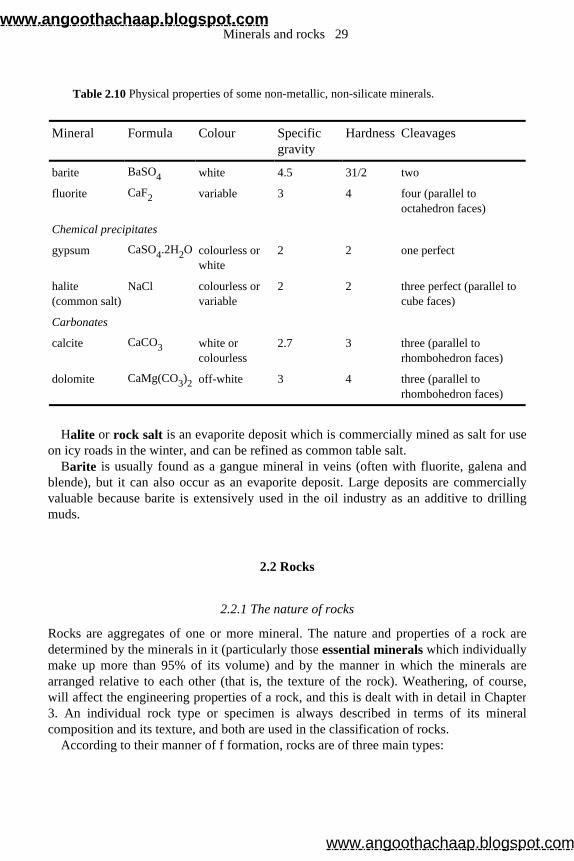
Halite or rock salt is an evaporite deposit which is commercially mined as salt for use on icy roads in the winter, and can be refined as common table salt.
Barite is usually found as a gangue mineral in veins (often with fluorite, galena andblende), but it can also occur as an evaporite deposit. Large deposits are commerciallyvaluable because barite is extensively used in the oil industry as an additive to drillingmuds.
2.2 Rocks
2.2.1 The nature of rocks
Rocks are aggregates of one or more mineral. The nature and properties of a rock aredetermined by the minerals in it (particularly those essential minerals which individually make up more than 95% of its volume) and by the manner in which the minerals arearranged relative to each other (that is, the texture of the rock). Weathering, of course,will affect the engineering properties of a rock, and this is dealt with in detail in Chapter 3. An individual rock type or specimen is always described in terms of its mineral composition and its texture, and both are used in the classification of rocks.
According to their manner of f formation, rocks are of three main types:
Table 2.10 Physical properties of some non-metallic, non-silicate minerals.
Mineral Formula Colour Specific gravity
Hardness Cleavages
barite BaSO4 white 4.5 31/2 two
fluorite CaF2 variable 3 4 four (parallel to octahedron faces)
Chemical precipitates
gypsum CaSO4.2H2O colourless or white
2 2 one perfect
halite (common salt)
NaCl colourless or variable
2 2 three perfect (parallel to cube faces)
Carbonates
calcite CaCO3 white or colourless
2.7 3 three (parallel to rhombohedron faces)
dolomite CaMg(CO3)2 off-white 3 4 three (parallel to rhombohedron faces)
Minerals and rocks 29
www.angoothachaap.blogspot.com
www.angoothachaap.blogspot.com
Igneous rocks are formed from magma, which has originated well below the surface,has ascended towards the surface, and has crystallised as solid rock either on the surfaceor deep within the Earth’s crust as its temperature fell.
Sedimentary rocks are formed by the accumulation and compaction of (a) fragmentsfrom pre-existing rocks which have been disintegrated by erosion (see Section 3.2.1); (b) organic debris such as shell fragments or dead plants; or (c) material dissolved in surfacewaters (rivers, oceans, etc.) or ground water (Section 5.2.2), which is precipitated in conditions of oversaturation.
Metamorphic rocks are formed from pre-existing rocks of any type, which have been subjected to increases of temperature (T) or pressure (P) or both, such that the rocks undergo change. This change results in the metamorphic rock being different from theoriginal parental material in appearance, texture and mineral composition.
2.2.2 Igneous rocks
MINERALOGY OF IGNEOUS ROCKS
Many different types of mineral occur in igneous rocks, but only about eight (see Table 2.11) are normally present as essential constituents of a rock. Which of the eight arepresent is controlled primarily by the composition of the magma. Each mineral starts tocrystallise at a particular temperature and continues to form throughout a limitedtemperature range as the magma cools. More than one mineral is usually forming at anyone time. Since the crystals formed early have a higher specific gravity than theremaining liquid of the magma, they settle downwards. Alternatively, the two fractions,crystals and liquid, may be separated by some other process. As time progresses, differentminerals crystallise from the magma. Eventually this process gives rise to a sequence oflayers of minerals of different composition, from high-temperature, highspecific gravity minerals at the bottom, to low-temperature, low-specific gravity minerals at the top. Such a magma is said to be differentiated. When consolidated, the highest temperature layerof minerals at the bottom, consisting of olivine, calcium-rich plagioclase and often augite, will form an ultrabasic igneous rock. At relatively low temperatures, the last of the magmatic liquid solidifies into rock that contains quartz, orthoclase, sodium-rich plagioclase and micas. Because of its relative richness in silica, it is called an acid rock. These relationships are given in Table 2.11. A partial classification by grouping igneous rocks according to their mineral compositions, and hence percentage of silica, is shown inFigure 2.16. The boundaries between the four main groups of igneous rock are arbitrarydivisions of what are really gradational changes in composition, but they are drawn insuch a way that the presence or absence of certain minerals such as quartz and olivineallows a rock to be put at the acidic or basic ends of the scale (Table 2.12).
Geology for civil engineers 30
www.angoothachaap.blogspot.com
www.angoothachaap.blogspot.com
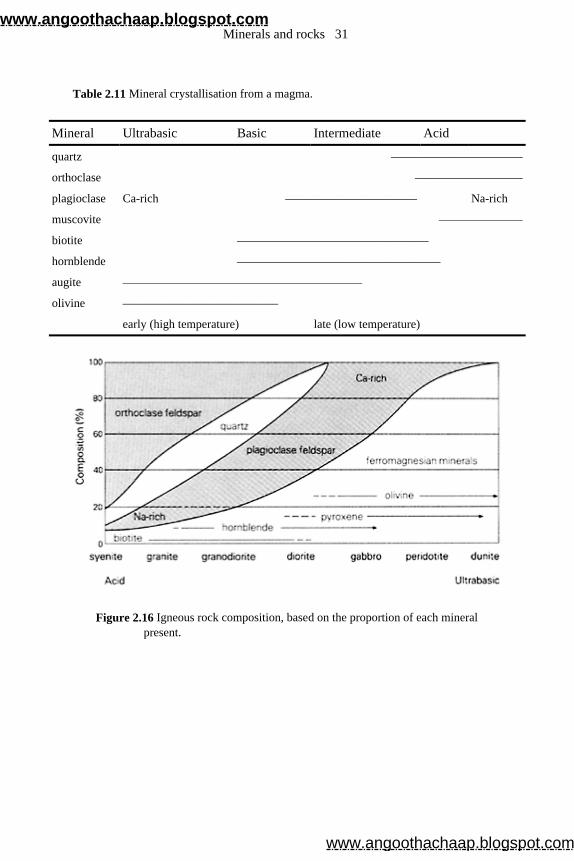
Figure 2.16 Igneous rock composition, based on the proportion of each mineral present.
Table 2.11 Mineral crystallisation from a magma.
Mineral Ultrabasic Basic Intermediate Acid
quartz ———————————
orthoclase —————————
plagioclase Ca-rich ——————————— Na-rich
muscovite ———————
biotite ————————————————
hornblende —————————————————
augite ————————————————————
olivine —————————————
early (high temperature) late (low temperature)
Minerals and rocks 31
www.angoothachaap.blogspot.com
www.angoothachaap.blogspot.com
TEXTURES OF IGNEOUS ROCKS
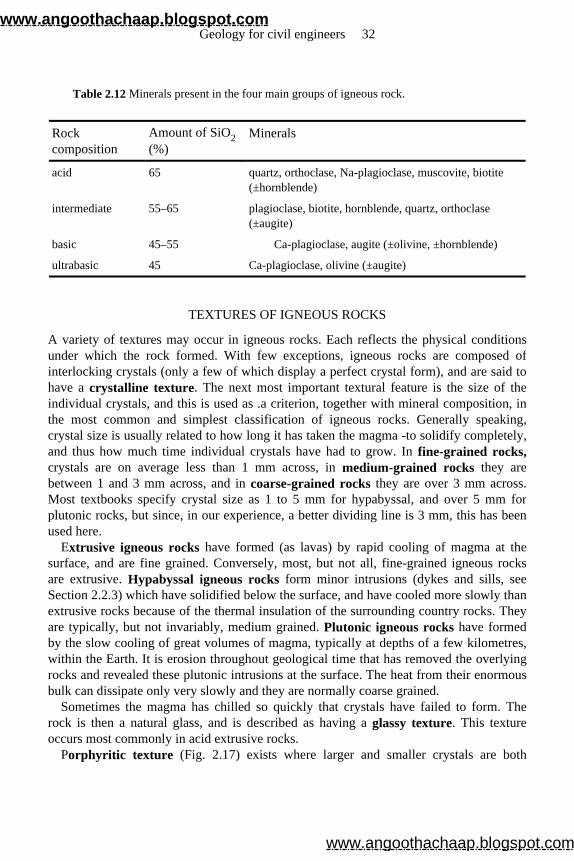
A variety of textures may occur in igneous rocks. Each reflects the physical conditionsunder which the rock formed. With few exceptions, igneous rocks are composed ofinterlocking crystals (only a few of which display a perfect crystal form), and are said tohave a crystalline texture. The next most important textural feature is the size of the individual crystals, and this is used as .a criterion, together with mineral composition, inthe most common and simplest classification of igneous rocks. Generally speaking,crystal size is usually related to how long it has taken the magma -to solidify completely, and thus how much time individual crystals have had to grow. In fine-grained rocks,crystals are on average less than 1 mm across, in medium-grained rocks they are between 1 and 3 mm across, and in coarse-grained rocks they are over 3 mm across. Most textbooks specify crystal size as 1 to 5 mm for hypabyssal, and over 5 mm forplutonic rocks, but since, in our experience, a better dividing line is 3 mm, this has beenused here.
Extrusive igneous rocks have formed (as lavas) by rapid cooling of magma at thesurface, and are fine grained. Conversely, most, but not all, fine-grained igneous rocks are extrusive. Hypabyssal igneous rocks form minor intrusions (dykes and sills, seeSection 2.2.3) which have solidified below the surface, and have cooled more slowly thanextrusive rocks because of the thermal insulation of the surrounding country rocks. Theyare typically, but not invariably, medium grained. Plutonic igneous rocks have formed by the slow cooling of great volumes of magma, typically at depths of a few kilometres,within the Earth. It is erosion throughout geological time that has removed the overlyingrocks and revealed these plutonic intrusions at the surface. The heat from their enormousbulk can dissipate only very slowly and they are normally coarse grained.
Sometimes the magma has chilled so quickly that crystals have failed to form. The rock is then a natural glass, and is described as having a glassy texture. This texture occurs most commonly in acid extrusive rocks.
Porphyritic texture (Fig. 2.17) exists where larger and smaller crystals are both
Table 2.12 Minerals present in the four main groups of igneous rock.
Rock composition
Amount of SiO2(%)
Minerals
acid 65 quartz, orthoclase, Na-plagioclase, muscovite, biotite (±hornblende)
intermediate 55–65 plagioclase, biotite, hornblende, quartz, orthoclase (±augite)
basic 45–55 Ca-plagioclase, augite (±olivine, ±hornblende)
ultrabasic 45 Ca-plagioclase, olivine (±augite)
Geology for civil engineers 32
www.angoothachaap.blogspot.com
www.angoothachaap.blogspot.com
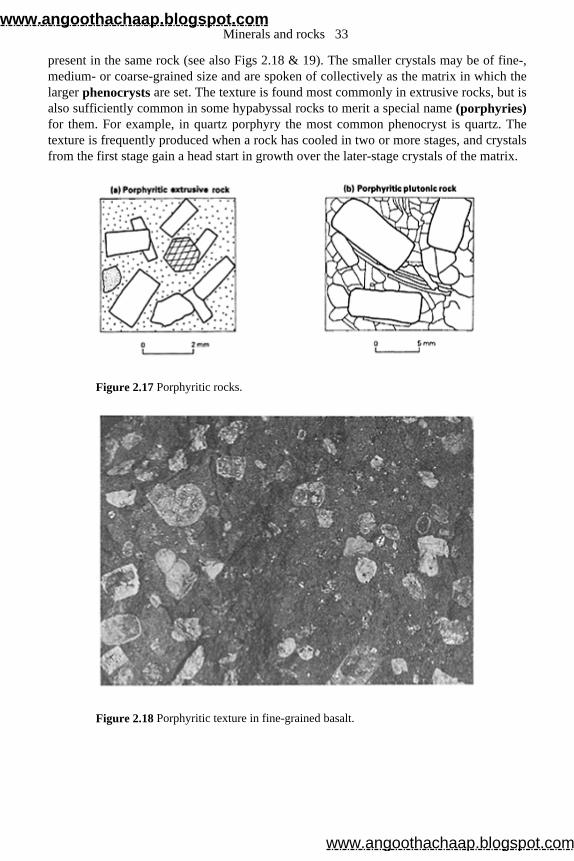
present in the same rock (see also Figs 2.18 & 19). The smaller crystals may be of fine-, medium- or coarse-grained size and are spoken of collectively as the matrix in which the larger phenocrysts are set. The texture is found most commonly in extrusive rocks, but isalso sufficiently common in some hypabyssal rocks to merit a special name (porphyries)for them. For example, in quartz porphyry the most common phenocryst is quartz. Thetexture is frequently produced when a rock has cooled in two or more stages, and crystalsfrom the first stage gain a head start in growth over the later-stage crystals of the matrix.
Figure 2.17 Porphyritic rocks.
Figure 2.18 Porphyritic texture in fine-grained basalt.
Minerals and rocks 33
www.angoothachaap.blogspot.com
www.angoothachaap.blogspot.com
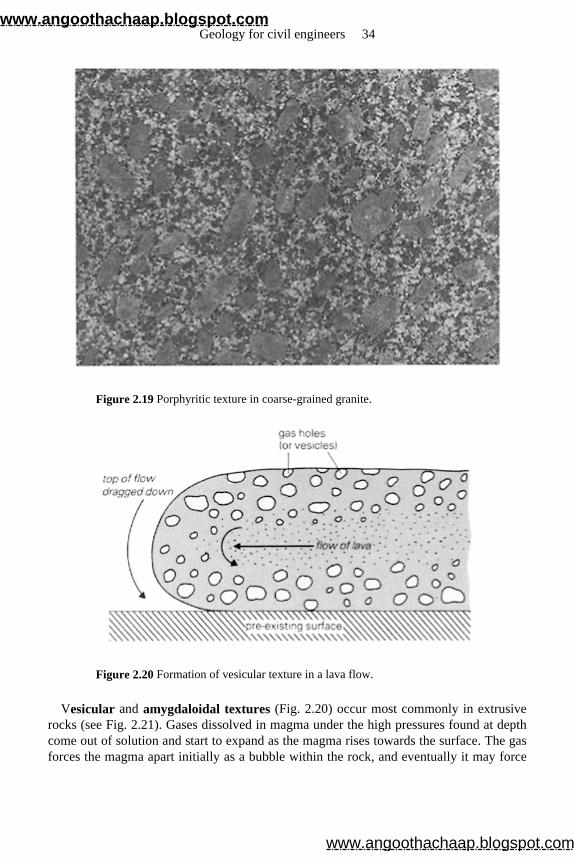
Figure 2.19 Porphyritic texture in coarse-grained granite.
Figure 2.20 Formation of vesicular texture in a lava flow.
Vesicular and amygdaloidal textures (Fig. 2.20) occur most commonly in extrusive rocks (see Fig. 2.21). Gases dissolved in magma under the high pressures found at depth come out of solution and start to expand as the magma rises towards the surface. The gasforces the magma apart initially as a bubble within the rock, and eventually it may force
Geology for civil engineers 34
www.angoothachaap.blogspot.com
www.angoothachaap.blogspot.com
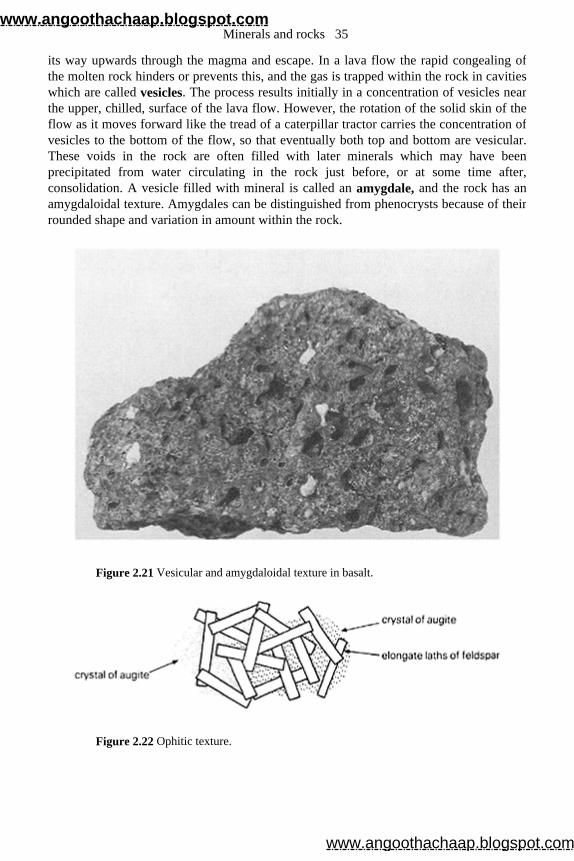
its way upwards through the magma and escape. In a lava flow the rapid congealing ofthe molten rock hinders or prevents this, and the gas is trapped within the rock in cavitieswhich are called vesicles. The process results initially in a concentration of vesicles near the upper, chilled, surface of the lava flow. However, the rotation of the solid skin of theflow as it moves forward like the tread of a caterpillar tractor carries the concentration ofvesicles to the bottom of the flow, so that eventually both top and bottom are vesicular.These voids in the rock are often filled with later minerals which may have beenprecipitated from water circulating in the rock just before, or at some time after,consolidation. A vesicle filled with mineral is called an amygdale, and the rock has an amygdaloidal texture. Amygdales can be distinguished from phenocrysts because of theirrounded shape and variation in amount within the rock.
Figure 2.21 Vesicular and amygdaloidal texture in basalt.
Figure 2.22 Ophitic texture.
Minerals and rocks 35
www.angoothachaap.blogspot.com
www.angoothachaap.blogspot.com
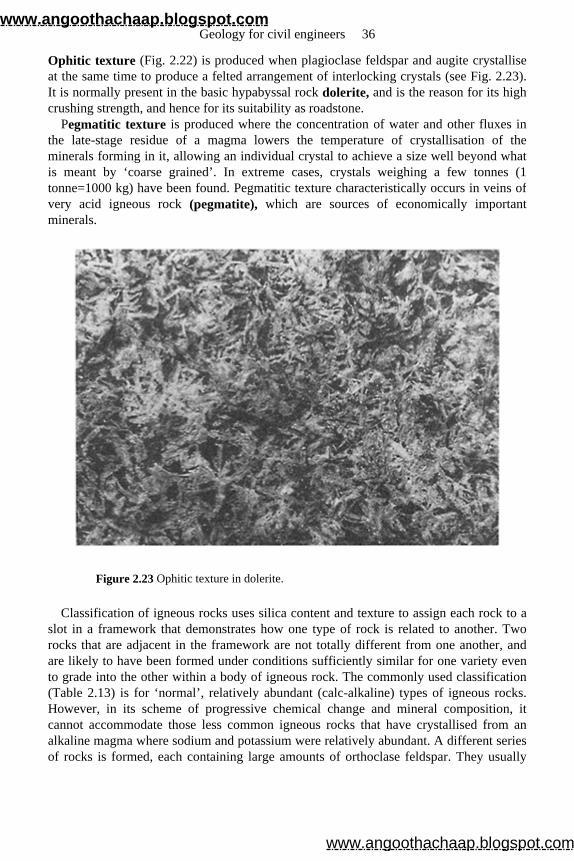
Ophitic texture (Fig. 2.22) is produced when plagioclase feldspar and augite crystalliseat the same time to produce a felted arrangement of interlocking crystals (see Fig. 2.23). It is normally present in the basic hypabyssal rock dolerite, and is the reason for its high crushing strength, and hence for its suitability as roadstone.
Pegmatitic texture is produced where the concentration of water and other fluxes inthe late-stage residue of a magma lowers the temperature of crystallisation of the minerals forming in it, allowing an individual crystal to achieve a size well beyond whatis meant by ‘coarse grained’. In extreme cases, crystals weighing a few tonnes (1 tonne=1000 kg) have been found. Pegmatitic texture characteristically occurs in veins ofvery acid igneous rock (pegmatite), which are sources of economically importantminerals.
Figure 2.23 Ophitic texture in dolerite.
Classification of igneous rocks uses silica content and texture to assign each rock to aslot in a framework that demonstrates how one type of rock is related to another. Tworocks that are adjacent in the framework are not totally different from one another, andare likely to have been formed under conditions sufficiently similar for one variety evento grade into the other within a body of igneous rock. The commonly used classification(Table 2.13) is for ‘normal’, relatively abundant (calc-alkaline) types of igneous rocks. However, in its scheme of progressive chemical change and mineral composition, itcannot accommodate those less common igneous rocks that have crystallised from analkaline magma where sodium and potassium were relatively abundant. A different seriesof rocks is formed, each containing large amounts of orthoclase feldspar. They usually
Geology for civil engineers 36
www.angoothachaap.blogspot.com
www.angoothachaap.blogspot.com
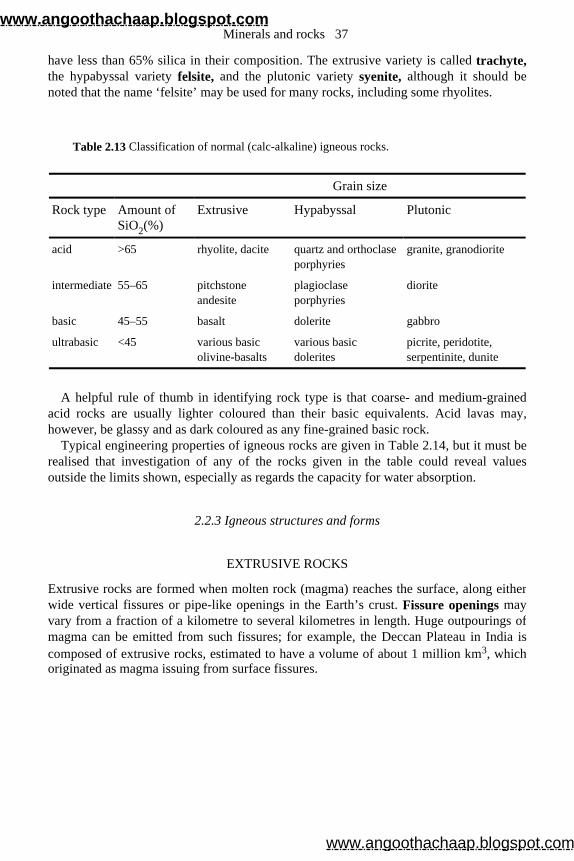
have less than 65% silica in their composition. The extrusive variety is called trachyte,the hypabyssal variety felsite, and the plutonic variety syenite, although it should be noted that the name ‘felsite’ may be used for many rocks, including some rhyolites.
A helpful rule of thumb in identifying rock type is that coarse- and medium-grained acid rocks are usually lighter coloured than their basic equivalents. Acid lavas may,however, be glassy and as dark coloured as any fine-grained basic rock.
Typical engineering properties of igneous rocks are given in Table 2.14, but it must be realised that investigation of any of the rocks given in the table could reveal valuesoutside the limits shown, especially as regards the capacity for water absorption.
2.2.3 Igneous structures and forms
EXTRUSIVE ROCKS
Extrusive rocks are formed when molten rock (magma) reaches the surface, along eitherwide vertical fissures or pipe-like openings in the Earth’s crust. Fissure openings may vary from a fraction of a kilometre to several kilometres in length. Huge outpourings ofmagma can be emitted from such fissures; for example, the Deccan Plateau in India iscomposed of extrusive rocks, estimated to have a volume of about 1 million km3, which originated as magma issuing from surface fissures.
Table 2.13 Classification of normal (calc-alkaline) igneous rocks.
Grain size
Rock type Amount of SiO2(%)
Extrusive Hypabyssal Plutonic
acid >65 rhyolite, dacite quartz and orthoclase porphyries
granite, granodiorite
intermediate 55–65 pitchstone andesite
plagioclase porphyries
diorite
basic 45–55 basalt dolerite gabbro
ultrabasic <45 various basic olivine-basalts
various basic dolerites
picrite, peridotite, serpentinite, dunite
Minerals and rocks 37
www.angoothachaap.blogspot.com
www.angoothachaap.blogspot.com
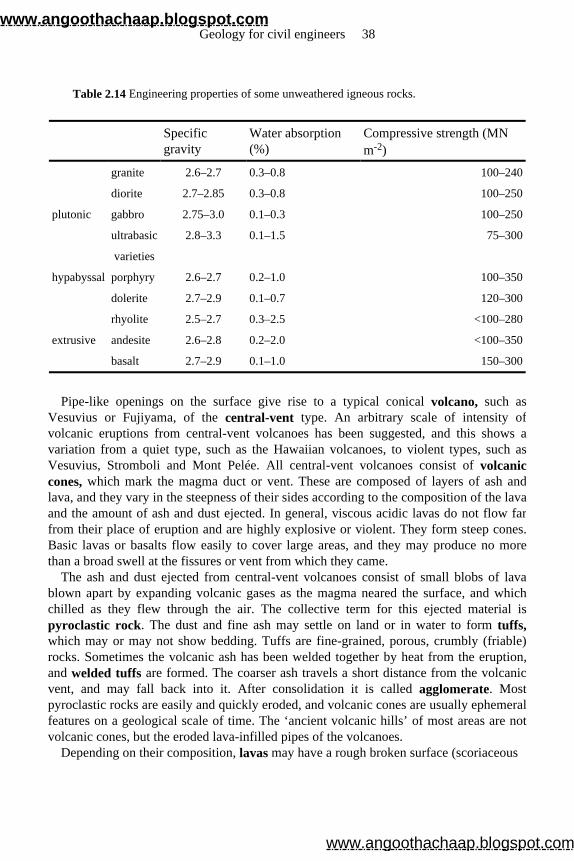
Pipe-like openings on the surface give rise to a typical conical volcano, such as Vesuvius or Fujiyama, of the central-vent type. An arbitrary scale of intensity of volcanic eruptions from central-vent volcanoes has been suggested, and this shows avariation from a quiet type, such as the Hawaiian volcanoes, to violent types, such asVesuvius, Stromboli and Mont Pelée. All central-vent volcanoes consist of volcanic cones, which mark the magma duct or vent. These are composed of layers of ash andlava, and they vary in the steepness of their sides according to the composition of the lavaand the amount of ash and dust ejected. In general, viscous acidic lavas do not flow farfrom their place of eruption and are highly explosive or violent. They form steep cones.Basic lavas or basalts flow easily to cover large areas, and they may produce no morethan a broad swell at the fissures or vent from which they came.
The ash and dust ejected from central-vent volcanoes consist of small blobs of lava blown apart by expanding volcanic gases as the magma neared the surface, and whichchilled as they flew through the air. The collective term for this ejected material ispyroclastic rock. The dust and fine ash may settle on land or in water to form tuffs,which may or may not show bedding. Tuffs are fine-grained, porous, crumbly (friable) rocks. Sometimes the volcanic ash has been welded together by heat from the eruption,and welded tuffs are formed. The coarser ash travels a short distance from the volcanic vent, and may fall back into it. After consolidation it is called agglomerate. Most pyroclastic rocks are easily and quickly eroded, and volcanic cones are usually ephemeralfeatures on a geological scale of time. The ‘ancient volcanic hills’ of most areas are not volcanic cones, but the eroded lava-infilled pipes of the volcanoes.
Depending on their composition, lavas may have a rough broken surface (scoriaceous
Table 2.14 Engineering properties of some unweathered igneous rocks.
Specific gravity
Water absorption (%)
Compressive strength (MN m-2)
granite 2.6–2.7 0.3–0.8 100–240
diorite 2.7–2.85 0.3–0.8 100–250
plutonic gabbro 2.75–3.0 0.1–0.3 100–250
ultrabasic 2.8–3.3 0.1–1.5 75–300
varieties
hypabyssal porphyry 2.6–2.7 0.2–1.0 100–350
dolerite 2.7–2.9 0.1–0.7 120–300
rhyolite 2.5–2.7 0.3–2.5 <100–280
extrusive andesite 2.6–2.8 0.2–2.0 <100–350
basalt 2.7–2.9 0.1–1.0 150–300
Geology for civil engineers 38
www.angoothachaap.blogspot.com
www.angoothachaap.blogspot.com
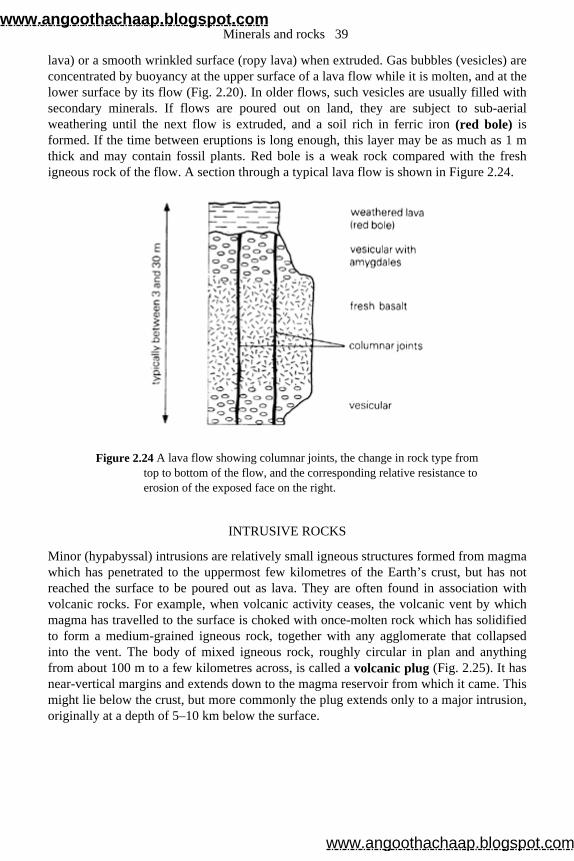
lava) or a smooth wrinkled surface (ropy lava) when extruded. Gas bubbles (vesicles) areconcentrated by buoyancy at the upper surface of a lava flow while it is molten, and at thelower surface by its flow (Fig. 2.20). In older flows, such vesicles are usually filled with secondary minerals. If flows are poured out on land, they are subject to sub-aerial weathering until the next flow is extruded, and a soil rich in ferric iron (red bole) is formed. If the time between eruptions is long enough, this layer may be as much as 1 mthick and may contain fossil plants. Red bole is a weak rock compared with the freshigneous rock of the flow. A section through a typical lava flow is shown in Figure 2.24.
Figure 2.24 A lava flow showing columnar joints, the change in rock type from top to bottom of the flow, and the corresponding relative resistance to erosion of the exposed face on the right.
INTRUSIVE ROCKS
Minor (hypabyssal) intrusions are relatively small igneous structures formed from magmawhich has penetrated to the uppermost few kilometres of the Earth’s crust, but has not reached the surface to be poured out as lava. They are often found in association withvolcanic rocks. For example, when volcanic activity ceases, the volcanic vent by whichmagma has travelled to the surface is choked with once-molten rock which has solidified to form a medium-grained igneous rock, together with any agglomerate that collapsed into the vent. The body of mixed igneous rock, roughly circular in plan and anythingfrom about 100 m to a few kilometres across, is called a volcanic plug (Fig. 2.25). It has near-vertical margins and extends down to the magma reservoir from which it came. This might lie below the crust, but more commonly the plug extends only to a major intrusion,originally at a depth of 5–10 km below the surface.
Minerals and rocks 39
www.angoothachaap.blogspot.com
www.angoothachaap.blogspot.com
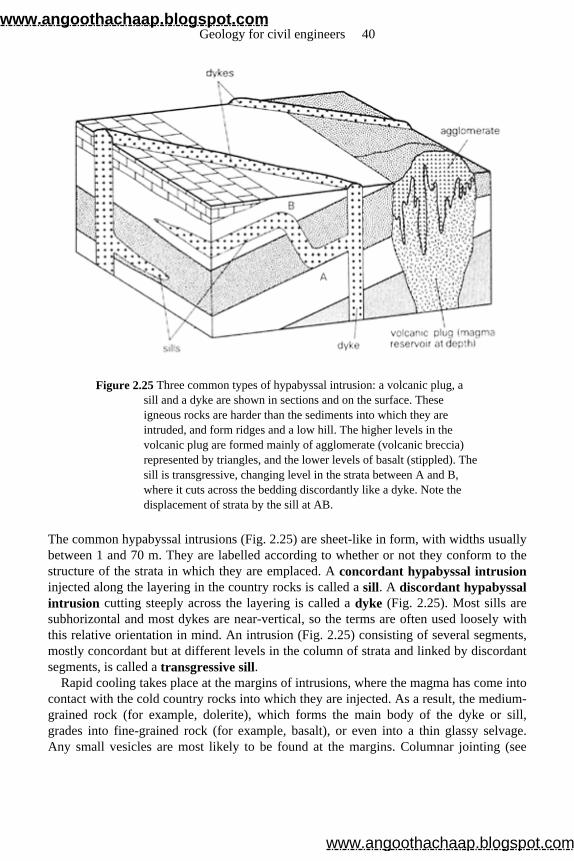
Figure 2.25 Three common types of hypabyssal intrusion: a volcanic plug, a sill and a dyke are shown in sections and on the surface. These igneous rocks are harder than the sediments into which they are intruded, and form ridges and a low hill. The higher levels in the volcanic plug are formed mainly of agglomerate (volcanic breccia) represented by triangles, and the lower levels of basalt (stippled). The sill is transgressive, changing level in the strata between A and B, where it cuts across the bedding discordantly like a dyke. Note the displacement of strata by the sill at AB.
The common hypabyssal intrusions (Fig. 2.25) are sheet-like in form, with widths usually between 1 and 70 m. They are labelled according to whether or not they conform to thestructure of the strata in which they are emplaced. A concordant hypabyssal intrusioninjected along the layering in the country rocks is called a sill. A discordant hypabyssal intrusion cutting steeply across the layering is called a dyke (Fig. 2.25). Most sills are subhorizontal and most dykes are near-vertical, so the terms are often used loosely with this relative orientation in mind. An intrusion (Fig. 2.25) consisting of several segments, mostly concordant but at different levels in the column of strata and linked by discordantsegments, is called a transgressive sill.
Rapid cooling takes place at the margins of intrusions, where the magma has come intocontact with the cold country rocks into which they are injected. As a result, the medium-grained rock (for example, dolerite), which forms the main body of the dyke or sill,grades into fine-grained rock (for example, basalt), or even into a thin glassy selvage.Any small vesicles are most likely to be found at the margins. Columnar jointing (see
Geology for civil engineers 40
www.angoothachaap.blogspot.com
www.angoothachaap.blogspot.com
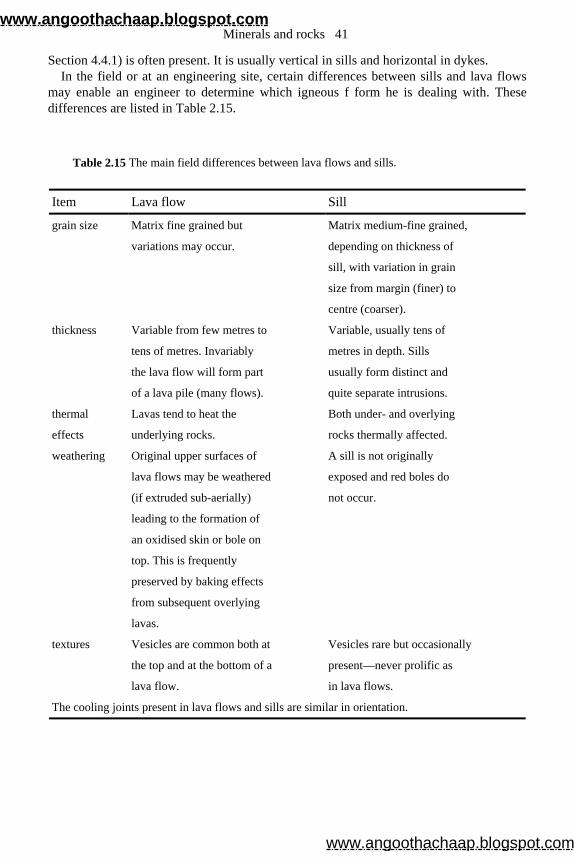
Section 4.4.1) is often present. It is usually vertical in sills and horizontal in dykes. In the field or at an engineering site, certain differences between sills and lava flows
may enable an engineer to determine which igneous f form he is dealing with. Thesedifferences are listed in Table 2.15.
Table 2.15 The main field differences between lava flows and sills.
Item Lava flow Sill
grain size Matrix fine grained but Matrix medium-fine grained,
variations may occur. depending on thickness of
sill, with variation in grain
size from margin (finer) to
centre (coarser).
thickness Variable from few metres to Variable, usually tens of
tens of metres. Invariably metres in depth. Sills
the lava flow will form part usually form distinct and
of a lava pile (many flows). quite separate intrusions.
thermal Lavas tend to heat the Both under- and overlying
effects underlying rocks. rocks thermally affected.
weathering Original upper surfaces of A sill is not originally
lava flows may be weathered exposed and red boles do
(if extruded sub-aerially) not occur.
leading to the formation of
an oxidised skin or bole on
top. This is frequently
preserved by baking effects
from subsequent overlying
lavas.
textures Vesicles are common both at Vesicles rare but occasionally
the top and at the bottom of a present—never prolific as
lava flow. in lava flows.
The cooling joints present in lava flows and sills are similar in orientation.
Minerals and rocks 41
www.angoothachaap.blogspot.com
www.angoothachaap.blogspot.com
A dyke rarely occurs in complete isolation from other igneous intrusions.Characteristically, tens or hundreds of dykes occur as a dyke swarm within a linear zone, which is usually tens of kilometres across. Each dyke fills a tension crack (Section 4.4.4) formed at the time of its intrusion. The dykes of a swarm are parallel or subparallel,except where they are deflected locally by secondary stresses at geological boundaries,such as a major fault. A dyke swarm is sometimes related to a major centre of igneousactivity, either by intersecting it, or by spreading out from it. The centre may be the siteof one or more major granite plutons. Dykes ‘key in’ to the centre by swinging into trends which are radial from it. The frequency of dykes and the total amount of tensionalstretching are greater near the centre. Whether or not the magma in a dyke fissure,forcing its way towards the surface, continues to rise beyond any particular level or is injected laterally along the layering to form a sill depends on the relative resistanceoffered to injection by either path. This, in turn, depends on the local geology. Wherefavourable geological circumstances exist (for example, a gentle downbuckle in a variedsequence of layers), sills branch off from their feeder dykes.
Other types of minor intrusion occur within certain of the major centres of volcanicactivity, and they are usually concentric or radial to the centre to which they belong.There are distinctive terms to name them, and the mechanics of their formation areunderstood, but their occurrence is so limited that it is not appropriate here to do morethan mention their existence.
The rocks forming major intrusions have crystallised relatively deeply within the Earth’s crust (that is, at depths of at least a few kilometres) and are said to be plutonic. They are coarse grained, except where they have been rapidly cooled near a chilled margin. The smallest intrusions of this class are often mushroom-shaped, with a flat base and an upwards bulging roof, but other forms exist. The rocks are commonly acid orintermediate in composition, but basic and ultrabasic bodies of this form also occur.
Plutonic sheet intrusions are of basic composition in bulk, with a gradation from ultrabasic near the base to a small amount of acid rock at the top. Sheets of this type are afew kilometres thick, often downwarping the underlying original rocks because of theweight of magma involved.
The second type of major plutonic intrusion is a great body of granodiorite and granite called a batholith (Fig. 2.26). Batholiths are always formed from acid magma, and arecharacteristic of late igneous activity in mobile belts (see Section 4.6.1), where mountain building is taking place. They extend for tens or hundreds of kilometres along themountain belt, are tens of kilometres wide, and extend downwards for about 10 km. Forexample, the Coast Range batholith of the American Rockies, which consists of manyintrusions emplaced at the same time, is 2000 km long, 100 km wide and can be seenvertically through a range of 5 km. At no place, however, is the base of a batholithvisible. The roof of a batholith may lie below the ground surface, and in that case theonly granite outcrops are those of smaller intrusions (commonly between 5 and 10 kmacross), which rise above the main batholith as stocks (Fig. 2.26). They appear to be separate bodies of granite, but are joined at depth. The margins of a batholith usually dipoutwards at a steep angle. Close to them the granite often contains blocks of country rock(xenoliths), which have been broken off during the rise of the acid magma. Xenoliths
Geology for civil engineers 42
www.angoothachaap.blogspot.com
www.angoothachaap.blogspot.com
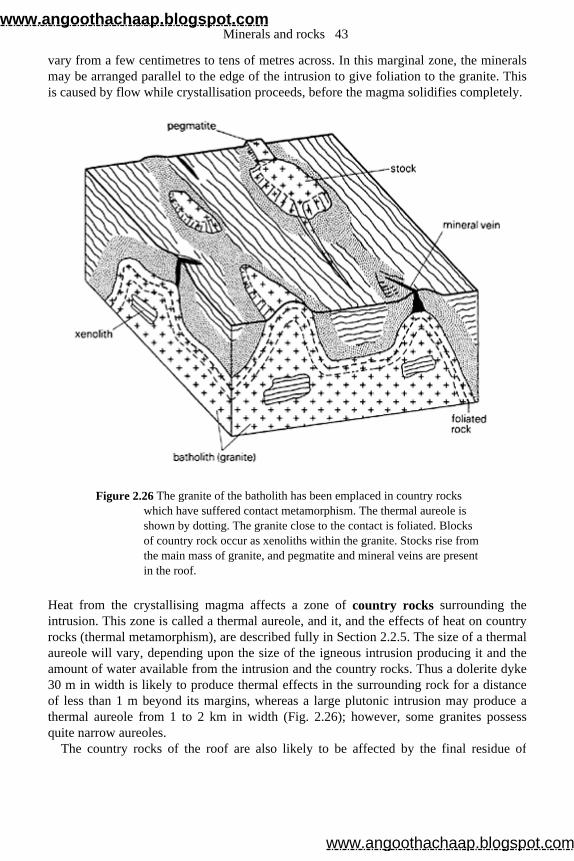
vary from a few centimetres to tens of metres across. In this marginal zone, the mineralsmay be arranged parallel to the edge of the intrusion to give foliation to the granite. Thisis caused by flow while crystallisation proceeds, before the magma solidifies completely.
Figure 2.26 The granite of the batholith has been emplaced in country rocks which have suffered contact metamorphism. The thermal aureole is shown by dotting. The granite close to the contact is foliated. Blocks of country rock occur as xenoliths within the granite. Stocks rise from the main mass of granite, and pegmatite and mineral veins are present in the roof.
Heat from the crystallising magma affects a zone of country rocks surrounding the intrusion. This zone is called a thermal aureole, and it, and the effects of heat on countryrocks (thermal metamorphism), are described fully in Section 2.2.5. The size of a thermal aureole will vary, depending upon the size of the igneous intrusion producing it and theamount of water available from the intrusion and the country rocks. Thus a dolerite dyke30 m in width is likely to produce thermal effects in the surrounding rock for a distanceof less than 1 m beyond its margins, whereas a large plutonic intrusion may produce athermal aureole from 1 to 2 km in width (Fig. 2.26); however, some granites possess quite narrow aureoles.
The country rocks of the roof are also likely to be affected by the final residue of
Minerals and rocks 43
www.angoothachaap.blogspot.com
www.angoothachaap.blogspot.com

volatiles, both liquid and gaseous, in the solidifying granite. These collect in the upperparts of the batholith and, at the final stage of crystallisation, they are injected intofissures in the roof to form minor intrusions. They are often referred to, especially if theyare narrow (less than 1 m wide), irregular or contain economic minerals, as veins rather than dykes or sills. Sometimes the granite intrusions themselves may possess these veins,caused by late-stage igneous liquids being injected into the granite rocks which have justsolidified. The composition of these residual fluids approximates to granite modified by a relative enrichment in rare elements. In these veins the individual crystals are able togrow to a relatively large size, and the rock is very coarse grained. The rock (pegmatite)in the veins may contain large crystals of unusual minerals such as topaz, tourmaline,beryl and fluorite. In some regions, hot water with lead, zinc, silver, tin and othereconomic metals in solution forms hydrothermal veins containing ore minerals around the granite. Those such as cassiterite (tin oxide), which come out of solution at hightemperature, are deposited close to, or within, the granite. Those precipitated at lowertemperatures, such as galena (lead sulphide), are deposited further away. Thetemperatures of formation of hydrothermal ore deposits are in the following ranges: 300–500°C for hypothermal deposits (cassiterite, arsenic compounds, pyrite and otheriron sulphides); 200–300°C for mesothermal deposits (lead, zinc, copper, silver and gold); and 50–200°C for epithermal deposits (antimony and mercury deposits, and silver and gold compounds). These temperatures should be compared with the magmaticand metamorphic temperatures given in Figure 2.39.
2.2.4 Sedimentary rocks
Sedimentary rocks are formed from the solid debris and the dissolved mineral matterproduced by the mechanical and chemical breakdown of pre-existing rocks, or in some cases from the skeletal material of dead plants and animals. The processes involved in thedisintegration of rocks by weathering and erosion, and the transport of these products tothe place where they are deposited, are all discussed in Chapter 3. They merit this special attention in a book for engineers since the deposits (‘soils’ to an engineer) which have recently formed, or are forming, blanket most of the solid rocks of the Earth, and are thenatural material encountered and dealt with in nearly every shallow excavation. Thesemodern deposits are also relevant in discussing the solid sedimentary rocks, which havebeen produced from similar accumulations in the geological past. The sediment has beentransformed into solid rock by compaction as it was buried and compressed bysubsequent deposits. In many cases, minerals in solution in the ground water have beenprecipitated to act as a natural cement, and bond the fragments together. The nature of asedimentary rock, and its position in a scheme of rock classification, are partly dependenton these original conditions of transport and deposition. Thus it may be describedaccording to the type of environment in which it accumulated: as a continental deposit if it were laid down on land or in a lake by rivers, ice or wind; as an intermediate depositif it were laid down in an estuary or delta; or as a marine deposit if it were laid down on a seashore, in the shallow waters of the continental shelves, or in the abyssal areas of the deep oceans.
Geology for civil engineers 44
www.angoothachaap.blogspot.com
www.angoothachaap.blogspot.com
The four major groups of sedimentary rocks are:
(a) terrigenous sedimentary rocks (sometimes referred to as clastic or detrital rocks), which are formed from minerals or rock fragments derived from the breakdown of pre-existing rocks;
(b) chemical sedimentary rocks, which are formed from the precipitation of salts dissolved in water;
(c) organic sedimentary rocks, which are formed from the skeletal remains of plants and animals and include coal and oil;
(d) limestones and dolomites, which are sedimentary rocks consisting of more than 50% carbonate, and can include chemical, clastic and biological material.
MINERALOGY OF SEDIMENTARY ROCKS
The composition of a given rock will depend on the source from which the waste materialcame, on the resistance, chemical and mechanical, of each component during transport,and on the distance travelled. The main constituents of terrigenous sedimentary rocks arefragments from pre-existing rocks and minerals. These may be fresh and unaltered, ormay be alteration products of weathering (see Section 2.1.3), such as clay minerals. Quartz is the most common mineral. It is chemically stable and hard enough to resistabrasion as it is transported. Some rarer minerals, such as garnet, tourmaline and rutile,have similar properties. Feldspar is less stable but may survive for long enough, underfavourable circumstances, to be present in deposits that have not been transported farfrom their source, or which are protected in other ways. The other common rock-forming minerals of igneous rocks generally have an even lower survival rate when exposed to airand water (p. 23).
Some minerals in sedimentary rocks may be formed in the area of deposition. The most common examples are those minerals precipitated from solution to form the chemicalsedimentary rocks. They include carbonates (calcite, dolomite and siderite), sulphates(gypsum and anhydrite), chlorides, and silica (chalcedonic minerals). Each may not onlybe an essential mineral in a particular type of chemical sedimentary rock, but may also bethe sole mineral present.
Limestones may possess mineral constituents that include clastic particles, chemically precipitated material and organic remains (shells, corals, etc.).
Diagenesis is the name given to processes that alter the character of a sedimentary rockafter it has been deposited, either by interreactions between constituent minerals or byreactions between constituent minerals and pore fluids or other liquids circulatingthrough the sedimentary material. Diagenesis is a low-temperature process, which can occur when the sediment is still in contact with the sea or lake water after its deposition, and also later when direct contact with the original water has been removed. The processcontinues until the constituents and pore fluids are in chemical equilibrium.
In the sedimentary pile during diagenesis, silica is first deposited at low temperatures between grains. As the sedimentary pile thickens, the deeper sediments then have calcitedeposited at the higher temperatures; these deep sediments have been compacted and
Minerals and rocks 45
www.angoothachaap.blogspot.com
www.angoothachaap.blogspot.com
their porosity has been reduced. If the sedimentary pile is later uplifted, the calcitecement redissolves and the sedimentary rock will possess gaps or voids in its structure.This explains why some sedimentary rocks are much weaker than their appearance wouldsuggest.
Sedimentary rock grains may be bonded together by a cement, which consists of any naturally deposited mineral matter as described earlier. Commonly found cements insedimentary rocks include calcite and silica, as well as haematite, which gives the rock ared colour. The nature of the cement may be of importance to the engineer since it affectsa rock’s properties. Thus, for example, old (pre-1880) buildings in Glasgow and Edinburgh are built from block sandstones of Lower Carboniferous age. The Glasgowsandstone is from a local horizon and fairly porous, with some carbonate cement and alow compressive strength (<50 MN m–2), whereas the Edinburgh sandstone, which is also obtained from a local horizon, has a low porosity, is silica cemented and possesses ahigher strength (>60 MN m– 2). Thus the pre-1800 Edinburgh buildings (the so-called Edinburgh New Town) have survived in better condition than the much younger,Victorian houses in Glasgow, because of the higher resistance of the Edinburghsandstone to weathering by the industrial atmosphere of these parts of Scotland.
TEXTURES OF SEDIMENTARY ROCKS
Chemical sedimentary rocks generally have a crystalline texture. Some, however, areformed of fragments, and their textures are dependent on the sizes, shapes andarrangement of these fragments. If the rock has been formed from organic debris, then thefragments may consist of particles of shell or wood, but the texture can be described inthe same terms as are used for other fragmented rocks.
The size of grains is an important textural feature of a terrigenous rock, as an indication of distance between its source and depositional areas, as well as an easilyobserved property which may be used to distinguish and classify the rock. The coarsestparticles are deposited nearest to the source area, and most of the finest particles arecarried in suspension to greater distances before they settle. These clay particles, or rockflour (which represents minute particles of the common rock-forming minerals), are deposited only when the current slackens to nearly zero, and in some cases the salinity of the water of an estuary or the open sea makes the minute specks of clay clot (flocculate)into larger particles.
The degree of roundness of grains is related to the amount of abrasion suffered duringtransport, and hence to distance travelled from their source before deposition. Roundnessis related to the sharpness or curvature of edges and corners of grains. It is also dependenton the size and hardness of the grains and the violence of impact of one against another.No matter how far they travel, sand grains lack the necessary momentum when theycollide in water to produce perfect rounding, and it is only when dry grains are blown bythe wind that perfectly rounded grains are produced. Larger fragments, however, may bewell rounded after transportation by water for distances of less than 150 km. The degreeof roundness is an important property in sand being used to make concrete, or for otherengineering purposes. Sand grains deposited from ice are normally more angular than
Geology for civil engineers 46
www.angoothachaap.blogspot.com
www.angoothachaap.blogspot.com
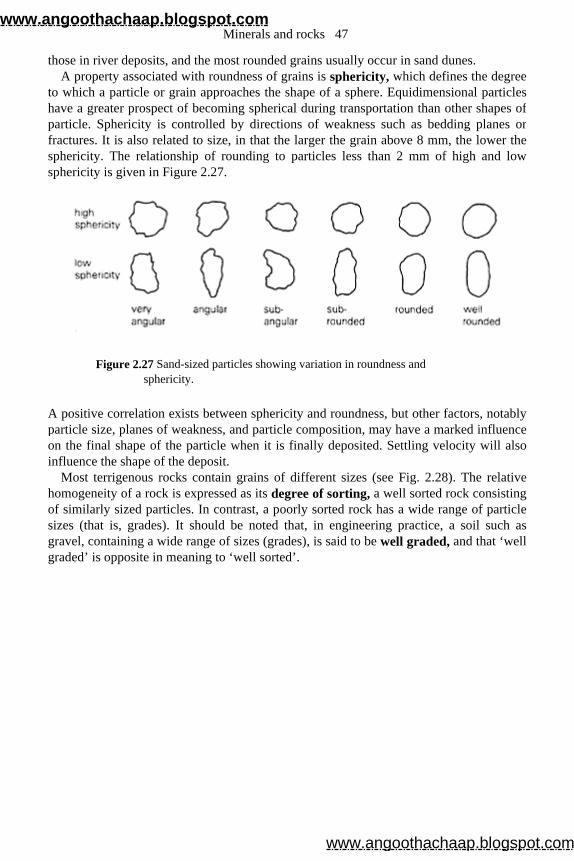
those in river deposits, and the most rounded grains usually occur in sand dunes. A property associated with roundness of grains is sphericity, which defines the degree
to which a particle or grain approaches the shape of a sphere. Equidimensional particleshave a greater prospect of becoming spherical during transportation than other shapes ofparticle. Sphericity is controlled by directions of weakness such as bedding planes orfractures. It is also related to size, in that the larger the grain above 8 mm, the lower thesphericity. The relationship of rounding to particles less than 2 mm of high and lowsphericity is given in Figure 2.27.
Figure 2.27 Sand-sized particles showing variation in roundness and sphericity.
A positive correlation exists between sphericity and roundness, but other factors, notablyparticle size, planes of weakness, and particle composition, may have a marked influenceon the final shape of the particle when it is finally deposited. Settling velocity will alsoinfluence the shape of the deposit.
Most terrigenous rocks contain grains of different sizes (see Fig. 2.28). The relative homogeneity of a rock is expressed as its degree of sorting, a well sorted rock consisting of similarly sized particles. In contrast, a poorly sorted rock has a wide range of particlesizes (that is, grades). It should be noted that, in engineering practice, a soil such asgravel, containing a wide range of sizes (grades), is said to be well graded, and that ‘well graded’ is opposite in meaning to ‘well sorted’.
Minerals and rocks 47
www.angoothachaap.blogspot.com
www.angoothachaap.blogspot.com
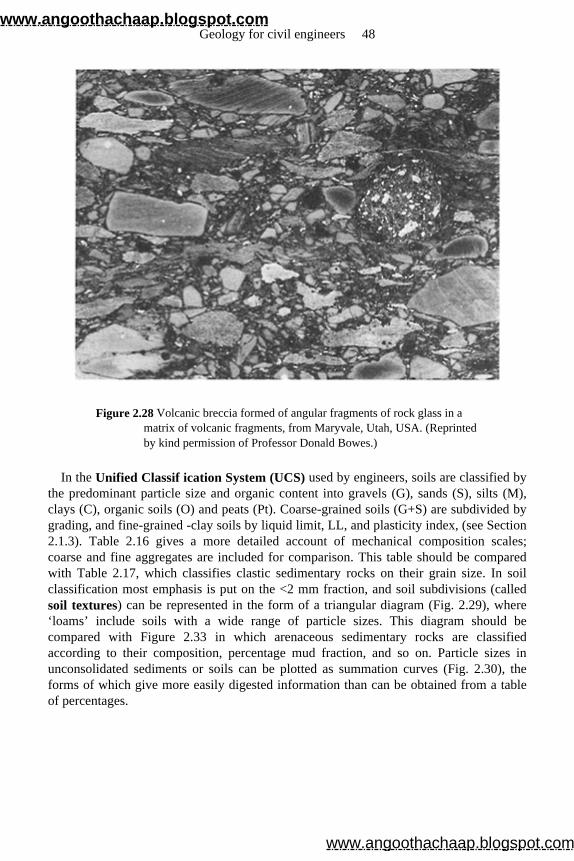
Figure 2.28 Volcanic breccia formed of angular fragments of rock glass in a matrix of volcanic fragments, from Maryvale, Utah, USA. (Reprinted by kind permission of Professor Donald Bowes.)
In the Unified Classif ication System (UCS) used by engineers, soils are classified bythe predominant particle size and organic content into gravels (G), sands (S), silts (M),clays (C), organic soils (O) and peats (Pt). Coarse-grained soils (G+S) are subdivided by grading, and fine-grained -clay soils by liquid limit, LL, and plasticity index, (see Section 2.1.3). Table 2.16 gives a more detailed account of mechanical composition scales;coarse and fine aggregates are included for comparison. This table should be comparedwith Table 2.17, which classifies clastic sedimentary rocks on their grain size. In soil classification most emphasis is put on the <2 mm fraction, and soil subdivisions (calledsoil textures) can be represented in the form of a triangular diagram (Fig. 2.29), where ‘loams’ include soils with a wide range of particle sizes. This diagram should be compared with Figure 2.33 in which arenaceous sedimentary rocks are classifiedaccording to their composition, percentage mud fraction, and so on. Particle sizes inunconsolidated sediments or soils can be plotted as summation curves (Fig. 2.30), the forms of which give more easily digested information than can be obtained from a tableof percentages.
Geology for civil engineers 48
www.angoothachaap.blogspot.com
www.angoothachaap.blogspot.com
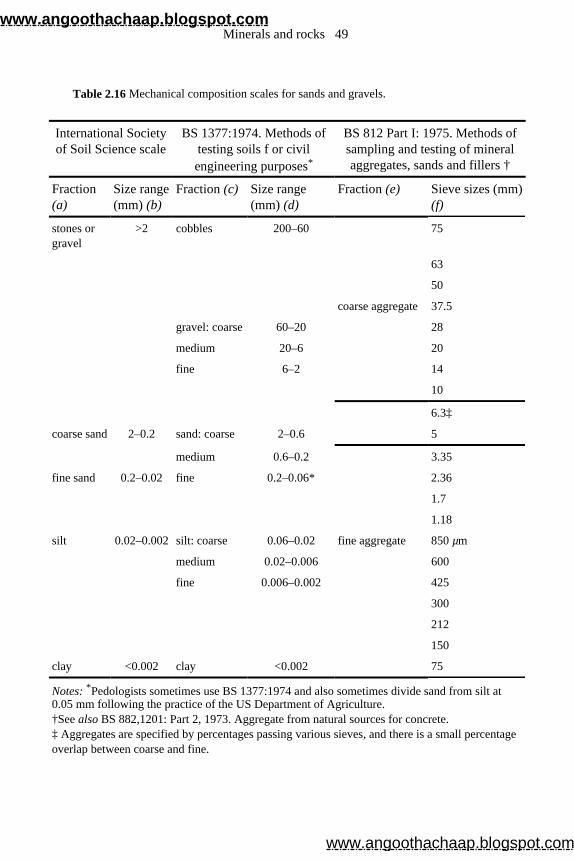
Table 2.16 Mechanical composition scales for sands and gravels.
International Society of Soil Science scale
BS 1377:1974. Methods of testing soils f or civil engineering purposes*
BS 812 Part I: 1975. Methods of sampling and testing of mineral aggregates, sands and fillers †
Fraction (a)
Size range (mm) (b)
Fraction (c) Size range (mm) (d)
Fraction (e) Sieve sizes (mm) (f)
stones or gravel
>2 cobbles 200–60 75
63
50
coarse aggregate 37.5
gravel: coarse 60–20 28
medium 20–6 20
fine 6–2 14
10
6.3‡
coarse sand 2–0.2 sand: coarse 2–0.6 5
medium 0.6–0.2 3.35
fine sand 0.2–0.02 fine 0.2–0.06* 2.36
1.7
1.18
silt 0.02–0.002 silt: coarse 0.06–0.02 fine aggregate 850 µm
medium 0.02–0.006 600
fine 0.006–0.002 425
300
212
150
clay <0.002 clay <0.002 75
Notes: *Pedologists sometimes use BS 1377:1974 and also sometimes divide sand from silt at 0.05 mm following the practice of the US Department of Agriculture. †See also BS 882,1201: Part 2, 1973. Aggregate from natural sources for concrete. ‡ Aggregates are specified by percentages passing various sieves, and there is a small percentage overlap between coarse and fine.
Minerals and rocks 49
www.angoothachaap.blogspot.com
www.angoothachaap.blogspot.com
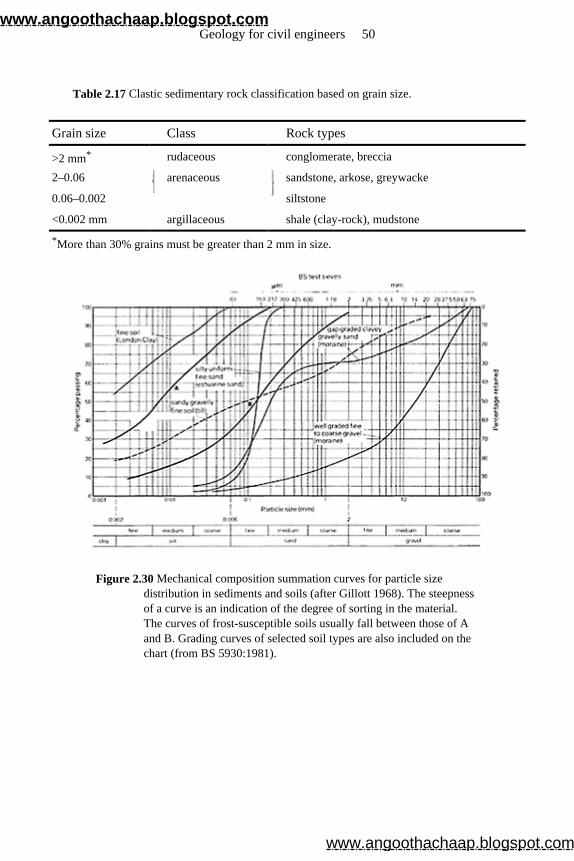
Figure 2.30 Mechanical composition summation curves for particle size distribution in sediments and soils (after Gillott 1968). The steepness of a curve is an indication of the degree of sorting in the material. The curves of frost-susceptible soils usually fall between those of A and B. Grading curves of selected soil types are also included on the chart (from BS 5930:1981).
Table 2.17 Clastic sedimentary rock classification based on grain size.
Grain size Class Rock types
>2 mm* rudaceous conglomerate, breccia
2–0.06 arenaceous
sandstone, arkose, greywacke
0.06–0.002 siltstone
<0.002 mm argillaceous shale (clay-rock), mudstone
*More than 30% grains must be greater than 2 mm in size.
Geology for civil engineers 50
www.angoothachaap.blogspot.com
www.angoothachaap.blogspot.com
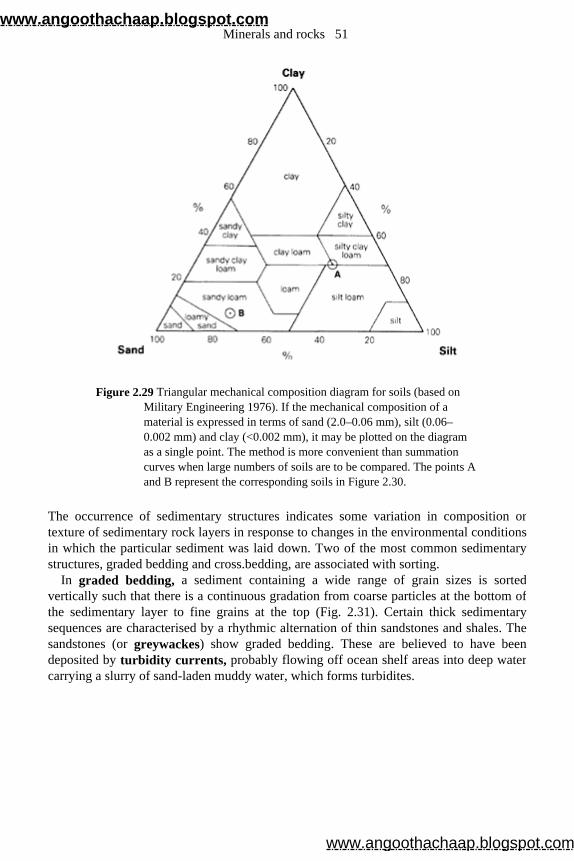
Figure 2.29 Triangular mechanical composition diagram for soils (based on Military Engineering 1976). If the mechanical composition of a material is expressed in terms of sand (2.0–0.06 mm), silt (0.06–0.002 mm) and clay (<0.002 mm), it may be plotted on the diagram as a single point. The method is more convenient than summation curves when large numbers of soils are to be compared. The points A and B represent the corresponding soils in Figure 2.30.
The occurrence of sedimentary structures indicates some variation in composition ortexture of sedimentary rock layers in response to changes in the environmental conditionsin which the particular sediment was laid down. Two of the most common sedimentarystructures, graded bedding and cross.bedding, are associated with sorting.
In graded bedding, a sediment containing a wide range of grain sizes is sortedvertically such that there is a continuous gradation from coarse particles at the bottom ofthe sedimentary layer to fine grains at the top (Fig. 2.31). Certain thick sedimentary sequences are characterised by a rhythmic alternation of thin sandstones and shales. Thesandstones (or greywackes) show graded bedding. These are believed to have been deposited by turbidity currents, probably flowing off ocean shelf areas into deep watercarrying a slurry of sand-laden muddy water, which forms turbidites.
Minerals and rocks 51
www.angoothachaap.blogspot.com
www.angoothachaap.blogspot.com
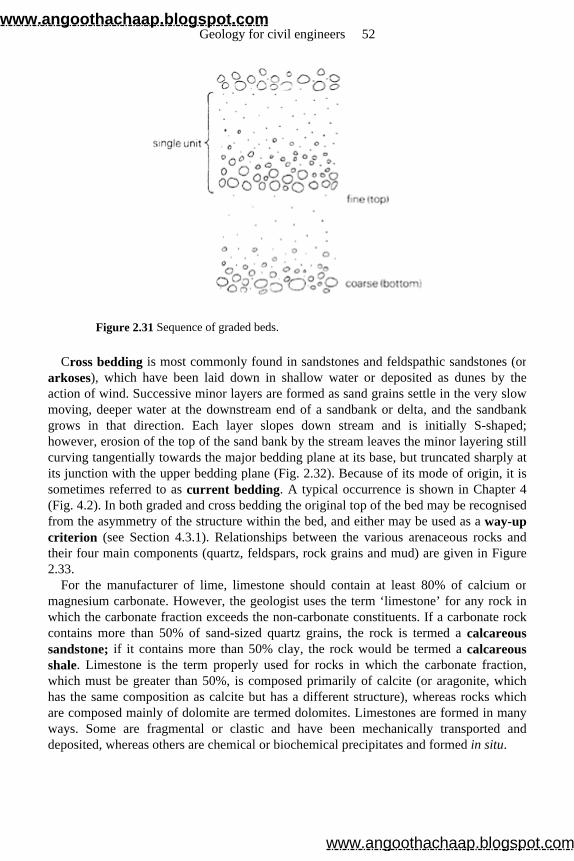
Figure 2.31 Sequence of graded beds.
Cross bedding is most commonly found in sandstones and feldspathic sandstones (orarkoses), which have been laid down in shallow water or deposited as dunes by the action of wind. Successive minor layers are formed as sand grains settle in the very slowmoving, deeper water at the downstream end of a sandbank or delta, and the sandbankgrows in that direction. Each layer slopes down stream and is initially S-shaped; however, erosion of the top of the sand bank by the stream leaves the minor layering stillcurving tangentially towards the major bedding plane at its base, but truncated sharply at its junction with the upper bedding plane (Fig. 2.32). Because of its mode of origin, it issometimes referred to as current bedding. A typical occurrence is shown in Chapter 4(Fig. 4.2). In both graded and cross bedding the original top of the bed may be recognisedfrom the asymmetry of the structure within the bed, and either may be used as a way-up criterion (see Section 4.3.1). Relationships between the various arenaceous rocks and their four main components (quartz, feldspars, rock grains and mud) are given in Figure 2.33.
For the manufacturer of lime, limestone should contain at least 80% of calcium or magnesium carbonate. However, the geologist uses the term ‘limestone’ for any rock in which the carbonate fraction exceeds the non-carbonate constituents. If a carbonate rockcontains more than 50% of sand-sized quartz grains, the rock is termed a calcareous sandstone; if it contains more than 50% clay, the rock would be termed a calcareous shale. Limestone is the term properly used for rocks in which the carbonate fraction, which must be greater than 50%, is composed primarily of calcite (or aragonite, whichhas the same composition as calcite but has a different structure), whereas rocks whichare composed mainly of dolomite are termed dolomites. Limestones are formed in manyways. Some are fragmental or clastic and have been mechanically transported anddeposited, whereas others are chemical or biochemical precipitates and formed in situ.
Geology for civil engineers 52
www.angoothachaap.blogspot.com
www.angoothachaap.blogspot.com
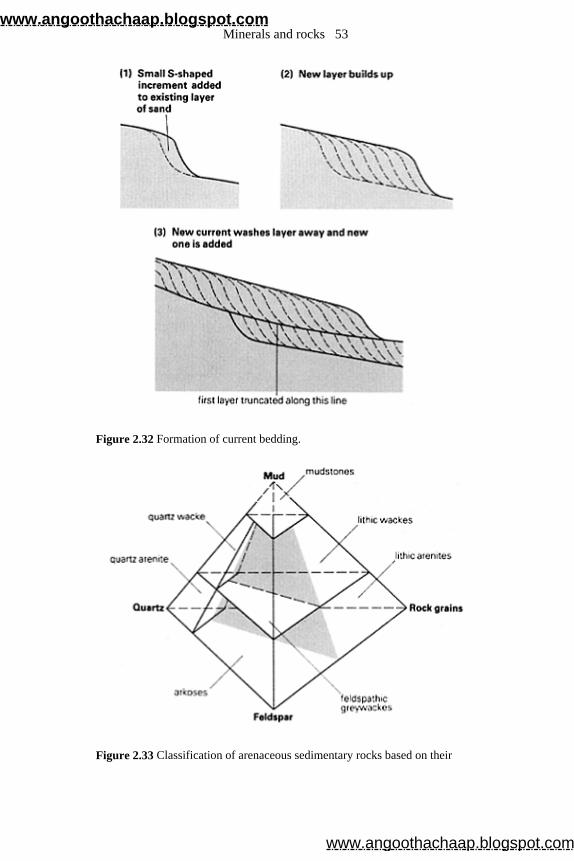
Figure 2.32 Formation of current bedding.
Figure 2.33 Classification of arenaceous sedimentary rocks based on their
Minerals and rocks 53
www.angoothachaap.blogspot.com
www.angoothachaap.blogspot.com
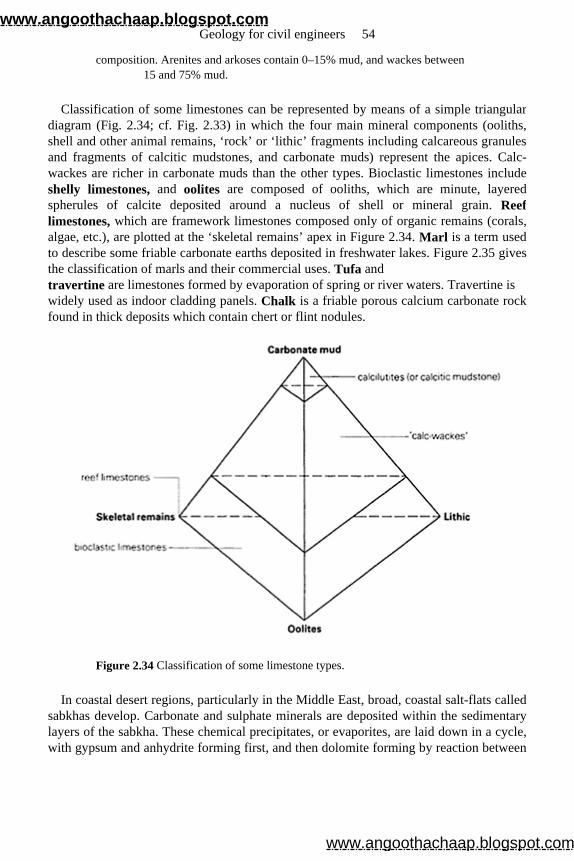
composition. Arenites and arkoses contain 0–15% mud, and wackes between 15 and 75% mud.
Classification of some limestones can be represented by means of a simple triangulardiagram (Fig. 2.34; cf. Fig. 2.33) in which the four main mineral components (ooliths, shell and other animal remains, ‘rock’ or ‘lithic’ fragments including calcareous granules and fragments of calcitic mudstones, and carbonate muds) represent the apices. Calc-wackes are richer in carbonate muds than the other types. Bioclastic limestones includeshelly limestones, and oolites are composed of ooliths, which are minute, layeredspherules of calcite deposited around a nucleus of shell or mineral grain. Reef limestones, which are framework limestones composed only of organic remains (corals, algae, etc.), are plotted at the ‘skeletal remains’ apex in Figure 2.34. Marl is a term used to describe some friable carbonate earths deposited in freshwater lakes. Figure 2.35 gives the classification of marls and their commercial uses. Tufa and travertine are limestones formed by evaporation of spring or river waters. Travertine is widely used as indoor cladding panels. Chalk is a friable porous calcium carbonate rockfound in thick deposits which contain chert or flint nodules.
Figure 2.34 Classification of some limestone types.
In coastal desert regions, particularly in the Middle East, broad, coastal salt-flats called sabkhas develop. Carbonate and sulphate minerals are deposited within the sedimentarylayers of the sabkha. These chemical precipitates, or evaporites, are laid down in a cycle,with gypsum and anhydrite forming first, and then dolomite forming by reaction between
Geology for civil engineers 54
www.angoothachaap.blogspot.com
www.angoothachaap.blogspot.com
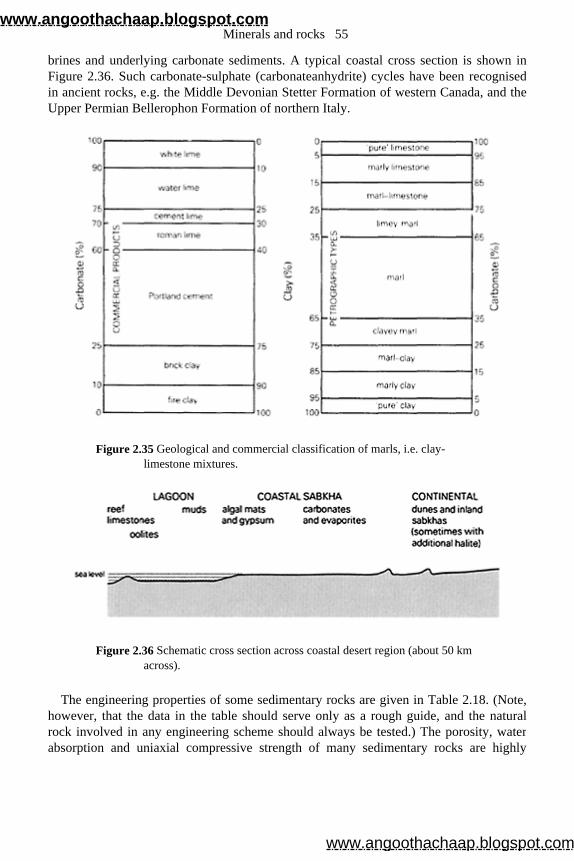
brines and underlying carbonate sediments. A typical coastal cross section is shown inFigure 2.36. Such carbonate-sulphate (carbonateanhydrite) cycles have been recognisedin ancient rocks, e.g. the Middle Devonian Stetter Formation of western Canada, and theUpper Permian Bellerophon Formation of northern Italy.
Figure 2.35 Geological and commercial classification of marls, i.e. clay-limestone mixtures.
Figure 2.36 Schematic cross section across coastal desert region (about 50 km across).
The engineering properties of some sedimentary rocks are given in Table 2.18. (Note, however, that the data in the table should serve only as a rough guide, and the naturalrock involved in any engineering scheme should always be tested.) The porosity, waterabsorption and uniaxial compressive strength of many sedimentary rocks are highly
Minerals and rocks 55
www.angoothachaap.blogspot.com
www.angoothachaap.blogspot.com
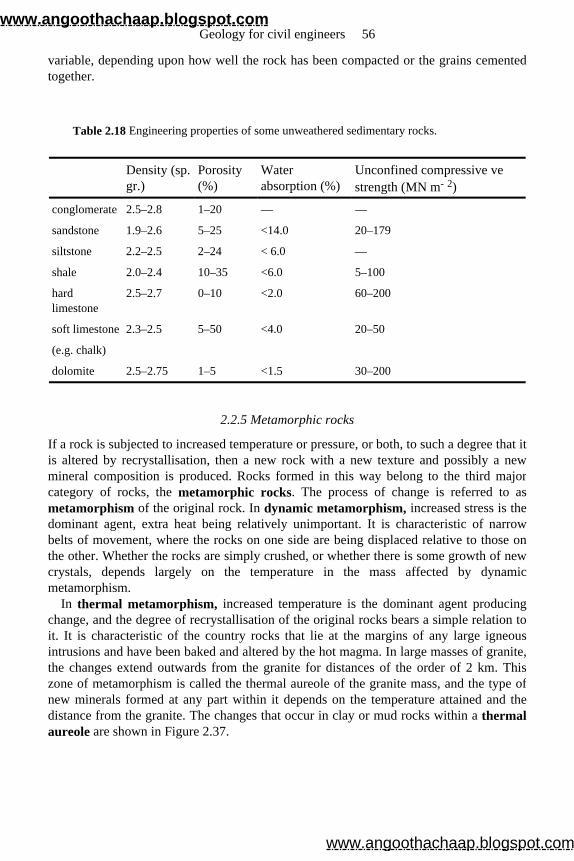
variable, depending upon how well the rock has been compacted or the grains cementedtogether.
2.2.5 Metamorphic rocks
If a rock is subjected to increased temperature or pressure, or both, to such a degree that itis altered by recrystallisation, then a new rock with a new texture and possibly a newmineral composition is produced. Rocks formed in this way belong to the third majorcategory of rocks, the metamorphic rocks. The process of change is referred to asmetamorphism of the original rock. In dynamic metamorphism, increased stress is the dominant agent, extra heat being relatively unimportant. It is characteristic of narrowbelts of movement, where the rocks on one side are being displaced relative to those onthe other. Whether the rocks are simply crushed, or whether there is some growth of newcrystals, depends largely on the temperature in the mass affected by dynamicmetamorphism.
In thermal metamorphism, increased temperature is the dominant agent producingchange, and the degree of recrystallisation of the original rocks bears a simple relation toit. It is characteristic of the country rocks that lie at the margins of any large igneousintrusions and have been baked and altered by the hot magma. In large masses of granite,the changes extend outwards from the granite for distances of the order of 2 km. Thiszone of metamorphism is called the thermal aureole of the granite mass, and the type ofnew minerals formed at any part within it depends on the temperature attained and thedistance from the granite. The changes that occur in clay or mud rocks within a thermal aureole are shown in Figure 2.37.
Table 2.18 Engineering properties of some unweathered sedimentary rocks.
Density (sp. gr.)
Porosity (%)
Water absorption (%)
Unconfined compressive ve strength (MN m- 2)
conglomerate 2.5–2.8 1–20 — —
sandstone 1.9–2.6 5–25 <14.0 20–179
siltstone 2.2–2.5 2–24 < 6.0 —
shale 2.0–2.4 10–35 <6.0 5–100
hard limestone
2.5–2.7 0–10 <2.0 60–200
soft limestone 2.3–2.5 5–50 <4.0 20–50
(e.g. chalk)
dolomite 2.5–2.75 1–5 <1.5 30–200
Geology for civil engineers 56
www.angoothachaap.blogspot.com
www.angoothachaap.blogspot.com
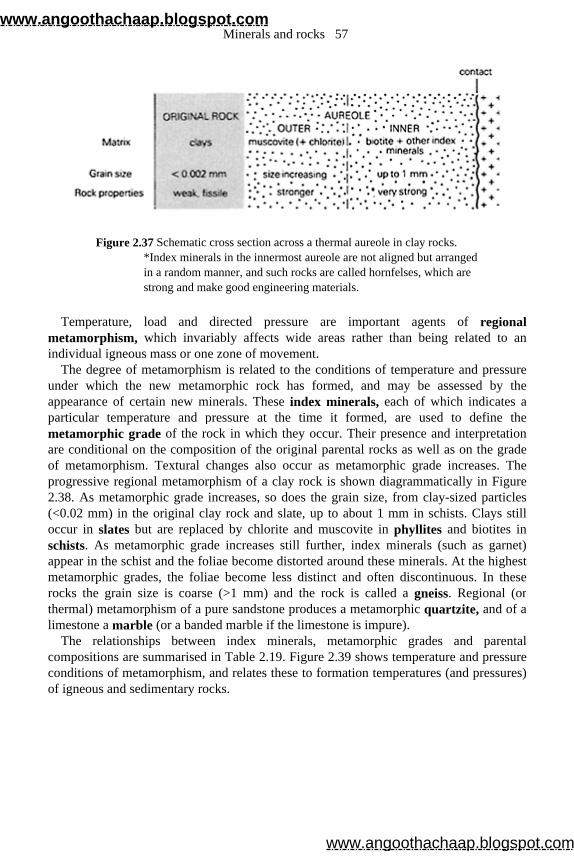
Figure 2.37 Schematic cross section across a thermal aureole in clay rocks. *Index minerals in the innermost aureole are not aligned but arranged in a random manner, and such rocks are called hornfelses, which are strong and make good engineering materials.
Temperature, load and directed pressure are important agents of regional metamorphism, which invariably affects wide areas rather than being related to an individual igneous mass or one zone of movement.
The degree of metamorphism is related to the conditions of temperature and pressure under which the new metamorphic rock has formed, and may be assessed by theappearance of certain new minerals. These index minerals, each of which indicates a particular temperature and pressure at the time it formed, are used to define the metamorphic grade of the rock in which they occur. Their presence and interpretationare conditional on the composition of the original parental rocks as well as on the gradeof metamorphism. Textural changes also occur as metamorphic grade increases. Theprogressive regional metamorphism of a clay rock is shown diagrammatically in Figure 2.38. As metamorphic grade increases, so does the grain size, from clay-sized particles (<0.02 mm) in the original clay rock and slate, up to about 1 mm in schists. Clays stilloccur in slates but are replaced by chlorite and muscovite in phyllites and biotites in schists. As metamorphic grade increases still further, index minerals (such as garnet) appear in the schist and the foliae become distorted around these minerals. At the highestmetamorphic grades, the foliae become less distinct and often discontinuous. In theserocks the grain size is coarse (>1 mm) and the rock is called a gneiss. Regional (or thermal) metamorphism of a pure sandstone produces a metamorphic quartzite, and of a limestone a marble (or a banded marble if the limestone is impure).
The relationships between index minerals, metamorphic grades and parental compositions are summarised in Table 2.19. Figure 2.39 shows temperature and pressure conditions of metamorphism, and relates these to formation temperatures (and pressures)of igneous and sedimentary rocks.
Minerals and rocks 57
www.angoothachaap.blogspot.com
www.angoothachaap.blogspot.com
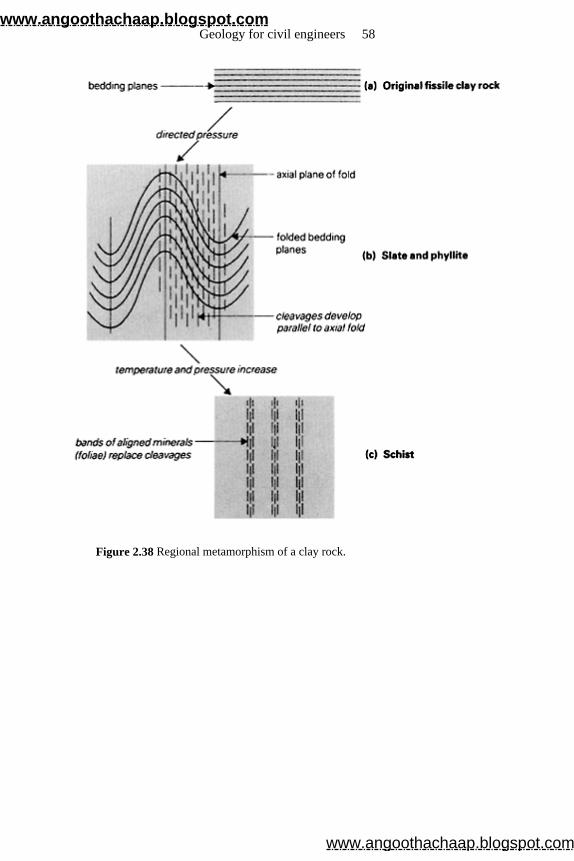
Figure 2.38 Regional metamorphism of a clay rock.
Geology for civil engineers 58
www.angoothachaap.blogspot.com
www.angoothachaap.blogspot.com
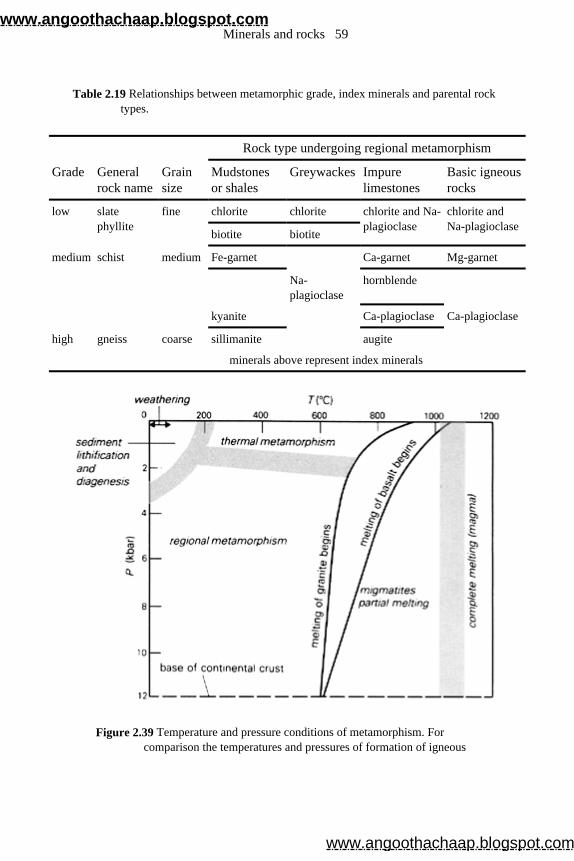
Figure 2.39 Temperature and pressure conditions of metamorphism. For comparison the temperatures and pressures of formation of igneous
Table 2.19 Relationships between metamorphic grade, index minerals and parental rock types.
Rock type undergoing regional metamorphism
Grade General rock name
Grain size
Mudstones or shales
Greywackes Impure limestones
Basic igneous rocks
low slate phyllite
fine chlorite chlorite chlorite and Na-plagioclase
chlorite and Na-plagioclase
biotite biotite
medium schist medium Fe-garnet Ca-garnet Mg-garnet
Na-plagioclase
hornblende
kyanite Ca-plagioclase Ca-plagioclase
high gneiss coarse sillimanite augite
minerals above represent index minerals
Minerals and rocks 59
www.angoothachaap.blogspot.com
www.angoothachaap.blogspot.com
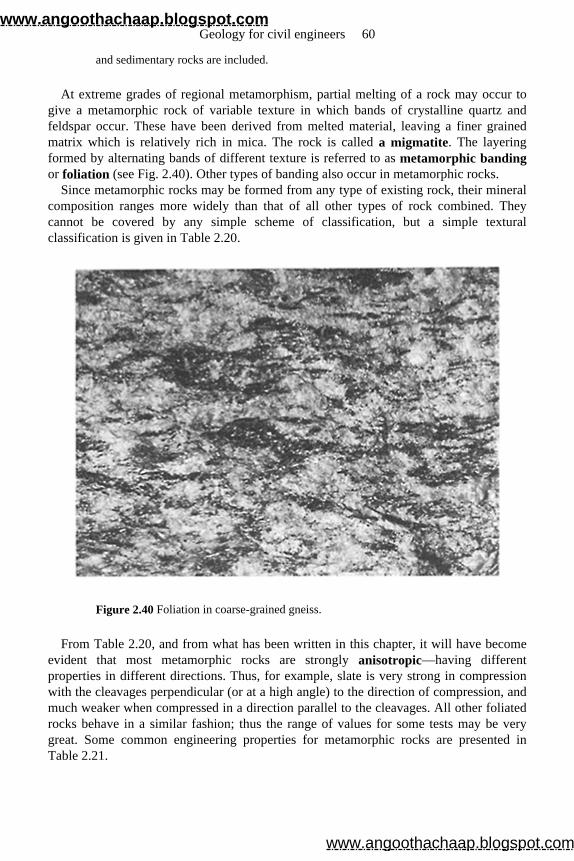
and sedimentary rocks are included.
At extreme grades of regional metamorphism, partial melting of a rock may occur togive a metamorphic rock of variable texture in which bands of crystalline quartz andfeldspar occur. These have been derived from melted material, leaving a finer grainedmatrix which is relatively rich in mica. The rock is called a migmatite. The layering formed by alternating bands of different texture is referred to as metamorphic banding or foliation (see Fig. 2.40). Other types of banding also occur in metamorphic rocks.
Since metamorphic rocks may be formed from any type of existing rock, their mineral composition ranges more widely than that of all other types of rock combined. Theycannot be covered by any simple scheme of classification, but a simple texturalclassification is given in Table 2.20.
Figure 2.40 Foliation in coarse-grained gneiss.
From Table 2.20, and from what has been written in this chapter, it will have becomeevident that most metamorphic rocks are strongly anisotropic—having different properties in different directions. Thus, for example, slate is very strong in compressionwith the cleavages perpendicular (or at a high angle) to the direction of compression, andmuch weaker when compressed in a direction parallel to the cleavages. All other foliatedrocks behave in a similar fashion; thus the range of values for some tests may be verygreat. Some common engineering properties for metamorphic rocks are presented inTable 2.21.
Geology for civil engineers 60
www.angoothachaap.blogspot.com
www.angoothachaap.blogspot.com
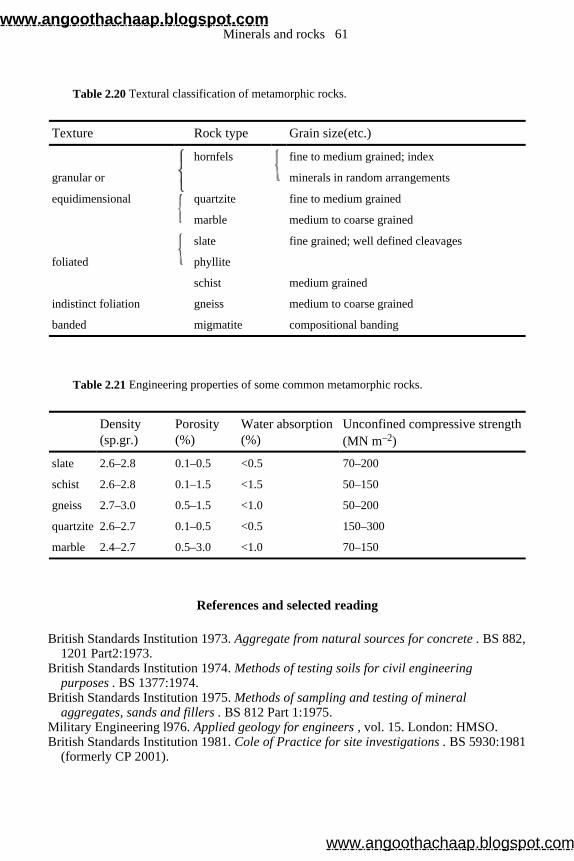
References and selected reading
British Standards Institution 1973. Aggregate from natural sources for concrete . BS 882, 1201 Part2:1973.
British Standards Institution 1974. Methods of testing soils for civil engineering purposes . BS 1377:1974.
British Standards Institution 1975. Methods of sampling and testing of mineral aggregates, sands and fillers . BS 812 Part 1:1975.
Military Engineering l976. Applied geology for engineers , vol. 15. London: HMSO. British Standards Institution 1981. Cole of Practice for site investigations . BS 5930:1981
(formerly CP 2001).
Table 2.20 Textural classification of metamorphic rocks.
Texture Rock type Grain size(etc.)
hornfels
fine to medium grained; index
granular or minerals in random arrangements
equidimensional quartzite fine to medium grained
marble medium to coarse grained
slate fine grained; well defined cleavages
foliated phyllite
schist medium grained
indistinct foliation gneiss medium to coarse grained
banded migmatite compositional banding
Table 2.21 Engineering properties of some common metamorphic rocks.
Density (sp.gr.)
Porosity (%)
Water absorption (%)
Unconfined compressive strength (MN m–2)
slate 2.6–2.8 0.1–0.5 <0.5 70–200
schist 2.6–2.8 0.1–1.5 <1.5 50–150
gneiss 2.7–3.0 0.5–1.5 <1.0 50–200
quartzite 2.6–2.7 0.1–0.5 <0.5 150–300
marble 2.4–2.7 0.5–3.0 <1.0 70–150
Minerals and rocks 61
www.angoothachaap.blogspot.com
www.angoothachaap.blogspot.com

Gillott, J.E. 1968. Clay in engineering geology . Amsterdam: Elsevier. Ministry of Defence and the Institution of Civil Engineers 1976. Applied geology for
engineers . London: HMSO. Pettijohn, F.J. 1975. Sedimentary rocks. 3rd edn. New York: Harper & Row. Press, F. and R.Siever 1982. Earth , 2nd edn. San Francisco: W.H.Freeman. Read H.H. 1970. Rutley’s elements of mineralogy . 26th edn. London: George Allen &
Unwin.
Geology for civil engineers 62
www.angoothachaap.blogspot.com
www.angoothachaap.blogspot.com
3 Superficial deposits
3.1 Soils
The term regolith is used to include the mantle of surface deposits and soils overlying the bedrock. The regolith may vary in thickness from less than 1 m to over 30 m; its density,usually between 1.5 and 2, is less than that of rock.
Geologists and engineers give different meanings to the word ‘soil’. Geologists use the term to refer to any rock waste, produced by the disintegration of rocks at the surf ace byweathering processes, which has formed in situ. These untransported surface deposits arecalled sedentry or residual deposits (Fig. 3.1).
In contrast, engineers use the term ‘soil’ more widely and more loosely, to describe any superficial or surficial deposit which can be excavated without blasting. Thisdefinition covers transported sediments as well as residual deposits (Fig. 3.2). Thus, engineers would regard ‘soil’ as including water-transported sediments (alluvium), wind-transported material (dunes and loess), sediment transported by glaciers or their meltwaters (till or glacial drift) and material moved downhill by gravity (colluvium),and these will be discussed in this chapter. Readers are also referred to the discussion ofsedimentary rocks in Section 2.2.4. Some rocks (such as London Clay) may even be thought of as ‘soil’ by the engineer, since these can be easily excavated.
3.2 Weathering
3.2.1 Introduction
Three processes of weathering and erosion at, and near, the surface transform solid rockinto unconsolidated rock waste (the regolith). These are as follows:
(a) the mechanical disintegration of a rock mass at the surface as water, wind, ice and the rock fragments carried by them buffet or press against it, or force it apart;
(b) chemical reactions between the original minerals of the rock, the near-surface water and the oxygen of the atmosphere to produce new minerals which are stable under the conditions at the Earth’s surface and remove other more soluble constituents;
www.angoothachaap.blogspot.com
www.angoothachaap.blogspot.com
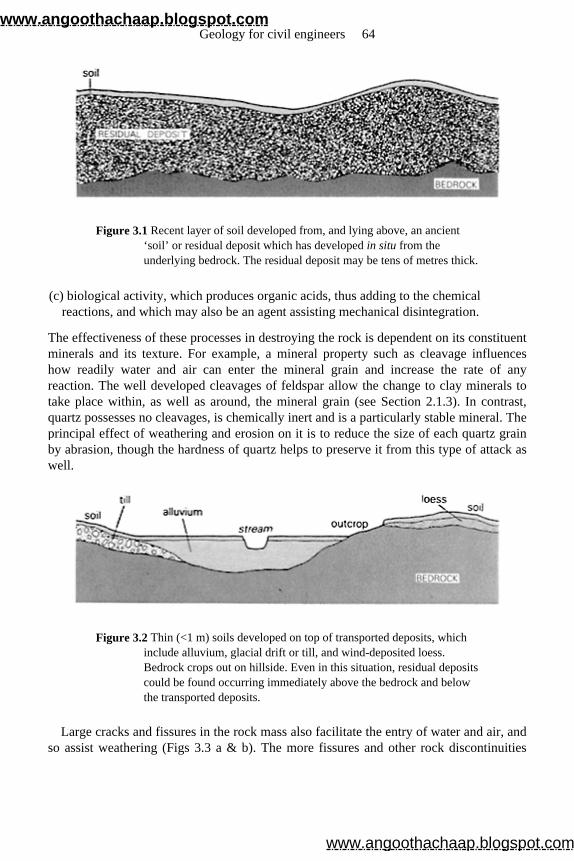
Figure 3.1 Recent layer of soil developed from, and lying above, an ancient ‘soil’ or residual deposit which has developed in situ from the underlying bedrock. The residual deposit may be tens of metres thick.
(c) biological activity, which produces organic acids, thus adding to the chemical reactions, and which may also be an agent assisting mechanical disintegration.
The effectiveness of these processes in destroying the rock is dependent on its constituentminerals and its texture. For example, a mineral property such as cleavage influenceshow readily water and air can enter the mineral grain and increase the rate of anyreaction. The well developed cleavages of feldspar allow the change to clay minerals totake place within, as well as around, the mineral grain (see Section 2.1.3). In contrast, quartz possesses no cleavages, is chemically inert and is a particularly stable mineral. Theprincipal effect of weathering and erosion on it is to reduce the size of each quartz grainby abrasion, though the hardness of quartz helps to preserve it from this type of attack aswell.
Figure 3.2 Thin (<1 m) soils developed on top of transported deposits, which include alluvium, glacial drift or till, and wind-deposited loess. Bedrock crops out on hillside. Even in this situation, residual deposits could be found occurring immediately above the bedrock and below the transported deposits.
Large cracks and fissures in the rock mass also facilitate the entry of water and air, and so assist weathering (Figs 3.3 a & b). The more fissures and other rock discontinuities
Geology for civil engineers 64
www.angoothachaap.blogspot.com
www.angoothachaap.blogspot.com
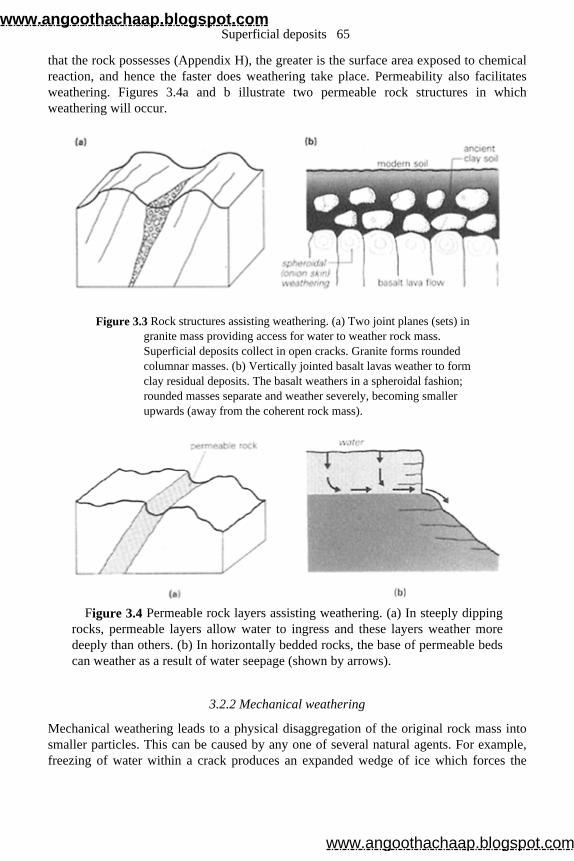
that the rock possesses (Appendix H), the greater is the surface area exposed to chemicalreaction, and hence the faster does weathering take place. Permeability also facilitatesweathering. Figures 3.4a and b illustrate two permeable rock structures in whichweathering will occur.
Figure 3.3 Rock structures assisting weathering. (a) Two joint planes (sets) in granite mass providing access for water to weather rock mass. Superficial deposits collect in open cracks. Granite forms rounded columnar masses. (b) Vertically jointed basalt lavas weather to form clay residual deposits. The basalt weathers in a spheroidal fashion; rounded masses separate and weather severely, becoming smaller upwards (away from the coherent rock mass).
Figure 3.4 Permeable rock layers assisting weathering. (a) In steeply dipping
rocks, permeable layers allow water to ingress and these layers weather more deeply than others. (b) In horizontally bedded rocks, the base of permeable beds can weather as a result of water seepage (shown by arrows).
3.2.2 Mechanical weathering
Mechanical weathering leads to a physical disaggregation of the original rock mass intosmaller particles. This can be caused by any one of several natural agents. For example,freezing of water within a crack produces an expanded wedge of ice which forces the
Superficial deposits 65
www.angoothachaap.blogspot.com
www.angoothachaap.blogspot.com
walls of the crack apart. If the process is repeated by alternate thawing and freezing,fragments from the outer surface of the rock eventually break off to form loose scree. Thesame mechanical effect may be produced locally in the rock by chemical reactionsbetween certain minerals and water that has penetrated along cracks. The hydration ofthese minerals produces a local increase in volume, and local pressure causesdisintegration of the rock. Similarly, entry of water into the minute void spaces in rocksmay allow salts to crystallise there and press against the walls of the void, thusweakening the rock.
Other processes involving the action of water in its various forms include erosion byice, wave action at coasts, river erosion, and slopes being made unstable by the presenceof water in the ground. Some of these agents of mechanical weathering are discussedlater.
Expansion and contraction of the outer skin of a rock mass as it was heated by the sun and cooled at night were formerly thought to be an important agent of weathering, butcareful modern studies show that this process (called exfoliation) requires water to be present for it to work.
3.2.3 Chemical weathering
The process of chemical weathering involves the simultaneous operation within one rockof three things:
(a) the reaction of the original minerals of the rock with water, oxygen and organic acids at the Earth’s surface so that they are broken down chemically with the production and release of new products, some of which are soluble;
(b) the dissolving of these soluble products by water present in cracks in the rock and their eventual removal from it;
(c) the continued reaction of the insoluble rock constituents with water, carbon dioxide, oxygen and other atmospheric gases to form stable new assemblages of minerals.
The principal reactions of the last type are called hydration, carbonation, oxidation andreduction. Hydration is a reaction in which water combines with a rock constituentproducing a mineral that has hydroxyl groups (OH) in its structure, the hydroxyl groupcoming from the water. Carbonation is a reaction involving carbonic acid and limestone.Carbonic acid is formed when carbon dioxide from the atmosphere dissolves in water. Itcan then react with limestone (calcite) to produce soluble calcium or sodium bicarbonate.In the process of oxidation, oxygen combines with a rock constituent, and in two typicalreactions produces new iron-bearing minerals:
magnetite + atmospheric oxygen = haemative
magnetite + atmospheric oxygen + water = hydrated haematite (goethite orlimonite)
Geology for civil engineers 66
www.angoothachaap.blogspot.com
www.angoothachaap.blogspot.com
Reduction takes place in environments deficient in oxygen, and the products of such areaction contain relatively little oxygen. For example, in oxidising conditions organicmatter is converted to carbon dioxide (CO2), but in reducing conditions methane (CH4) is often formed.
An important factor governing the type of chemical reaction that will take place in weathering is the pH value of the local environment within the rock. The pH is related inversely to the concentration of hydrogen ions present in any water. A neutralenvironment has a pH of 7.0, whereas a pH of 6.0, with a hydrogen ion concentration tentimes as great, is acidic. A pH of 8.0 has one-tenth the concentration of hydrogen ions aspH 7.0, and is alkaline.
The ease with which pH value may be changed depends on the chemical properties of the rock or soil, and particularly on the availability of hydrogen ions from chemicalreactions. Thus a sandy soil and a clay soil with the same initial pH value react verydifferently when their pH values are increased by adding lime. The clay soil requiresmore than twice the amount of lime to effect a given change of pH compared with thesandy soil. Rainfall decreases the pH value of a soil as metallic ions are leached out andreplaced by hydrogen ions. In regions of high annual rainfall, soils are usually acidic. Achange of pH as rainfall leaches a soil may trigger further reactions within it, as the firstclay minerals formed become unstable with decreasing pH. Chemical weathering ofcommon rock-forming minerals to produce clay minerals has been discussed fully in Chapter 2, Section 2.1.3.
Non-silicate minerals are minor constituents of most rocks. Sulphates, nitrates, chlorides and carbonates are highly soluble, though the calcium-magnesium carbonate (dolomite) is much less soluble than calcite. Most oxides are unstable and react withwater to produce hydrated minerals, but titanium oxides are stable and occur in soils invery small amounts. Sulphides are unstable and may give rise to small quantities ofsulphuric acid.
3.2.4 Biological weathering
Organic matter in soils is broken down by micro-organisms to give water and either carbon dioxide or methane and small quantities of ammonia and nitric acid. Carbondioxide is produced by aerobic micro-organisms, which require oxygen to survive.Methane is produced by anaerobic micro-organisms which flourish in environments thatare deficient in oxygen, referred to as reducing environments. Decay and decomposition take place much more quickly where oxygen is present. An excessive accumulation ofdecaying organic matter will consume all the available oxygen and produce a reducingenvironment, for example in a poorly drained area such as a bog or in lakes wherecirculation is poor. In these circumstances sulphides form and pyrite is usually present.
Lichens are combinations of fungi and algae and contribute to weathering of rocks,although the precise role that they play in this is uncertain.
Superficial deposits 67
www.angoothachaap.blogspot.com
www.angoothachaap.blogspot.com
3.2.5 Role of vegetation
The macroflora of a region reflects its climatic conditions. Trees and bushes in particularmay effect the physical conditions of rocks by splitting them after roots have penetratedalong cracks. The chemical conditions of the ground may be affected both by extractionof chemical substances by roots and later by the addition of different types of organicmatter when plants decay.
Geological conditions may be revealed by plants. Some species tend to grow in groundthat is predominantly acid (for example, the pines and heathers that occur throughout theScottish Highlands), whereas other types of vegetation require a more alkaline ground. Inthe Scottish Highlands unexposed limestone outcrops can often be predicted by thepresence of grass growing on the overlying soil cover.
3.2.6 Influence of climate
The processes of weathering and erosion depend very much on climate, and there is acorrelation between soil type and local climatic effects, such as ground temperature.Freezing slows down some processes of soil formation; thus arctic soils are poorlydeveloped. In contrast, the process of soil formation may penetrate to great depths in thetropics. The mean temperature at the surface over periods of years rather than the daily oreven annual variations is the factor that controls ground temperature below the top fewmetres. Rocks and soils are very poor conductors of heat, and annual fluctuations cancelout at depths of about 3 m. Daily variations have no effect below the top 1 m.
The relative importance of reactions involving water depends both on rainfall and on the temperature of the water. The reaction rate doubles for each 10°C rise. The effects of rainfall are demonstrated simply by describing two very different environments. In desertregions, which have very low rainfall, water on and in the rocks and soils is evaporatedduring most days. It is not available to leach soluble metallic ions from the rock andreplace them with hydrogen ions. This, plus an abundance of oxygen in contact with drymineral grains, as well as a lack of organic material, produces high pH values of 7.5 to9.5. Reactions are slowed, and iron from the rocks is changed to the oxygen-rich ferric form. Montmorillonite, illite and chlorite are other new products that form.
In contrast, tropical rainforests have heavy rainfall, which in turn yields a profusion of vegetable matter and saturation of all cracks and other voids in the rocks and soils towithin a short distance of the surface. Soil formation takes place in a reducingenvironment in which metallic ions are leached out and reactions are fast; pH values aretypically between 3.5 and 5.5. The rapid, thorough weathering results in an accumulationof aluminium- and titanium-rich deposits, such as bauxite.
In limestone country, closed depressions are sometimes seen. These form as a result of the solution of limestone by meteoric waters (Section 5.2.1) that carve out underground caverns, the roofs of which collapse. This landscape feature is known as karst topography.
Geology for civil engineers 68
www.angoothachaap.blogspot.com
www.angoothachaap.blogspot.com
3.3 Modern residual soils
3.3.1 Soil development and engineering grades of weathering
Most modern soils are developed on top of other superficial deposits, which are eithertransported or residual. In the latter case, the present-day soil is developed from an older one. Only occasionally is the development of soils taking place immediately on top ofsolid bedrock, with a continuous gradation into it. A profile through a modern soiltypically shows, from top to bottom, plant debris grading downwards into decayingorganic matter, which in turn grades into the weathered parental material or saprolite.
Figure 3.5 shows a typical residual deposit developed by weathering in situ above bedrock. The bedrock shows a gradual change upwards from fresh rock into weatheredrock showing discolouration, and then into more severely weathered material, whichincreases in amount until all the rock mass is decomposed. The rock mass maydecompose to give either a continuous framework, in which structures originallyoccurring in the rock mass appear as ghost structures, or corestones, which graduallydecompose nearer the surface.
To describe the degree of weathering of the rock mass from which an overlying residual soil has formed, engineers have devised a descriptive scheme for grading theprogressive changes. This is shown in Table 3.1. All grades of weathering may be visiblein a large rock mass, with variation in grade related to the relative ease with which waterhas penetrated at different points. This is likely to be determined by the presence of opencracks in the rock mass.
In Figure 3.5, the grade of weathering of the rock mass has been indicated at variouslevels in the residual deposit. Note that the thicknesses of the zones in the residualdeposits shown in Figure 3.5 are highly variable. Zone II may vary up to 5 m butdiscolouration may extend along joints and cracks deep into the rock mass. Zone III isusually between 2 and 6 m thick and zone IV can be many tens of metres thick. Zone V isvariable and zone VI usually thin, 2 m or less.
3.3.2 Soil description
The decomposition of the organic matter produces a variety of acids, the most importantof which is carbonic acid. These acids move downwards and react with existing minerals at lower levels in the soil, producing soluble components which in turn move downwards.The soil layer in which these reactions occur and from which soluble compounds areremoved is called the leached (or eluviated) layer, or the A horizon. The soluble components are deposited below it in the illuviated layer (the B horizon). These uppermost three layers (the organic debris, the A horizon and the B horizon) comprise thesolum. Below it there is minimal solution and redeposition in the C and R horizons; C consists of weathered and R of fresh parental material (Fig. 3.6).
Superficial deposits 69
www.angoothachaap.blogspot.com
www.angoothachaap.blogspot.com
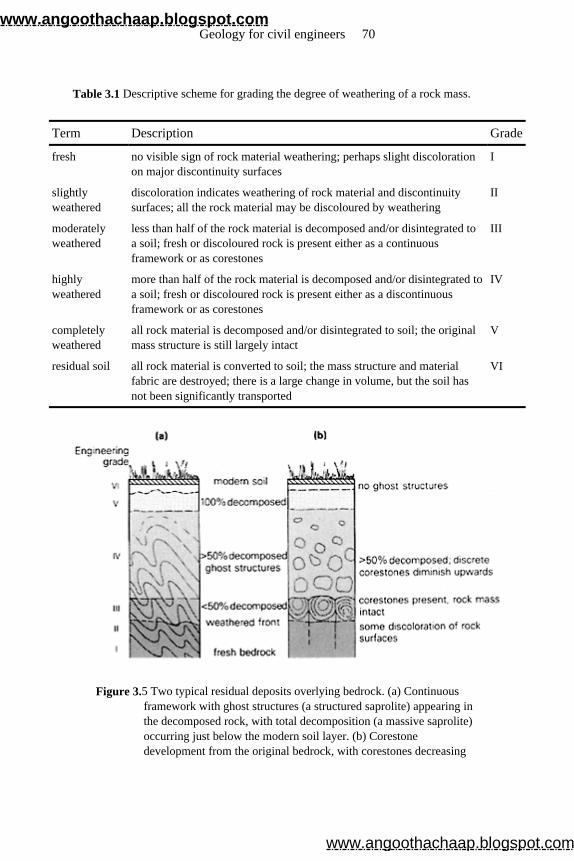
Figure 3.5 Two typical residual deposits overlying bedrock. (a) Continuous framework with ghost structures (a structured saprolite) appearing in the decomposed rock, with total decomposition (a massive saprolite) occurring just below the modern soil layer. (b) Corestone development from the original bedrock, with corestones decreasing
Table 3.1 Descriptive scheme for grading the degree of weathering of a rock mass.
Term Description Grade
fresh no visible sign of rock material weathering; perhaps slight discoloration on major discontinuity surfaces
I
slightly weathered
discoloration indicates weathering of rock material and discontinuity surfaces; all the rock material may be discoloured by weathering
II
moderately weathered
less than half of the rock material is decomposed and/or disintegrated to a soil; fresh or discoloured rock is present either as a continuous framework or as corestones
III
highly weathered
more than half of the rock material is decomposed and/or disintegrated to a soil; fresh or discoloured rock is present either as a discontinuous framework or as corestones
IV
completely weathered
all rock material is decomposed and/or disintegrated to soil; the original mass structure is still largely intact
V
residual soil all rock material is converted to soil; the mass structure and material fabric are destroyed; there is a large change in volume, but the soil has not been significantly transported
VI
Geology for civil engineers 70
www.angoothachaap.blogspot.com
www.angoothachaap.blogspot.com
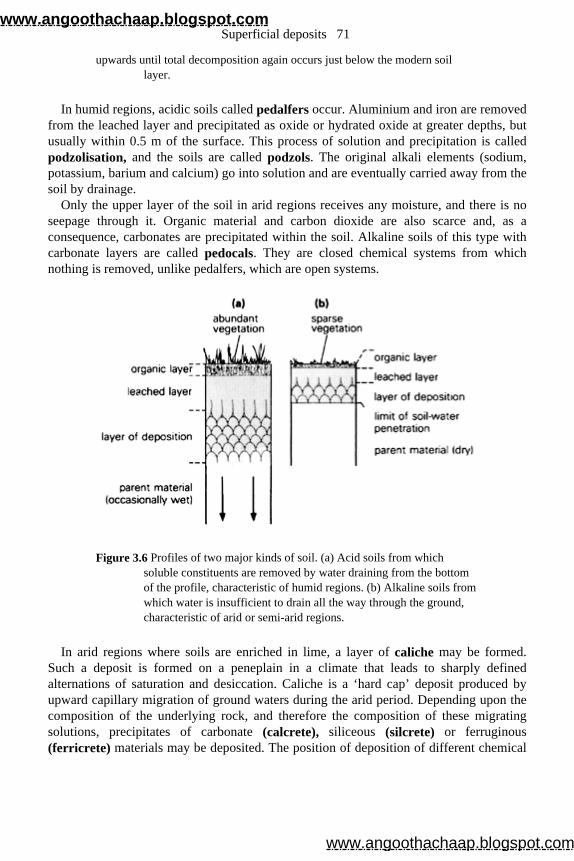
upwards until total decomposition again occurs just below the modern soil layer.
In humid regions, acidic soils called pedalfers occur. Aluminium and iron are removed from the leached layer and precipitated as oxide or hydrated oxide at greater depths, butusually within 0.5 m of the surface. This process of solution and precipitation is calledpodzolisation, and the soils are called podzols. The original alkali elements (sodium, potassium, barium and calcium) go into solution and are eventually carried away from thesoil by drainage.
Only the upper layer of the soil in arid regions receives any moisture, and there is noseepage through it. Organic material and carbon dioxide are also scarce and, as aconsequence, carbonates are precipitated within the soil. Alkaline soils of this type withcarbonate layers are called pedocals. They are closed chemical systems from whichnothing is removed, unlike pedalfers, which are open systems.
Figure 3.6 Profiles of two major kinds of soil. (a) Acid soils from which soluble constituents are removed by water draining from the bottom of the profile, characteristic of humid regions. (b) Alkaline soils from which water is insufficient to drain all the way through the ground, characteristic of arid or semi-arid regions.
In arid regions where soils are enriched in lime, a layer of caliche may be formed. Such a deposit is formed on a peneplain in a climate that leads to sharply definedalternations of saturation and desiccation. Caliche is a ‘hard cap’ deposit produced by upward capillary migration of ground waters during the arid period. Depending upon thecomposition of the underlying rock, and therefore the composition of these migratingsolutions, precipitates of carbonate (calcrete), siliceous (silcrete) or ferruginous (ferricrete) materials may be deposited. The position of deposition of different chemical
Superficial deposits 71
www.angoothachaap.blogspot.com
www.angoothachaap.blogspot.com
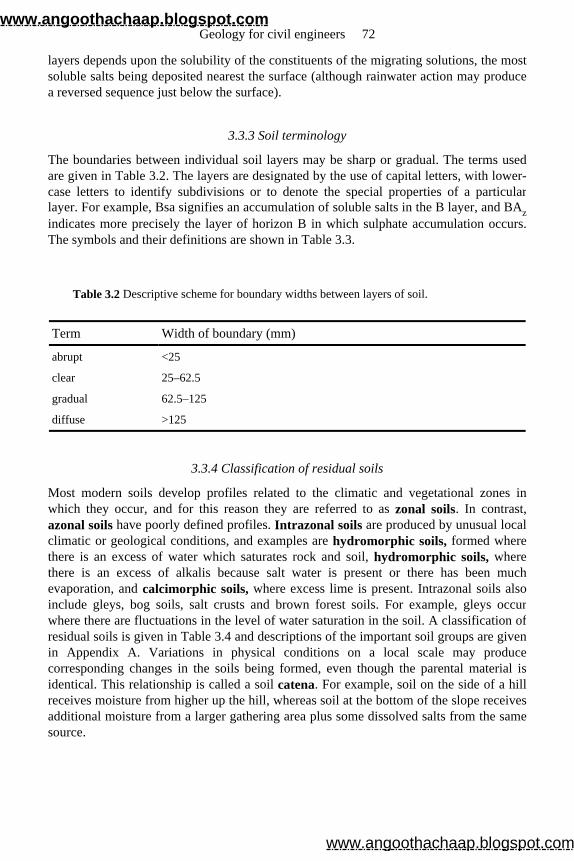
layers depends upon the solubility of the constituents of the migrating solutions, the mostsoluble salts being deposited nearest the surface (although rainwater action may producea reversed sequence just below the surface).
3.3.3 Soil terminology
The boundaries between individual soil layers may be sharp or gradual. The terms usedare given in Table 3.2. The layers are designated by the use of capital letters, with lower-case letters to identify subdivisions or to denote the special properties of a particularlayer. For example, Bsa signifies an accumulation of soluble salts in the B layer, and BAzindicates more precisely the layer of horizon B in which sulphate accumulation occurs.The symbols and their definitions are shown in Table 3.3.
3.3.4 Classification of residual soils
Most modern soils develop profiles related to the climatic and vegetational zones inwhich they occur, and for this reason they are referred to as zonal soils. In contrast, azonal soils have poorly defined profiles. Intrazonal soils are produced by unusual local climatic or geological conditions, and examples are hydromorphic soils, formed where there is an excess of water which saturates rock and soil, hydromorphic soils, where there is an excess of alkalis because salt water is present or there has been muchevaporation, and calcimorphic soils, where excess lime is present. Intrazonal soils alsoinclude gleys, bog soils, salt crusts and brown forest soils. For example, gleys occurwhere there are fluctuations in the level of water saturation in the soil. A classification ofresidual soils is given in Table 3.4 and descriptions of the important soil groups are given in Appendix A. Variations in physical conditions on a local scale may producecorresponding changes in the soils being formed, even though the parental material isidentical. This relationship is called a soil catena. For example, soil on the side of a hill receives moisture from higher up the hill, whereas soil at the bottom of the slope receivesadditional moisture from a larger gathering area plus some dissolved salts from the samesource.
Table 3.2 Descriptive scheme for boundary widths between layers of soil.
Term Width of boundary (mm)
abrupt <25
clear 25–62.5
gradual 62.5–125
diffuse >125
Geology for civil engineers 72
www.angoothachaap.blogspot.com
www.angoothachaap.blogspot.com
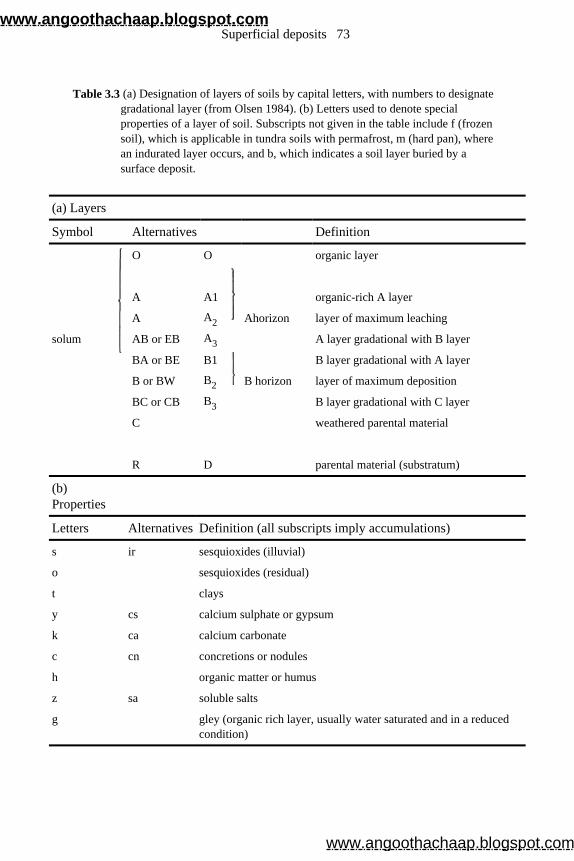
Table 3.3 (a) Designation of layers of soils by capital letters, with numbers to designate gradational layer (from Olsen 1984). (b) Letters used to denote special properties of a layer of soil. Subscripts not given in the table include f (frozen soil), which is applicable in tundra soils with permafrost, m (hard pan), where an indurated layer occurs, and b, which indicates a soil layer buried by a surface deposit.
(a) Layers
Symbol Alternatives Definition
O O organic layer
A A1 organic-rich A layer
A A2 Ahorizon layer of maximum leaching
solum AB or EB A3 A layer gradational with B layer
BA or BE B1
B layer gradational with A layer
B or BW B2 B horizon layer of maximum deposition
BC or CB B3 B layer gradational with C layer
C weathered parental material
R D parental material (substratum)
(b) Properties
Letters Alternatives Definition (all subscripts imply accumulations)
s ir sesquioxides (illuvial)
o sesquioxides (residual)
t clays
y cs calcium sulphate or gypsum
k ca calcium carbonate
c cn concretions or nodules
h organic matter or humus
z sa soluble salts
g gley (organic rich layer, usually water saturated and in a reduced condition)
Superficial deposits 73
www.angoothachaap.blogspot.com
www.angoothachaap.blogspot.com
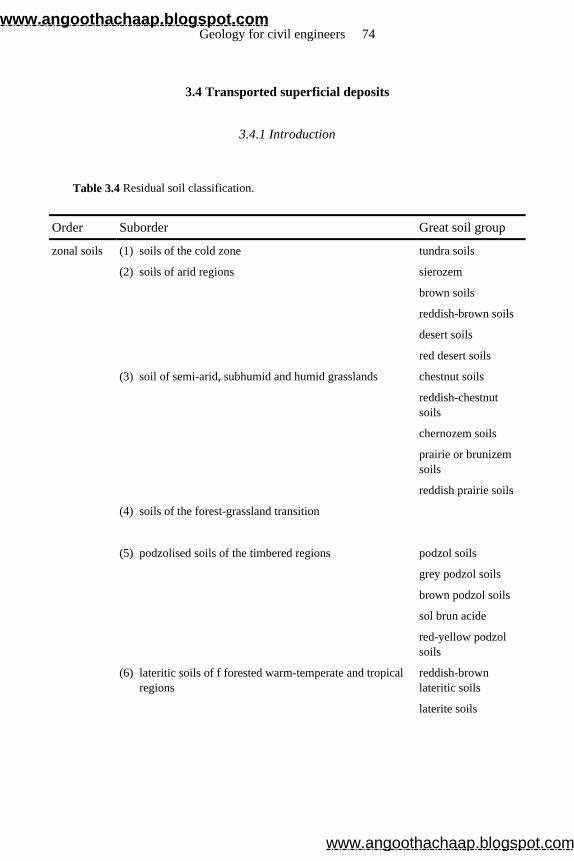
3.4 Transported superficial deposits
3.4.1 Introduction
Table 3.4 Residual soil classification.
Order Suborder Great soil group
zonal soils (1) soils of the cold zone tundra soils
(2) soils of arid regions sierozem
brown soils
reddish-brown soils
desert soils
red desert soils
(3) soil of semi-arid, subhumid and humid grasslands chestnut soils
reddish-chestnut soils
chernozem soils
prairie or brunizem soils
reddish prairie soils
(4) soils of the forest-grassland transition
(5) podzolised soils of the timbered regions podzol soils
grey podzol soils
brown podzol soils
sol brun acide
red-yellow podzol soils
(6) lateritic soils of f forested warm-temperate and tropical regions
reddish-brown lateritic soils
laterite soils
Geology for civil engineers 74
www.angoothachaap.blogspot.com
www.angoothachaap.blogspot.com
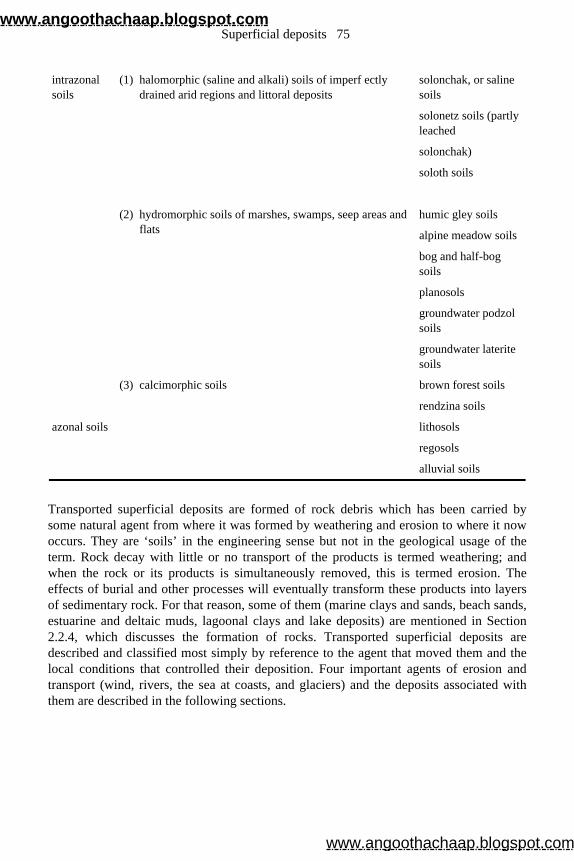
Transported superficial deposits are formed of rock debris which has been carried bysome natural agent from where it was formed by weathering and erosion to where it nowoccurs. They are ‘soils’ in the engineering sense but not in the geological usage of theterm. Rock decay with little or no transport of the products is termed weathering; and when the rock or its products is simultaneously removed, this is termed erosion. Theeffects of burial and other processes will eventually transform these products into layersof sedimentary rock. For that reason, some of them (marine clays and sands, beach sands,estuarine and deltaic muds, lagoonal clays and lake deposits) are mentioned in Section 2.2.4, which discusses the formation of rocks. Transported superficial deposits are described and classified most simply by reference to the agent that moved them and thelocal conditions that controlled their deposition. Four important agents of erosion andtransport (wind, rivers, the sea at coasts, and glaciers) and the deposits associated withthem are described in the following sections.
intrazonal soils
(1) halomorphic (saline and alkali) soils of imperf ectly drained arid regions and littoral deposits
solonchak, or saline soils
solonetz soils (partly leached
solonchak)
soloth soils
(2) hydromorphic soils of marshes, swamps, seep areas and flats
humic gley soils
alpine meadow soils
bog and half-bog soils
planosols
groundwater podzol soils
groundwater laterite soils
(3) calcimorphic soils brown forest soils
rendzina soils
azonal soils lithosols
regosols
alluvial soils
Superficial deposits 75
www.angoothachaap.blogspot.com
www.angoothachaap.blogspot.com
3.4.2 Aeolian (windborne) deposits
A strong wind blowing across rock debris or soil can lift and carry fine material as dust,and can move the larger sand grains by rolling them and making them bounce across thesurface. This windborne movement of material occurs in areas with little or no vegetationand is typical of hot desert regions, although the process also operates in cold deserts andsome coastal areas. Wind both transports and sorts the material. The finer, silt-sized fraction is carried in suspension by the wind, and may travel great distances before it iseventually deposited as loess. The coarser material that remains forms sand dunes. Bothloess and sand dunes are liable to further erosion by wind unless their surface is stabilisedby vegetation or another binding agent. They are composed mainly of quartz with asmaller fraction of other stable minerals such as iron oxides. Near coasts calcite in theform of shell debris may occur occasionally. Clay minerals are virtually absent.
Erosion and transport by wind are most important in desert regions, which lack a protective cover of vegetation and a skin of surface water to bind the grains together.Conditions favouring the formation of aeolian deposits were, however, more widespreadin the present temperate zones during and immediately after the Great Ice Age, whichended approximately 10000 years ago (see Section 3.5.1). For example, lowered sea levels at certain times left broad stretches of beach sand exposed to wind action, andassisted the formation of sand dunes along many British coasts. In other regions that werefree, or freed, of ice and temporarily devoid of plants, the deposits left by the retreatingice, together with other soils, provided sources of loess.
3.4.3 Alluvial (riverborne) deposits
Lateral erosion by a river into its banks eventually produces a valley which is much wider than its course. Erosion at one point is matched by deposition at another and a widevalley is eventually filled with alluvial deposits. These include cross-bedded and evenly bedded sands, silts and gravels, plus spreads of fine silt and clay across the flatfloodplain at the sides of a river (Fig. 3.7). These fine-grained layers are related to periods of spate, when flood waters spilling beyond the river channel suffer a suddendecrease in their rate of flow. Settling of the load of suspended sediment takes place inthe slack water covering the floodplain, especially close to the banks. Large mounds formalong the sides of a major river in this way, and are called levees.
Geology for civil engineers 76
www.angoothachaap.blogspot.com
www.angoothachaap.blogspot.com
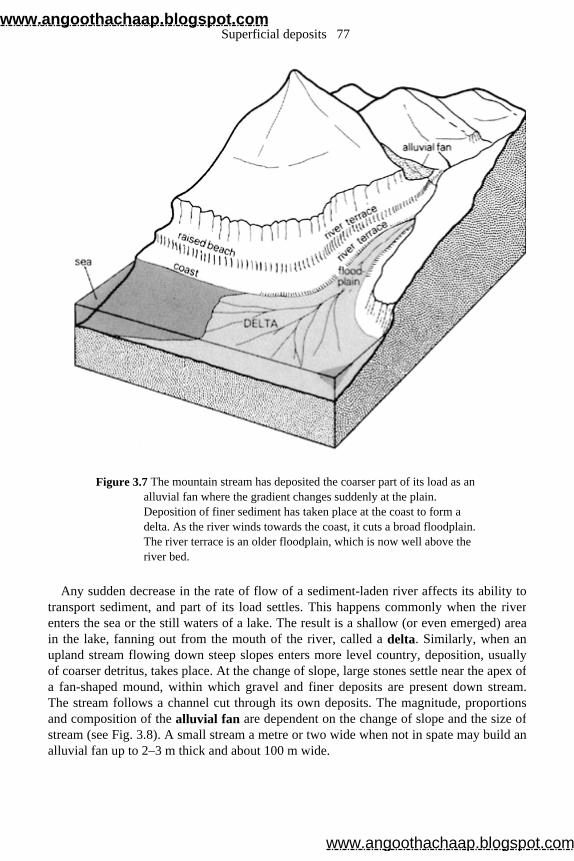
Figure 3.7 The mountain stream has deposited the coarser part of its load as an alluvial fan where the gradient changes suddenly at the plain. Deposition of finer sediment has taken place at the coast to form a delta. As the river winds towards the coast, it cuts a broad floodplain. The river terrace is an older floodplain, which is now well above the river bed.
Any sudden decrease in the rate of flow of a sediment-laden river affects its ability to transport sediment, and part of its load settles. This happens commonly when the riverenters the sea or the still waters of a lake. The result is a shallow (or even emerged) areain the lake, fanning out from the mouth of the river, called a delta. Similarly, when an upland stream flowing down steep slopes enters more level country, deposition, usuallyof coarser detritus, takes place. At the change of slope, large stones settle near the apex of a fan-shaped mound, within which gravel and finer deposits are present down stream.The stream follows a channel cut through its own deposits. The magnitude, proportionsand composition of the alluvial fan are dependent on the change of slope and the size of stream (see Fig. 3.8). A small stream a metre or two wide when not in spate may build an alluvial fan up to 2–3 m thick and about 100 m wide.
Superficial deposits 77
www.angoothachaap.blogspot.com
www.angoothachaap.blogspot.com
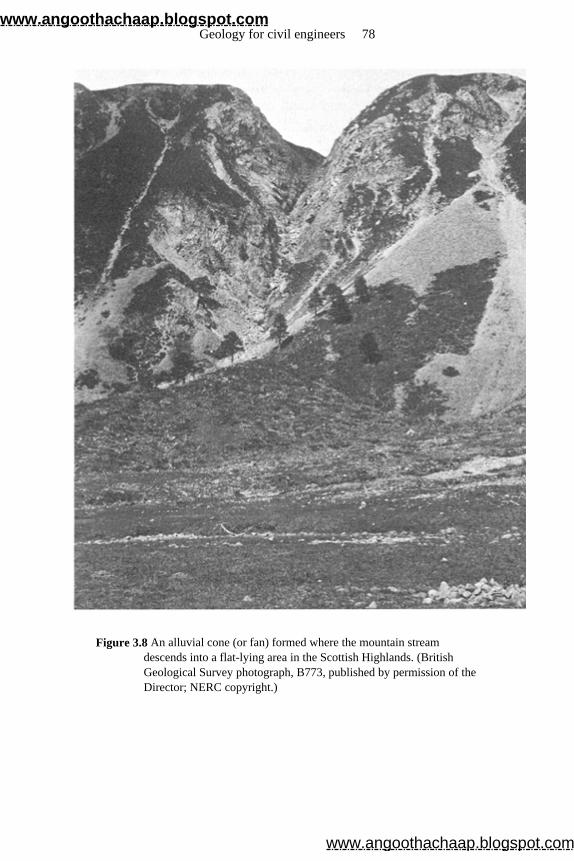
Figure 3.8 An alluvial cone (or fan) formed where the mountain stream descends into a flat-lying area in the Scottish Highlands. (British Geological Survey photograph, B773, published by permission of the Director; NERC copyright.)
Geology for civil engineers 78
www.angoothachaap.blogspot.com
www.angoothachaap.blogspot.com
The discharge of a river (Q) can be estimated by the formula Q= 750M0 . 67, where Qis discharge in cusecs (that is cubic feet per second) and M is the catchment area of the river in square miles. In the USA another formula (the Myers Formula) is used: Q (peak discharge in cusecs)=qa = 10000 (a) ½, where a is catchment area in square miles. For amaximum flood, Q max=100 P(a) ½, where P is a Myers rating for rivers of differentcatchment areas. In 100 rivers in the USA, P varied from 0.14 to 289. Catchment areas of less than 1000 square miles have P values of less than 50. In general, British rivers have a P rating of about 16.
If the river were to cut deeply into its bed (for example, in the process of adjusting to a lowered sea level), then the floodplain is left high and dry above the river as a river terrace. Each time the base level of the river changes, a new set of terraces may beformed. The oldest would be perched highest above the river if sea level were loweredprogressively. The deposits of a river terrace are generally coarser than the neighbouringalluvium, since maturity of the river decreases the rate of erosion and the grade sizecarried by it at a particular locality. The difference in height between the flood plain anda terrace is typically a few metres, but may be as much as a kilometre in regions of rapiduplift such as the Andes.
3.4.4 Erosion and deposition at the coast
The sea erodes by the pounding action of waves on the base of cliffs, and also bycompressing air present in crevices and so causing further explosive impact within them.The cutting action of its currents as they sweep across the foreshore is aided by therubbing of pebbles dragged along by the moving water. Limestone cliffs may also suffersome erosion by solution of the rock in water. As a result of these agents, a notch is cut atthe foot of cliffs (Figs 3.9 & 10) undermining them and causing them to collapse andretreat from the sea. This leaves a wave-cut platform between the cliffs and low-water mark. Where the cliffs are formed of poorly consolidated rock and soils, erosion mayproceed at rates that average 1–2 m per year. This erosion usually takes the form of sporadic and alarming inroads by cliff falls after storms. For example, in 1953 thecoincidence of a few adverse factors produced a disastrous surge of sea level in thesouthern North Sea to heights of 2½ m above normal, and in the course of two hours some low cliffs in eastern England were cut back by 10 m. Along such coastlines, wavesgenerated by wind action are more important than ‘tidal waves’. The size of waves generated in the open sea is dependent upon fetch, which is the distance over which thewind operates. The Stevenson Formula, H=1.5 (f) ½, is used to calculate wave size, where H is trough-to-crest wave height in feet and f fetch in miles. For example, the northeastern coast of England has a maximum fetch of some 300 miles to Denmark, thus
the maximum value of H would be 1.5 × =26 ft. Wind speed is obviously an important factor and the reader is referred to Bretschneider (1952), Darbyshire andDraper (1963) and Wood (1969) for detailed information on this topic. Where the toes ofcliffs are sited in deep water, these cliffs will have to withstand waves of StevensonFormula height.
Superficial deposits 79
www.angoothachaap.blogspot.com
www.angoothachaap.blogspot.com
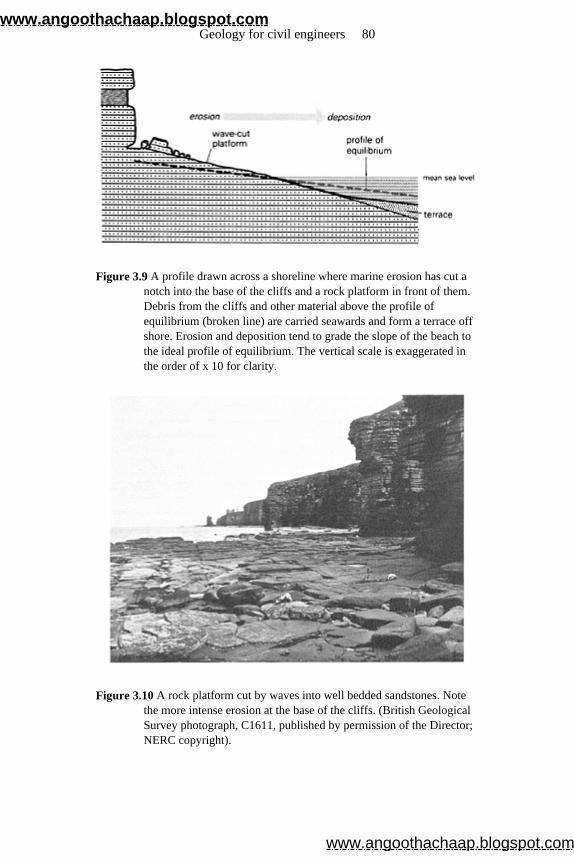
Figure 3.9 A profile drawn across a shoreline where marine erosion has cut a notch into the base of the cliffs and a rock platform in front of them. Debris from the cliffs and other material above the profile of equilibrium (broken line) are carried seawards and form a terrace off shore. Erosion and deposition tend to grade the slope of the beach to the ideal profile of equilibrium. The vertical scale is exaggerated in the order of x 10 for clarity.
Figure 3.10 A rock platform cut by waves into well bedded sandstones. Note the more intense erosion at the base of the cliffs. (British Geological Survey photograph, C1611, published by permission of the Director; NERC copyright).
Geology for civil engineers 80
www.angoothachaap.blogspot.com
www.angoothachaap.blogspot.com
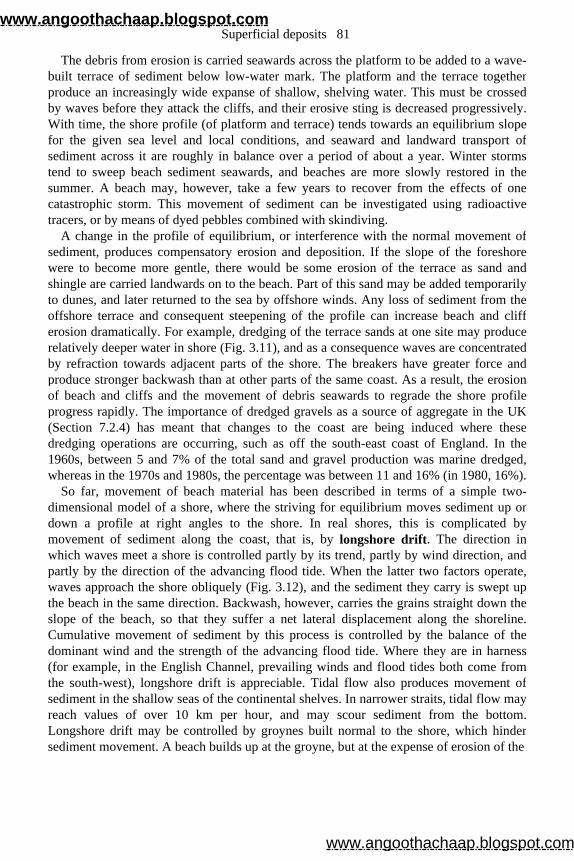
The debris from erosion is carried seawards across the platform to be added to a wave-built terrace of sediment below low-water mark. The platform and the terrace togetherproduce an increasingly wide expanse of shallow, shelving water. This must be crossedby waves before they attack the cliffs, and their erosive sting is decreased progressively.With time, the shore profile (of platform and terrace) tends towards an equilibrium slopefor the given sea level and local conditions, and seaward and landward transport ofsediment across it are roughly in balance over a period of about a year. Winter stormstend to sweep beach sediment seawards, and beaches are more slowly restored in thesummer. A beach may, however, take a few years to recover from the effects of onecatastrophic storm. This movement of sediment can be investigated using radioactivetracers, or by means of dyed pebbles combined with skindiving.
A change in the profile of equilibrium, or interference with the normal movement ofsediment, produces compensatory erosion and deposition. If the slope of the foreshorewere to become more gentle, there would be some erosion of the terrace as sand andshingle are carried landwards on to the beach. Part of this sand may be added temporarilyto dunes, and later returned to the sea by offshore winds. Any loss of sediment from theoffshore terrace and consequent steepening of the profile can increase beach and clifferosion dramatically. For example, dredging of the terrace sands at one site may producerelatively deeper water in shore (Fig. 3.11), and as a consequence waves are concentratedby refraction towards adjacent parts of the shore. The breakers have greater force andproduce stronger backwash than at other parts of the same coast. As a result, the erosionof beach and cliffs and the movement of debris seawards to regrade the shore profileprogress rapidly. The importance of dredged gravels as a source of aggregate in the UK(Section 7.2.4) has meant that changes to the coast are being induced where these dredging operations are occurring, such as off the south-east coast of England. In the 1960s, between 5 and 7% of the total sand and gravel production was marine dredged,whereas in the 1970s and 1980s, the percentage was between 11 and 16% (in 1980, 16%).
So far, movement of beach material has been described in terms of a simple two-dimensional model of a shore, where the striving for equilibrium moves sediment up ordown a profile at right angles to the shore. In real shores, this is complicated bymovement of sediment along the coast, that is, by longshore drift. The direction in which waves meet a shore is controlled partly by its trend, partly by wind direction, andpartly by the direction of the advancing flood tide. When the latter two factors operate,waves approach the shore obliquely (Fig. 3.12), and the sediment they carry is swept up the beach in the same direction. Backwash, however, carries the grains straight down theslope of the beach, so that they suffer a net lateral displacement along the shoreline.Cumulative movement of sediment by this process is controlled by the balance of thedominant wind and the strength of the advancing flood tide. Where they are in harness(for example, in the English Channel, prevailing winds and flood tides both come fromthe south-west), longshore drift is appreciable. Tidal flow also produces movement ofsediment in the shallow seas of the continental shelves. In narrower straits, tidal flow mayreach values of over 10 km per hour, and may scour sediment from the bottom.Longshore drift may be controlled by groynes built normal to the shore, which hindersediment movement. A beach builds up at the groyne, but at the expense of erosion of the
Superficial deposits 81
www.angoothachaap.blogspot.com
www.angoothachaap.blogspot.com
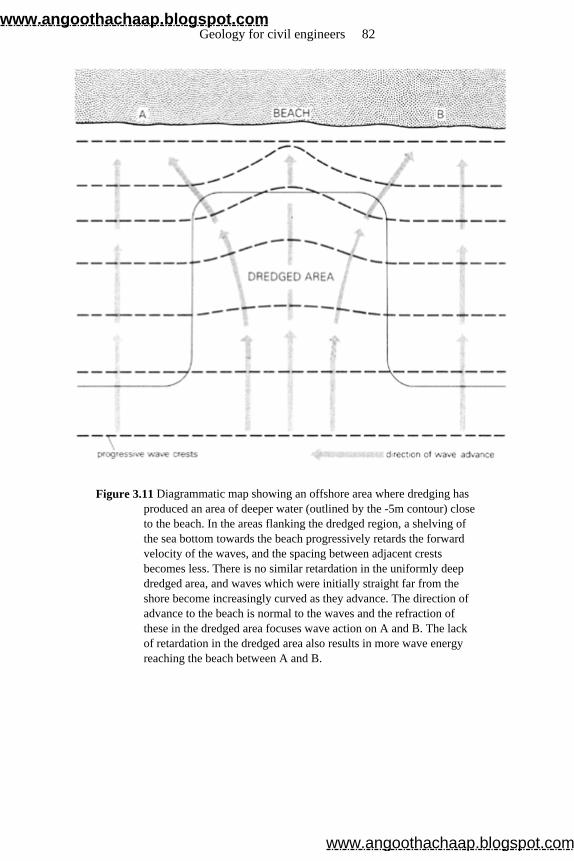
Figure 3.11 Diagrammatic map showing an offshore area where dredging has produced an area of deeper water (outlined by the -5m contour) close to the beach. In the areas flanking the dredged region, a shelving of the sea bottom towards the beach progressively retards the forward velocity of the waves, and the spacing between adjacent crests becomes less. There is no similar retardation in the uniformly deep dredged area, and waves which were initially straight far from the shore become increasingly curved as they advance. The direction of advance to the beach is normal to the waves and the refraction of these in the dredged area focuses wave action on A and B. The lack of retardation in the dredged area also results in more wave energy reaching the beach between A and B.
Geology for civil engineers 82
www.angoothachaap.blogspot.com
www.angoothachaap.blogspot.com
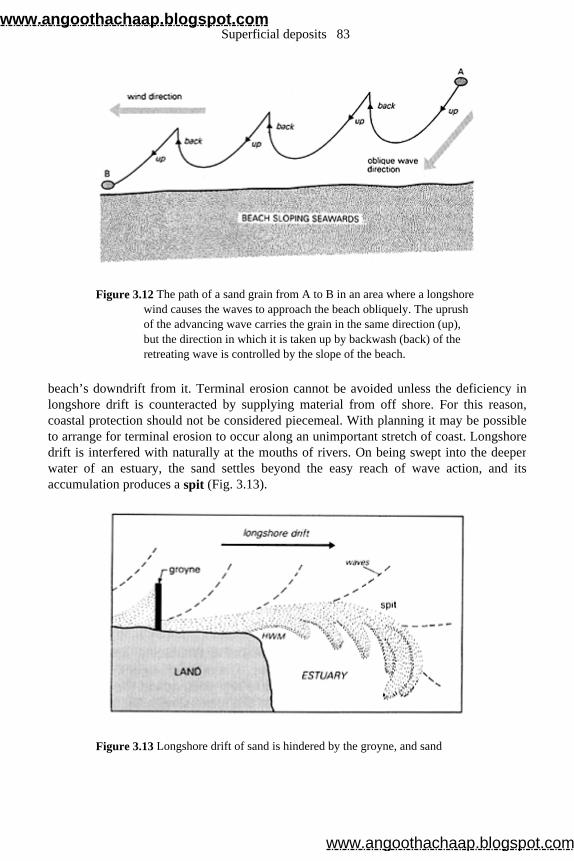
Figure 3.12 The path of a sand grain from A to B in an area where a longshore wind causes the waves to approach the beach obliquely. The uprush of the advancing wave carries the grain in the same direction (up), but the direction in which it is taken up by backwash (back) of the retreating wave is controlled by the slope of the beach.
beach’s downdrift from it. Terminal erosion cannot be avoided unless the deficiency in longshore drift is counteracted by supplying material from off shore. For this reason,coastal protection should not be considered piecemeal. With planning it may be possibleto arrange for terminal erosion to occur along an unimportant stretch of coast. Longshoredrift is interfered with naturally at the mouths of rivers. On being swept into the deeperwater of an estuary, the sand settles beyond the easy reach of wave action, and itsaccumulation produces a spit (Fig. 3.13).
Figure 3.13 Longshore drift of sand is hindered by the groyne, and sand
Superficial deposits 83
www.angoothachaap.blogspot.com
www.angoothachaap.blogspot.com
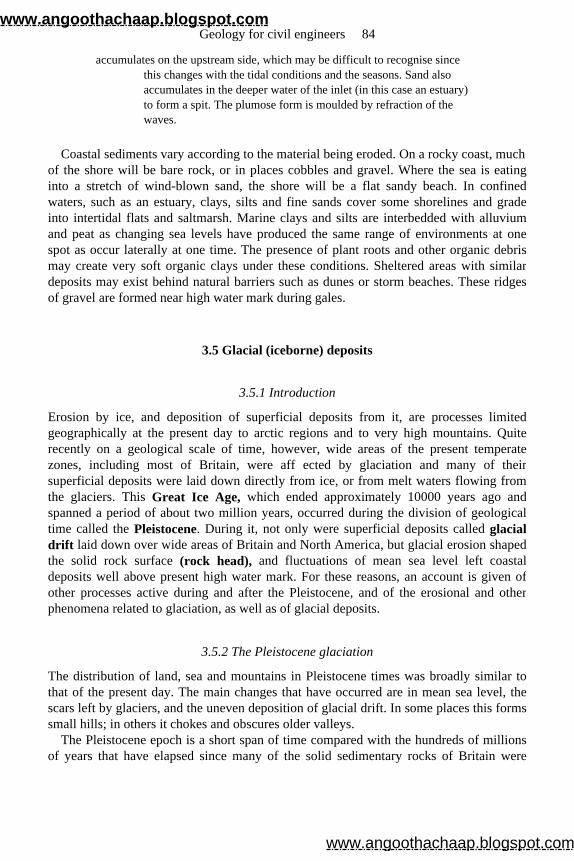
accumulates on the upstream side, which may be difficult to recognise since this changes with the tidal conditions and the seasons. Sand also accumulates in the deeper water of the inlet (in this case an estuary) to form a spit. The plumose form is moulded by refraction of the waves.
Coastal sediments vary according to the material being eroded. On a rocky coast, much of the shore will be bare rock, or in places cobbles and gravel. Where the sea is eatinginto a stretch of wind-blown sand, the shore will be a flat sandy beach. In confined waters, such as an estuary, clays, silts and fine sands cover some shorelines and gradeinto intertidal flats and saltmarsh. Marine clays and silts are interbedded with alluviumand peat as changing sea levels have produced the same range of environments at onespot as occur laterally at one time. The presence of plant roots and other organic debrismay create very soft organic clays under these conditions. Sheltered areas with similardeposits may exist behind natural barriers such as dunes or storm beaches. These ridgesof gravel are formed near high water mark during gales.
3.5 Glacial (iceborne) deposits
3.5.1 Introduction
Erosion by ice, and deposition of superficial deposits from it, are processes limitedgeographically at the present day to arctic regions and to very high mountains. Quiterecently on a geological scale of time, however, wide areas of the present temperatezones, including most of Britain, were aff ected by glaciation and many of theirsuperficial deposits were laid down directly from ice, or from melt waters flowing fromthe glaciers. This Great Ice Age, which ended approximately 10000 years ago andspanned a period of about two million years, occurred during the division of geologicaltime called the Pleistocene. During it, not only were superficial deposits called glacial drift laid down over wide areas of Britain and North America, but glacial erosion shaped the solid rock surface (rock head), and fluctuations of mean sea level left coastaldeposits well above present high water mark. For these reasons, an account is given ofother processes active during and after the Pleistocene, and of the erosional and otherphenomena related to glaciation, as well as of glacial deposits.
3.5.2 The Pleistocene glaciation
The distribution of land, sea and mountains in Pleistocene times was broadly similar tothat of the present day. The main changes that have occurred are in mean sea level, thescars left by glaciers, and the uneven deposition of glacial drift. In some places this formssmall hills; in others it chokes and obscures older valleys.
The Pleistocene epoch is a short span of time compared with the hundreds of millions of years that have elapsed since many of the solid sedimentary rocks of Britain were
Geology for civil engineers 84
www.angoothachaap.blogspot.com
www.angoothachaap.blogspot.com
formed. During it, worldwide tem-perature dropped on a f few occasions (the glacial periods) when ice sheets advanced to cover wide areas of the northern hemisphere,including Britain as far south as the Bristol Channel. Beyond the ice front, periglacial effects comparable to phenomena in present-day tundra can be recognised. During the interglacial periods the climate was sometimes warmer than in present-day Britain. Much of this Pleistocene history of northern regions has been scraped away anddestroyed by the last advance of the glaciers. There has been no steady increase of worldtemperatures since the last glacial period, but instead there have been short-period fluctuations of temperature superimposed on longer-period changes.
The optimal climate, with the highest worldwide temperatures, occurred around 5000 BC. The prime cause of the changes appears to be fluctuations in solar radiation reachingthe Earth; this itself is partly related to sunspot activity and to long-term astronomical cycles. The Pleistocene period has ended by arbitrary scientific definition, but the Earth isnot yet definitely clear of the Ice Age.
3.5.3 Glaciers and their flow
Large accumulations of ice are of two main types: ice sheets, such as exist in Antarctica and Greenland, and valley glaciers, such as are seen in present-day Switzerland. Ice sheets accumulate in extensive areas of high ground. These may be depressedprogressively under an increasing load of ice. For example, in Antarctica the ice sheet isabout 3000 m thick near the centre of the continent, where the solid rock surface isdepressed to near sea level. The rise from the fringing mountains to the South Pole isacross a great lens-shaped mass of ice. Flow within an ice sheet is radially outwards from the centre where the ice is thickest. Major topographic features have only a secondarycontrol. The ice sheet may follow the general trend of a large valley, but may also breacha watershed which obstructs its radial flow. Smaller topographic features may beobliterated, either by erosion or by being plastered over with glacial deposits.
Movement of the ice sheet ‘down hill’ (in relation to its upper surface) is accompaniedby melting once it passes below the snowline. Eventually the rate of advance is balancedby the rate of melting along an ice front, where meltwater streams are discharged fromcaves in a wall of ice, which is now too thin to flow.
In contrast, the movement of the valley glaciers is constrained by pre-existing major river valleys in upland areas. Valley glaciers are present at the early and late stages of aglacial period, that is, before an ice sheet has formed or after it has wasted. Permanentsnow gathers on peaks, often on the shady northeastern side, and the rock below it iseroded preferentially by, for example, frost expanding in cracks and shattering the rock. A large hollow, resembling a huge amphitheatre (called a corrie), is formed high on the mountainside, and provides a gathering place for more snow. (At the present day thesnowline, above which snow lies the whole year round, almost brushes the tip of BenNevis in Scotland.) These corries are often occupied by small lakes, which may be partlyinfilled with peat, clay from rotted granite, or more rarely by diatomaceous earth (a puresiliceous deposit consisting of minute skeletons of simple plants). Corries are used assites for high-level reservoirs in some pump-storage schemes, where a dam has been built
Superficial deposits 85
www.angoothachaap.blogspot.com
www.angoothachaap.blogspot.com
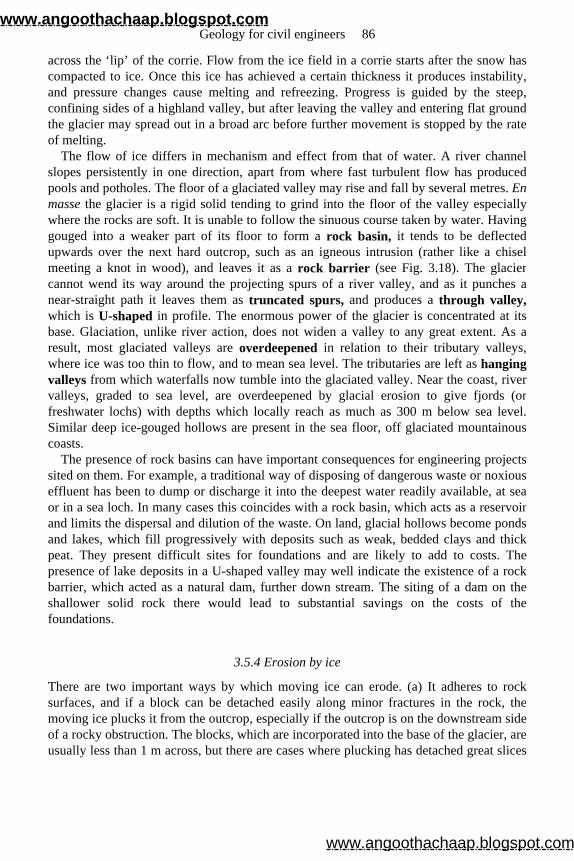
across the ‘lip’ of the corrie. Flow from the ice field in a corrie starts after the snow hascompacted to ice. Once this ice has achieved a certain thickness it produces instability,and pressure changes cause melting and refreezing. Progress is guided by the steep,confining sides of a highland valley, but after leaving the valley and entering flat groundthe glacier may spread out in a broad arc before further movement is stopped by the rateof melting.
The flow of ice differs in mechanism and effect from that of water. A river channel slopes persistently in one direction, apart from where fast turbulent flow has producedpools and potholes. The floor of a glaciated valley may rise and fall by several metres. En masse the glacier is a rigid solid tending to grind into the floor of the valley especiallywhere the rocks are soft. It is unable to follow the sinuous course taken by water. Havinggouged into a weaker part of its floor to form a rock basin, it tends to be deflected upwards over the next hard outcrop, such as an igneous intrusion (rather like a chiselmeeting a knot in wood), and leaves it as a rock barrier (see Fig. 3.18). The glacier cannot wend its way around the projecting spurs of a river valley, and as it punches anear-straight path it leaves them as truncated spurs, and produces a through valley, which is U-shaped in profile. The enormous power of the glacier is concentrated at its base. Glaciation, unlike river action, does not widen a valley to any great extent. As aresult, most glaciated valleys are overdeepened in relation to their tributary valleys, where ice was too thin to flow, and to mean sea level. The tributaries are left as hanging valleys from which waterfalls now tumble into the glaciated valley. Near the coast, river valleys, graded to sea level, are overdeepened by glacial erosion to give fjords (orfreshwater lochs) with depths which locally reach as much as 300 m below sea level.Similar deep ice-gouged hollows are present in the sea floor, off glaciated mountainous coasts.
The presence of rock basins can have important consequences for engineering projects sited on them. For example, a traditional way of disposing of dangerous waste or noxiouseffluent has been to dump or discharge it into the deepest water readily available, at seaor in a sea loch. In many cases this coincides with a rock basin, which acts as a reservoirand limits the dispersal and dilution of the waste. On land, glacial hollows become ponds and lakes, which fill progressively with deposits such as weak, bedded clays and thickpeat. They present difficult sites for foundations and are likely to add to costs. Thepresence of lake deposits in a U-shaped valley may well indicate the existence of a rockbarrier, which acted as a natural dam, further down stream. The siting of a dam on theshallower solid rock there would lead to substantial savings on the costs of thefoundations.
3.5.4 Erosion by ice
There are two important ways by which moving ice can erode. (a) It adheres to rocksurfaces, and if a block can be detached easily along minor fractures in the rock, themoving ice plucks it from the outcrop, especially if the outcrop is on the downstream sideof a rocky obstruction. The blocks, which are incorporated into the base of the glacier, areusually less than 1 m across, but there are cases where plucking has detached great slices
Geology for civil engineers 86
www.angoothachaap.blogspot.com
www.angoothachaap.blogspot.com
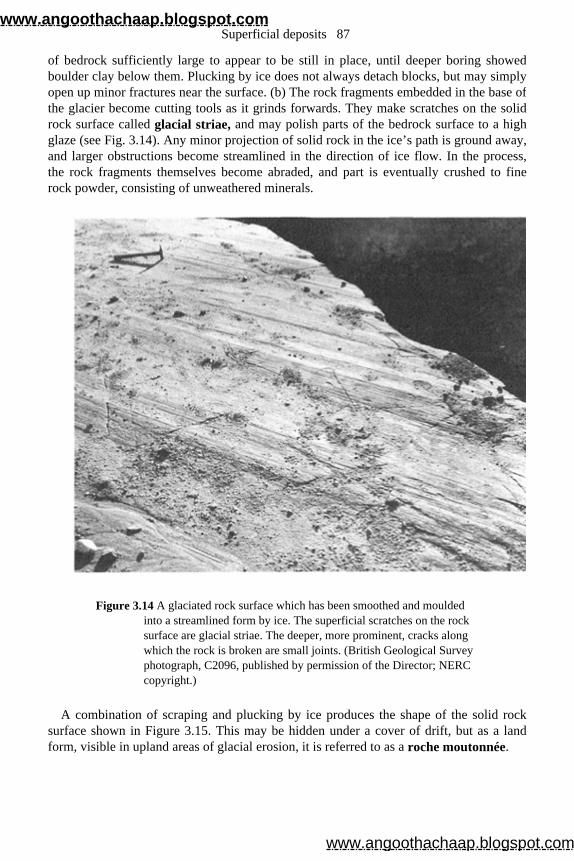
of bedrock sufficiently large to appear to be still in place, until deeper boring showedboulder clay below them. Plucking by ice does not always detach blocks, but may simplyopen up minor fractures near the surface. (b) The rock fragments embedded in the base ofthe glacier become cutting tools as it grinds forwards. They make scratches on the solidrock surface called glacial striae, and may polish parts of the bedrock surface to a highglaze (see Fig. 3.14). Any minor projection of solid rock in the ice’s path is ground away, and larger obstructions become streamlined in the direction of ice flow. In the process,the rock fragments themselves become abraded, and part is eventually crushed to finerock powder, consisting of unweathered minerals.
Figure 3.14 A glaciated rock surface which has been smoothed and moulded into a streamlined form by ice. The superficial scratches on the rock surface are glacial striae. The deeper, more prominent, cracks along which the rock is broken are small joints. (British Geological Survey photograph, C2096, published by permission of the Director; NERC copyright.)
A combination of scraping and plucking by ice produces the shape of the solid rocksurface shown in Figure 3.15. This may be hidden under a cover of drift, but as a land form, visible in upland areas of glacial erosion, it is referred to as a roche moutonnée.
Superficial deposits 87
www.angoothachaap.blogspot.com
www.angoothachaap.blogspot.com
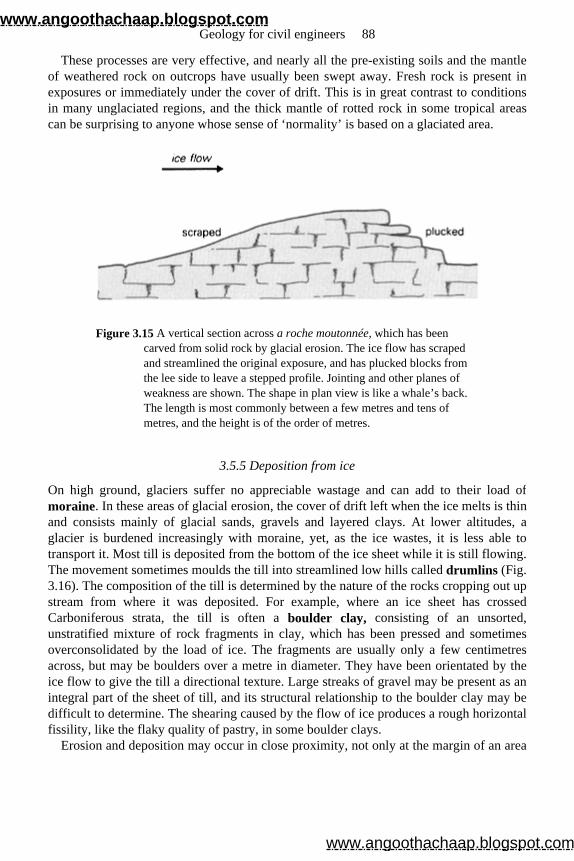
These processes are very effective, and nearly all the pre-existing soils and the mantle of weathered rock on outcrops have usually been swept away. Fresh rock is present inexposures or immediately under the cover of drift. This is in great contrast to conditionsin many unglaciated regions, and the thick mantle of rotted rock in some tropical areascan be surprising to anyone whose sense of ‘normality’ is based on a glaciated area.
Figure 3.15 A vertical section across a roche moutonnée, which has been carved from solid rock by glacial erosion. The ice flow has scraped and streamlined the original exposure, and has plucked blocks from the lee side to leave a stepped profile. Jointing and other planes of weakness are shown. The shape in plan view is like a whale’s back. The length is most commonly between a few metres and tens of metres, and the height is of the order of metres.
3.5.5 Deposition from ice
On high ground, glaciers suffer no appreciable wastage and can add to their load ofmoraine. In these areas of glacial erosion, the cover of drift left when the ice melts is thinand consists mainly of glacial sands, gravels and layered clays. At lower altitudes, aglacier is burdened increasingly with moraine, yet, as the ice wastes, it is less able totransport it. Most till is deposited from the bottom of the ice sheet while it is still flowing.The movement sometimes moulds the till into streamlined low hills called drumlins (Fig. 3.16). The composition of the till is determined by the nature of the rocks cropping out upstream from where it was deposited. For example, where an ice sheet has crossedCarboniferous strata, the till is often a boulder clay, consisting of an unsorted, unstratified mixture of rock fragments in clay, which has been pressed and sometimesoverconsolidated by the load of ice. The fragments are usually only a few centimetresacross, but may be boulders over a metre in diameter. They have been orientated by theice flow to give the till a directional texture. Large streaks of gravel may be present as anintegral part of the sheet of till, and its structural relationship to the boulder clay may bedifficult to determine. The shearing caused by the flow of ice produces a rough horizontalfissility, like the flaky quality of pastry, in some boulder clays.
Erosion and deposition may occur in close proximity, not only at the margin of an area
Geology for civil engineers 88
www.angoothachaap.blogspot.com
www.angoothachaap.blogspot.com
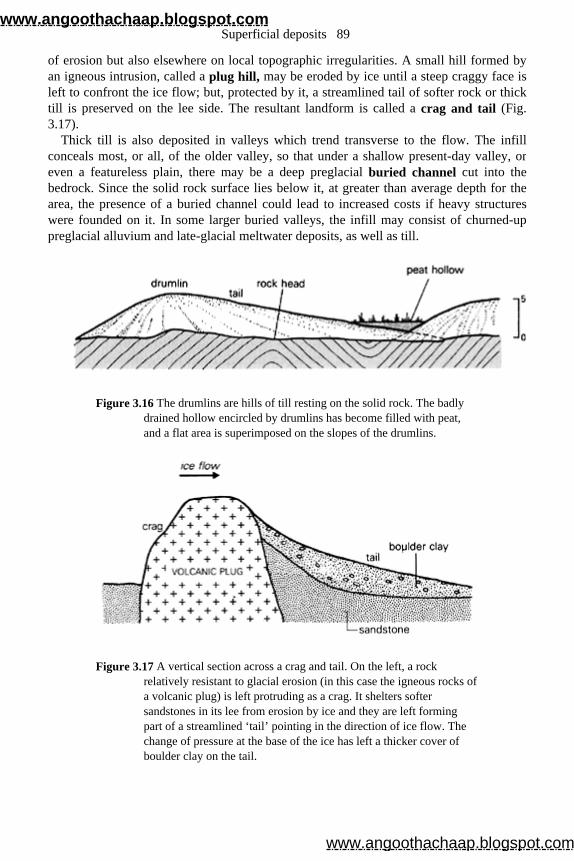
of erosion but also elsewhere on local topographic irregularities. A small hill formed byan igneous intrusion, called a plug hill, may be eroded by ice until a steep craggy face isleft to confront the ice flow; but, protected by it, a streamlined tail of softer rock or thicktill is preserved on the lee side. The resultant landform is called a crag and tail (Fig. 3.17).
Thick till is also deposited in valleys which trend transverse to the flow. The infill conceals most, or all, of the older valley, so that under a shallow present-day valley, or even a featureless plain, there may be a deep preglacial buried channel cut into the bedrock. Since the solid rock surface lies below it, at greater than average depth for thearea, the presence of a buried channel could lead to increased costs if heavy structureswere founded on it. In some larger buried valleys, the infill may consist of churned-up preglacial alluvium and late-glacial meltwater deposits, as well as till.
Figure 3.16 The drumlins are hills of till resting on the solid rock. The badly drained hollow encircled by drumlins has become filled with peat, and a flat area is superimposed on the slopes of the drumlins.
Figure 3.17 A vertical section across a crag and tail. On the left, a rock relatively resistant to glacial erosion (in this case the igneous rocks of a volcanic plug) is left protruding as a crag. It shelters softer sandstones in its lee from erosion by ice and they are left forming part of a streamlined ‘tail’ pointing in the direction of ice flow. The change of pressure at the base of the ice has left a thicker cover of boulder clay on the tail.
Superficial deposits 89
www.angoothachaap.blogspot.com
www.angoothachaap.blogspot.com
Boulder clays (or tills) comprise a clay matrix containing boulders of various sizes andshapes. Sand and gravel layers deposited by subglacial streams may also occur within theboulder clay. Grain size distributions in boulder clay and morainic soils are variable, andMcGown (1971) recognised a split or gap in the grading around the sand-size fraction. An investigation of boulder-clay cliffs (Attewell & Farmer 1976) showed that a number of mechanisms contributed to their erosion, in particular surface weathering, creep,rotational and planar sliding, and mud flow. Courchée (1970) gives a detailed account of the properties of boulder-clay slopes.
3.5.6 Deposition from melt waters
A glacier deposits its remaining load of moraine at the ice front. If this is static, thecoarse gravel and boulders form an irregular ridge called a terminal moraine. A series of recessional moraines, of similar character, may be formed at successive halting stages asthe ice front retreats. Finer fractions of the moraine are transported by melt waters issuingfrom tunnels in the glacier and from wasting ice at the front of the glacier. The position ofsuch a tunnel mouth may be marked as the ice front retreats by an elongated hummock ofcross-bedded sand and gravel. The rate of flow of the meltwater stream decreases as it spreads, free from the confinement of the tunnel walls, and much of its load is dropped. Asinuous ridge called an esker may form as the tunnel mouth changes position while theice retreats, if there is a steady supply of sand. A more complicated retreat, with largemasses of stagnant ice present, may produce lines of hummocks called kames. When a large block of ice melts, it leaves a depression in the drift (commonly a few metres acrossand one or two metres deep) called a kettle hole. Sand and fine gravel may be carried forkilometres from the ice front, and be deposited as a flat spread of well bedded, well sorted sediments. Other terms, such as kame terrace and fluvioglacial fan, are used todescribe landforms produced by spreads of gravel and sand.
Deposits from melt waters are said to be fluvioglacial. If large enough to be delineated, they are normally shown on Geological Survey maps as ‘glacial sand and gravel’, without further differentiation, although they range in composition from clean, well bedded, poorly graded sand, to unstratified mixtures of coarse gravel, boulders andclay. They also vary widely in compactness. For example, a deposit that contained deadice is less compact than one laid down in water, and may be recognised by its steepmargins and lack of regular bedding.
3.5.7 Late-glacial and postglacial phenomena
At the end of the last glaciation, as temperatures rose, the ice sheets wasted, leaving apatchy cover of fluvioglacial sand and gravel on the glacial till. The disruption of thepreglacial drainage system, with some rivers choked with drift and others blocked bystagnant ice or moraines, produced ponding on an extensive scale. Many of these smallshallow lakes are now filled with peat or bedded clays (Fig. 3.18), and others remain to give northern landscapes a distinctive character. The layering in some clays consists ofalternating light and dark bands, each a few millimetres thick. The dark sediment is clay
Geology for civil engineers 90
www.angoothachaap.blogspot.com
www.angoothachaap.blogspot.com
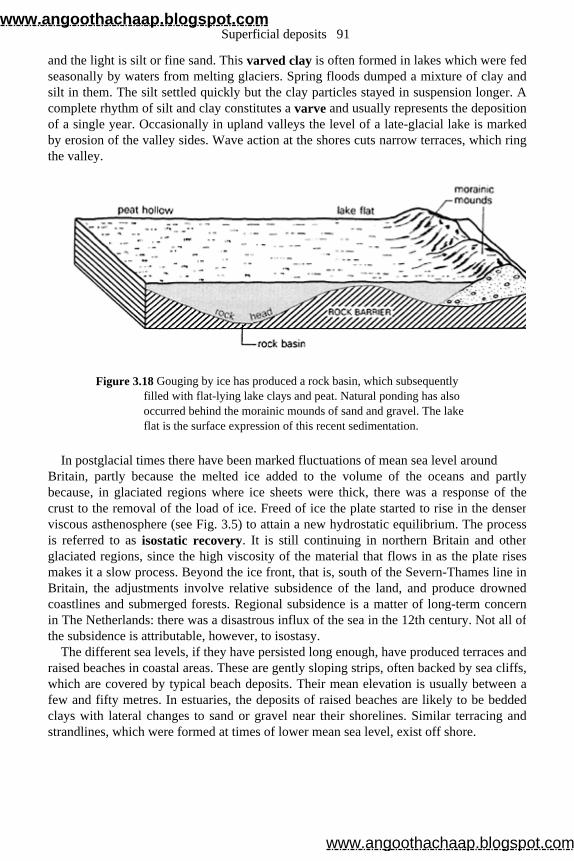
and the light is silt or fine sand. This varved clay is often formed in lakes which were fedseasonally by waters from melting glaciers. Spring floods dumped a mixture of clay andsilt in them. The silt settled quickly but the clay particles stayed in suspension longer. Acomplete rhythm of silt and clay constitutes a varve and usually represents the deposition of a single year. Occasionally in upland valleys the level of a late-glacial lake is marked by erosion of the valley sides. Wave action at the shores cuts narrow terraces, which ringthe valley.
Figure 3.18 Gouging by ice has produced a rock basin, which subsequently filled with flat-lying lake clays and peat. Natural ponding has also occurred behind the morainic mounds of sand and gravel. The lake flat is the surface expression of this recent sedimentation.
In postglacial times there have been marked fluctuations of mean sea level around Britain, partly because the melted ice added to the volume of the oceans and partlybecause, in glaciated regions where ice sheets were thick, there was a response of thecrust to the removal of the load of ice. Freed of ice the plate started to rise in the denserviscous asthenosphere (see Fig. 3.5) to attain a new hydrostatic equilibrium. The process is referred to as isostatic recovery. It is still continuing in northern Britain and other glaciated regions, since the high viscosity of the material that flows in as the plate risesmakes it a slow process. Beyond the ice front, that is, south of the Severn-Thames line in Britain, the adjustments involve relative subsidence of the land, and produce drownedcoastlines and submerged forests. Regional subsidence is a matter of long-term concern in The Netherlands: there was a disastrous influx of the sea in the 12th century. Not all ofthe subsidence is attributable, however, to isostasy.
The different sea levels, if they have persisted long enough, have produced terraces and raised beaches in coastal areas. These are gently sloping strips, often backed by sea cliffs,which are covered by typical beach deposits. Their mean elevation is usually between afew and fifty metres. In estuaries, the deposits of raised beaches are likely to be beddedclays with lateral changes to sand or gravel near their shorelines. Similar terracing andstrandlines, which were formed at times of lower mean sea level, exist off shore.
Superficial deposits 91
www.angoothachaap.blogspot.com
www.angoothachaap.blogspot.com
3.5.8 Periglacial phenomena
Periglacial soils are formed under associated climatic conditions but are not formed directly by ice action. They may occur as wind-blown soils (loess) or as residual soilsresulting from freeze-and-thaw weathering conditions. Generally speaking, suchperiglacial soils are found to the south of where the Pleistocene ice sheet reached—in the UK, south of a line from the Severn to the Humber.
Beyond the ice front lay a broad zone of tundra, the soils of which were frozen for longperiods (permafrost). This affected their stability, resulting in movements both within thesoil, and of the mass of the soil, by solifluxion. During the last glacial period, southern England lay in a periglacial zone, and as the ice front retreated periglacial conditionsmoved with it.
If periglacial soils occur on low-angle slopes, slope f ailure by mudslides resulting from sheet movements may result. Such mudslides take place because of the formation ofice lenses and of coarse and fine layers parallel to the ground surface, which are causedby freezing and thawing.
Head deposits are superficial accumulations which have usually been moved by solifluxion, and they are a type of drift often formed in periglacial conditions. Although their formation is favoured by frost action, it is not totally dependent on it, and head isstill being formed by soil creep and downwash, for example, as rock screes. The label‘head, undifferentiated’ on Geological Survey maps covers a variety of soil compositions. In general, head consists of poorly sorted, locally derived, angular fragments, and ismassive or poorly bedded. Since it is formed by downhill movement, it normally lies on,or close to, a slope. The outcrops of solid rock below it may, especially if they are wellbedded, show a terminal curvature, produced by the drag of the superficial movements. Head is thickest (in places it may be over 15 m) where the hill slope is concave, and atthe valley bottoms. There it may grade into river deposits in a way that makes anyboundary quite arbitrary.
Where a near-horizontal, strong, rigid layer, such as a bed of sandstone or limestone, rests on clays, superficial movement may produce cambering. In this, the limestone or sandstone layer moves down slope in large units called gulls, which are separated along joints, particularly those infilled with younger soils. During this cambering process theunderlying clay may be deformed. The lines of gulls in a cambered valley tend to followthe contours. Conditions that favour cambering also tend to produce valley bulges. The stresses generated by the topographic loads of the sides of the valley may produce asuperficial anticline in the weaker rocks near the central line of the valley. Periglacialconditions have been the critical factor in creating bulges in some valleys, but they havealso formed wherever steep slopes and weak sediments are adjacent to one another.
A widespread periglacial soil in the chalk areas of southern England is clay with flints. It is a reddish-brown clay rich in flints, and in places contains large blocks of quartzitecalled sarsens. The clay and sarsens are derived by solifluxion from deposits on the chalkthat persist after softer deposits have been eroded away. The distribution of clay withflints resembles that of a till. It forms a mantle of variable thickness on the solid rock,
Geology for civil engineers 92
www.angoothachaap.blogspot.com
www.angoothachaap.blogspot.com
with the additional complication that it may have collapsed into cavities dissolved byground water in the chalk. Pipes infilled with clay with flints may extend down for over30 m.
Other periglacial phenomena produced by the freezing and partial thawing of the soilinclude fossil ice wedges filled with later sediment, polygonal ground, and disturbance ofearlier layering in soils (cryoturbation). Some of these effects are important in siteinvestigation. For example, periglacial weathering of the chalk on the floor of the EnglishChannel along the proposed tunnel line has increased the flow of water through it locally;and ‘fossil’ mud flows which were active under periglacial conditions remain as one ofthe causes of instability in some present-day escarpments and cliffs on the south coast ofEngland.
3.6 Landforms
3.6.1 Erosional landforms
Rivers, glaciers and other agents slowly wear away the land surface, at rates determinedat any locality by the balance between the intensity of the erosive forces and theresistance to erosion of the rocks exposed to this assault. In general, resistant rocks areleft protruding and forming high ground, and weaker rocks are etched out so that theiroutcrops match depressions in the ground surface. At a geological boundary where hardand soft rocks abut, there is likely to be a break of slope (a scarp) and the boundary may be traced by following the surface feature. The outcrop of the resistant rock will extendapproximately to the lower edge of the scarp. The nature of the boundary (that is, whetherit is a bedding plane, a fault or an intrusive contact), can only be determined from otherobservations. The types of rock can only be inferred by linking the boundary to exposureswhere the resistant and the weak rocks on either side of it can be seen.
If erosive forces attacked the land surface everywhere with uniform intensity, then a simple relationship between erosional landforms and solid geology would be near-universal where superficial deposits were thin or absent. On the real Earth, erosive agentsare often concentrated at certain localities, and they cut deeply into the land surface atthese places with an intensity that is conditioned only by the different hardnesses of therocks. This is particularly the case with glacial erosion. Most glacial, erosional landforms,such as U-shaped valleys or roches moutonnées, indicate the direction of ice flow and suggest the presence and orientation of other glacial phenomena, but they reveal littleabout the distribution of rocks in the area. Glacial erosion usually confuses rather thanaccentuates landforms such as scarps or erosion hollows, since the gouging by ice oftencuts across the grain of the country. In contrast, many depositional landforms of glacial orfluvioglacial origin provide a useful indication of the nature of the drift deposits formingthem.
Superficial deposits 93
www.angoothachaap.blogspot.com
www.angoothachaap.blogspot.com
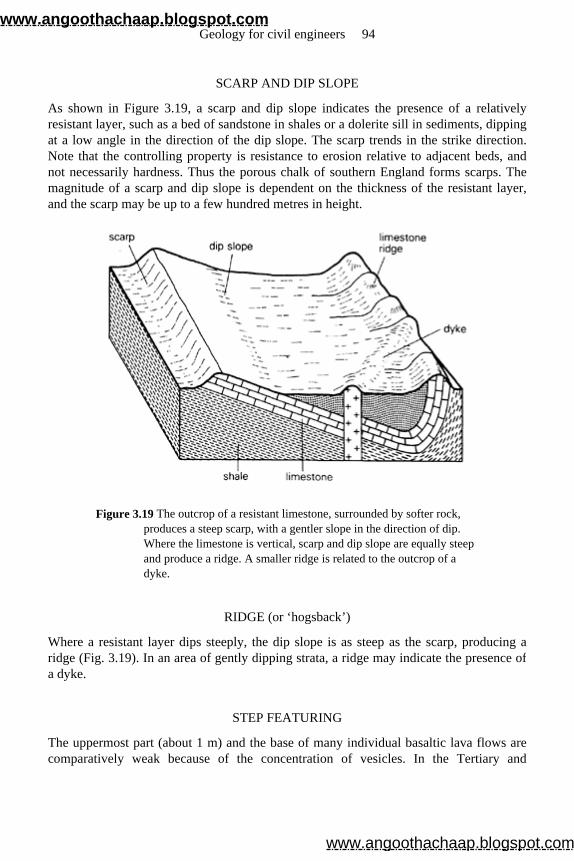
SCARP AND DIP SLOPE
As shown in Figure 3.19, a scarp and dip slope indicates the presence of a relativelyresistant layer, such as a bed of sandstone in shales or a dolerite sill in sediments, dippingat a low angle in the direction of the dip slope. The scarp trends in the strike direction.Note that the controlling property is resistance to erosion relative to adjacent beds, andnot necessarily hardness. Thus the porous chalk of southern England forms scarps. Themagnitude of a scarp and dip slope is dependent on the thickness of the resistant layer,and the scarp may be up to a few hundred metres in height.
Figure 3.19 The outcrop of a resistant limestone, surrounded by softer rock, produces a steep scarp, with a gentler slope in the direction of dip. Where the limestone is vertical, scarp and dip slope are equally steep and produce a ridge. A smaller ridge is related to the outcrop of a dyke.
RIDGE (or ‘hogsback’)
Where a resistant layer dips steeply, the dip slope is as steep as the scarp, producing aridge (Fig. 3.19). In an area of gently dipping strata, a ridge may indicate the presence ofa dyke.
STEP FEATURING
The uppermost part (about 1 m) and the base of many individual basaltic lava flows arecomparatively weak because of the concentration of vesicles. In the Tertiary and
Geology for civil engineers 94
www.angoothachaap.blogspot.com
www.angoothachaap.blogspot.com
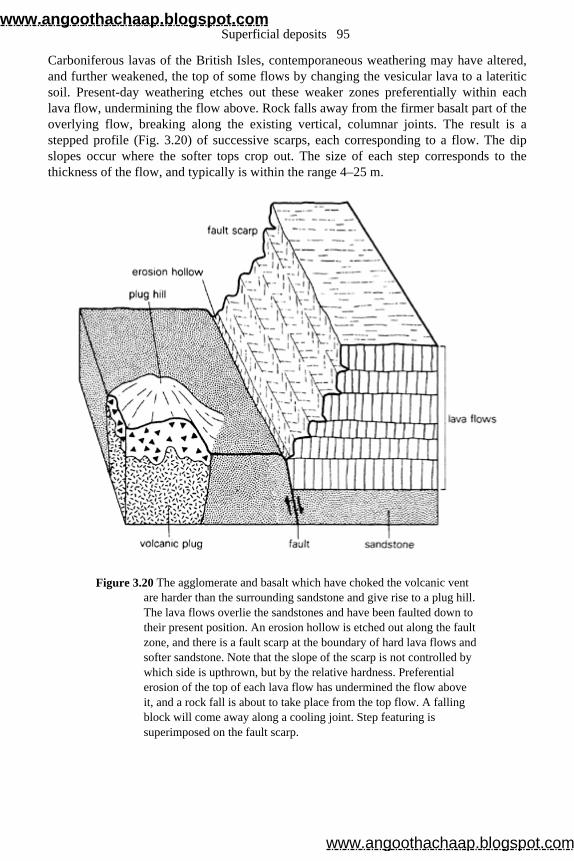
Carboniferous lavas of the British Isles, contemporaneous weathering may have altered,and further weakened, the top of some flows by changing the vesicular lava to a lateriticsoil. Present-day weathering etches out these weaker zones preferentially within eachlava flow, undermining the flow above. Rock falls away from the firmer basalt part of theoverlying flow, breaking along the existing vertical, columnar joints. The result is astepped profile (Fig. 3.20) of successive scarps, each corresponding to a flow. The dipslopes occur where the softer tops crop out. The size of each step corresponds to thethickness of the flow, and typically is within the range 4–25 m.
Figure 3.20 The agglomerate and basalt which have choked the volcanic vent are harder than the surrounding sandstone and give rise to a plug hill. The lava flows overlie the sandstones and have been faulted down to their present position. An erosion hollow is etched out along the fault zone, and there is a fault scarp at the boundary of hard lava flows and softer sandstone. Note that the slope of the scarp is not controlled by which side is upthrown, but by the relative hardness. Preferential erosion of the top of each lava flow has undermined the flow above it, and a rock fall is about to take place from the top flow. A falling block will come away along a cooling joint. Step featuring is superimposed on the fault scarp.
Superficial deposits 95
www.angoothachaap.blogspot.com
www.angoothachaap.blogspot.com
EROSION HOLLOWS
A steeply inclined weak layer, when etched out by erosion, produces a straight shallowdepression. If it trends parallel to adjacent ridges, it is probably produced by a bed withinthe local sequence of strata. If the hollow cuts discordantly across the grain of thecountry, it may be related to a dyke, but more probably to a fault zone and the faultbreccia within it. This interpretation would be reinforced if scarps or ridges died out closeto the erosion hollow, thus suggesting the truncation of strata. Strike slip faultscharacteristically give rise to wide zones of breccia and marked erosion hollows (Fig. 3.20). The largest landform of this type in Britain is the Great Glen, which is a fewkilometres wide along most of its length and has been gouged to a depth of a few hundredmetres by ice. The smaller erosion hollows that would be more of service to a geologicalsurveyor and of interest to the engineer are typically a few metres wide.
COLLAPSE STRUCTURES AND SWALLOW HOLES
Since limestone is soluble in fresh water, a steady trickle along a major joint or fault willleach away the rock until a tunnel or line of caverns is formed. Streams flowing acrossthick limestones may disappear dramatically down swallow holes (colloquially andconfusingly referred to as potholes) to follow a subterranean course. A cavern at depthmay ultimately collapse and be marked by a shallow depression at the surface. The depression is typically a few metres across, and roughly circular in plan. It resembles acrown hole (see Section 6.2.3) produced by the artificial ‘erosion’ of a coal seam, but if it occurs in a context of dry river valleys, there is confirmation that thick limestone ispresent and that it is a solution collapse structure.
3.6.2 Depositional landforms
In many parts of the world, superficial deposits are formed in situ by the weathering of rocks into soils. The land surface indicates the distribution of such soils only in so far asit still reflects the distribution of parent rocks by erosional landforms that are older thanthe soils. Such residual soils are uncommon in Britain, where most superficial depositshave been transported by ice, rivers, wind or gravity (acting on deposits on a slope)before deposition. The local environment and the mode of deposition produce acharacteristic landform, which may be used to infer the probable nature of the depositsforming it. Transported superficial deposits, the natural agents that moved them, andseveral of the landforms related to them, have already been discussed (Section 3.4), so only a few examples are described here.
DRUMLINS
The formation of drumlins (see Fig. 3.16) is described elsewhere (Section 3.5.5). Theytypically occur in a swarm, and any ground between individual drumlins is left poorly
Geology for civil engineers 96
www.angoothachaap.blogspot.com
www.angoothachaap.blogspot.com
drained and possibly ponded. A typical drumlin is 0.5–1.0 km in length in the direction of ice flow, and half that in maximum width. Its height lies in the range 50–100 m. Its blunter, steeper end was f formed on the upstream side of the ice flow, and its tail in thelee. The hill is formed mainly, or entirely, of till. Some drumlins have a small rock core,seldom more than a fraction of the size of the drumlin, which may have encourageddeposition from the ice. Others are simply mounds of till on an irregular glaciatedsurface, and the height of the drumlin is a measure of the thickness of the superficialdeposit. There is no certain way of discriminating between these two extremepossibilities from the form of the drumlin.
MORAINIC MOUNDS
These deposits from glacial melt waters (Section 3.5.6) are laid down close to the ice front to form low mounds (Fig. 3.18) typically 5–15 m high and about 10–30 m wide. The length and regularity of a particular mound depend on the persistence of flow of meltwater from which they were deposited. A marked accumulation which produces acontinuous belt of coalescing mounds is formed along a static ice front and is usuallycomposed of well graded sand and gravel with large boulders. The sinuous ridges formed from a single large stream normally contain better sorted, cross-bedded sands.
LAKE FLATS AND PEAT HOLLOWS
Flat, featureless, often poorly drained ground usually indicates that the area has beenponded and that deposits have been laid down in standing waters (see Figs 3.16 & 18). Sometimes the natural dam which has blocked the hollow is destroyed by overflow at itslowest point cutting a deep spillway. The dam may have been morainic mounds, ice orthe coalescence of drumlins. Other natural lakes occur in rock basins (Section 3.5.3) which are obliterated by being filled in completely with sediment and peat. The flat areais typically underlain by well bedded clays, which may be varved. Part or all of the infill,especially in areas of glacial erosion, may be peat.
References and selected reading
Attewell, P.B. and I.W.Farmer 1976. Principles of engineering geology . London: Chapman and Hall.
Bretschneider, C.L. 1952. The generation and decay of wind in deep water. Trans Am. Geoph. Union 33 , 381–3.
Casagrande, A. 1948. Classification and identification of soils. Trans Am. Soc. Civ. Engrs 113 , 901–92.
Courchée, R. 1970. Properties of boulder clay slopes and their influence on coastal erosion at Robin Hood’s Bay, Yorkshire . Unpublished M.Sc. Thesis, Durham University.
Darbyshire, M. and L.Draper 1963. Forecasting wind-generated sea waves. Engineering
Superficial deposits 97
www.angoothachaap.blogspot.com
www.angoothachaap.blogspot.com

195 , 482–4. Dixon, H.H. and R.H.S.Robertson 1970. Some engineering experience in tropical soils.
Q. J. Engng Geol . 3 , 137–50. Fookes, P.G., W.R.Dearman and J.A.Franklin 1971. Some engineering aspects of rock
weathering with field examples from Dartmoor and elsewhere. Q. J. Engng Geol . 4 , 139–86.
Gillott, J.E. 1968. Clay in engineering geology . Amsterdam: Elsevier. Higginbottom, I.E. and P.G.Fookes 1970. Engineering aspects of periglacial features in
Britain. Q. J. Engng Geol . 3 , 85–118. Holmes, A. 1965. Principles of physical geology , 2nd edn. London: Nelson. Hunt, C.B. 1972. Geology of soils . San Francisco: W.H.Freeman. Loughan, F.C. 1969. Chemical weathering of the silicate minerals . Amsterdam: Elsevier. McGown, A. 1971. The classification for engineering purposes of tills from moraines and
associated landforms. Q. J. Engng Geol . 4 , 115–30. McGown, A. and E.Derbyshire 1977. Genetic influences on the properties of tills. Q. J.
Engng Geol . 10 , 389–410. Millot, G. 1970. Geology of clays . London: Chapman and Hall. Morgan, A.V. 1971. Engineering problems caused by fossil permafrost features in the
English Midlands. Q. J. Engng Geol . 4 , 111–14. Olsen, G.W. 1984. Field guide to soils and the environment . New York: Chapman and
Hall. Schroeder, W.L. 1976. Soils in construction . Chichester: Wiley. Wood, A.N.M. 1969. Coastal hydraulics . London: Macmillan.
Geology for civil engineers 98
www.angoothachaap.blogspot.com
www.angoothachaap.blogspot.com
4 Distribution of rocks at and below the surface
4.1 Introduction
It is necessary to know what patterns of rock distribution occur naturally, and whatprocesses give rise to them, in order to understand why particular rocks are present atcertain depths in a borehole, and to predict from such fragmentary evidence the probabledistribution of these rocks over a wider area. The distribution of rocks at and below thesurface is the result of two factors: (a) the original distribution of these rocks at the timethey were formed, and (b) the change produced by later deformation, as the rocks arebuckled and fractured within the Earth. Deformation may also change the character of therock mass and its engineering properties by producing fractures or even by causingrecrystallisation to occur.
The shapes of igneous rock bodies, including the range of dimensions commonly encountered and the variation of rock types within the igneous mass, have been describedin Section 2.2.3 as igneous structures.
The distributions of sedimentary rocks, involving both vertical and lateral change of rock type, are described as stratigraphic models, using selected examples. These modelsreflect the changes in depositional environment with place and time within one areaduring which sediment was accumulated. The redistribution of rock layers by deformingstresses produces characteristic forms, described here as structural models.
A large part of a geologist’s training is in the interpretation of three-dimensional structures of rocks from evidence collected at the surface and possibly, but notnecessarily, from boreholes. A combined stratigraphic and structural model of the rocksin an area is then proposed, which is continuously refined as more evidence from surfacerocks and boreholes becomes available.
4.2 Geological maps and sections
The outcrop of a body of rock, such as a layer of shale, is the area that emerges at thesurface where the rock is present, or lies immediately below a cover of vegetation, soil, orother superficial deposit. Those parts of the outcrop where rock is visible at the surface,and where observations may be made, are called exposures. Exposures are usually found in the banks of streams, in road cuttings, on cliff or scarp faces, and in quarries. A geological map is an Ordnance Survey map, showing locations and topography, on which is superimposed geological information. This includes exposures, inferred
www.angoothachaap.blogspot.com
www.angoothachaap.blogspot.com
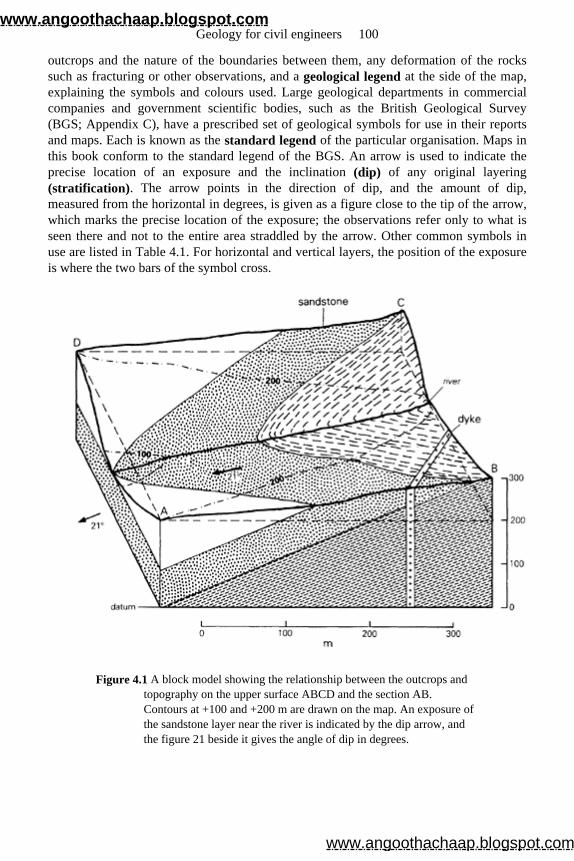
outcrops and the nature of the boundaries between them, any deformation of the rockssuch as fracturing or other observations, and a geological legend at the side of the map, explaining the symbols and colours used. Large geological departments in commercialcompanies and government scientific bodies, such as the British Geological Survey(BGS; Appendix C), have a prescribed set of geological symbols for use in their reports and maps. Each is known as the standard legend of the particular organisation. Maps inthis book conform to the standard legend of the BGS. An arrow is used to indicate theprecise location of an exposure and the inclination (dip) of any original layering (stratification). The arrow points in the direction of dip, and the amount of dip,measured from the horizontal in degrees, is given as a figure close to the tip of the arrow,which marks the precise location of the exposure; the observations refer only to what isseen there and not to the entire area straddled by the arrow. Other common symbols inuse are listed in Table 4.1. For horizontal and vertical layers, the position of the exposureis where the two bars of the symbol cross.
Figure 4.1 A block model showing the relationship between the outcrops and topography on the upper surface ABCD and the section AB. Contours at +100 and +200 m are drawn on the map. An exposure of the sandstone layer near the river is indicated by the dip arrow, and the figure 21 beside it gives the angle of dip in degrees.
Geology for civil engineers 100
www.angoothachaap.blogspot.com
www.angoothachaap.blogspot.com
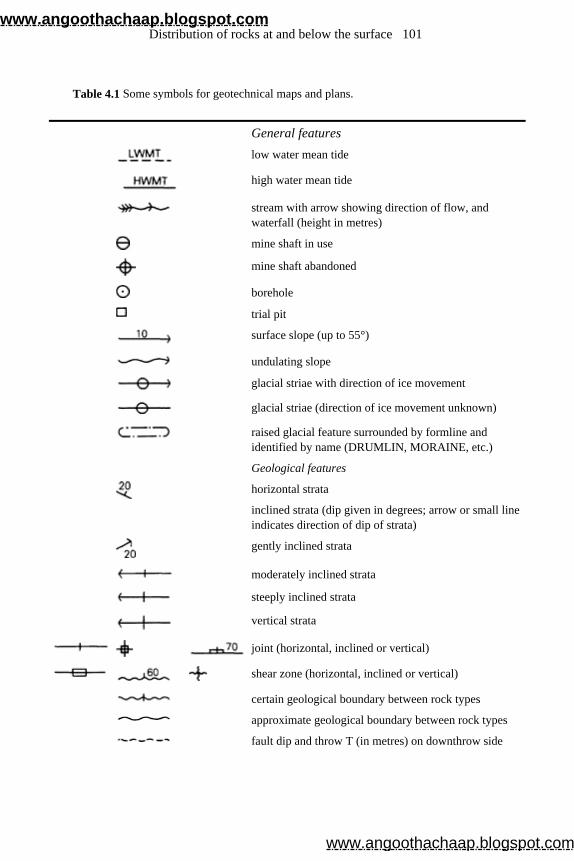
Table 4.1 Some symbols for geotechnical maps and plans.
General features low water mean tide
high water mean tide
stream with arrow showing direction of flow, and waterfall (height in metres)
mine shaft in use
mine shaft abandoned
borehole
trial pit
surface slope (up to 55°)
undulating slope
glacial striae with direction of ice movement
glacial striae (direction of ice movement unknown)
raised glacial feature surrounded by formline and identified by name (DRUMLIN, MORAINE, etc.)
Geological features
horizontal strata
inclined strata (dip given in degrees; arrow or small line indicates direction of dip of strata)
gently inclined strata
moderately inclined strata
steeply inclined strata
vertical strata
joint (horizontal, inclined or vertical)
shear zone (horizontal, inclined or vertical)
certain geological boundary between rock types
approximate geological boundary between rock types
fault dip and throw T (in metres) on downthrow side
Distribution of rocks at and below the surface 101
www.angoothachaap.blogspot.com
www.angoothachaap.blogspot.com
An outcrop of younger strata completely surrounded by older strata (the older beds beingthose occurring below the younger in the vertical succession of strata) is called anoutlier. An outcrop of older strata surrounded by younger is called an inlier.
The distribution of rocks on a vertical plane (comparable to an ‘elevation’ in engineering drawing) below a particular line at the surface is called a vertical geological section, or more simply a section. A geological model of an area ABCD showingoutcrops, and the section AB across it, are presented in Figure 4.1. This shows, within a scaled frame of a datum plus vertical and horizontal scales, what would be seen if avertical cut were made through the Earth along the line AB to reveal the side facing the viewer. The topographic profile of the ground surface shows the rises and falls along thesame line. Sections are a conventional way of presenting information about thedistribution of rocks below the surface. It is common practice to assist comprehension ofa geological map by drawing one or more representative sections below it, and to presentgeological information needed for planning and costing excavations, such as tunnels, bydrawing a section along the proposed line.
The relationships between the shape of the ground surface (that is, the topography), the outcrops, and the structure in idealised models in which layers are constant in rock typeand in thickness over the area of the map, are discussed in this chapter. The relationshipbetween surface geology and a section is also illustrated, and the way in which thesection may be drawn is discussed. The construction of more elaborate sections, whichcombine structural deformation with stratigraphic change laterally and are based on realgeological maps and reports, is discussed in Section 6.2.
4.3 Nature and uses of stratigraphy
4.3.1 Rock type and past environment
A guiding principle of geology is that ‘the present is the key to the past’. This concept is expressed more formally, and more fully, as the Doctrine (or Principle) of Uniformitarianism, which states that the processes that created and moulded the rocks of the Earth in its past are by and large the same as those active today. Volcanic activity,which produces igneous rocks, and the deposition of eroded fragments to formsedimentary layers, proceeded in similar ways, if at different rates, in the past as they doat the present time. The Earth’s surface had environments—shallow seas, river deltas, deserts—similar to those found now, though not necessarily in the same places. Thegeography of our planet has changed continually, but the general physical conditions thatmay be found have remained qualitatively more or less the same for thousands ofmillions of years. The relative areas of seas, mountains, deserts and ice sheets have varied
axial trace of anticline
axial trace of syncline
Geology for civil engineers 102
www.angoothachaap.blogspot.com
www.angoothachaap.blogspot.com
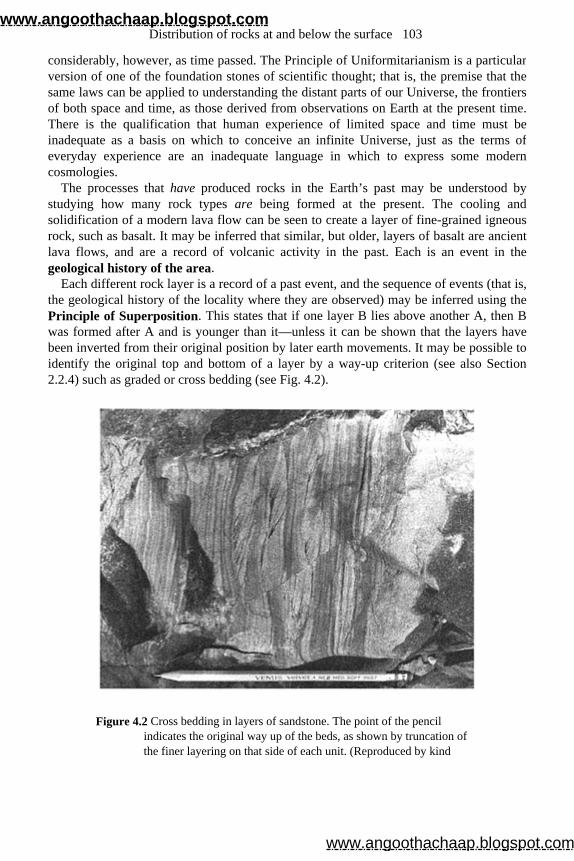
considerably, however, as time passed. The Principle of Uniformitarianism is a particularversion of one of the foundation stones of scientific thought; that is, the premise that thesame laws can be applied to understanding the distant parts of our Universe, the frontiersof both space and time, as those derived from observations on Earth at the present time.There is the qualification that human experience of limited space and time must beinadequate as a basis on which to conceive an infinite Universe, just as the terms ofeveryday experience are an inadequate language in which to express some moderncosmologies.
The processes that have produced rocks in the Earth’s past may be understood by studying how many rock types are being formed at the present. The cooling and solidification of a modern lava flow can be seen to create a layer of fine-grained igneous rock, such as basalt. It may be inferred that similar, but older, layers of basalt are ancientlava flows, and are a record of volcanic activity in the past. Each is an event in thegeological history of the area.
Each different rock layer is a record of a past event, and the sequence of events (that is, the geological history of the locality where they are observed) may be inferred using thePrinciple of Superposition. This states that if one layer B lies above another A, then B was formed after A and is younger than it—unless it can be shown that the layers havebeen inverted from their original position by later earth movements. It may be possible toidentify the original top and bottom of a layer by a way-up criterion (see also Section 2.2.4) such as graded or cross bedding (see Fig. 4.2).
Figure 4.2 Cross bedding in layers of sandstone. The point of the pencil indicates the original way up of the beds, as shown by truncation of the finer layering on that side of each unit. (Reproduced by kind
Distribution of rocks at and below the surface 103
www.angoothachaap.blogspot.com
www.angoothachaap.blogspot.com
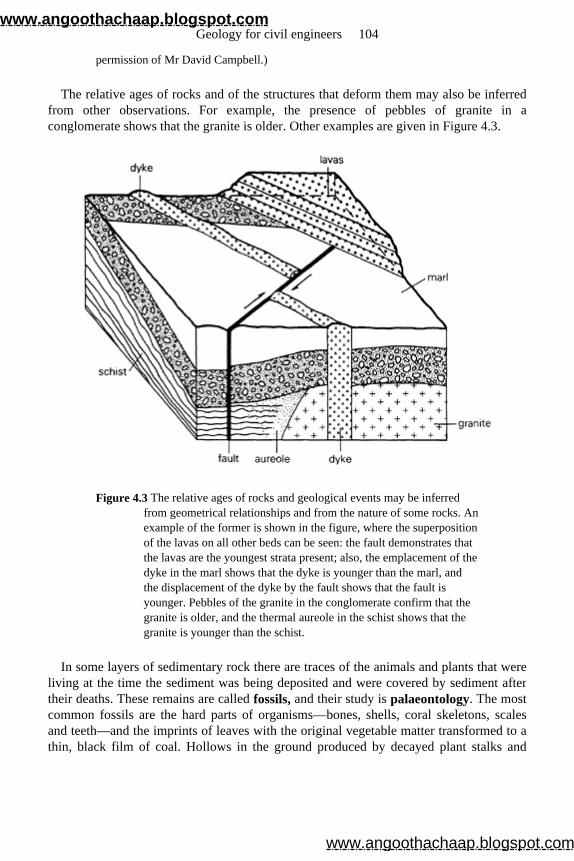
permission of Mr David Campbell.)
The relative ages of rocks and of the structures that deform them may also be inferred from other observations. For example, the presence of pebbles of granite in aconglomerate shows that the granite is older. Other examples are given in Figure 4.3.
Figure 4.3 The relative ages of rocks and geological events may be inferred from geometrical relationships and from the nature of some rocks. An example of the former is shown in the figure, where the superposition of the lavas on all other beds can be seen: the fault demonstrates that the lavas are the youngest strata present; also, the emplacement of the dyke in the marl shows that the dyke is younger than the marl, and the displacement of the dyke by the fault shows that the fault is younger. Pebbles of the granite in the conglomerate confirm that the granite is older, and the thermal aureole in the schist shows that the granite is younger than the schist.
In some layers of sedimentary rock there are traces of the animals and plants that were living at the time the sediment was being deposited and were covered by sediment aftertheir deaths. These remains are called fossils, and their study is palaeontology. The most common fossils are the hard parts of organisms—bones, shells, coral skeletons, scalesand teeth—and the imprints of leaves with the original vegetable matter transformed to a thin, black film of coal. Hollows in the ground produced by decayed plant stalks and
Geology for civil engineers 104
www.angoothachaap.blogspot.com
www.angoothachaap.blogspot.com
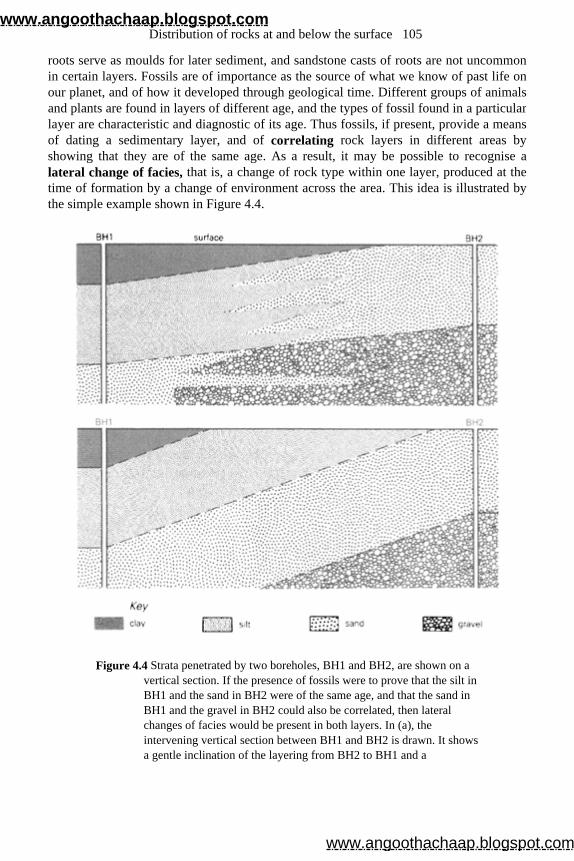
roots serve as moulds for later sediment, and sandstone casts of roots are not uncommonin certain layers. Fossils are of importance as the source of what we know of past life onour planet, and of how it developed through geological time. Different groups of animalsand plants are found in layers of different age, and the types of fossil found in a particularlayer are characteristic and diagnostic of its age. Thus fossils, if present, provide a meansof dating a sedimentary layer, and of correlating rock layers in different areas by showing that they are of the same age. As a result, it may be possible to recognise alateral change of facies, that is, a change of rock type within one layer, produced at the time of formation by a change of environment across the area. This idea is illustrated bythe simple example shown in Figure 4.4.
Figure 4.4 Strata penetrated by two boreholes, BH1 and BH2, are shown on a vertical section. If the presence of fossils were to prove that the silt in BH1 and the sand in BH2 were of the same age, and that the sand in BH1 and the gravel in BH2 could also be correlated, then lateral changes of facies would be present in both layers. In (a), the intervening vertical section between BH1 and BH2 is drawn. It shows a gentle inclination of the layering from BH2 to BH1 and a
Distribution of rocks at and below the surface 105
www.angoothachaap.blogspot.com
www.angoothachaap.blogspot.com
coarsening of sediment type in the opposite direction. The change from silt to sand and from sand to gravel is shown diagrammatically as interdigitation of the rock types.
All fossils are of some use in inferring the age of sedimentary rocks, but those of’ most use are relatively plentiful, even in a core sample, and flourished for only a relativelyshort spell of geological time. Many one-celled animals and plants meet these criteria andare used extensively, particularly by specialist geologists in the oil industry.
Life developed at an early stage in the history of the Earth, but few fossils are preserved in the older rocks. In the layers overlying these oldest rocks, fossils of morecomplex plants and invertebrate animals are present; then above these the first land plantsand early fish are found. It is only in the uppermost, comparatively young, layers that thefirst traces of man and the immediate ancestors of present-day flora and fauna appear. Occasionally, changes in the appearance of a fossil community can be followed in detailover periods of a f few million years, but typically the fossil record is fragmentary and disjointed. One general feature, however, stands out clearly: life on Earth has changedpersistently and gradually with time, becoming more specialised in its adaptations todifferent environments and more complex in the organisation of individual animals andplants. These changes are described by the word evolution.
The idea that rocks and fossils can reveal the past history of the Earth and that rock layers may be understood and interpreted in terms of past environments is an importantand central concept in geology. This branch of the science, which studies rocks—especially layered rocks—as Earth history, is called stratigraphy. It makes an important contribution to our knowledge of the universe, as well as of the planet Earth, since itshares with astronomy the ability to provide evidence of events in the distant past. Theseinclude, for example, the behaviour of the Earth’s magnetic and gravitational fields, which are of wider scientific significance than the past geography of one area.
The teaching of an appreciation of stratigraphic research, especially as it relates to the long timespans involved and to the development of life and the emergence of man,should be part of a general education. Here, attention is focused on the practicalknowledge of stratigraphy relevant to site investigation. The purpose of this is (a) tounderstand how environmental factors and ancient geographies control the originaldistribution of rocks and how they are related to the stratigraphic models used in helpingto predict what rocks are present under a site; and (b) to understand the presentation ofdata on geological maps, and in memoirs and reports, in which rocks are classifiedaccording to their age. Some knowledge of stratigraphy and a grasp of its concepts arenecessary in order to be able to cope with the stratigraphic terms and to comprehend thearguments and information presented.
4.3.2 The geological timescale
The strata at one locality represent only a local history of the Earth’s surface. In order to compare events and layers at two different localities and assign relative ages (that is, tocorrelate the strata), it is necessary to recognise similar events in both places. A timescale
Geology for civil engineers 106
www.angoothachaap.blogspot.com
www.angoothachaap.blogspot.com

on which local events can be dated must be based on happenings and changes that can berecognised in widely separated places. The fossil record provides such a history, as theassemblage of fossils in a particular environment is characteristic of a period of time andoccurs contemporaneously over most of the Earth. Some time does elapse as a newspecies of animal spreads over wider regions from the place where it first evolved, butmost successful groups spread rapidly compared with the rates of other geologicalprocesses.
The planet Earth was formed 4600 Ma (million years) ago from debris in space that coalesced. Life appeared comparatively early in its history, and fossils have been foundin rocks which other evidence shows to be more than 3000 Ma old. The evolution ofmany species of animals or plants with calcareous (shelly) and chitinous (horny) hardparts, which survive as fossils and are suitable for dating rocks, happened much later,about 590 Ma ago. The interval of Earth history after 590 Ma, which can be divided intotime units by fossils, is known as the Phanerozoic eon of time. It is divided into three great eras of time: the Palaeozoic, when ‘old life’ such as the first primitive fish existed;the Mesozoic, when ‘middle life’ forms such as the dinosaurs were dominant; and the Cenozoic (or Cainozoic), when ‘new life’ forms such as mammals and grassesflourished. Each era is divided into periods of time and these in turn are subdivided into smaller time units. The periods are listed in the geological timescale of Table 4.2.
The pre-Phanerozoic interval of Earth history from its formation up to c. 590 Ma is known as the Precambrian. This enormous interval of time is divided into three eons:the Priscoan—from the Earth’s origin (c. 4600 Ma) to 4000 Ma; the Archaean—from 4000 Ma to 2500 Ma; and the Proterozoic—from 2500 Ma to the beginning of thePhanerozoic eon (at c. 590 Ma). Each of the three Precambrian eons is further dividedinto eras, as is the Phanerozoic. The earliest rocks discovered on the Earth are gneisses ofearly Archaean age from Amitsoq, West Greenland, which have a radiometric age (explained later in this section) of 3700 Ma. Other early Archaean rocks are known fromCentral and South Africa, and represent igneous and sedimentary as well as metamorphicrocks. In the UK the earliest rocks are late Archaean gneisses found at Scourie in theNorth-west Highlands of Scotland. A fuller account of the Precambrian rocks of the UK is given in Section 4.6.2.
There have been differences of opinion about the most convenient stratigraphic boundaries to take when dividing geological time, particularly the Phanerozoic, intoperiods and epochs. These are being resolved by international agreement between stratigraphers, and time units are now defined by designating certain sequences of rocksas standards (that is, by using type localities), the unit being the time elapsed between theevents represented by two horizons (much as the ‘imperial yard’ used to be defined as the length of a piece of platinum stored in a government office). Correlation with, andconsequential dating of, strata other than at the type localities is done by comparing fossilassemblages found at the type locality with fossils found in the strata to be dated. Inpractice a more complex argument involving correlation with other localities mustusually be employed, so that the equivalence in age of fossils which have not beenrecorded at the type locality may be inferred.
Dating a geological event with reference to the geological (strati-
Distribution of rocks at and below the surface 107
www.angoothachaap.blogspot.com
www.angoothachaap.blogspot.com
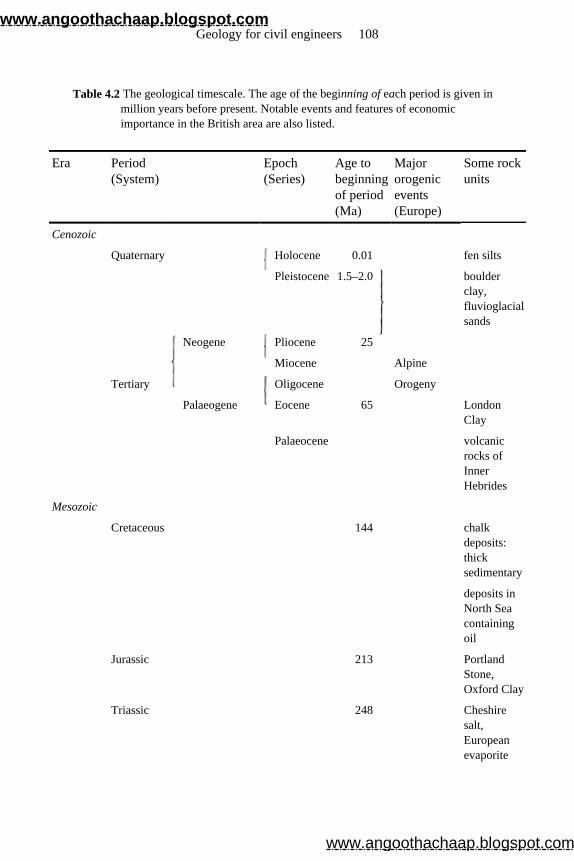
Table 4.2 The geological timescale. The age of the beginning of each period is given in million years before present. Notable events and features of economic importance in the British area are also listed.
Era Period (System)
Epoch (Series)
Age to beginning of period (Ma)
Major orogenic events (Europe)
Some rock units
Cenozoic
Quaternary Holocene 0.01 fen silts
Pleistocene 1.5–2.0
boulder clay, fluvioglacial sands
Neogene Pliocene 25
Miocene Alpine
Tertiary Oligocene Orogeny
Palaeogene Eocene 65 London Clay
Palaeocene volcanic rocks of Inner Hebrides
Mesozoic
Cretaceous 144 chalk deposits: thick sedimentary
deposits in North Sea containing oil
Jurassic 213 Portland Stone, Oxford Clay
Triassic 248 Cheshire salt, European evaporite
Geology for civil engineers 108
www.angoothachaap.blogspot.com
www.angoothachaap.blogspot.com
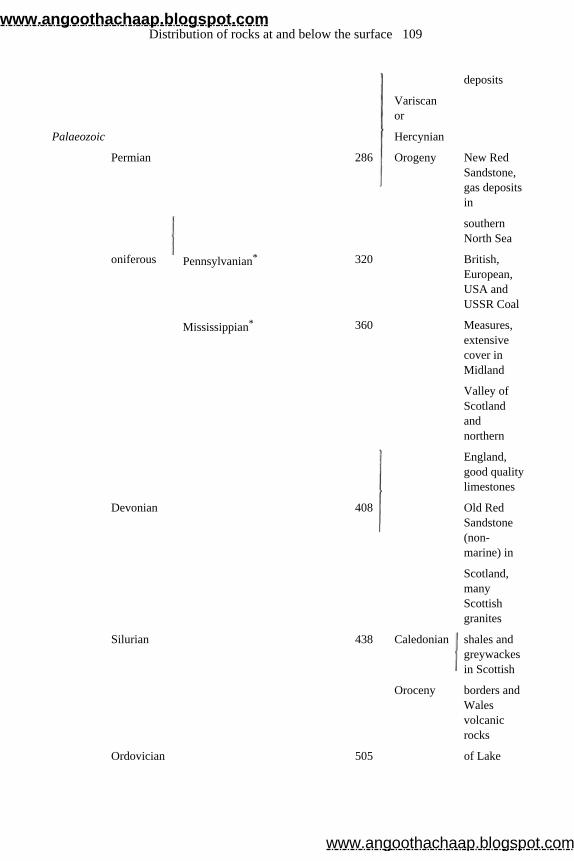
deposits
Variscan or
Palaeozoic Hercynian
Permian 286 Orogeny New Red Sandstone, gas deposits in
southern North Sea
oniferous Pennsylvanian* 320 British, European, USA and USSR Coal
Mississippian* 360 Measures, extensive cover in Midland
Valley of Scotland and northern
England, good quality limestones
Devonian 408 Old Red Sandstone (non-marine) in
Scotland, many Scottish granites
Silurian 438 Caledonian shales and greywackes in Scottish
Oroceny borders and Wales volcanic rocks
Ordovician 505 of Lake
Distribution of rocks at and below the surface 109
www.angoothachaap.blogspot.com
www.angoothachaap.blogspot.com
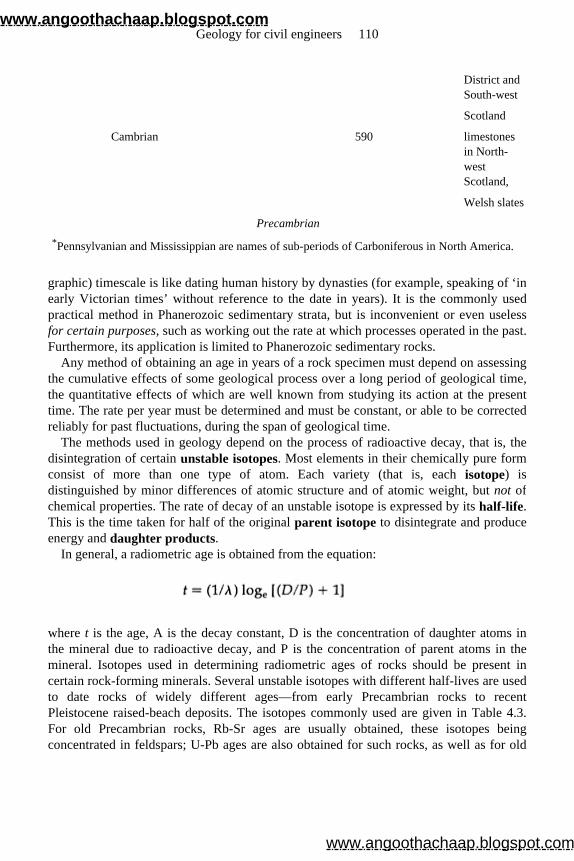
graphic) timescale is like dating human history by dynasties (for example, speaking of ‘in early Victorian times’ without reference to the date in years). It is the commonly used practical method in Phanerozoic sedimentary strata, but is inconvenient or even uselessfor certain purposes, such as working out the rate at which processes operated in the past.Furthermore, its application is limited to Phanerozoic sedimentary rocks.
Any method of obtaining an age in years of a rock specimen must depend on assessingthe cumulative effects of some geological process over a long period of geological time,the quantitative effects of which are well known from studying its action at the presenttime. The rate per year must be determined and must be constant, or able to be correctedreliably for past fluctuations, during the span of geological time.
The methods used in geology depend on the process of radioactive decay, that is, the disintegration of certain unstable isotopes. Most elements in their chemically pure formconsist of more than one type of atom. Each variety (that is, each isotope) is distinguished by minor differences of atomic structure and of atomic weight, but not of chemical properties. The rate of decay of an unstable isotope is expressed by its half-life. This is the time taken for half of the original parent isotope to disintegrate and produce energy and daughter products.
In general, a radiometric age is obtained from the equation:
where t is the age, A is the decay constant, D is the concentration of daughter atoms in the mineral due to radioactive decay, and P is the concentration of parent atoms in themineral. Isotopes used in determining radiometric ages of rocks should be present incertain rock-forming minerals. Several unstable isotopes with different half-lives are used to date rocks of widely different ages—from early Precambrian rocks to recentPleistocene raised-beach deposits. The isotopes commonly used are given in Table 4.3. For old Precambrian rocks, Rb-Sr ages are usually obtained, these isotopes beingconcentrated in feldspars; U-Pb ages are also obtained for such rocks, as well as for old
District and South-west
Scotland
Cambrian 590 limestones in North-west Scotland,
Welsh slates
Precambrian *Pennsylvanian and Mississippian are names of sub-periods of Carboniferous in North America.
Geology for civil engineers 110
www.angoothachaap.blogspot.com
www.angoothachaap.blogspot.com
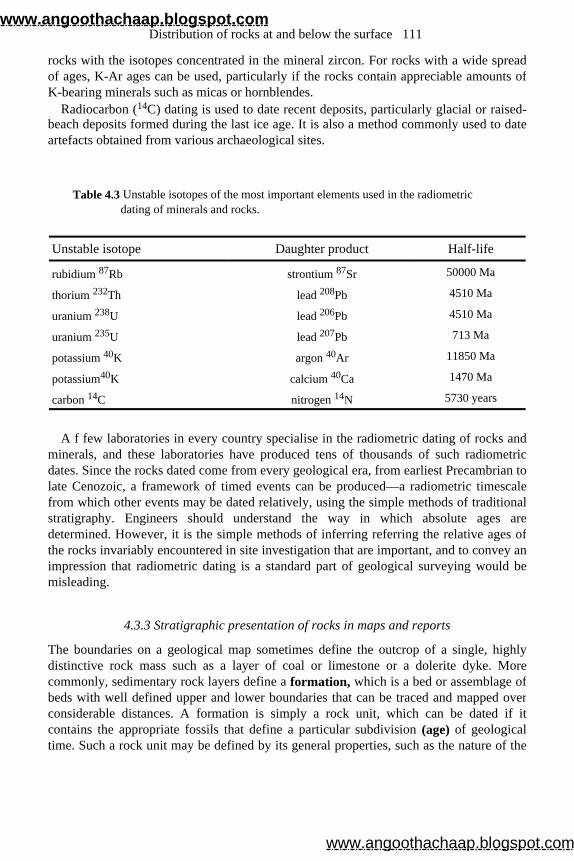
rocks with the isotopes concentrated in the mineral zircon. For rocks with a wide spreadof ages, K-Ar ages can be used, particularly if the rocks contain appreciable amounts ofK-bearing minerals such as micas or hornblendes.
Radiocarbon (14C) dating is used to date recent deposits, particularly glacial or raised-beach deposits formed during the last ice age. It is also a method commonly used to dateartefacts obtained from various archaeological sites.
A f few laboratories in every country specialise in the radiometric dating of rocks andminerals, and these laboratories have produced tens of thousands of such radiometricdates. Since the rocks dated come from every geological era, from earliest Precambrian tolate Cenozoic, a framework of timed events can be produced—a radiometric timescale from which other events may be dated relatively, using the simple methods of traditionalstratigraphy. Engineers should understand the way in which absolute ages aredetermined. However, it is the simple methods of inferring referring the relative ages ofthe rocks invariably encountered in site investigation that are important, and to convey animpression that radiometric dating is a standard part of geological surveying would bemisleading.
4.3.3 Stratigraphic presentation of rocks in maps and reports
The boundaries on a geological map sometimes define the outcrop of a single, highlydistinctive rock mass such as a layer of coal or limestone or a dolerite dyke. Morecommonly, sedimentary rock layers define a formation, which is a bed or assemblage of beds with well defined upper and lower boundaries that can be traced and mapped overconsiderable distances. A formation is simply a rock unit, which can be dated if itcontains the appropriate fossils that define a particular subdivision (age) of geological time. Such a rock unit may be defined by its general properties, such as the nature of the
Table 4.3 Unstable isotopes of the most important elements used in the radiometric dating of minerals and rocks.
Unstable isotope Daughter product Half-life
rubidium 87Rb strontium 87Sr 50000 Ma
thorium 232Th lead 208Pb 4510 Ma
uranium 238U lead 206Pb 4510 Ma
uranium 235U lead 207Pb 713 Ma
potassium 40K argon 40Ar 11850 Ma
potassium40K calcium 40Ca 1470 Ma
carbon 14C nitrogen 14N 5730 years
Distribution of rocks at and below the surface 111
www.angoothachaap.blogspot.com
www.angoothachaap.blogspot.com
pebbles and the colour of the cement in conglomerates within it. The significantdifferences between formations reflect significant differences in environments ofdeposition. Changes of environment can also occur laterally across a region at any onetime, with corresponding lateral changes of rock type.
In the legend of a geological map, the age of formations (or of several formations, called a group) is shown. The description of strata in reports, for example BGS DistrictMemoirs (Appendix C), is also arranged according to stratigraphic order, with the oldestgroup of rocks described first. Descriptions of the strata present at different exposureswithin the area considered are given within the chapter on the particular group or formation, and the available evidence on lateral changes of facies is presented.
4.4 Deformation of rocks (structural geology)
4.4.1 Outcrops and subsurface structure
If the structure of an area is known, then so also is the distribution of rocks on any two-dimensional section across it. A geological map is, generally speaking, such a section,and the distribution of rocks in this case is the pattern of outcrops. The principal factorthat may make a map more complicated than a vertical section is that the latter is a planarsurface, whereas the ground surface is likely to be irregular. In the paragraphs thatfollow, the qualitative relationships between structures, vertical sections and thecorresponding geological map are illustrated for different structural models. In order toavoid complication and to show geometric relationships clearly, both the stratigraphy andtopography are kept simple. The rocks are layers of constant thickness and are withoutany lateral change of rock type. The ground surface approximates to a level plain exceptwhere it is dissected by river valleys.
By a converse argument, the general distribution of rocks in the subsurface may beinferred by studying the outcrops, and by relating a particular pattern to the structuralmodel that would produce a similar one. The direction of dip, the nature of folding of thestrata and the amount of displacement across faults may be recognised quickly byinspection of a geological map of the area and used as a first step in analysing thegeology.
Inferring the nature of a structural model from the evidence of outcrops, or from scattered exposures, involves inductive reasoning (see Section 6.1.2) and makes the implicit assumption that the most probable answer is the simplest one consistent with theobservations. For example, failing evidence to the contrary, it is assumed that dip andstrike stay constant between adjacent exposures where they are identical, and theinterpolated outcrops are constructed on this premise. The probability of being correctincreases, of course, with the amount of information available.
The structure of strata is usually shown on a map by symbols, such as dip arrows. A more convenient way for some purposes, where the structure is simple, is to drawcontours relative to a datum and so represent the ups and downs of a particular geologicalinterface (just as topographic contours depict the shape of the ground surface). The
Geology for civil engineers 112
www.angoothachaap.blogspot.com
www.angoothachaap.blogspot.com
interface is usually a bedding plane separating two different layers. A common use ofcontours to depict geological structure in engineering geology is a contour map of rock head, which shows the depth to solid rock and the shape of the bedrock surface. Todistinguish them from topographic contours they are referred to as stratum contours or, when they are used in certain interpretative constructions, as strike lines (see next section for a fuller explanation). When irregularities of the ground surface are represented on ageological map by topographic contours, and when the structure of a geological interfaceis represented by stratum contours drawn at the same vertical interval (for example, atelevation difference of 25 m), then it is possible to construct the outcrop of the interfaceof the map. This is illustrated in the next section.
4.4.2 Layers of uniform dip (horizontal, vertical and inclined strata)
Original layering in sediments is called stratification or bedding. (Different terms areused for the layering produced by other igneous and metamorphic processes.) Each layeris referred to as a stratum (plural, strata) or bed, though the latter term is normally applied only to sedimentary rocks and volcanic ash layers. It is never applied to the layerformed by a basaltic or rhyolitic lava flow. The interfaces between beds are calledbedding planes. The outcrops of major bedding planes that separate thick beds ofdifferent rock type are depicted on geological maps. Bedding planes may also occurwithin a thick layer of sandstone, where minor changes of composition or texture, or evena break in deposition, are present. These are planes of weakness, or potential planes offailure, and their presence produces a change of mechanical properties of the rock withthe direction in which they are measured (that is, the bulk properties of the rock areanisotropic). Minor bedding planes are abundant in micaceous shale, because mica flakeslie in the bedding direction as they grow in the rock or settle in water. Rocks that aredevoid of bedding and other planes of weakness such as joints (see Section 4.4.4) are said to be massive.
At the time of deposition, most beds are nearly horizontal. Later, tilting or buckling ofthe Earth’s crust may leave them inclined at an angle to the horizontal. The dip is easily measured with a clinometer, consisting of two hinged arms. One rests on the beddingplane and the other has a spirit level and is made to lie horizontally. The angle betweenthe arms is shown by a protractor. In Figure 4.5 a layer of sandstone is seen to dip at 30°to the north.
A clinometer aligned north-south would give a reading of 30°. A measurement made in any other direction on the bed would give a smaller reading of dip, with the dipdecreasing progressively as the angle B increases, until at B=90° the dip measured is zero. In this example, north is the direction of maximum or true dip and 30° is the true dip. The direction of 90° to it (that is, east-west) is the strike of the bed. A line drawn in this direction on the bed is horizontal, and since it is thus a line joining points at the sameheight on the bed, it is a stratum contour or strike line. In any of the directions betweentrue dip and strike, the angle of dip observed between bedding plane and horizontaldepends on the true dip and the angle B. A value of this type is referred to as an apparent dip. Most observations of sections in cuttings, quarries or cliff faces reveal apparent dips,
Distribution of rocks at and below the surface 113
www.angoothachaap.blogspot.com
www.angoothachaap.blogspot.com
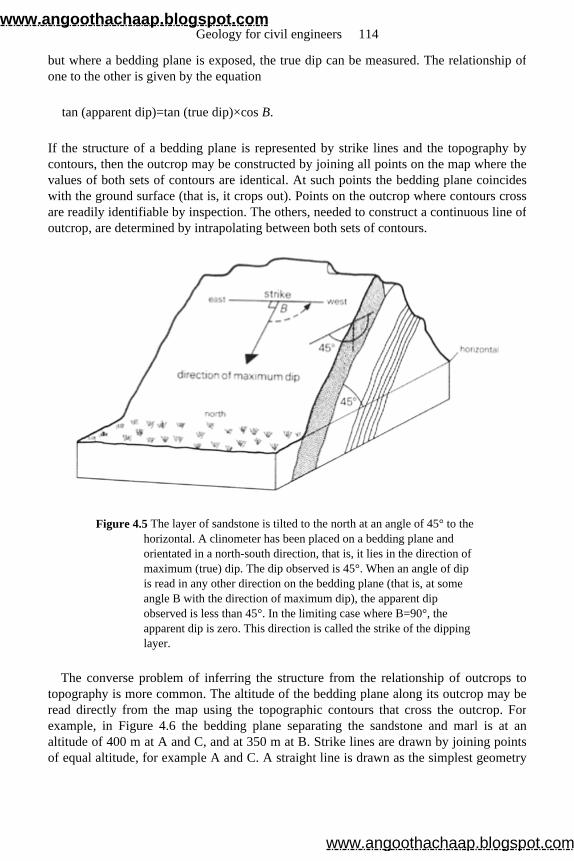
but where a bedding plane is exposed, the true dip can be measured. The relationship ofone to the other is given by the equation
If the structure of a bedding plane is represented by strike lines and the topography bycontours, then the outcrop may be constructed by joining all points on the map where thevalues of both sets of contours are identical. At such points the bedding plane coincideswith the ground surface (that is, it crops out). Points on the outcrop where contours crossare readily identifiable by inspection. The others, needed to construct a continuous line ofoutcrop, are determined by intrapolating between both sets of contours.
Figure 4.5 The layer of sandstone is tilted to the north at an angle of 45° to the horizontal. A clinometer has been placed on a bedding plane and orientated in a north-south direction, that is, it lies in the direction of maximum (true) dip. The dip observed is 45°. When an angle of dip is read in any other direction on the bedding plane (that is, at some angle B with the direction of maximum dip), the apparent dip observed is less than 45°. In the limiting case where B=90°, the apparent dip is zero. This direction is called the strike of the dipping layer.
The converse problem of inferring the structure from the relationship of outcrops to topography is more common. The altitude of the bedding plane along its outcrop may beread directly from the map using the topographic contours that cross the outcrop. Forexample, in Figure 4.6 the bedding plane separating the sandstone and marl is at an altitude of 400 m at A and C, and at 350 m at B. Strike lines are drawn by joining pointsof equal altitude, for example A and C. A straight line is drawn as the simplest geometry
tan (apparent dip)=tan (true dip)×cos B.
Geology for civil engineers 114
www.angoothachaap.blogspot.com
www.angoothachaap.blogspot.com
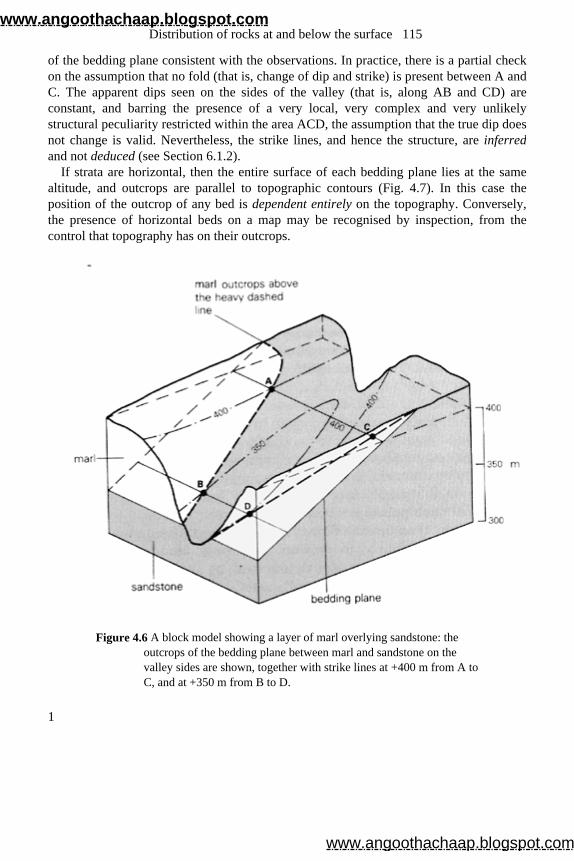
of the bedding plane consistent with the observations. In practice, there is a partial checkon the assumption that no fold (that is, change of dip and strike) is present between A andC. The apparent dips seen on the sides of the valley (that is, along AB and CD) areconstant, and barring the presence of a very local, very complex and very unlikelystructural peculiarity restricted within the area ACD, the assumption that the true dip doesnot change is valid. Nevertheless, the strike lines, and hence the structure, are inferredand not deduced (see Section 6.1.2).
If strata are horizontal, then the entire surface of each bedding plane lies at the same altitude, and outcrops are parallel to topographic contours (Fig. 4.7). In this case the position of the outcrop of any bed is dependent entirely on the topography. Conversely, the presence of horizontal beds on a map may be recognised by inspection, from thecontrol that topography has on their outcrops.
Figure 4.6 A block model showing a layer of marl overlying sandstone: the outcrops of the bedding plane between marl and sandstone on the valley sides are shown, together with strike lines at +400 m from A to C, and at +350 m from B to D.
1
Distribution of rocks at and below the surface 115
www.angoothachaap.blogspot.com
www.angoothachaap.blogspot.com
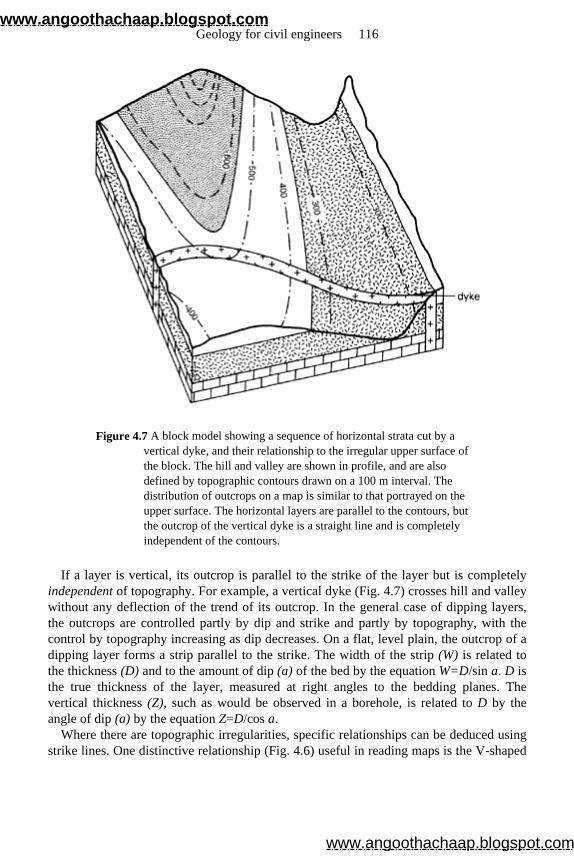
Figure 4.7 A block model showing a sequence of horizontal strata cut by a vertical dyke, and their relationship to the irregular upper surface of the block. The hill and valley are shown in profile, and are also defined by topographic contours drawn on a 100 m interval. The distribution of outcrops on a map is similar to that portrayed on the upper surface. The horizontal layers are parallel to the contours, but the outcrop of the vertical dyke is a straight line and is completely independent of the contours.
If a layer is vertical, its outcrop is parallel to the strike of the layer but is completely independent of topography. For example, a vertical dyke (Fig. 4.7) crosses hill and valley without any deflection of the trend of its outcrop. In the general case of dipping layers,the outcrops are controlled partly by dip and strike and partly by topography, with thecontrol by topography increasing as dip decreases. On a flat, level plain, the outcrop of adipping layer forms a strip parallel to the strike. The width of the strip (W) is related to the thickness (D) and to the amount of dip (a) of the bed by the equation W=D/sin a. D is the true thickness of the layer, measured at right angles to the bedding planes. Thevertical thickness (Z), such as would be observed in a borehole, is related to D by the angle of dip (a) by the equation Z=D/cos a.
Where there are topographic irregularities, specific relationships can be deduced usingstrike lines. One distinctive relationship (Fig. 4.6) useful in reading maps is the V-shaped
Geology for civil engineers 116
www.angoothachaap.blogspot.com
www.angoothachaap.blogspot.com
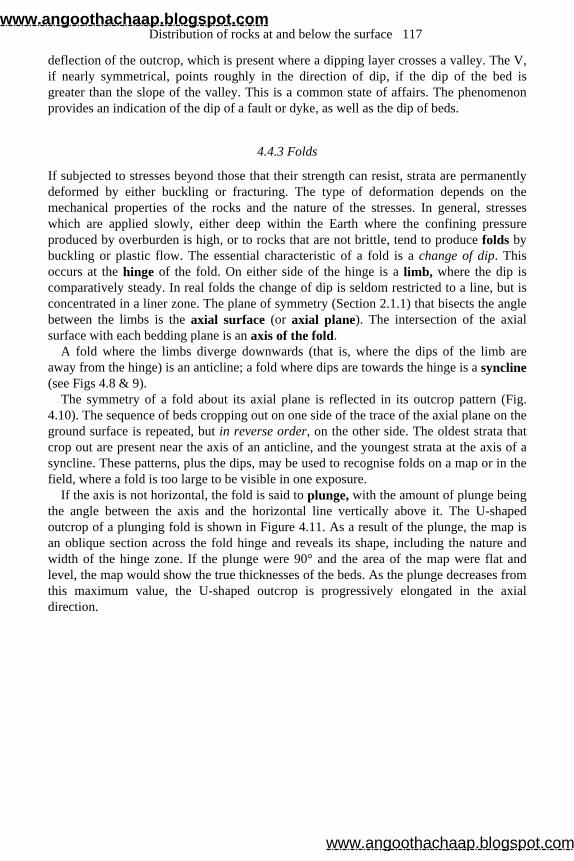
deflection of the outcrop, which is present where a dipping layer crosses a valley. The V,if nearly symmetrical, points roughly in the direction of dip, if the dip of the bed isgreater than the slope of the valley. This is a common state of affairs. The phenomenonprovides an indication of the dip of a fault or dyke, as well as the dip of beds.
4.4.3 Folds
If subjected to stresses beyond those that their strength can resist, strata are permanentlydeformed by either buckling or fracturing. The type of deformation depends on themechanical properties of the rocks and the nature of the stresses. In general, stresseswhich are applied slowly, either deep within the Earth where the confining pressureproduced by overburden is high, or to rocks that are not brittle, tend to produce folds by buckling or plastic flow. The essential characteristic of a fold is a change of dip. This occurs at the hinge of the fold. On either side of the hinge is a limb, where the dip is comparatively steady. In real folds the change of dip is seldom restricted to a line, but isconcentrated in a liner zone. The plane of symmetry (Section 2.1.1) that bisects the angle between the limbs is the axial surface (or axial plane). The intersection of the axial surface with each bedding plane is an axis of the fold.
A fold where the limbs diverge downwards (that is, where the dips of the limb areaway from the hinge) is an anticline; a fold where dips are towards the hinge is a syncline (see Figs 4.8 & 9).
The symmetry of a fold about its axial plane is reflected in its outcrop pattern (Fig. 4.10). The sequence of beds cropping out on one side of the trace of the axial plane on theground surface is repeated, but in reverse order, on the other side. The oldest strata that crop out are present near the axis of an anticline, and the youngest strata at the axis of asyncline. These patterns, plus the dips, may be used to recognise folds on a map or in thefield, where a fold is too large to be visible in one exposure.
If the axis is not horizontal, the fold is said to plunge, with the amount of plunge being the angle between the axis and the horizontal line vertically above it. The U-shaped outcrop of a plunging fold is shown in Figure 4.11. As a result of the plunge, the map isan oblique section across the fold hinge and reveals its shape, including the nature andwidth of the hinge zone. If the plunge were 90° and the area of the map were flat andlevel, the map would show the true thicknesses of the beds. As the plunge decreases fromthis maximum value, the U-shaped outcrop is progressively elongated in the axialdirection.
Distribution of rocks at and below the surface 117
www.angoothachaap.blogspot.com
www.angoothachaap.blogspot.com
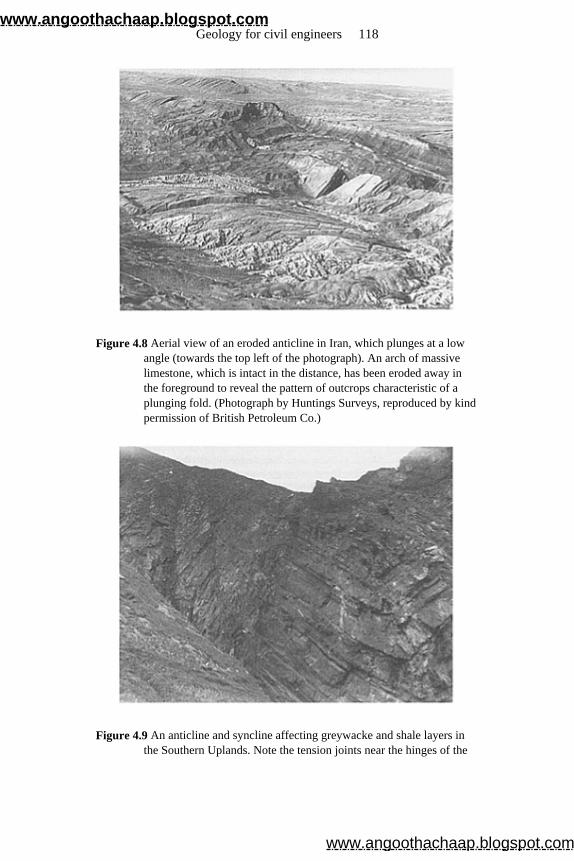
Figure 4.8 Aerial view of an eroded anticline in Iran, which plunges at a low angle (towards the top left of the photograph). An arch of massive limestone, which is intact in the distance, has been eroded away in the foreground to reveal the pattern of outcrops characteristic of a plunging fold. (Photograph by Huntings Surveys, reproduced by kind permission of British Petroleum Co.)
Figure 4.9 An anticline and syncline affecting greywacke and shale layers in the Southern Uplands. Note the tension joints near the hinges of the
Geology for civil engineers 118
www.angoothachaap.blogspot.com
www.angoothachaap.blogspot.com
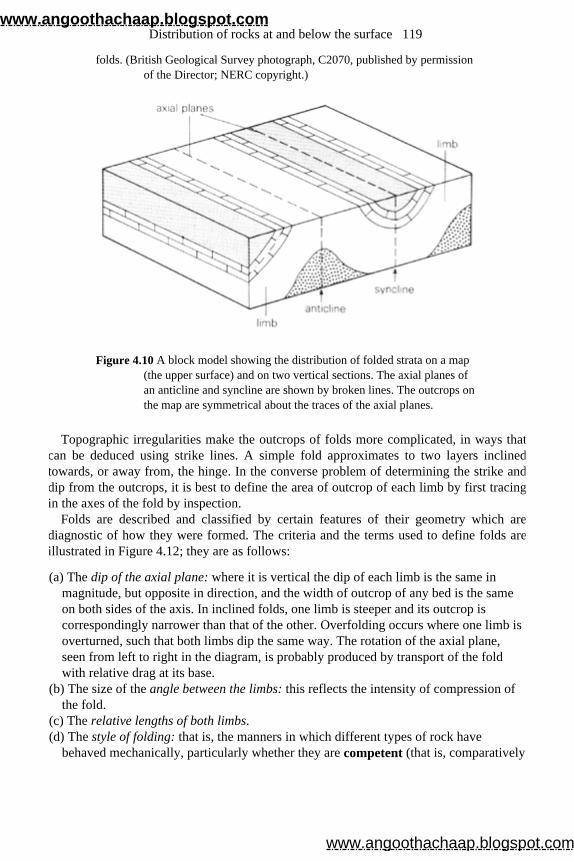
folds. (British Geological Survey photograph, C2070, published by permission of the Director; NERC copyright.)
Figure 4.10 A block model showing the distribution of folded strata on a map (the upper surface) and on two vertical sections. The axial planes of an anticline and syncline are shown by broken lines. The outcrops on the map are symmetrical about the traces of the axial planes.
Topographic irregularities make the outcrops of folds more complicated, in ways that can be deduced using strike lines. A simple fold approximates to two layers inclinedtowards, or away from, the hinge. In the converse problem of determining the strike anddip from the outcrops, it is best to define the area of outcrop of each limb by first tracingin the axes of the fold by inspection.
Folds are described and classified by certain features of their geometry which are diagnostic of how they were formed. The criteria and the terms used to define folds areillustrated in Figure 4.12; they are as follows:
(a) The dip of the axial plane: where it is vertical the dip of each limb is the same in magnitude, but opposite in direction, and the width of outcrop of any bed is the same on both sides of the axis. In inclined folds, one limb is steeper and its outcrop is correspondingly narrower than that of the other. Overfolding occurs where one limb is overturned, such that both limbs dip the same way. The rotation of the axial plane, seen from left to right in the diagram, is probably produced by transport of the fold with relative drag at its base.
(b) The size of the angle between the limbs: this reflects the intensity of compression of the fold.
(c) The relative lengths of both limbs. (d) The style of folding: that is, the manners in which different types of rock have
behaved mechanically, particularly whether they are competent (that is, comparatively
Distribution of rocks at and below the surface 119
www.angoothachaap.blogspot.com
www.angoothachaap.blogspot.com
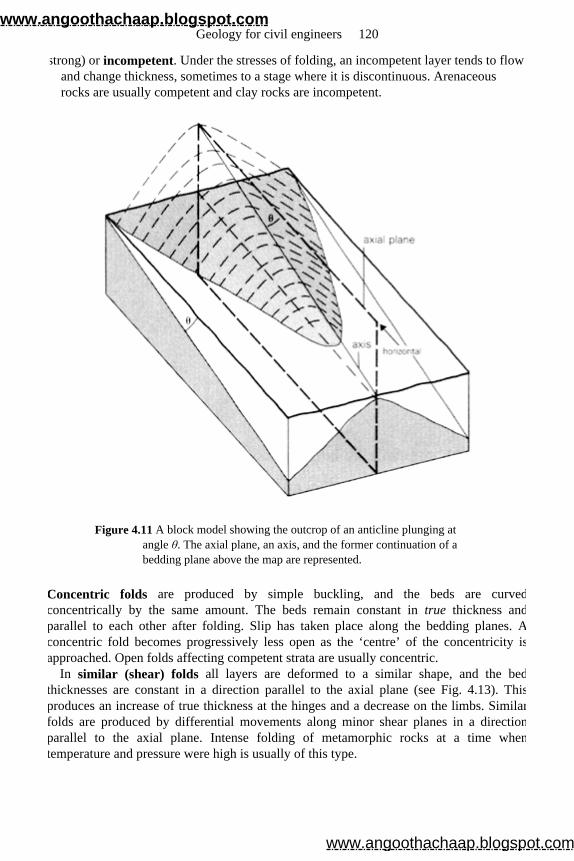
strong) or incompetent. Under the stresses of folding, an incompetent layer tends to flow and change thickness, sometimes to a stage where it is discontinuous. Arenaceous rocks are usually competent and clay rocks are incompetent.
Figure 4.11 A block model showing the outcrop of an anticline plunging at angle θ. The axial plane, an axis, and the former continuation of a bedding plane above the map are represented.
Concentric folds are produced by simple buckling, and the beds are curvedconcentrically by the same amount. The beds remain constant in true thickness andparallel to each other after folding. Slip has taken place along the bedding planes. Aconcentric fold becomes progressively less open as the ‘centre’ of the concentricity isapproached. Open folds affecting competent strata are usually concentric.
In similar (shear) folds all layers are deformed to a similar shape, and the bedthicknesses are constant in a direction parallel to the axial plane (see Fig. 4.13). Thisproduces an increase of true thickness at the hinges and a decrease on the limbs. Similarfolds are produced by differential movements along minor shear planes in a directionparallel to the axial plane. Intense folding of metamorphic rocks at a time whentemperature and pressure were high is usually of this type.
Geology for civil engineers 120
www.angoothachaap.blogspot.com
www.angoothachaap.blogspot.com
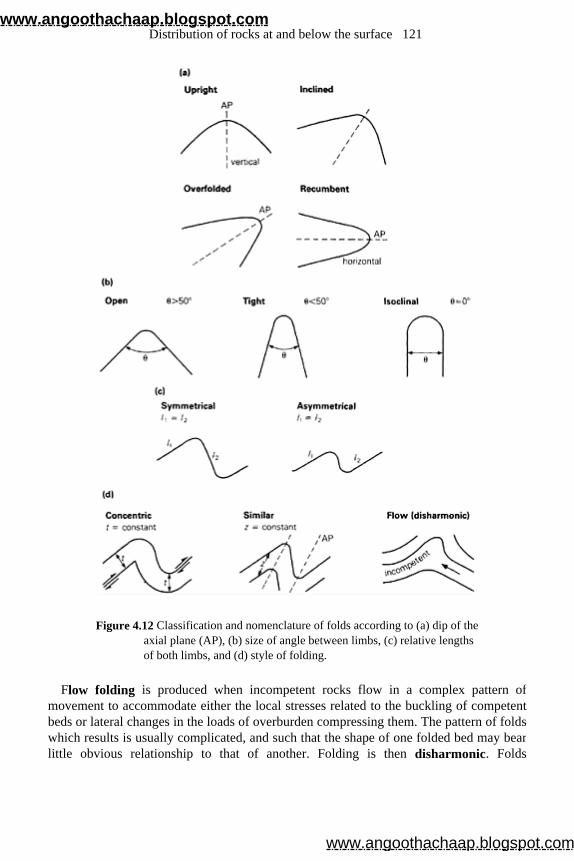
Figure 4.12 Classification and nomenclature of folds according to (a) dip of the axial plane (AP), (b) size of angle between limbs, (c) relative lengths of both limbs, and (d) style of folding.
Flow folding is produced when incompetent rocks flow in a complex pattern ofmovement to accommodate either the local stresses related to the buckling of competentbeds or lateral changes in the loads of overburden compressing them. The pattern of foldswhich results is usually complicated, and such that the shape of one folded bed may bearlittle obvious relationship to that of another. Folding is then disharmonic. Folds
Distribution of rocks at and below the surface 121
www.angoothachaap.blogspot.com
www.angoothachaap.blogspot.com
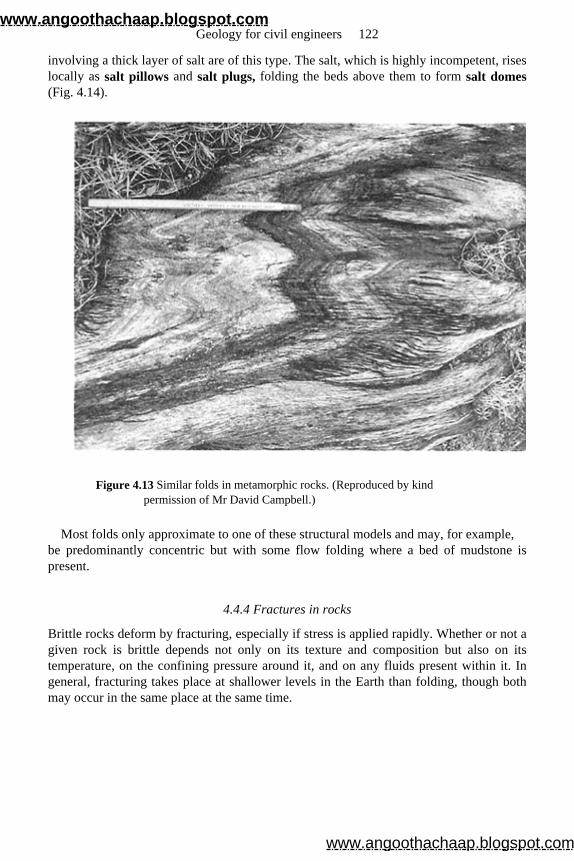
involving a thick layer of salt are of this type. The salt, which is highly incompetent, riseslocally as salt pillows and salt plugs, folding the beds above them to form salt domes(Fig. 4.14).
Figure 4.13 Similar folds in metamorphic rocks. (Reproduced by kind permission of Mr David Campbell.)
Most folds only approximate to one of these structural models and may, for example, be predominantly concentric but with some flow folding where a bed of mudstone ispresent.
4.4.4 Fractures in rocks
Brittle rocks deform by fracturing, especially if stress is applied rapidly. Whether or not agiven rock is brittle depends not only on its texture and composition but also on itstemperature, on the confining pressure around it, and on any fluids present within it. Ingeneral, fracturing takes place at shallower levels in the Earth than folding, though bothmay occur in the same place at the same time.
Geology for civil engineers 122
www.angoothachaap.blogspot.com
www.angoothachaap.blogspot.com
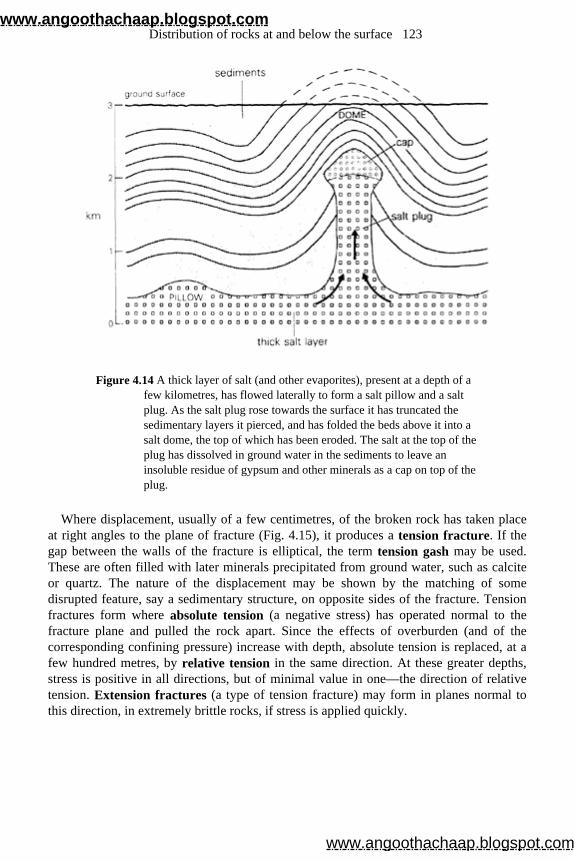
Figure 4.14 A thick layer of salt (and other evaporites), present at a depth of a few kilometres, has flowed laterally to form a salt pillow and a salt plug. As the salt plug rose towards the surface it has truncated the sedimentary layers it pierced, and has folded the beds above it into a salt dome, the top of which has been eroded. The salt at the top of the plug has dissolved in ground water in the sediments to leave an insoluble residue of gypsum and other minerals as a cap on top of the plug.
Where displacement, usually of a few centimetres, of the broken rock has taken placeat right angles to the plane of fracture (Fig. 4.15), it produces a tension fracture. If the gap between the walls of the fracture is elliptical, the term tension gash may be used. These are often filled with later minerals precipitated from ground water, such as calciteor quartz. The nature of the displacement may be shown by the matching of somedisrupted feature, say a sedimentary structure, on opposite sides of the fracture. Tensionfractures form where absolute tension (a negative stress) has operated normal to thefracture plane and pulled the rock apart. Since the effects of overburden (and of thecorresponding confining pressure) increase with depth, absolute tension is replaced, at afew hundred metres, by relative tension in the same direction. At these greater depths, stress is positive in all directions, but of minimal value in one—the direction of relative tension. Extension fractures (a type of tension fracture) may form in planes normal tothis direction, in extremely brittle rocks, if stress is applied quickly.
Distribution of rocks at and below the surface 123
www.angoothachaap.blogspot.com
www.angoothachaap.blogspot.com
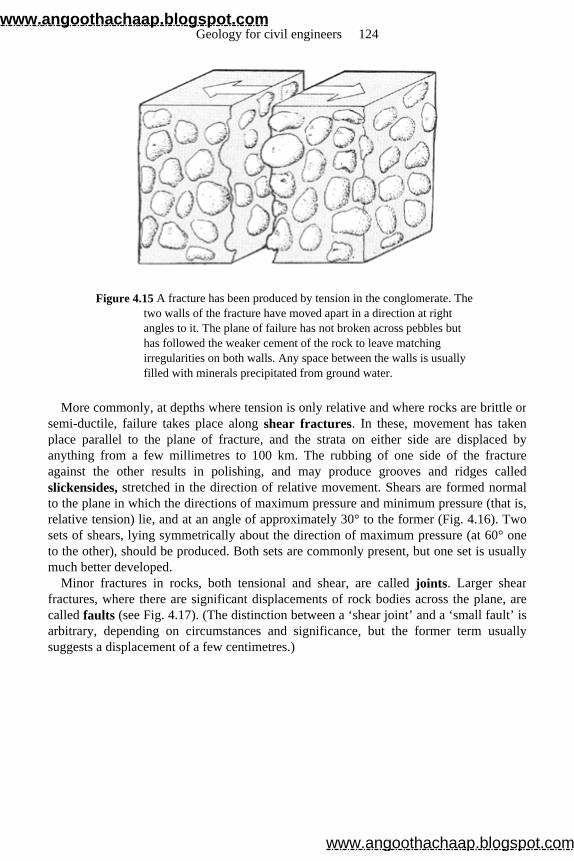
Figure 4.15 A fracture has been produced by tension in the conglomerate. The two walls of the fracture have moved apart in a direction at right angles to it. The plane of failure has not broken across pebbles but has followed the weaker cement of the rock to leave matching irregularities on both walls. Any space between the walls is usually filled with minerals precipitated from ground water.
More commonly, at depths where tension is only relative and where rocks are brittle orsemi-ductile, failure takes place along shear fractures. In these, movement has taken place parallel to the plane of fracture, and the strata on either side are displaced byanything from a few millimetres to 100 km. The rubbing of one side of the fractureagainst the other results in polishing, and may produce grooves and ridges calledslickensides, stretched in the direction of relative movement. Shears are formed normal to the plane in which the directions of maximum pressure and minimum pressure (that is,relative tension) lie, and at an angle of approximately 30° to the former (Fig. 4.16). Two sets of shears, lying symmetrically about the direction of maximum pressure (at 60° one to the other), should be produced. Both sets are commonly present, but one set is usuallymuch better developed.
Minor fractures in rocks, both tensional and shear, are called joints. Larger shear fractures, where there are significant displacements of rock bodies across the plane, arecalled faults (see Fig. 4.17). (The distinction between a ‘shear joint’ and a ‘small fault’ is arbitrary, depending on circumstances and significance, but the former term usuallysuggests a displacement of a few centimetres.)
Geology for civil engineers 124
www.angoothachaap.blogspot.com
www.angoothachaap.blogspot.com
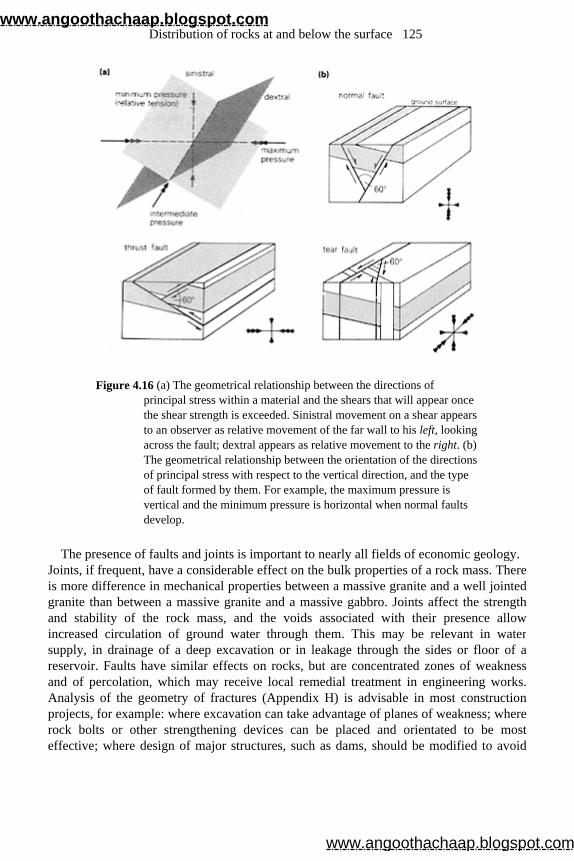
Figure 4.16 (a) The geometrical relationship between the directions of principal stress within a material and the shears that will appear once the shear strength is exceeded. Sinistral movement on a shear appears to an observer as relative movement of the far wall to his left, looking across the fault; dextral appears as relative movement to the right. (b) The geometrical relationship between the orientation of the directions of principal stress with respect to the vertical direction, and the type of fault formed by them. For example, the maximum pressure is vertical and the minimum pressure is horizontal when normal faults develop.
The presence of faults and joints is important to nearly all fields of economic geology. Joints, if frequent, have a considerable effect on the bulk properties of a rock mass. Thereis more difference in mechanical properties between a massive granite and a well jointedgranite than between a massive granite and a massive gabbro. Joints affect the strengthand stability of the rock mass, and the voids associated with their presence allowincreased circulation of ground water through them. This may be relevant in watersupply, in drainage of a deep excavation or in leakage through the sides or floor of areservoir. Faults have similar effects on rocks, but are concentrated zones of weaknessand of percolation, which may receive local remedial treatment in engineering works.Analysis of the geometry of fractures (Appendix H) is advisable in most construction projects, for example: where excavation can take advantage of planes of weakness; whererock bolts or other strengthening devices can be placed and orientated to be most effective; where design of major structures, such as dams, should be modified to avoid
Distribution of rocks at and below the surface 125
www.angoothachaap.blogspot.com
www.angoothachaap.blogspot.com
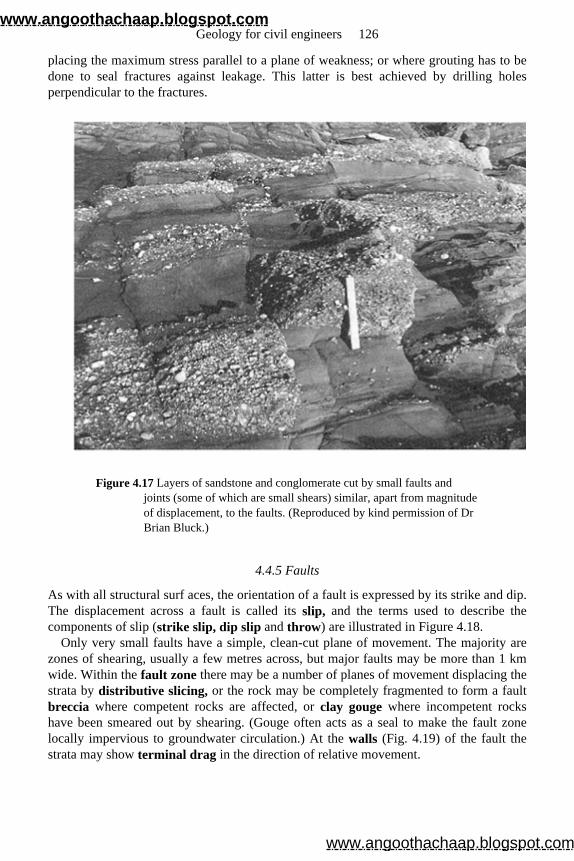
placing the maximum stress parallel to a plane of weakness; or where grouting has to bedone to seal fractures against leakage. This latter is best achieved by drilling holesperpendicular to the fractures.
Figure 4.17 Layers of sandstone and conglomerate cut by small faults and joints (some of which are small shears) similar, apart from magnitude of displacement, to the faults. (Reproduced by kind permission of Dr Brian Bluck.)
4.4.5 Faults
As with all structural surf aces, the orientation of a fault is expressed by its strike and dip.The displacement across a fault is called its slip, and the terms used to describe thecomponents of slip (strike slip, dip slip and throw) are illustrated in Figure 4.18.
Only very small faults have a simple, clean-cut plane of movement. The majority are zones of shearing, usually a few metres across, but major faults may be more than 1 kmwide. Within the fault zone there may be a number of planes of movement displacing thestrata by distributive slicing, or the rock may be completely fragmented to form a fault breccia where competent rocks are affected, or clay gouge where incompetent rocks have been smeared out by shearing. (Gouge often acts as a seal to make the fault zonelocally impervious to groundwater circulation.) At the walls (Fig. 4.19) of the fault the strata may show terminal drag in the direction of relative movement.
Geology for civil engineers 126
www.angoothachaap.blogspot.com
www.angoothachaap.blogspot.com
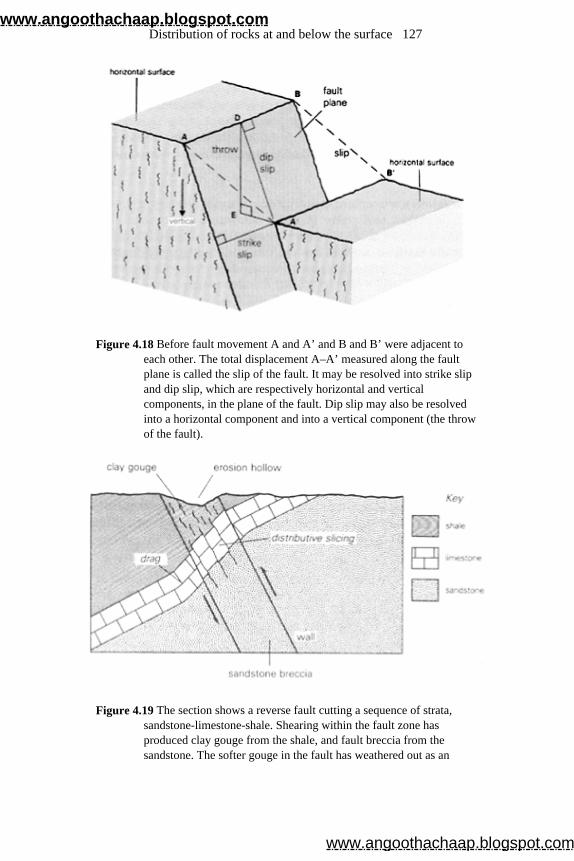
Figure 4.18 Before fault movement A and A’ and B and B’ were adjacent to each other. The total displacement A–A’ measured along the fault plane is called the slip of the fault. It may be resolved into strike slip and dip slip, which are respectively horizontal and vertical components, in the plane of the fault. Dip slip may also be resolved into a horizontal component and into a vertical component (the throw of the fault).
Figure 4.19 The section shows a reverse fault cutting a sequence of strata, sandstone-limestone-shale. Shearing within the fault zone has produced clay gouge from the shale, and fault breccia from the sandstone. The softer gouge in the fault has weathered out as an
Distribution of rocks at and below the surface 127
www.angoothachaap.blogspot.com
www.angoothachaap.blogspot.com
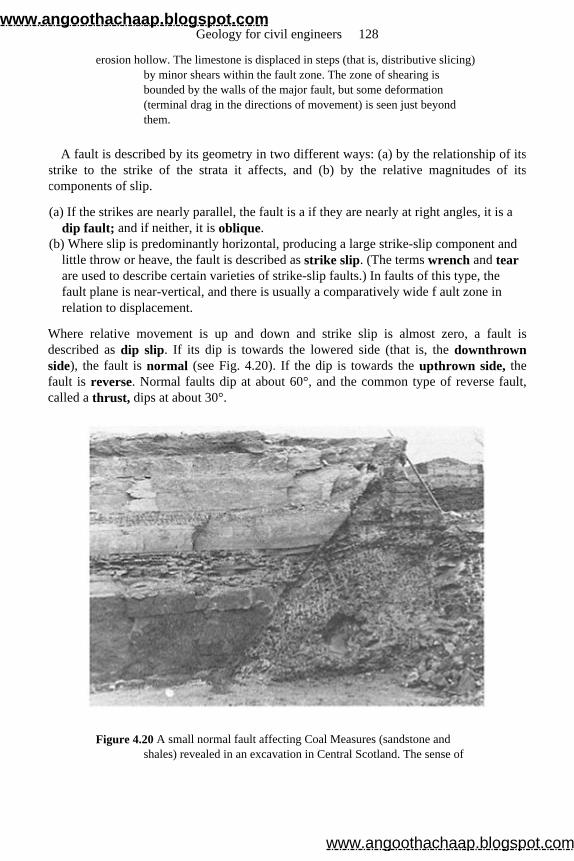
erosion hollow. The limestone is displaced in steps (that is, distributive slicing) by minor shears within the fault zone. The zone of shearing is bounded by the walls of the major fault, but some deformation (terminal drag in the directions of movement) is seen just beyond them.
A fault is described by its geometry in two different ways: (a) by the relationship of itsstrike to the strike of the strata it affects, and (b) by the relative magnitudes of itscomponents of slip.
(a) If the strikes are nearly parallel, the fault is a if they are nearly at right angles, it is a dip fault; and if neither, it is oblique.
(b) Where slip is predominantly horizontal, producing a large strike-slip component and little throw or heave, the fault is described as strike slip. (The terms wrench and tear are used to describe certain varieties of strike-slip faults.) In faults of this type, the fault plane is near-vertical, and there is usually a comparatively wide f ault zone in relation to displacement.
Where relative movement is up and down and strike slip is almost zero, a fault isdescribed as dip slip. If its dip is towards the lowered side (that is, the downthrown side), the fault is normal (see Fig. 4.20). If the dip is towards the upthrown side, the fault is reverse. Normal faults dip at about 60°, and the common type of reverse fault,called a thrust, dips at about 30°.
Figure 4.20 A small normal fault affecting Coal Measures (sandstone and shales) revealed in an excavation in Central Scotland. The sense of
Geology for civil engineers 128
www.angoothachaap.blogspot.com
www.angoothachaap.blogspot.com
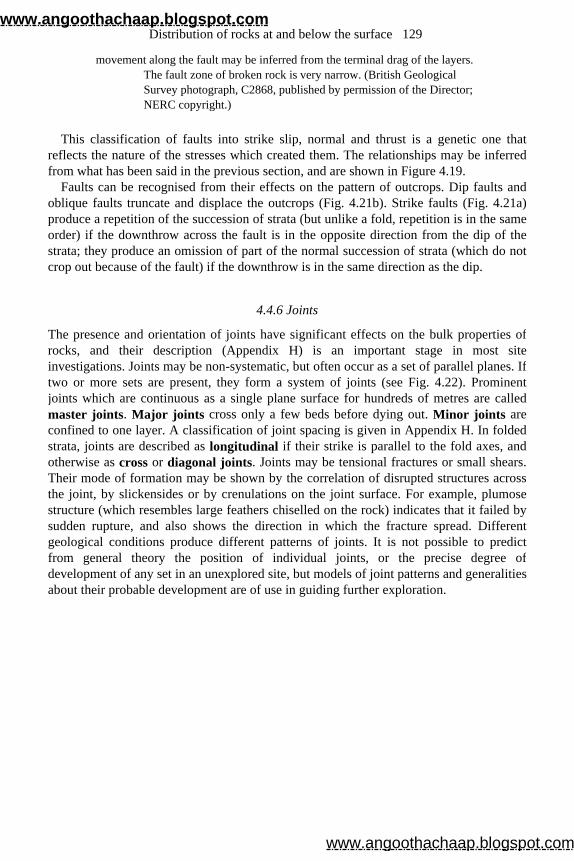
movement along the fault may be inferred from the terminal drag of the layers. The fault zone of broken rock is very narrow. (British Geological Survey photograph, C2868, published by permission of the Director; NERC copyright.)
This classification of faults into strike slip, normal and thrust is a genetic one that reflects the nature of the stresses which created them. The relationships may be inferredfrom what has been said in the previous section, and are shown in Figure 4.19.
Faults can be recognised from their effects on the pattern of outcrops. Dip faults and oblique faults truncate and displace the outcrops (Fig. 4.21b). Strike faults (Fig. 4.21a) produce a repetition of the succession of strata (but unlike a fold, repetition is in the sameorder) if the downthrow across the fault is in the opposite direction from the dip of thestrata; they produce an omission of part of the normal succession of strata (which do notcrop out because of the fault) if the downthrow is in the same direction as the dip.
4.4.6 Joints
The presence and orientation of joints have significant effects on the bulk properties ofrocks, and their description (Appendix H) is an important stage in most siteinvestigations. Joints may be non-systematic, but often occur as a set of parallel planes. If two or more sets are present, they form a system of joints (see Fig. 4.22). Prominent joints which are continuous as a single plane surface for hundreds of metres are calledmaster joints. Major joints cross only a few beds before dying out. Minor joints are confined to one layer. A classification of joint spacing is given in Appendix H. In foldedstrata, joints are described as longitudinal if their strike is parallel to the fold axes, andotherwise as cross or diagonal joints. Joints may be tensional fractures or small shears. Their mode of formation may be shown by the correlation of disrupted structures acrossthe joint, by slickensides or by crenulations on the joint surface. For example, plumosestructure (which resembles large feathers chiselled on the rock) indicates that it failed bysudden rupture, and also shows the direction in which the fracture spread. Differentgeological conditions produce different patterns of joints. It is not possible to predictfrom general theory the position of individual joints, or the precise degree ofdevelopment of any set in an unexplored site, but models of joint patterns and generalitiesabout their probable development are of use in guiding further exploration.
Distribution of rocks at and below the surface 129
www.angoothachaap.blogspot.com
www.angoothachaap.blogspot.com
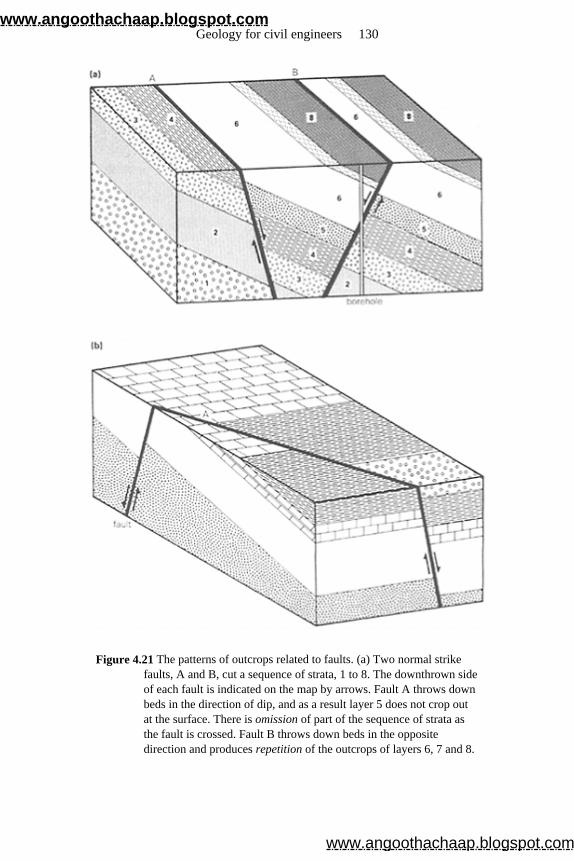
Figure 4.21 The patterns of outcrops related to faults. (a) Two normal strike faults, A and B, cut a sequence of strata, 1 to 8. The downthrown side of each fault is indicated on the map by arrows. Fault A throws down beds in the direction of dip, and as a result layer 5 does not crop out at the surface. There is omission of part of the sequence of strata as the fault is crossed. Fault B throws down beds in the opposite direction and produces repetition of the outcrops of layers 6, 7 and 8.
Geology for civil engineers 130
www.angoothachaap.blogspot.com
www.angoothachaap.blogspot.com
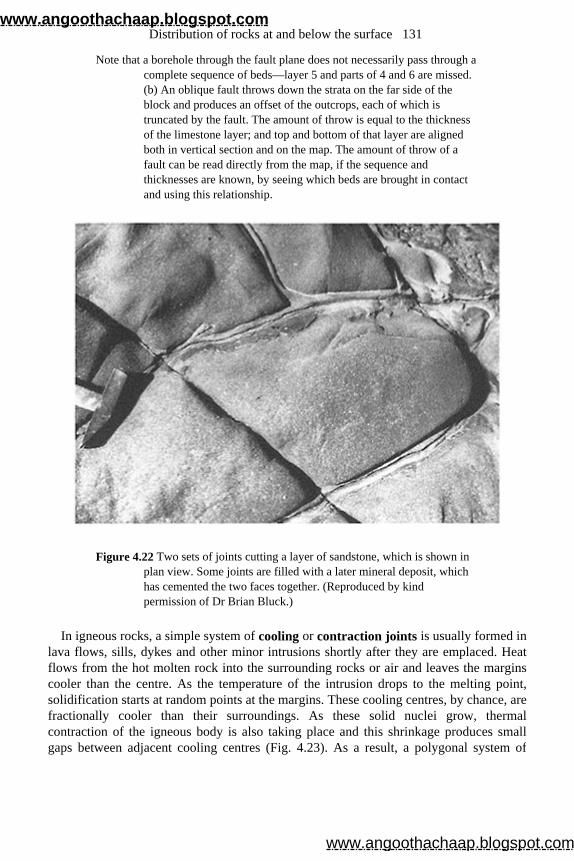
Note that a borehole through the fault plane does not necessarily pass through a complete sequence of beds—layer 5 and parts of 4 and 6 are missed. (b) An oblique fault throws down the strata on the far side of the block and produces an offset of the outcrops, each of which is truncated by the fault. The amount of throw is equal to the thickness of the limestone layer; and top and bottom of that layer are aligned both in vertical section and on the map. The amount of throw of a fault can be read directly from the map, if the sequence and thicknesses are known, by seeing which beds are brought in contact and using this relationship.
Figure 4.22 Two sets of joints cutting a layer of sandstone, which is shown in plan view. Some joints are filled with a later mineral deposit, which has cemented the two faces together. (Reproduced by kind permission of Dr Brian Bluck.)
In igneous rocks, a simple system of cooling or contraction joints is usually formed in lava flows, sills, dykes and other minor intrusions shortly after they are emplaced. Heatflows from the hot molten rock into the surrounding rocks or air and leaves the marginscooler than the centre. As the temperature of the intrusion drops to the melting point,solidification starts at random points at the margins. These cooling centres, by chance, arefractionally cooler than their surroundings. As these solid nuclei grow, thermalcontraction of the igneous body is also taking place and this shrinkage produces smallgaps between adjacent cooling centres (Fig. 4.23). As a result, a polygonal system of
Distribution of rocks at and below the surface 131
www.angoothachaap.blogspot.com
www.angoothachaap.blogspot.com
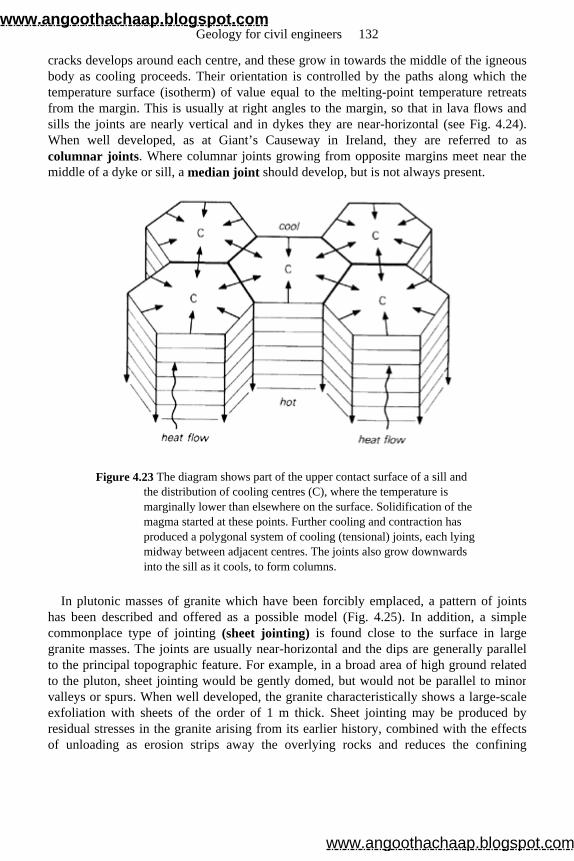
cracks develops around each centre, and these grow in towards the middle of the igneousbody as cooling proceeds. Their orientation is controlled by the paths along which thetemperature surface (isotherm) of value equal to the melting-point temperature retreats from the margin. This is usually at right angles to the margin, so that in lava flows andsills the joints are nearly vertical and in dykes they are near-horizontal (see Fig. 4.24). When well developed, as at Giant’s Causeway in Ireland, they are referred to ascolumnar joints. Where columnar joints growing from opposite margins meet near the middle of a dyke or sill, a median joint should develop, but is not always present.
Figure 4.23 The diagram shows part of the upper contact surface of a sill and the distribution of cooling centres (C), where the temperature is marginally lower than elsewhere on the surface. Solidification of the magma started at these points. Further cooling and contraction has produced a polygonal system of cooling (tensional) joints, each lying midway between adjacent centres. The joints also grow downwards into the sill as it cools, to form columns.
In plutonic masses of granite which have been forcibly emplaced, a pattern of joints has been described and offered as a possible model (Fig. 4.25). In addition, a simple commonplace type of jointing (sheet jointing) is found close to the surface in large granite masses. The joints are usually near-horizontal and the dips are generally parallel to the principal topographic feature. For example, in a broad area of high ground relatedto the pluton, sheet jointing would be gently domed, but would not be parallel to minorvalleys or spurs. When well developed, the granite characteristically shows a large-scale exfoliation with sheets of the order of 1 m thick. Sheet jointing may be produced byresidual stresses in the granite arising from its earlier history, combined with the effectsof unloading as erosion strips away the overlying rocks and reduces the confining
Geology for civil engineers 132
www.angoothachaap.blogspot.com
www.angoothachaap.blogspot.com

pressure.
Figure 4.24 Regular columnar jointing in a lava flow on the island of Staffa, Scotland. The jointing in the top flow is irregular, inferentially because of a peculiar pattern of cooling. (British Geological Survey photograph, D2218, published by permission of the Director; NERC copyright.)
In sedimentary strata, a joint system may be present over a wide region and be related in whole, or in part, to the same stresses that produced folds and faults in the same rocks.Other mechanisms which can create regional joint sets are the very minor, but daily,distortion of the solid Earth by tidal stresses, and the relief of pressure produced as theload of overburden is stripped away by erosion. The frequency of joints in a layer isrelated to the rock type and the thickness. In general, the space between joints is less inbrittle rocks with good elastic properties, and increases in proportion to the thickness. Athin layer of crystalline limestone is usually well jointed. Joint frequency appears also tobe increased by weathering, so that joints are more pronounced at the surface thanunderground.
In addition to any regional joint system, there are likely to be local concentrations of radiating tensional cracks caused by stretching at the hinges of folds, and formed close tofault zones as minor shears associated with the fault movements (Fig. 4.26).
Distribution of rocks at and below the surface 133
www.angoothachaap.blogspot.com
www.angoothachaap.blogspot.com
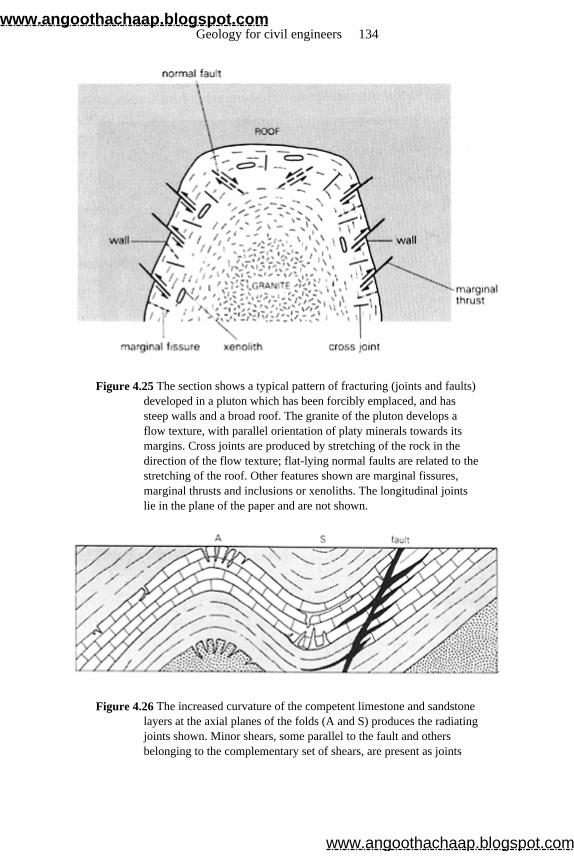
Figure 4.25 The section shows a typical pattern of fracturing (joints and faults) developed in a pluton which has been forcibly emplaced, and has steep walls and a broad roof. The granite of the pluton develops a flow texture, with parallel orientation of platy minerals towards its margins. Cross joints are produced by stretching of the rock in the direction of the flow texture; flat-lying normal faults are related to the stretching of the roof. Other features shown are marginal fissures, marginal thrusts and inclusions or xenoliths. The longitudinal joints lie in the plane of the paper and are not shown.
Figure 4.26 The increased curvature of the competent limestone and sandstone layers at the axial planes of the folds (A and S) produces the radiating joints shown. Minor shears, some parallel to the fault and others belonging to the complementary set of shears, are present as joints
Geology for civil engineers 134
www.angoothachaap.blogspot.com
www.angoothachaap.blogspot.com
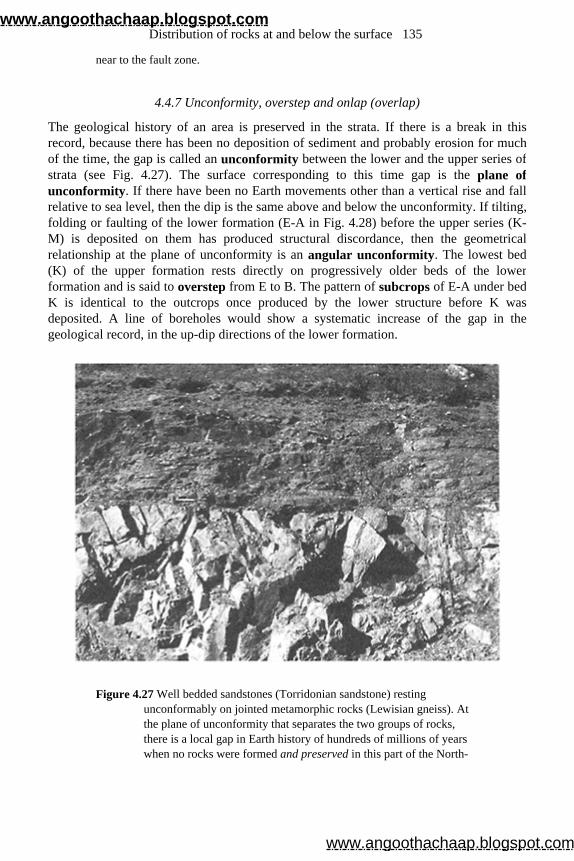
near to the fault zone.
4.4.7 Unconformity, overstep and onlap (overlap)
The geological history of an area is preserved in the strata. If there is a break in thisrecord, because there has been no deposition of sediment and probably erosion for muchof the time, the gap is called an unconformity between the lower and the upper series ofstrata (see Fig. 4.27). The surface corresponding to this time gap is the plane of unconformity. If there have been no Earth movements other than a vertical rise and fall relative to sea level, then the dip is the same above and below the unconformity. If tilting,folding or faulting of the lower formation (E-A in Fig. 4.28) before the upper series (K-M) is deposited on them has produced structural discordance, then the geometricalrelationship at the plane of unconformity is an angular unconformity. The lowest bed (K) of the upper formation rests directly on progressively older beds of the lowerformation and is said to overstep from E to B. The pattern of subcrops of E-A under bed K is identical to the outcrops once produced by the lower structure before K wasdeposited. A line of boreholes would show a systematic increase of the gap in thegeological record, in the up-dip directions of the lower formation.
Figure 4.27 Well bedded sandstones (Torridonian sandstone) resting unconformably on jointed metamorphic rocks (Lewisian gneiss). At the plane of unconformity that separates the two groups of rocks, there is a local gap in Earth history of hundreds of millions of years when no rocks were formed and preserved in this part of the North-
Distribution of rocks at and below the surface 135
www.angoothachaap.blogspot.com
www.angoothachaap.blogspot.com

west Highlands of Scotland. Note the slight overlap of the sandstone. (Reproduced by kind permission of Prof. Donald Bowes.)
If subsidence has increased the area of deposition of the upper formation, then in the fringe of the area, where bed K was not deposited, bed L rests directly on the olderformation E-A, and is said to onlap or overlap K (Fig. 4.28). Onlap is always accompanied by overstep. The variable gap (with respect to the fullest sequence of stratafor the area) at the unconformity is a combination of the absence of the top beds of thelower formation because of overstep and the absence of the bottom beds of the upperformation because of onlap.
4.5 Plate tectonics and seismicity
4.5.1 Earth’s layers and plates
Seismic studies have shown that the Earth is comprised of three main concentric layers(Fig. 4.29):
(1) An outer crust, ranging in thickness from 5 to 10 km beneath the oceans and more than 40 km beneath the continents.
(2) The mantle, 2900 km thick, which is separated from the crust by the Mohorovičić discontinuity (called Moho or M discontinuity). The mantle contains several layers.
(3) The core is separated from the mantle by the Gutenberg discontinuity, and is also layered with an inner and outer core, the whole core being about 3500 km in thickness (Fig. 4.29).
The crust, mantle and core and any internal layers they may possess are distinguishedfrom each other by their different seismic velocities.
Concentric layering in the Earth can be defined using another set of terms based onstrength and viscosity. Again there are three layers or shells:
(1) The lithosphere is the outermost shell and is about 100 km thick (thus incorporating the crust and uppermost mantle). It can support large surface loads, like volcanoes, without yielding and is therefore rigid.
(2) The asthenosphere underlies the lithosphere and is 700 km thick. It is at a high temperature (near its melting point), has little strength, and can flow when stress is applied over a period of time. The upper asthenosphere is the zone where magma is generated.
(3) The innermost shell is the mesosphere, which is by far the thickest, including most of the mantle and extending to the core. It is more rigid than the asthenosphere and more viscous than the lithosphere.
Geology for civil engineers 136
www.angoothachaap.blogspot.com
www.angoothachaap.blogspot.com
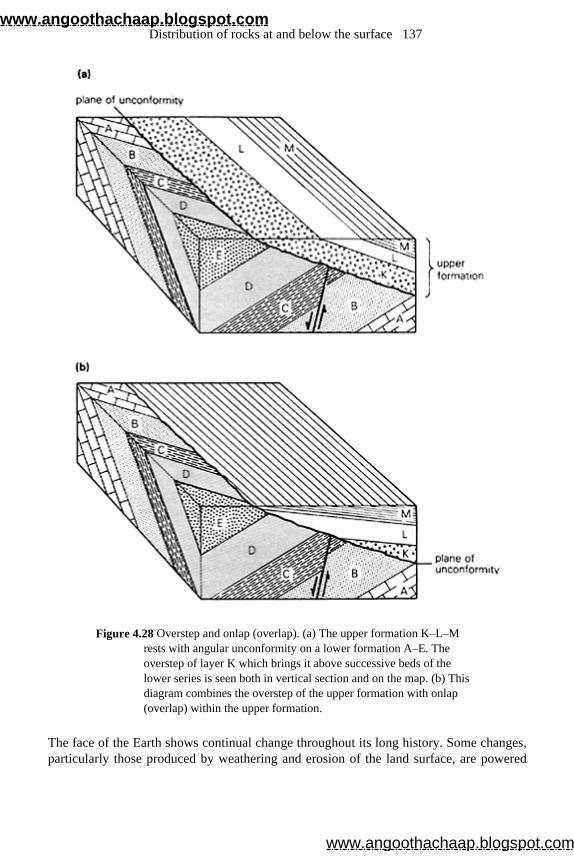
Figure 4.28 Overstep and onlap (overlap). (a) The upper formation K–L–M rests with angular unconformity on a lower formation A–E. The overstep of layer K which brings it above successive beds of the lower series is seen both in vertical section and on the map. (b) This diagram combines the overstep of the upper formation with onlap (overlap) within the upper formation.
The face of the Earth shows continual change throughout its long history. Some changes,particularly those produced by weathering and erosion of the land surface, are powered
Distribution of rocks at and below the surface 137
www.angoothachaap.blogspot.com
www.angoothachaap.blogspot.com
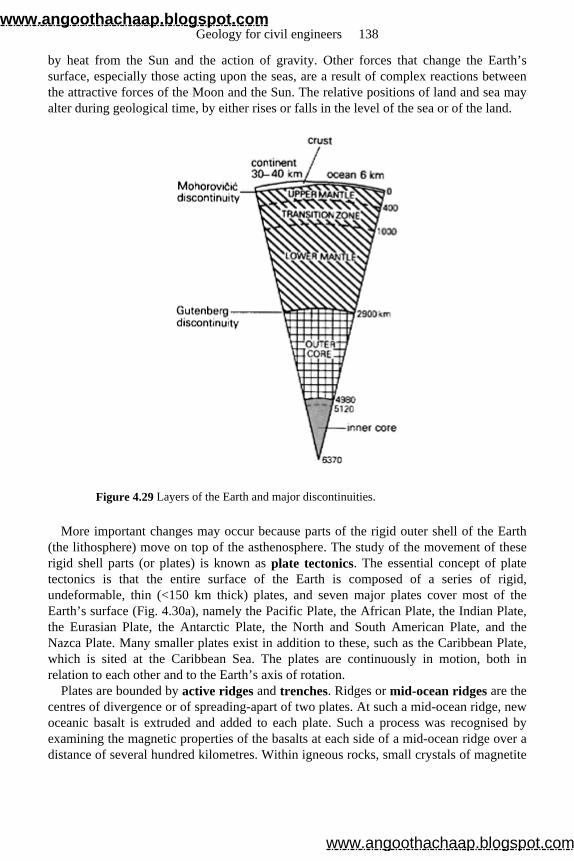
by heat from the Sun and the action of gravity. Other forces that change the Earth’s surface, especially those acting upon the seas, are a result of complex reactions betweenthe attractive forces of the Moon and the Sun. The relative positions of land and sea mayalter during geological time, by either rises or falls in the level of the sea or of the land.
Figure 4.29 Layers of the Earth and major discontinuities.
More important changes may occur because parts of the rigid outer shell of the Earth(the lithosphere) move on top of the asthenosphere. The study of the movement of theserigid shell parts (or plates) is known as plate tectonics. The essential concept of plate tectonics is that the entire surface of the Earth is composed of a series of rigid,undeformable, thin (<150 km thick) plates, and seven major plates cover most of theEarth’s surface (Fig. 4.30a), namely the Pacific Plate, the African Plate, the Indian Plate, the Eurasian Plate, the Antarctic Plate, the North and South American Plate, and theNazca Plate. Many smaller plates exist in addition to these, such as the Caribbean Plate,which is sited at the Caribbean Sea. The plates are continuously in motion, both inrelation to each other and to the Earth’s axis of rotation.
Plates are bounded by active ridges and trenches. Ridges or mid-ocean ridges are the centres of divergence or of spreading-apart of two plates. At such a mid-ocean ridge, new oceanic basalt is extruded and added to each plate. Such a process was recognised byexamining the magnetic properties of the basalts at each side of a mid-ocean ridge over a distance of several hundred kilometres. Within igneous rocks, small crystals of magnetite
Geology for civil engineers 138
www.angoothachaap.blogspot.com
www.angoothachaap.blogspot.com
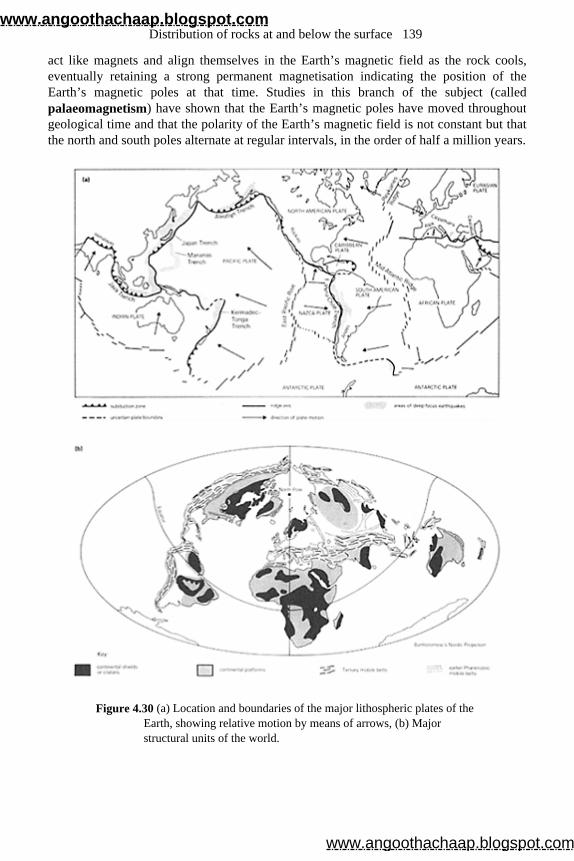
act like magnets and align themselves in the Earth’s magnetic field as the rock cools, eventually retaining a strong permanent magnetisation indicating the position of theEarth’s magnetic poles at that time. Studies in this branch of the subject (called palaeomagnetism) have shown that the Earth’s magnetic poles have moved throughoutgeological time and that the polarity of the Earth’s magnetic field is not constant but that the north and south poles alternate at regular intervals, in the order of half a million years.
Figure 4.30 (a) Location and boundaries of the major lithospheric plates of the Earth, showing relative motion by means of arrows, (b) Major structural units of the world.
Distribution of rocks at and below the surface 139
www.angoothachaap.blogspot.com
www.angoothachaap.blogspot.com
That is, at regular intervals, the Earth’s magnetism is reversed. These changes in polarity can be recognised in the ocean basalts forming at mid-ocean
ridges. When several hundred kilometres of basalt (ocean-floor basalt) were examined at each side of a mid-ocean ridge, it was found that the basalts showed linear magneticanomalies, with stripes of alternating normal and reversed magnetism, and that the mid-ocean ridge acted as a mirror plane, the magnetically striped basalts on one side of theridge being the mirror images of those on the other side of the ridge (see Fig. 4.31).
These mid-ocean ridges are rarely continuous, but have a stepped appearance owing totransverse fractures or transform faults affecting the plates. No plate is destroyed ornew material added along these fracture zones.
Trenches occur where the plates converge and one plate is thrust under the other, being ‘consumed’ at such a boundary. Plate boundaries at trenches are usually curved, the convex side pointing towards the plate being consumed. Trenches indicate destructive plate margins, like the Kermadec-Tonga Trench and the Peru-Chile Trench (Fig. 4.30a).
The underthrust plate is destroyed (consumed) in a subduction zone, which lies on the concave side of ocean trenches, and the plate is destroyed at the same rate as newmaterial is added to it at a mid-ocean ridge. Because plates are poor conductors of heat, they must descend several hundred kilometres into the mantle before being consumed(Fig. 4.31).
As two plates collide along a destructive plate margin, island arcs, such as the East Indies may form on the surface, or great mountain ranges, such as the Andes orHimalayas, may form in the upper crust.
The global distribution patterns of earthquakes and their depths of origin were knownbefore ideas on plate tectonics were formulated. Earthquake activity patterns weredetermined by seismology studies, and major earthquake zones were identified aroundthe Pacific Ocean, along the Alpine-Himalayan belt, on mid-ocean ridges, at trenches and in young fold mountain belts. A seismicity map for the Earth in the 1960s is shown inFigure 4.32, which demonstrates that seismicity is concentrated along plate boundaries(compare with Fig. 4.30a). Seismic activity is of two types: shallow and deep earthquakes. The former are concentrated at ocean ridges and transform faults, and occurat depths of less than 30 km. Deep earthquakes occur in zones beneath the oceanictrenches, with the foci (see next section) located at varying depths along the subductionzone, which extends downwards to depths of more than 250 km. The deepest earthquakeshave been recorded from active island-arc systems.
Geology for civil engineers 140
www.angoothachaap.blogspot.com
www.angoothachaap.blogspot.com
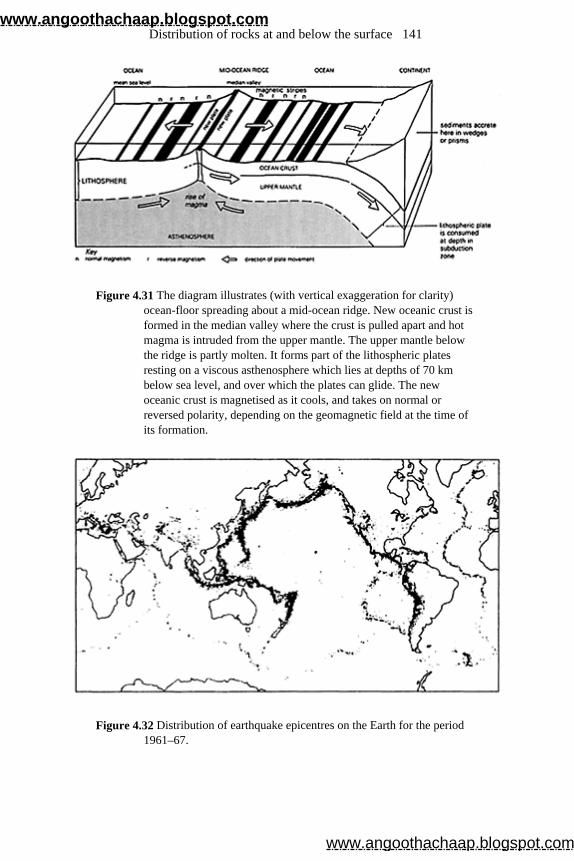
Figure 4.31 The diagram illustrates (with vertical exaggeration for clarity) ocean-floor spreading about a mid-ocean ridge. New oceanic crust is formed in the median valley where the crust is pulled apart and hot magma is intruded from the upper mantle. The upper mantle below the ridge is partly molten. It forms part of the lithospheric plates resting on a viscous asthenosphere which lies at depths of 70 km below sea level, and over which the plates can glide. The new oceanic crust is magnetised as it cools, and takes on normal or reversed polarity, depending on the geomagnetic field at the time of its formation.
Figure 4.32 Distribution of earthquake epicentres on the Earth for the period 1961–67.
Distribution of rocks at and below the surface 141
www.angoothachaap.blogspot.com
www.angoothachaap.blogspot.com
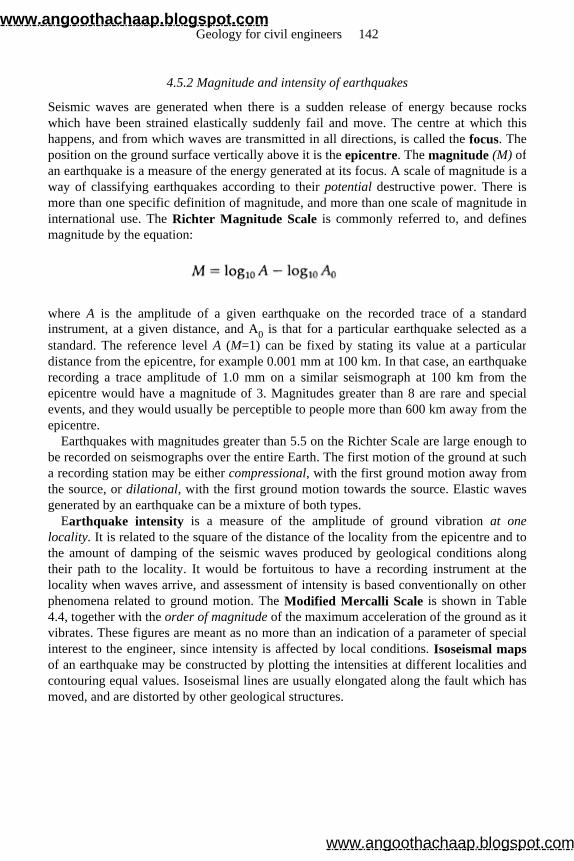
4.5.2 Magnitude and intensity of earthquakes
Seismic waves are generated when there is a sudden release of energy because rockswhich have been strained elastically suddenly fail and move. The centre at which thishappens, and from which waves are transmitted in all directions, is called the focus. The position on the ground surface vertically above it is the epicentre. The magnitude (M) of an earthquake is a measure of the energy generated at its focus. A scale of magnitude is away of classifying earthquakes according to their potential destructive power. There is more than one specific definition of magnitude, and more than one scale of magnitude ininternational use. The Richter Magnitude Scale is commonly referred to, and definesmagnitude by the equation:
where A is the amplitude of a given earthquake on the recorded trace of a standard instrument, at a given distance, and A0 is that for a particular earthquake selected as a standard. The reference level A (M=1) can be fixed by stating its value at a particular distance from the epicentre, for example 0.001 mm at 100 km. In that case, an earthquakerecording a trace amplitude of 1.0 mm on a similar seismograph at 100 km from theepicentre would have a magnitude of 3. Magnitudes greater than 8 are rare and specialevents, and they would usually be perceptible to people more than 600 km away from theepicentre.
Earthquakes with magnitudes greater than 5.5 on the Richter Scale are large enough to be recorded on seismographs over the entire Earth. The first motion of the ground at sucha recording station may be either compressional, with the first ground motion away fromthe source, or dilational, with the first ground motion towards the source. Elastic wavesgenerated by an earthquake can be a mixture of both types.
Earthquake intensity is a measure of the amplitude of ground vibration at one locality. It is related to the square of the distance of the locality from the epicentre and to the amount of damping of the seismic waves produced by geological conditions alongtheir path to the locality. It would be fortuitous to have a recording instrument at thelocality when waves arrive, and assessment of intensity is based conventionally on otherphenomena related to ground motion. The Modified Mercalli Scale is shown in Table 4.4, together with the order of magnitude of the maximum acceleration of the ground as it vibrates. These figures are meant as no more than an indication of a parameter of specialinterest to the engineer, since intensity is affected by local conditions. Isoseismal maps of an earthquake may be constructed by plotting the intensities at different localities andcontouring equal values. Isoseismal lines are usually elongated along the fault which hasmoved, and are distorted by other geological structures.
Geology for civil engineers 142
www.angoothachaap.blogspot.com
www.angoothachaap.blogspot.com
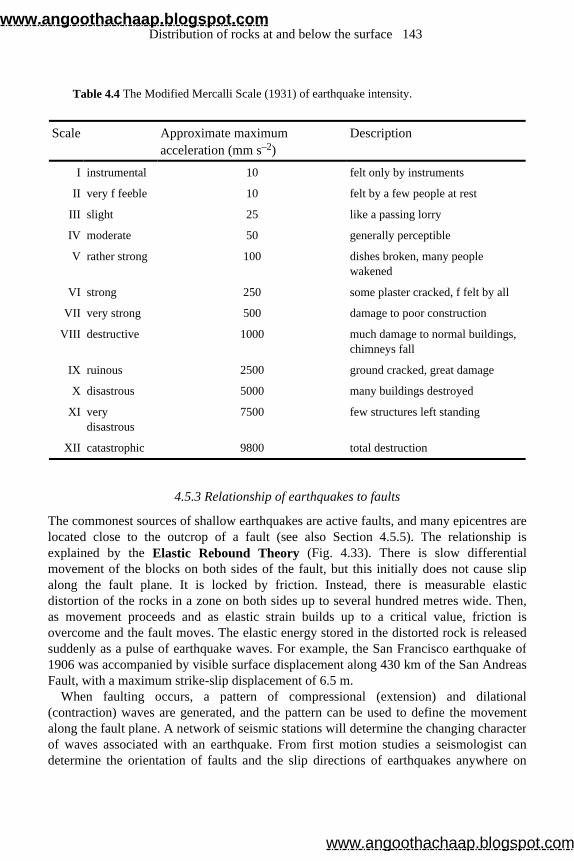
4.5.3 Relationship of earthquakes to faults
The commonest sources of shallow earthquakes are active faults, and many epicentres arelocated close to the outcrop of a fault (see also Section 4.5.5). The relationship is explained by the Elastic Rebound Theory (Fig. 4.33). There is slow differential movement of the blocks on both sides of the fault, but this initially does not cause slipalong the fault plane. It is locked by friction. Instead, there is measurable elasticdistortion of the rocks in a zone on both sides up to several hundred metres wide. Then,as movement proceeds and as elastic strain builds up to a critical value, friction isovercome and the fault moves. The elastic energy stored in the distorted rock is releasedsuddenly as a pulse of earthquake waves. For example, the San Francisco earthquake of1906 was accompanied by visible surface displacement along 430 km of the San AndreasFault, with a maximum strike-slip displacement of 6.5 m.
When faulting occurs, a pattern of compressional (extension) and dilational(contraction) waves are generated, and the pattern can be used to define the movementalong the fault plane. A network of seismic stations will determine the changing characterof waves associated with an earthquake. From first motion studies a seismologist candetermine the orientation of faults and the slip directions of earthquakes anywhere on
Table 4.4 The Modified Mercalli Scale (1931) of earthquake intensity.
Scale Approximate maximum acceleration (mm s–2)
Description
I instrumental 10 felt only by instruments
II very f feeble 10 felt by a few people at rest
III slight 25 like a passing lorry
IV moderate 50 generally perceptible
V rather strong 100 dishes broken, many people wakened
VI strong 250 some plaster cracked, f felt by all
VII very strong 500 damage to poor construction
VIII destructive 1000 much damage to normal buildings, chimneys fall
IX ruinous 2500 ground cracked, great damage
X disastrous 5000 many buildings destroyed
XI very disastrous
7500 few structures left standing
XII catastrophic 9800 total destruction
Distribution of rocks at and below the surface 143
www.angoothachaap.blogspot.com
www.angoothachaap.blogspot.com
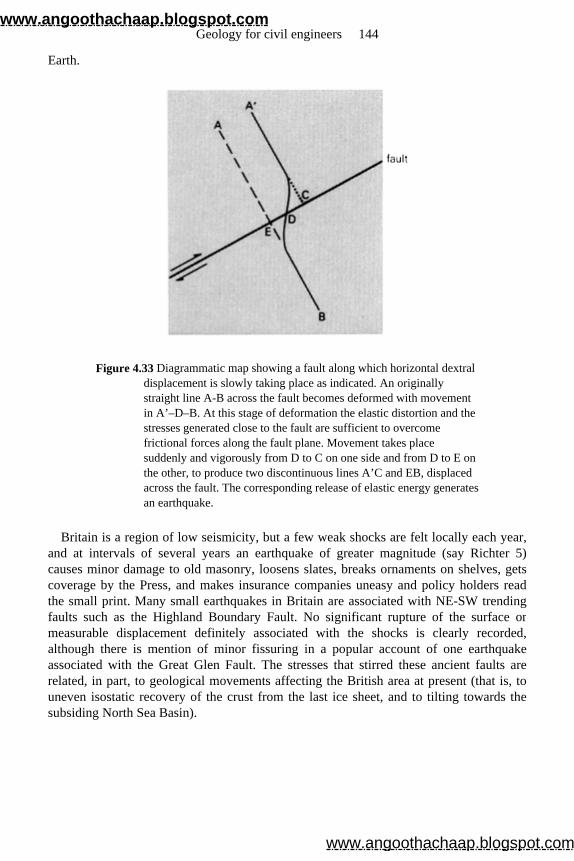
Earth.
Figure 4.33 Diagrammatic map showing a fault along which horizontal dextral displacement is slowly taking place as indicated. An originally straight line A-B across the fault becomes deformed with movement in A’–D–B. At this stage of deformation the elastic distortion and the stresses generated close to the fault are sufficient to overcome frictional forces along the fault plane. Movement takes place suddenly and vigorously from D to C on one side and from D to E on the other, to produce two discontinuous lines A’C and EB, displaced across the fault. The corresponding release of elastic energy generates an earthquake.
Britain is a region of low seismicity, but a few weak shocks are felt locally each year,and at intervals of several years an earthquake of greater magnitude (say Richter 5)causes minor damage to old masonry, loosens slates, breaks ornaments on shelves, getscoverage by the Press, and makes insurance companies uneasy and policy holders readthe small print. Many small earthquakes in Britain are associated with NE-SW trending faults such as the Highland Boundary Fault. No significant rupture of the surface ormeasurable displacement definitely associated with the shocks is clearly recorded,although there is mention of minor fissuring in a popular account of one earthquakeassociated with the Great Glen Fault. The stresses that stirred these ancient faults arerelated, in part, to geological movements affecting the British area at present (that is, touneven isostatic recovery of the crust from the last ice sheet, and to tilting towards thesubsiding North Sea Basin).
Geology for civil engineers 144
www.angoothachaap.blogspot.com
www.angoothachaap.blogspot.com
4.5.4 Prediction of earthquakes
Prediction of seismic risk can be assessed from general theory and from past records ofan area. It is used for planning and for laying down building codes. Prediction of aspecific, destructive earthquake is of greatest value only if it allows evacuation of athreatened city and deployment of emergency services a few days before the event.Prediction approaching this accuracy has been achieved in a few cases since 1973, andthe Chinese claim to have successfully evacuated one of their towns in 1975. As elasticstrain builds up within rocks close to the focus, over periods as long as decades, minutecracks in the rocks (microfractures) open and affect their physical properties. This dilatancy of the rocks increases their volume, and results in minor tilting of the groundsurface from the active fault. Small quantities of the gas radon, trapped in some rocks, arereleased and can be detected by analysis of well water. The velocity of seismic waves(Section 6.3.2) changes, and V p /V s decreases by about 20%. This change can be monitored by local seismic surveys at daily intervals. A day or two before the earthquake,the seismic velocities revert to normal as water seeps into the microfractures. The fluidpressure within the voids of the rock (pore pressure) is increased, and by reducing effective pressures allows movement along the fault to take place.
The relationship between pore pressure and earthquakes was first observed when disposal of fluid toxic waste down a deep boring which traversed an active faultaccidentally triggered off weak shocks. Control of the potentially destructive SanAndreas Fault in California has been proposed by using this triggering mechanism torelease as a series of weak, predictable shocks the enormous elastic strain energy that isalready stored. Each stage of the programme would require three boreholes, each about 5km deep and spaced 0.5 km apart along a segment of the fault. Water would be pumpedfrom the outer holes to lock these points on the fault, and would then be injected into themiddle hole to reduce friction across the fault plane to give a controlled tremor. Thiswould be repeated along the the entire fault. The scheme would cost thousands ofmillions of dollars for 500 boreholes, plus a less predictable amount in subsequent civildamages suits. As in many imaginative engineering projects, there are politicaldifficulties as well as economic ones.
4.5.5 Seismic risk and problems for the engineer
An earthquake may be of very small magnitude and only detectable by instruments, butmay be powerful enough to cause annoyance or alarm to people and to damage buildings.Seismic risk from ground movements must be foreseen, understood and dealt with inplanning and design. Regions of high seismicity (see Section 4.5.1) are often covered by building laws specified in terms of earthquake parameters, and even in countries of lowseismicity, such as Britain, the probability of an earthquake of given power occurringwithin so many years must be considered in siting potentially dangerous structures likenuclear power generating stations.
Information about seismicity and seismic risk is obtainable by referring to the Global
Distribution of rocks at and below the surface 145
www.angoothachaap.blogspot.com
www.angoothachaap.blogspot.com
Seismology Unit of the BGS (Appendix C) in Edinburgh. A catalogue of earthquakes thathave been recorded over the previous year is produced by the International SeismologicalCentre, Newbury, Berkshire. Older catalogues based on questionnaires to the local publicand on historical records have been produced by individuals. The historical records havesometimes needed interpretation. For example, the area affected by one earthquake inScotland at the beginning of the 17th century can be surmised from the records ofAberdeen. The town council decided to enforce a ban on playing golf on the Sabbathshortly after the shock!
Seismic activity must be considered when certain engineering structures, particularly dams, are designed. Dams in earthquake zones will be designed with a capacity forresistance to the dynamic forces that can be applied during an earthquake. Beforeconstruction begins, past seismological records of the dam site or nearby areas should bechecked and major fault lines located. An instrumentation programme should be initiatedon the actual site as soon as its location has been determined, particularly with regard tolong-term seismic monitoring. The type of ground movements likely to occur should bepredicted, and whether any earthquakes that may occur are likely to be of shallow depth,such as by slip along a fault plane, or of deep focus. Structural damage is likely to resultfrom ground displacement, acceleration at low seismic frequencies and velocity fromblast vibrations. Ambraseys and Sarma (1967) considered many of these factors in damdesign. Earthquakes may cause damage in unconsolidated deposits. Filled ground mayconsolidate drastically, and studies have been made about the possibility of liquefaction development, either in the saturated fill material of an earth dam or rockfill dam or in thefoundation material.
Earth or rockfill dams may fail in several ways during an earthquake. Circular shear failure or rotational failure of the embankment, and planar base failure along theembankment-foundation interface (see Sec tion 8.1.3) are the three main types. Concrete dams may be subjected to failure by either the second or third of these modes.
Other important sources of small local tremors are created by human agency. Theimpounding of great masses of water in very large reservoirs may result in uneven andspasmodic settlement under the new load. More importantly, the extraction of coal causescollapse of the strata above the seam into the abandoned workings, and often producessmall seismic foci. Instead of broad gentle subsidence, slippage may occur locally along afault, with each jerky movement producing a small shock. Contemporaneously, rock bursts may explode from any massive rocks in the passageways as they collapse, with each burst acting as the focus of a minor shock. There is disagreement on the details ofthe mechanism linking seismicity with abandoned workings, and thus about the legalliability for damages associated with them in particular cases, although a generalcorrelation has been demonstrated in more than one area.
Geology for civil engineers 146
www.angoothachaap.blogspot.com
www.angoothachaap.blogspot.com
4.6 The continental crust
4.6.1 Major crustal features
The continental crust consists of rocks formed at various times throughout the entirehistory of the Earth. These rocks can be divided into three main groups (Fig. 4.30b):
(a) continental shields or cratons of Precambrian age including igneous and high-grade metamorphic rocks;
(b) continental platforms, where a cover of younger sedimentary or metamorphosed sedimentary rocks overlies Precambrian basement;
(c) younger fold mountain belts (mobile belts) of several ages (of which Tertiary belts are most strongly defined). These mobile belts contain rocks of different ages, including younger igneous rocks. The position of these mobile belts should be compared with the plate margins in Fig. 4.30a.
4.6.2 The rocks of Britain
A brief general account of some of the rocks of Britain is given here to put somedescriptive flesh on the bare bones of the general concepts of stratigraphy and structure.It should be read as a description of some stratigraphic models rather than as an accountof local rocks and regional stratigraphy.
PRECAMBRIAN AND LOWER PALAEOZOIC ROCKS OF BRITAIN
Precambrian rocks crop out over most of the Scottish Highlands, in North and SouthWales and in the Welsh Borders, and they are present at depth everywhere. For example,in the North-west Highlands, several hundred metres of Cambrian quartzite and limestone rest directly on two major groups of rocks, the Torridonian sandstone and the Lewisiangneiss (Fig. 4.34), both of which inferentially must be Precambrian. The Lewisian gneiss consists of a variety of metamorphic rocks, some of which are altered sediments andothers altered igneous rocks. The commonest rock types are hornblende-gneiss, granulite and granite. They are cut by dykes and by broad shear zones where the rocks have beenaltered and weakened. The events stamped on these rocks include recrystallisation underchanged temperature and pressure, intrusion of dykes and episodes of stress. That is tosay, they preserve a history largely of happenings at depths of kilometres below thesurface, rather than in the environments at the surface. The presence of metamorphicquartzite and marble (that is, altered sedimentary rocks) does, however, indicate that
Distribution of rocks at and below the surface 147
www.angoothachaap.blogspot.com
www.angoothachaap.blogspot.com
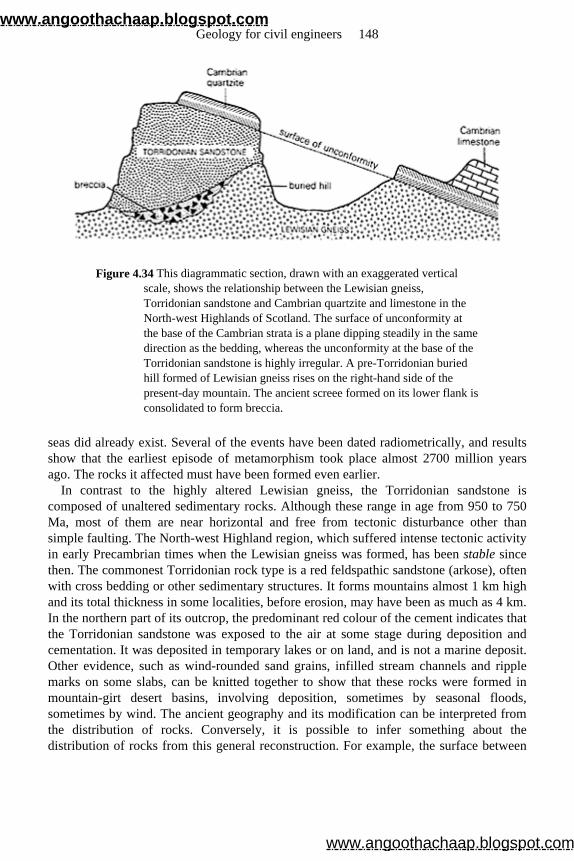
Figure 4.34 This diagrammatic section, drawn with an exaggerated vertical scale, shows the relationship between the Lewisian gneiss, Torridonian sandstone and Cambrian quartzite and limestone in the North-west Highlands of Scotland. The surface of unconformity at the base of the Cambrian strata is a plane dipping steadily in the same direction as the bedding, whereas the unconformity at the base of the Torridonian sandstone is highly irregular. A pre-Torridonian buried hill formed of Lewisian gneiss rises on the right-hand side of the present-day mountain. The ancient screee formed on its lower flank is consolidated to form breccia.
seas did already exist. Several of the events have been dated radiometrically, and resultsshow that the earliest episode of metamorphism took place almost 2700 million yearsago. The rocks it affected must have been formed even earlier.
In contrast to the highly altered Lewisian gneiss, the Torridonian sandstone is composed of unaltered sedimentary rocks. Although these range in age from 950 to 750Ma, most of them are near horizontal and free from tectonic disturbance other thansimple faulting. The North-west Highland region, which suffered intense tectonic activityin early Precambrian times when the Lewisian gneiss was formed, has been stable since then. The commonest Torridonian rock type is a red feldspathic sandstone (arkose), oftenwith cross bedding or other sedimentary structures. It forms mountains almost 1 km highand its total thickness in some localities, before erosion, may have been as much as 4 km.In the northern part of its outcrop, the predominant red colour of the cement indicates thatthe Torridonian sandstone was exposed to the air at some stage during deposition andcementation. It was deposited in temporary lakes or on land, and is not a marine deposit.Other evidence, such as wind-rounded sand grains, infilled stream channels and ripplemarks on some slabs, can be knitted together to show that these rocks were formed inmountain-girt desert basins, involving deposition, sometimes by seasonal floods, sometimes by wind. The ancient geography and its modification can be interpreted fromthe distribution of rocks. Conversely, it is possible to infer something about thedistribution of rocks from this general reconstruction. For example, the surface between
Geology for civil engineers 148
www.angoothachaap.blogspot.com
www.angoothachaap.blogspot.com
the Torridonian sandstone and the Lewisian gneiss is highly irregular, and it rises andfalls in altitude by up to 600 m, although the Torridonian sandstone layer is nearhorizontal. The Torridonian sandstone was deposited on the ancient land surface formedof hills and valleys cut into the Lewisian gneiss in pre-Torridonian times. It was buried eventually as sediment and was banked progressively against these hillsides as the regionsubsided. Breccia consisting of angular fragments of gneiss in a sandy matrix occurs onthe lower slopes of these buried hills, and in the context of the stratigraphic model theyare interpreted as ancient scree slopes. Their distribution may be understood andtentatively predicted from this relationship if enough is known about the ancientgeography.
The inliers of Precambrian rocks in Wales and western England contain a variety of metamorphic rocks (for example, in Anglesey), great thicknesses of sandstones and otherterrigenous strata (for example, in the Long Mynd of Shropshire), and also thick piles ofacid volcanic rocks (most notably the Uriconian rocks of Shropshire). The Precambrianrocks of Shropshire are overlain by several hundred metres of coarse sandstones andother sedimentary rocks of Cambrian age. Like the Cambrian strata of the North-west Highlands, the Shropshire rocks are comparatively free of tectonic disturbance. In contrast, the Cambrian strata cropping out in the regions between, such as North Walesand the southern Scottish Highlands (Fig. 4.35), are much thicker and have been deformed by compressive stress. The Cambrian strata are a few kilometres thick in NorthWales.
The common rock types in these regions are turbidites (including greywacke), which consist of poorly sorted mixtures of clay, silt, sand and rock fragments. They are formedwhere unstable sediment is disturbed and flows down a slope on the sea floor as a thickmixture of sediment and water (slurry) before settling in deeper water. Similar changes ofthickness occur in other strata of Lower Palaeozoic age within a broad tract trending NE-SW across Britain between the stable areas of the North-west Highlands and Welsh Borders that form its margins. The traditional term used to describe such a major belt ofthick sediment is geosyncline. The sediments of the geosyncline have been stronglycompressed subsequently, as is shown by the intense crumpling and fracturing that theyhave suffered. It appears that the two stable margins have moved together to squeeze theintervening sedimentary pile. During the early depositional period and the later tectonicactivity, there are characteristic types of volcanicity. The emplacement of granitebatholiths and the metamorphism of some of the sediments at a late stage in the history ofthe belt are indicative of the rise of temperature within it. Active belts of this type, whichhave been or are being affected by tectonic activity and volcanicity, are referred to asmobile belts in contrast to stable regions (see Fig. 4.30b), such as the North-west Highlands since Torridonian times. A mobile belt often coincides with an earliergeosyncline, and in turn is often the site of a later mountain chain. The eroded roots ofhigh mountains which rose on the site of the Lower Palaeozoic mobile belt in Britain areexposed in Wales, the Lake District, the Southern Uplands and the Scottish Highlands.The sequence of events—geosyncline, compression, granite emplacement, and finally the formation of a mountain chain—used to be described as the mountain building (or orogenic) cycle. A fuller understanding of it has come with the theory of plate tectonics
Distribution of rocks at and below the surface 149
www.angoothachaap.blogspot.com
www.angoothachaap.blogspot.com
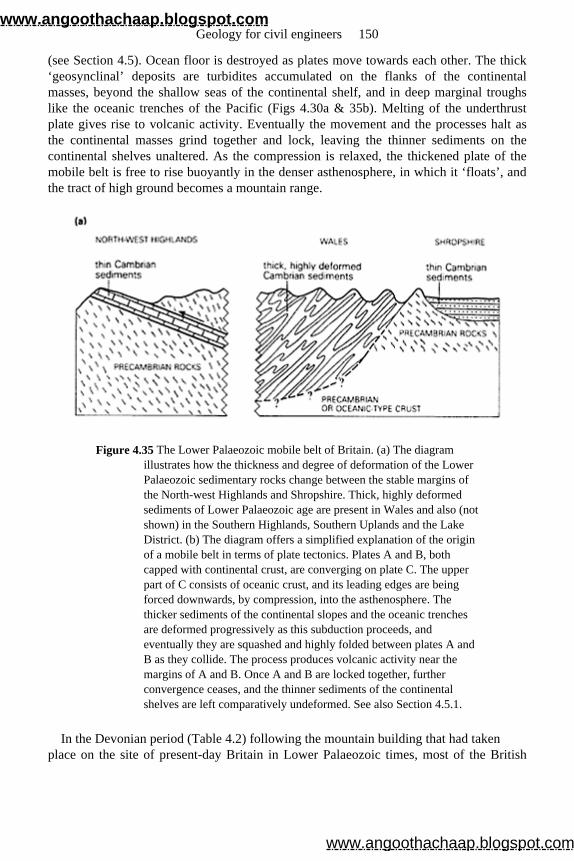
(see Section 4.5). Ocean floor is destroyed as plates move towards each other. The thick ‘geosynclinal’ deposits are turbidites accumulated on the flanks of the continentalmasses, beyond the shallow seas of the continental shelf, and in deep marginal troughslike the oceanic trenches of the Pacific (Figs 4.30a & 35b). Melting of the underthrust plate gives rise to volcanic activity. Eventually the movement and the processes halt asthe continental masses grind together and lock, leaving the thinner sediments on thecontinental shelves unaltered. As the compression is relaxed, the thickened plate of themobile belt is free to rise buoyantly in the denser asthenosphere, in which it ‘floats’, and the tract of high ground becomes a mountain range.
Figure 4.35 The Lower Palaeozoic mobile belt of Britain. (a) The diagram illustrates how the thickness and degree of deformation of the Lower Palaeozoic sedimentary rocks change between the stable margins of the North-west Highlands and Shropshire. Thick, highly deformed sediments of Lower Palaeozoic age are present in Wales and also (not shown) in the Southern Highlands, Southern Uplands and the Lake District. (b) The diagram offers a simplified explanation of the origin of a mobile belt in terms of plate tectonics. Plates A and B, both capped with continental crust, are converging on plate C. The upper part of C consists of oceanic crust, and its leading edges are being forced downwards, by compression, into the asthenosphere. The thicker sediments of the continental slopes and the oceanic trenches are deformed progressively as this subduction proceeds, and eventually they are squashed and highly folded between plates A and B as they collide. The process produces volcanic activity near the margins of A and B. Once A and B are locked together, further convergence ceases, and the thinner sediments of the continental shelves are left comparatively undeformed. See also Section 4.5.1.
In the Devonian period (Table 4.2) following the mountain building that had taken place on the site of present-day Britain in Lower Palaeozoic times, most of the British
Geology for civil engineers 150
www.angoothachaap.blogspot.com
www.angoothachaap.blogspot.com
area was raised above sea level. Continental conditions of sedimentary depositionexisted. The environments were similar to those in which the Torridonian sandstone waslaid down, and the Devonian rocks have many features in common with it. The mostobvious of these features is the prevalent red colour of the rocks, which is a result of theiron in them weathering in the presence of air to produce oxygen-rich oxides and hydroxides. These form the cement of the sandstones, which are the commonest rocktype. The sandstones, together with interbedded conglomerates and shales also ofDevonian age, are known collectively as the Old Red Sandstone.
CARBONIFEROUS ROCKS OF BRITAIN
Nearly all the coal mined in Britain comes from Carboniferous strata. They are also animportant source of other economic rocks, such as limestone and fireclay. The extractionof these rocks presents special problems for the engineer (Section 4.5.5). Such difficulties are often encountered, since most of the large industrial cities of northern Britain are sitedon Carboniferous outcrops.
At the beginning of the Carboniferous period, much of the British region was coveredby shallow seas, which tended to be deeper towards the south. Some areas, such as theHighlands, remained as dry land. Thick limestones were deposited over large areas ofEngland, but in the north the Lower Carboniferous succession also contains muchsandstone, shale and basaltic lavas. As the Carboniferous period progressed, there was anoverall shallowing of the area of deposition in Britain, until in Late Carboniferous timesnearly all the strata were non-marine. The waste from forests growing in coastal swampswas later altered to coal, and the seat earth on which the trees grew became fireclay or ganister. Long ribbons of sandstone that wind their way through the coal seams and interrupt their continuity mark the courses of streams that existed, and were infilled, atthat time.
A feature of Carboniferous rocks the world over is their frequent display of cyclic sedimentation, in which rocks of different types tend to occur repeatedly in a particularsequence throughout hundreds or even thousands of metres of succession. Knowledge ofthe sequence within one sedimentary cycle may be very useful in the early stages of siteexploration as a basis for prediction from fragmentary evidence. In coal-bearing formations, a typical complete cyclothem consists, from the bottom upwards, of (a) shale (occasionally with marine or brackish-water fossils), (b) sandstone, (c) shale, (d) seatearth, and (e) coal. This is overlain by another cyclothem of shale, etc. The sandstone andcoal are the units most likely to be missing, but no matter which unit is absent, the relative order is maintained. On average, cyclothems are between 6 and 10 m thick. Thereis considerable variation, depending mainly on the presence or absence of the sandstoneunit, which may be up to 30 m thick. The coals are not always of economic thickness andthey, like all units, may show considerable lateral variation. In some regions, marinelimestones may be present on top of the coal as a unit additional to those alreadydescribed.
More than one theory has been put forward to explain cyclic sedimentation. Coal-bearing cyclothems are thought to represent a normal sequence of events in a subsiding
Distribution of rocks at and below the surface 151
www.angoothachaap.blogspot.com
www.angoothachaap.blogspot.com
delta. Trees growing on the muds and sands of the delta died, and the debris from themwas covered by water and sediment. A change in the pattern of sedimentation brought anew influx of mud and sand to make the water sufficiently shallow for another, youngerforest to establish itself. This in turn was destroyed, eventually to become a coal seam, asthe subsidence continued.
MESOZOIC ROCKS OF BRITAIN
The Mesozoic era consists of three periods, the Triassic, the Jurassic and the Cretaceous.The rocks deposited in the British region during the first of these were laid down inenvironments broadly similar to those of the Torridonian sandstone, and they arepredominantly red in colour. Together with similar Permian rocks they form the New RedSandstone. The Jurassic rocks consist largely of fossil-bearing clays, sandstones and limestones, which were deposited in the shallow seas of the continental shelf. Thecommon rock types of Lower Cretaceous age are clays and sands, and the UpperCretaceous rocks consist largely of chalk, which forms the best known rock layer inBritain.
Mesozoic rocks crop out over most of eastern and southeastern England, but it is thepresence of thick Jurassic and Cretaceous strata at depth, under the northern North Seaand other areas of the continental shelf around Britain, that came to be of wider publicinterest in the 1970s. The decay of organic material (particularly dead marine plankton)buried within these rocks has produced petroleum. This mixture of oil and gas hasmigrated through pores in the rock and accumulated in oil traps where the geological structure prevented further movement (see Section 5.3.5). Natural gas may also be formed by itself (that is, as nearly pure methane), as in the southern North Sea, by thedegasification of coal. The effects of deep burial transform peat into bituminous coal andthen into anthracite, and result in the loss of natural gas from the seam. This may escapeto the surface, sometimes cratering the sea floor with large pock marks, or it may betrapped in underground reservoirs of permeable rock.
References and selected reading
Ambraseys, N.N. 1978. Middle East—a reappraisal of the seismicity. Q. J. Engng Geol . 11 , 19–32.
Ambraseys, N.N. and S.K.Sarma 1967. The response of earth dams to strong earthquakes. Geotechnique 17 , 181–213.
Attewell, P.B. and I.W.Farmer 1976. Principles of engineering geology . London: Chapman and Hall.
Billings, M.P. 1942. Structural geology . Englewood Cliffs, NJ: Prentice-Hall. Duvall, W.I. and D.E.Fogelson 1962. Review of criteria for estimating drainage to
residences from blasting vibrations. US Bur. Mines Rep. Invest. 5968. Geological Society of London 1972. The preparation of maps and plans in terms of
engineering geology—Engineering Group Working Party Report. Q. J. Engng Geol . 5 , 293–382.
Geology for civil engineers 152
www.angoothachaap.blogspot.com
www.angoothachaap.blogspot.com

Hills, E.S. 1972. Elements of structural geology , 2nd edn. London: Chapman and Hall. Kennett, J.P. 1982. Marine geology . Englewood Cliffs, NJ: Prentice-Hall. Lomnitz, C. and A.Rosenblueth (eds) 1976. Seismic risk and engineering decisions .
Amsterdam: Elsevier. Long, R.E. 1974. Seismicity investigations at dam sites. Engng Geol . 8 ,199–212. Oborn, L.E. 1974. Seismic phenomena and engineering geology. Proc. 2nd Int. Congr.
Int. Assoc. Engng Geol. 1 , Th II, GR1–41. Oxburgh, E.R. 1974. The plain man’s guide to plate tectonics. Proc. Geol. Assoc . 85 ,
299–357. Price, N.J. 1966. Fault and joint development in brittle and semi-brittle rock . Oxford:
Pergamon. Roberts, A. 1958. Geological structures and maps . London: Macmillan. Seed, H.B. and I.N. Idriss 1967. Analysis of soil liquefaction –Niigata earthquake. J. Soil
Mech. Found. Div. Am. Soc. Civ. Engrs 93 , SM3, 83–108.
Distribution of rocks at and below the surface 153
www.angoothachaap.blogspot.com
www.angoothachaap.blogspot.com
5 Subsurface (ground) water
5.1 Behaviour of water in rocks and soils
5.1.1 Porosity, hydraulic conductivity and permeability
The two properties of a rock or soil which are most important in controlling thebehaviour of subsurface water are (a) how much water the rock or soil can hold in emptyspaces within it, and (b) how easily and rapidly the water can flow through and out of it.The first is defined in hydrogeology by the porosity of the rock or soil. This expresses the ratio of voids in it to its total volume. (In soil mechanics, void ratio, the ratio of the volume of void space to that of the solid component, is more commonly used.) Therelationship between porosity and rock and soil textures is discussed elsewhere (Section 7.2.2). In general, crystalline igneous and metamorphic rocks have low porosities unless secondary voids such as joints are produced by fracturing, for example in a fault zone orat a fold axis, or are produced by chemical erosion to give solution cavities. Porosities ofterrigenous sedimentary rocks and soils may also be affected locally by fracturing, butthese rocks also have primary voids called pores. These are spaces left between the solid grains, and they are distributed fairly evenly throughout the body of the rock or soilwhen it is first formed. This intrinsic primary porosity tends to be greatest in young,poorly compacted sediments which have not been deeply buried and compressed at anystage of their geological history, and tends to be least in old, well compacted rocks buriedunder a thick overburden.
Flow of water through a soil or rock is described empirically by Darcy’s Law, and the relative ease of flow by the hydraulic conductivity (K) (referred to as the coefficient of permeability in some older texts). When water, oil or gas is flowing through the voids ina rock, its hydraulic conductivity is dependent on its viscosity and on other factors as wellas on the properties of the rock. The properties of the rock alone that affect ease of flow are defined by its intrinsic permeability (k), (usually shortened to permeability). This index property is used for definition in the petroleum industry, where more than one fluidis of interest, but is seldom used in hydrogeology. The relationships between hydraulicconductivity, permeability and water-yielding capacity are discussed later (Section 7.2.2).
Rocks must have voids (that is, they must be porous), in order to have permeability andhydraulic conductivity, but the relationship between porosity and permeability dependsmainly on the size of the voids rather than on their frequency. Clay has high porositycombined with low permeability. In an idealised terrigenous rock or soil in which thegrains were spherical, of one size, and uncemented, the permeability would increase withthe (diameter)2 of the grain size. In real terrigenous soils there is a corresponding
www.angoothachaap.blogspot.com
www.angoothachaap.blogspot.com
exponential increase in permeability as grain and void size increase linearly.
5.1.2 Darcy’s Law
Slow, laminar flow of water through a porous medium within which the stream lines aresmooth parallel paths, and where there is no turbulence or eddies in the wake of grains, isdescribed by an empirical formula, Darcy’s Law. This law is valid under most conditionsfound in nature, where the critical value of the Reynold’s Number (at which turbulent flow develops) is seldom approached. The rare exceptions of non-Darcian behaviour in the subsurface include flow through leached limestones, especially near springs, and inthe immediate vicinity of pumped wells.
In its simplest expression Darcy’s Law is v=–Ki, where v, the specific discharge, is the volume of water (Q) discharged through a unit area (A) of a porous medium in which the pores are saturated, and inflow rate to the medium equals outflow rate, that is, v=Q/A. (It should be noted that though v has the dimensions (L/T) of a velocity, it is not the average linear velocity of flow through the medium, , which is controlled by the porosity in cross section, nA; = nA.). K is the hydraulic conductivity, i is the hydraulic gradient, that is, the rate, dh/dl, at which the hydraulic or pressure head of water, h,measured from a horizontal datum, changes laterally with horizontal distance, l.
The pressure head at a given point within a body of rock or soil which is saturated with water is the level to which water would rise if an open-ended tube were inserted to tap the hydraulic pressure at that point. A tube that serves this physical purpose in a laboratoryexperiment is called a piezometer. In geological conditions where the subsurface water in a permeable rock is sealed and confined below an impermeable layer (see confinedwater, Section 5.2.4), the level to which water rises in a cased well penetrating thepermeable rock is usually referred to as the piezometric level rather than the pressure head. Piezometric levels are points on a piezometric surface, the maximum tilt (i) of which from the horizontal defines the hydraulic gradient dh/dl in the water saturating the confined permeable rock.
The physical meaning of these terms and Darcy’s Law may be demonstrated by the apparatus shown in Figure 5.1. This consists of a reservoir (A) joined to a horizontalconduit (B) through which water can flow from A to a tap (C). Six open-ended tubes (manometers) rise vertically from B. The pipe B is filled with soil of uniformpermeability k 1. The tap is closed and the reservoir A is filled until water reaches thelevel h 0, and remains there after water has percolated through the soil to C and risen ineach of the tubes to the static water level, h 0.
When the tap is opened and the reservoir is replenished continously to maintain thelevel at h 0 within it, a new equilibrium is attained eventually for steady flow through the soil, and for steady discharge v at C. Under these steady-state conditions the levels in the tubes fall to h 1 , h 2 , and so on. Each tube measures the pressure head at the point where it joins the conduit B. There is a progressive regular drop in head (dh) with horizontal distance (dl) from A to C, giving a steady inclination i=dh/dl of the piezometric ‘surface’. (The experiment is limited to a one-dimensional traverse of a permeable medium.)
Subsurface (ground) water 155
www.angoothachaap.blogspot.com
www.angoothachaap.blogspot.com
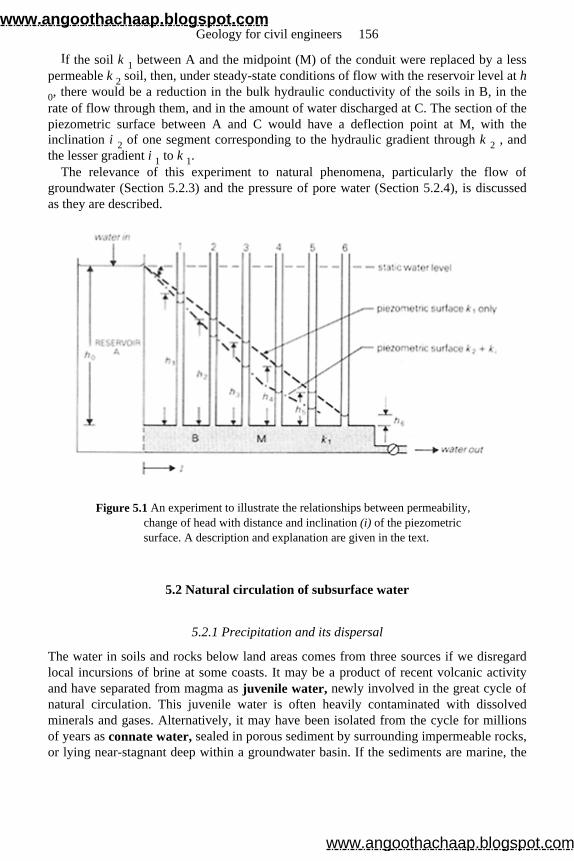
If the soil k 1 between A and the midpoint (M) of the conduit were replaced by a less permeable k 2 soil, then, under steady-state conditions of flow with the reservoir level at h0, there would be a reduction in the bulk hydraulic conductivity of the soils in B, in therate of flow through them, and in the amount of water discharged at C. The section of thepiezometric surface between A and C would have a deflection point at M, with theinclination i 2 of one segment corresponding to the hydraulic gradient through k 2 , and the lesser gradient i 1 to k 1.
The relevance of this experiment to natural phenomena, particularly the flow of groundwater (Section 5.2.3) and the pressure of pore water (Section 5.2.4), is discussed as they are described.
Figure 5.1 An experiment to illustrate the relationships between permeability, change of head with distance and inclination (i) of the piezometric surface. A description and explanation are given in the text.
5.2 Natural circulation of subsurface water
5.2.1 Precipitation and its dispersal
The water in soils and rocks below land areas comes from three sources if we disregardlocal incursions of brine at some coasts. It may be a product of recent volcanic activityand have separated from magma as juvenile water, newly involved in the great cycle of natural circulation. This juvenile water is often heavily contaminated with dissolvedminerals and gases. Alternatively, it may have been isolated from the cycle for millionsof years as connate water, sealed in porous sediment by surrounding impermeable rocks, or lying near-stagnant deep within a groundwater basin. If the sediments are marine, the
Geology for civil engineers 156
www.angoothachaap.blogspot.com
www.angoothachaap.blogspot.com
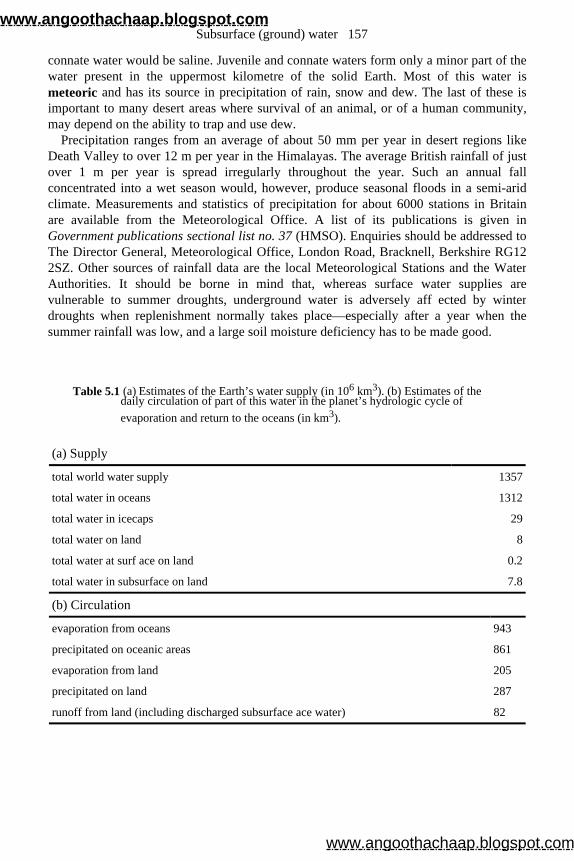
connate water would be saline. Juvenile and connate waters form only a minor part of thewater present in the uppermost kilometre of the solid Earth. Most of this water ismeteoric and has its source in precipitation of rain, snow and dew. The last of these is important to many desert areas where survival of an animal, or of a human community,may depend on the ability to trap and use dew.
Precipitation ranges from an average of about 50 mm per year in desert regions like Death Valley to over 12 m per year in the Himalayas. The average British rainfall of justover 1 m per year is spread irregularly throughout the year. Such an annual fallconcentrated into a wet season would, however, produce seasonal floods in a semi-arid climate. Measurements and statistics of precipitation for about 6000 stations in Britainare available from the Meteorological Office. A list of its publications is given inGovernment publications sectional list no. 37 (HMSO). Enquiries should be addressed to The Director General, Meteorological Office, London Road, Bracknell, Berkshire RG122SZ. Other sources of rainfall data are the local Meteorological Stations and the WaterAuthorities. It should be borne in mind that, whereas surface water supplies arevulnerable to summer droughts, underground water is adversely aff ected by winterdroughts when replenishment normally takes place—especially after a year when the summer rainfall was low, and a large soil moisture deficiency has to be made good.
Table 5.1 (a) Estimates of the Earth’s water supply (in 106 km3). (b) Estimates of the daily circulation of part of this water in the planet’s hydrologic cycle of evaporation and return to the oceans (in km3).
(a) Supply
total world water supply 1357
total water in oceans 1312
total water in icecaps 29
total water on land 8
total water at surf ace on land 0.2
total water in subsurface on land 7.8
(b) Circulation
evaporation from oceans 943
precipitated on oceanic areas 861
evaporation from land 205
precipitated on land 287
runoff from land (including discharged subsurface ace water) 82
Subsurface (ground) water 157
www.angoothachaap.blogspot.com
www.angoothachaap.blogspot.com
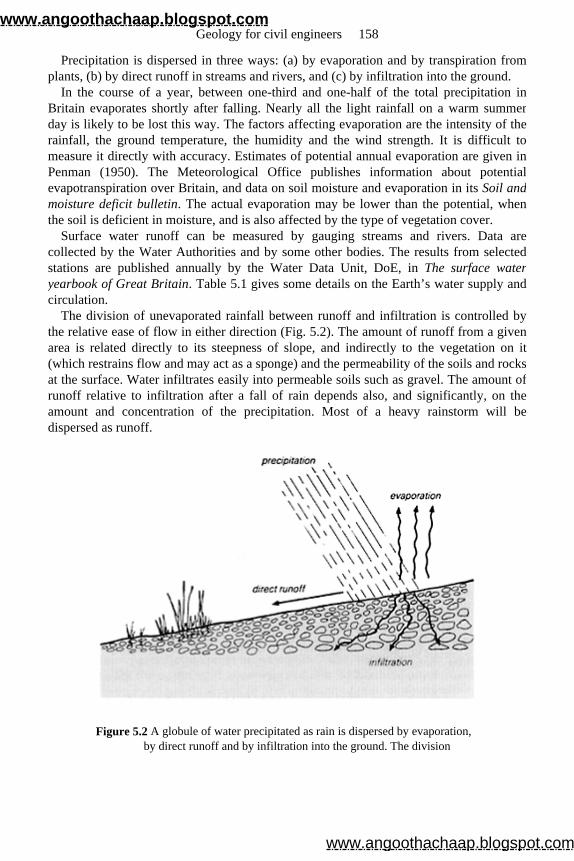
Precipitation is dispersed in three ways: (a) by evaporation and by transpiration from plants, (b) by direct runoff in streams and rivers, and (c) by infiltration into the ground.
In the course of a year, between one-third and one-half of the total precipitation in Britain evaporates shortly after falling. Nearly all the light rainfall on a warm summerday is likely to be lost this way. The factors affecting evaporation are the intensity of therainfall, the ground temperature, the humidity and the wind strength. It is difficult tomeasure it directly with accuracy. Estimates of potential annual evaporation are given inPenman (1950). The Meteorological Office publishes information about potentialevapotranspiration over Britain, and data on soil moisture and evaporation in its Soil and moisture deficit bulletin. The actual evaporation may be lower than the potential, whenthe soil is deficient in moisture, and is also affected by the type of vegetation cover.
Surface water runoff can be measured by gauging streams and rivers. Data are collected by the Water Authorities and by some other bodies. The results from selectedstations are published annually by the Water Data Unit, DoE, in The surface water yearbook of Great Britain. Table 5.1 gives some details on the Earth’s water supply and circulation.
The division of unevaporated rainfall between runoff and infiltration is controlled by the relative ease of flow in either direction (Fig. 5.2). The amount of runoff from a given area is related directly to its steepness of slope, and indirectly to the vegetation on it(which restrains flow and may act as a sponge) and the permeability of the soils and rocksat the surface. Water infiltrates easily into permeable soils such as gravel. The amount ofrunoff relative to infiltration after a fall of rain depends also, and significantly, on theamount and concentration of the precipitation. Most of a heavy rainstorm will bedispersed as runoff.
Figure 5.2 A globule of water precipitated as rain is dispersed by evaporation, by direct runoff and by infiltration into the ground. The division
Geology for civil engineers 158
www.angoothachaap.blogspot.com
www.angoothachaap.blogspot.com
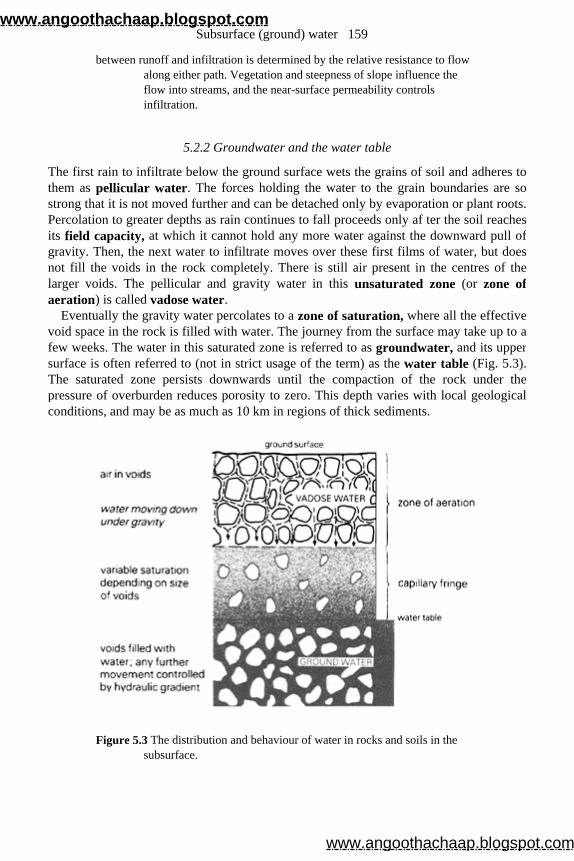
between runoff and infiltration is determined by the relative resistance to flow along either path. Vegetation and steepness of slope influence the flow into streams, and the near-surface permeability controls infiltration.
5.2.2 Groundwater and the water table
The first rain to infiltrate below the ground surface wets the grains of soil and adheres tothem as pellicular water. The forces holding the water to the grain boundaries are so strong that it is not moved further and can be detached only by evaporation or plant roots.Percolation to greater depths as rain continues to fall proceeds only af ter the soil reachesits field capacity, at which it cannot hold any more water against the downward pull of gravity. Then, the next water to infiltrate moves over these first films of water, but doesnot fill the voids in the rock completely. There is still air present in the centres of thelarger voids. The pellicular and gravity water in this unsaturated zone (or zone of aeration) is called vadose water.
Eventually the gravity water percolates to a zone of saturation, where all the effective void space in the rock is filled with water. The journey from the surface may take up to afew weeks. The water in this saturated zone is referred to as groundwater, and its upper surface is often referred to (not in strict usage of the term) as the water table (Fig. 5.3). The saturated zone persists downwards until the compaction of the rock under thepressure of overburden reduces porosity to zero. This depth varies with local geologicalconditions, and may be as much as 10 km in regions of thick sediments.
Figure 5.3 The distribution and behaviour of water in rocks and soils in the subsurface.
Subsurface (ground) water 159
www.angoothachaap.blogspot.com
www.angoothachaap.blogspot.com
The water table is shaped like a subdued replica of the topography above it. It is not static, as groundwater in a permeable rock is continually in motion. Highs in the waterbecome flatter, and gradients are reduced, at a rate controlled mainly by the permeabilityof the rock. The gradients are usually less than 1 in 100, but may be as much as 1 in 10 inhilly country. If an uncased well were drilled into the saturated zone, water would flowinto it and, given time, fill it to a level which is a point on the water table, as preciselydefined. The water table lies below the top of the saturated zone in the rocks surroundingthe well, separated from it by the capillary fringe (sometimes referred to as the capillary zone). This is usually between a few centimetres and a few metres in thickness, but may be over 10 m thick in very fine-grained rocks in which capillary pressures are high. The smaller the voids in the rock, the higher the fringe. In the open well, the water surface isat atmospheric pressure; and at the top of the saturated zone in the rocks, water is atatmospheric minus capillary pressure.
Under ideal conditions in a rock or soil of uniform porosity, there would be no physicaldistinction between the water in the capillary fringe and the water below it. Both wouldbe affected by the same hydraulic pressure gradients inducing flow, and by the samecapillary forces resisting flow. There would be no boundary to distinguish between themuntil a well was drilled. In most real conditions, however, the near-surface soils have variable grain sizes and permeabilities, and in practice the degree of saturation usuallydecreases upwards from the true water table. Only close to the water table are all thevoids in the soil completely filled with water and, for this reason, most of the capillaryfringe often lies within the zone of aeration rather than forming part of the zone ofsaturation in the strict sense.
If fine soil were dumped on swampy ground, then there would be a slow upward pull of the water to create a capillary fringe. In the case of an embankment built on swampyground, this must be allowed for. The rise may take as long as three years before it iscompleted.
Groundwater normally contains impurities such as carbonates and sulphates, which were dissolved from the rocks with which it came in contact. The concentration dependspartly on the time in contact, partly on the rate of flow, and partly on how reactive theminerals are. The water from bodies in gravel within a buried channel is usually purerthan from other parts, because flow is greater and the gravel is inert compared with clayor limestone. The quality of the groundwater, and its suitability for particular purposessuch as drinking or brewing, is thus related to the aquifer (Section 5.2.4) containing it. It may also affect the choice of engineering materials for foundations. Groundwater with ahigh sulphate content is present in some rocks, particularly certain shales and clays. Thesulphate may come from gypsum in the rock group, from sulphides, from hydrogensulphide in the groundwater reacting with other minerals, or, if the groundwater isconnate, the sulphate may have been concentrated in the sea water. Sulphates speed thecorrosion of iron, and react adversely with Portland and some other types of cement. It isrecommended (BS 4027) that the use of sulphate-resisting cement should be consideredonce the concentration passes a specified figure.
Evaporation is not restricted to surface water, but also takes place from the top of the water table. The phenomenon is particularly important in semi-arid regions. As a result, a
Geology for civil engineers 160
www.angoothachaap.blogspot.com
www.angoothachaap.blogspot.com
layer of strongly cemented material forms in the otherwise unconsolidated sediment ofthe soil (see Section 3.3.2). This may be mistaken for bedrock. It may consist of lime(calcareous), chalcedony (siliceous) or iron hydroxides (ferruginous). It is commonlyreferred to as hard pan and occasionally as duricrust. Other terms are used for particular types (for example, iron pan) and the terms are further multiplied by regionalusage. For example, calcareous hard pan is called caliche in Spanish American regions but kankar in India. Hard pan is relatively impermeable, and its presence affectspercolation through the soil. In some areas it may be thick enough to interfere withseismic refraction surveys (Section 6.3.3) and give spurious values to rock head by acting as the refractor.
Definition of the water table and of its variation seasonally and over longer periods isimportant for groundwater supply and other practical purposes. It can be located andmonitored by wells, and less accurately by geophysical surveys (Section 6.3). In large investigations both would be used. The results are usually presented as contoured maps ofthe water table of a particular area. The statutory responsibility for systematic regionalstudies of this type is usually vested in a national or state Geological Survey. In Britain,the Water Division of the BGS carries out hydrogeological work. Data are also collectedby the regional Water Authorities, and selected records have been published by the WaterResources Board.
5.2.3 Flow of groundwater
Groundwater is in continuous fluid contact such that a change of pressure at one pointaffects pressure at all other points. Its flow is controlled by the mechanical energy of thefluid per unit of mass, that is, by the change of head within it. The head at any point is ameasure of the potential energy of the fluid relative to a specified state. Points of equalfluid potential define equipotential surfaces within the body of groundwater, and thesein turn may be used to construct the flow lines of the groundwater. If the soil or rock is uniform and has the same permeability in all directions of flow, then the flow lines areorthogonal (that is, at right angles) to the equipotential surfaces. The pattern ofequipotential surfaces and flow lines for a given model of permeability is called a flow net. An example is shown in Figure 5.4.
In this model of simple topography and uniform permeability, precipitation is everywhere added to the water table, and this source in the system is balanced understeady-state conditions by discharge into streams, which act as sinks.
Note that flow lines radiate at the sink and are most concentrated there. Accordingly,the most intense flow takes place in that part of the system. All the water in the model ismoving, and there is no stagnant water at depth. In most real geological conditions,however, there is a decrease of permeability with depth because of the compaction of soiland rock under overburden, and there is a corresponding decrease in groundwatermovement. In some cases, significant flow is restricted to the uppermost few metres ofsoil, but in others, high hydraulic gradients can produce measurable flow at depths of afew kilometres in permeable rock layers. In general, the direction of flow is normal to thecontours of the water table. Flow usually follows the general features of the topography,
Subsurface (ground) water 161
www.angoothachaap.blogspot.com
www.angoothachaap.blogspot.com
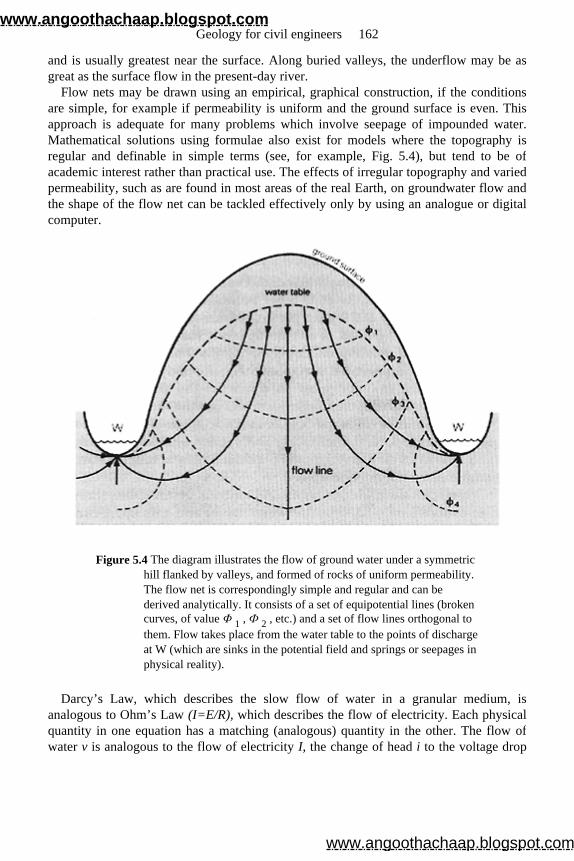
and is usually greatest near the surface. Along buried valleys, the underflow may be asgreat as the surface flow in the present-day river.
Flow nets may be drawn using an empirical, graphical construction, if the conditions are simple, for example if permeability is uniform and the ground surface is even. Thisapproach is adequate for many problems which involve seepage of impounded water.Mathematical solutions using formulae also exist for models where the topography isregular and definable in simple terms (see, for example, Fig. 5.4), but tend to be of academic interest rather than practical use. The effects of irregular topography and variedpermeability, such as are found in most areas of the real Earth, on groundwater flow andthe shape of the flow net can be tackled effectively only by using an analogue or digitalcomputer.
Figure 5.4 The diagram illustrates the flow of ground water under a symmetric hill flanked by valleys, and formed of rocks of uniform permeability. The flow net is correspondingly simple and regular and can be derived analytically. It consists of a set of equipotential lines (broken curves, of value Φ 1 , Ф 2 , etc.) and a set of flow lines orthogonal to them. Flow takes place from the water table to the points of discharge at W (which are sinks in the potential field and springs or seepages in physical reality).
Darcy’s Law, which describes the slow flow of water in a granular medium, is analogous to Ohm’s Law (I=E/R), which describes the flow of electricity. Each physicalquantity in one equation has a matching (analogous) quantity in the other. The flow ofwater v is analogous to the flow of electricity I, the change of head i to the voltage drop
Geology for civil engineers 162
www.angoothachaap.blogspot.com
www.angoothachaap.blogspot.com

E, and the permeability k to the inverse of the resistance, that is 1/R. These relationships may be used to construct an electrical analogue model, which can compute the behaviour (flow, change of head, and so on) within an underground reservoir ofgroundwater, if the distribution of permeabilities and the heads in test wells are known. Itcan cope with a permeability model within which the topography is more irregular andthe geological structure more complex than can be handled easily by simple equationsand analysis; once built it can be used continuously to monitor conditions in anunderground reservoir and manage it like a surface supply. Other analogous pairs ofequations are sometimes used for this purpose.
5.2.4 Geological controls on movement of subsurface water
The behaviour of groundwater as it circulates through layers of different permeabilityunderground and is eventually discharged on the surface or at the coast produces a rangeof phenomena. For simplicity in describing these, rocks are grouped into two categories.Those that have relatively high permeabilities because the pores of the rock are large, orbecause the rock is well jointed, are referred to for brevity as pervious. (This term isconventionally used to describe high fluid conductivity of a rock in which the voids are mainly secondary, that is, where there is appreciable flow along joints, fissures andbedding planes, in contrast to ‘permeable’, which is then restricted to a description ofprimary pore permeability.) A body of pervious (and permeable) rocks capable ofyielding groundwater is called an aquifer. Rocks with low permeability and no fissuresare referred to in the following account as impervious: they form aquicludes.
If gravity water percolating through the unsaturated zone meets a layer or lens of impervious rock, for example a lens of clay in gravel, then further flow downwards ishindered, and a local zone of saturation is formed above the main water table. It is calleda perched water table. This drains slowly by flow over the edges of the lens. There maybe more than one perched water table above the main water table. Each contains only alimited supply of water, which is vulnerable to contamination from the surface and is notusually suitable for development as a source of water supply.
Circulation of groundwater in the saturated zone takes place within aquifers, but thezone of movement is effectively limited by any aquicludes bordering the aquifer.Consequently, the subsurface is divided by geological structure into more or less self-contained hydrological units, or groundwater basins. Within each of these there is an approximate balance of supply and discharge, and flow is independent of other units. Theunits vary considerably in structure and in size. A hydrological unit may be a thick layerof sandstone several hundred kilometres square in area, a body of gravel in a buriedchannel, or an alluvial fan (Fig. 5.5) only 100 m across.
When an aquifer is covered by an aquiclude, retarding or effectively stopping any flowof water to the surface, the aquifer is said to contain confined water. Figure 5.6 shows an aquifer which crops out on high ground and dips under an aquiclude. The outcrop servesas an intake area for percolation, which recharges the confined water elsewhere in the
Subsurface (ground) water 163
www.angoothachaap.blogspot.com
www.angoothachaap.blogspot.com
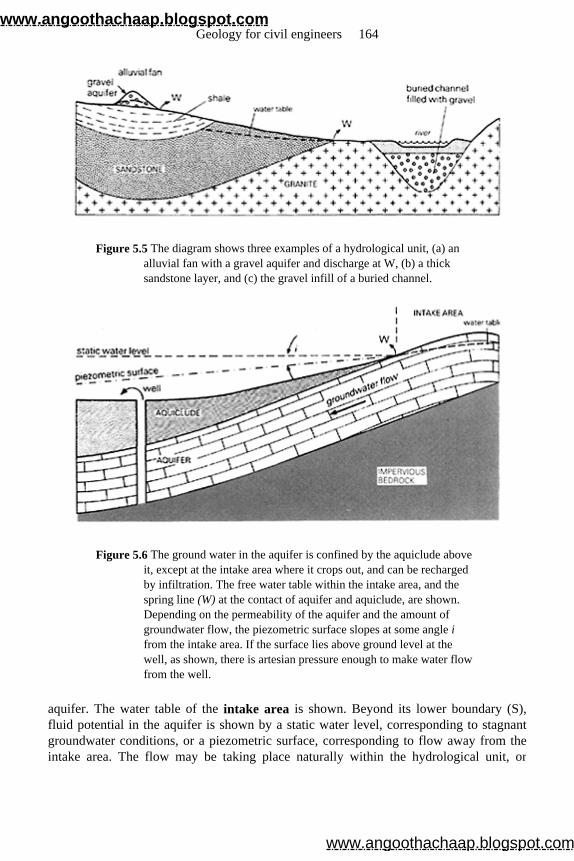
Figure 5.5 The diagram shows three examples of a hydrological unit, (a) an alluvial fan with a gravel aquifer and discharge at W, (b) a thick sandstone layer, and (c) the gravel infill of a buried channel.
Figure 5.6 The ground water in the aquifer is confined by the aquiclude above it, except at the intake area where it crops out, and can be recharged by infiltration. The free water table within the intake area, and the spring line (W) at the contact of aquifer and aquiclude, are shown. Depending on the permeability of the aquifer and the amount of groundwater flow, the piezometric surface slopes at some angle i from the intake area. If the surface lies above ground level at the well, as shown, there is artesian pressure enough to make water flow from the well.
aquifer. The water table of the intake area is shown. Beyond its lower boundary (S),fluid potential in the aquifer is shown by a static water level, corresponding to stagnantgroundwater conditions, or a piezometric surface, corresponding to flow away from theintake area. The flow may be taking place naturally within the hydrological unit, or
Geology for civil engineers 164
www.angoothachaap.blogspot.com
www.angoothachaap.blogspot.com
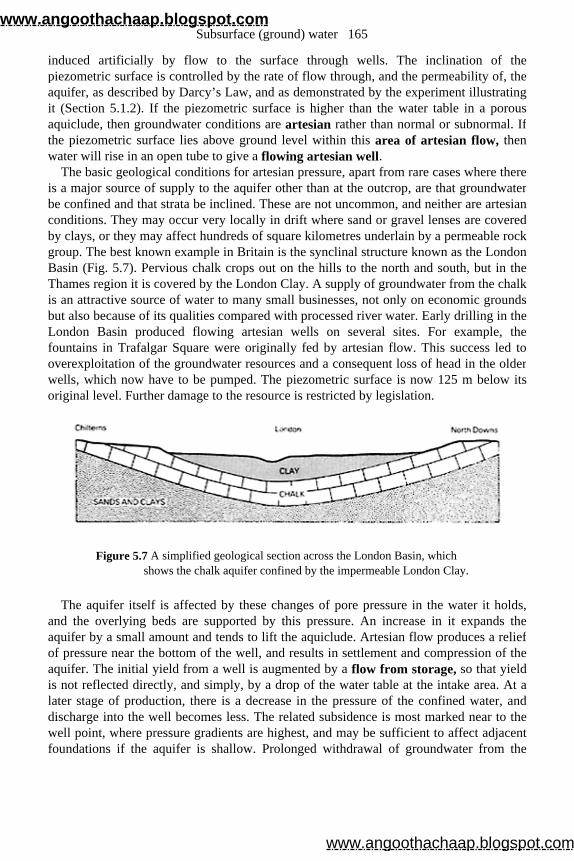
induced artificially by flow to the surface through wells. The inclination of thepiezometric surface is controlled by the rate of flow through, and the permeability of, theaquifer, as described by Darcy’s Law, and as demonstrated by the experiment illustrating it (Section 5.1.2). If the piezometric surface is higher than the water table in a porous aquiclude, then groundwater conditions are artesian rather than normal or subnormal. If the piezometric surface lies above ground level within this area of artesian flow, then water will rise in an open tube to give a flowing artesian well.
The basic geological conditions for artesian pressure, apart from rare cases where there is a major source of supply to the aquifer other than at the outcrop, are that groundwaterbe confined and that strata be inclined. These are not uncommon, and neither are artesianconditions. They may occur very locally in drift where sand or gravel lenses are coveredby clays, or they may affect hundreds of square kilometres underlain by a permeable rockgroup. The best known example in Britain is the synclinal structure known as the LondonBasin (Fig. 5.7). Pervious chalk crops out on the hills to the north and south, but in theThames region it is covered by the London Clay. A supply of groundwater from the chalkis an attractive source of water to many small businesses, not only on economic groundsbut also because of its qualities compared with processed river water. Early drilling in theLondon Basin produced flowing artesian wells on several sites. For example, thefountains in Trafalgar Square were originally fed by artesian flow. This success led tooverexploitation of the groundwater resources and a consequent loss of head in the olderwells, which now have to be pumped. The piezometric surface is now 125 m below itsoriginal level. Further damage to the resource is restricted by legislation.
Figure 5.7 A simplified geological section across the London Basin, which shows the chalk aquifer confined by the impermeable London Clay.
The aquifer itself is affected by these changes of pore pressure in the water it holds, and the overlying beds are supported by this pressure. An increase in it expands theaquifer by a small amount and tends to lift the aquiclude. Artesian flow produces a reliefof pressure near the bottom of the well, and results in settlement and compression of theaquifer. The initial yield from a well is augmented by a flow from storage, so that yield is not reflected directly, and simply, by a drop of the water table at the intake area. At alater stage of production, there is a decrease in the pressure of the confined water, anddischarge into the well becomes less. The related subsidence is most marked near to thewell point, where pressure gradients are highest, and may be sufficient to affect adjacentfoundations if the aquifer is shallow. Prolonged withdrawal of groundwater from the
Subsurface (ground) water 165
www.angoothachaap.blogspot.com
www.angoothachaap.blogspot.com
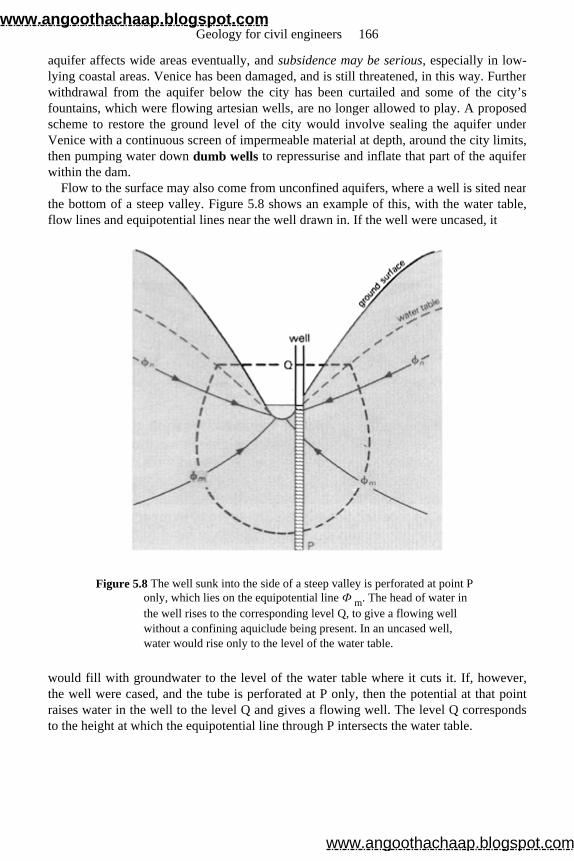
aquifer affects wide areas eventually, and subsidence may be serious, especially in low-lying coastal areas. Venice has been damaged, and is still threatened, in this way. Furtherwithdrawal from the aquifer below the city has been curtailed and some of the city’s fountains, which were flowing artesian wells, are no longer allowed to play. A proposedscheme to restore the ground level of the city would involve sealing the aquifer underVenice with a continuous screen of impermeable material at depth, around the city limits,then pumping water down dumb wells to repressurise and inflate that part of the aquifer within the dam.
Flow to the surface may also come from unconfined aquifers, where a well is sited near the bottom of a steep valley. Figure 5.8 shows an example of this, with the water table, flow lines and equipotential lines near the well drawn in. If the well were uncased, it
Figure 5.8 The well sunk into the side of a steep valley is perforated at point P only, which lies on the equipotential line Ф m. The head of water in the well rises to the corresponding level Q, to give a flowing well without a confining aquiclude being present. In an uncased well, water would rise only to the level of the water table.
would fill with groundwater to the level of the water table where it cuts it. If, however,the well were cased, and the tube is perforated at P only, then the potential at that pointraises water in the well to the level Q and gives a flowing well. The level Q correspondsto the height at which the equipotential line through P intersects the water table.
Geology for civil engineers 166
www.angoothachaap.blogspot.com
www.angoothachaap.blogspot.com
5.2.5 Natural discharge of groundwater
Natural discharge of groundwater takes place where the ground surface intersects thewater table. If the flow from the hydrologic unit is spread diffusely over an area ofmarshy ground, it is usually referred to as a seepage. If it is concentrated, say by a fissure acting as a channel, it is called a spring.
A valley spring (Fig. 5.9a) occurs where the water table intersects the bottom of a valley that is cut into pervious rocks. If the water table rises and falls seasonally, flow isintermittent, and the spring is called a bourne. These are particularly common in the chalk lands of southern England.
If the intersection of surface and water table is controlled by geological structure, and discharge takes place where impervious rock bounds the hydrologic unit (Fig. 5.9b), the overflow is called a contact spring, or sometimes a stratum spring if the rock is layered. The impervious barrier may be a layer of clay or shale, or an igneous intrusion.By converse argument, a spring line known to be related to a particular geological contact may be used to trace its outcrop laterally when mapping.
Fault springs occur where pervious rocks are faulted against impervious rocks (Fig. 5.9c), and may be thought of as a type of contact spring. If the rock in the fault zone is a pervious breccia, a natural artesian flow may bring confined water to the surface from aconcealed aquifer. In desert areas this flow may produce an oasis.
In limestone areas, groundwater usually follows channels along bed ding planes or fissures, which are progressively widened by solution, and discharge from limestone isoften from solution channel springs.
The major discharge of fresh groundwater takes place at the sea coast, where it mingles slowly with saline groundwater. The fresh water and the brine behave, over short periods,like immiscible liquids, and rock is ‘wet’ with either one or the other. Mixing takes place within a relatively narrow subsurface zone of contact. The shape and position of thiscontact surface are determined by the way in which the body of fresh water ‘floats on’ the brine. The fresh groundwater is less dense than the brine and tends to override anddisplace it. Where the relief of the ground surface is low, with correspondingly lowhydraulic gradients and rates of flow, the body of fresh groundwater is in approximatehydrostatic equilibrium with the brine below it. This relationship has been observed inmany low, sandy islands, including the Frisian Islands and Long Island, and is usuallyreferred to as the Ghyben-Hertzberg Balance. The brine of the North Sea surrounding the Frisian Islands has a specific gravity of 1.027, and hence the fresh groundwater (sp.gr. 1.000) in hydrostatic balance with it has the form shown in Figure 5.10.
Subsurface (ground) water 167
www.angoothachaap.blogspot.com
www.angoothachaap.blogspot.com
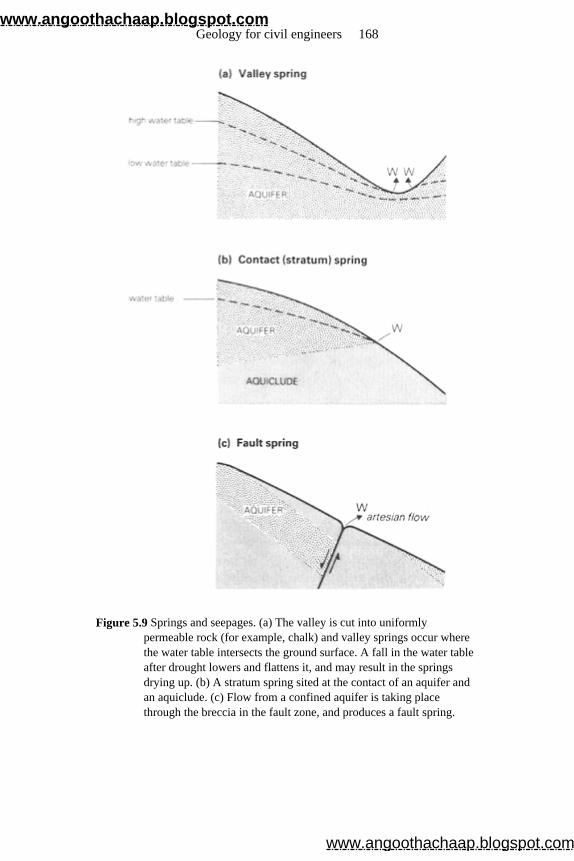
Figure 5.9 Springs and seepages. (a) The valley is cut into uniformly permeable rock (for example, chalk) and valley springs occur where the water table intersects the ground surface. A fall in the water table after drought lowers and flattens it, and may result in the springs drying up. (b) A stratum spring sited at the contact of an aquifer and an aquiclude. (c) Flow from a confined aquifer is taking place through the breccia in the fault zone, and produces a fault spring.
Geology for civil engineers 168
www.angoothachaap.blogspot.com
www.angoothachaap.blogspot.com
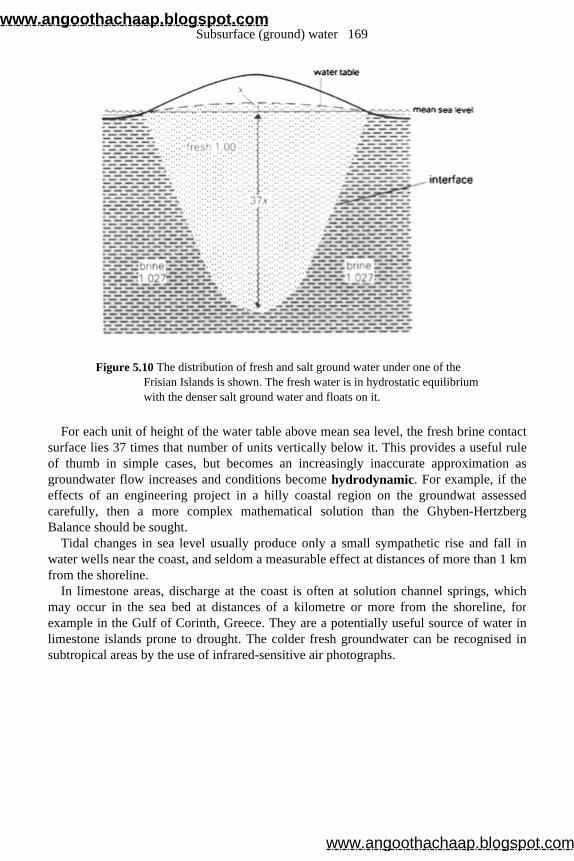
Figure 5.10 The distribution of fresh and salt ground water under one of the Frisian Islands is shown. The fresh water is in hydrostatic equilibrium with the denser salt ground water and floats on it.
For each unit of height of the water table above mean sea level, the fresh brine contact surface lies 37 times that number of units vertically below it. This provides a useful ruleof thumb in simple cases, but becomes an increasingly inaccurate approximation asgroundwater flow increases and conditions become hydrodynamic. For example, if the effects of an engineering project in a hilly coastal region on the groundwat assessed carefully, then a more complex mathematical solution than the Ghyben-Hertzberg Balance should be sought.
Tidal changes in sea level usually produce only a small sympathetic rise and fall in water wells near the coast, and seldom a measurable effect at distances of more than 1 kmfrom the shoreline.
In limestone areas, discharge at the coast is often at solution channel springs, which may occur in the sea bed at distances of a kilometre or more from the shoreline, forexample in the Gulf of Corinth, Greece. They are a potentially useful source of water inlimestone islands prone to drought. The colder fresh groundwater can be recognised insubtropical areas by the use of infrared-sensitive air photographs.
Subsurface (ground) water 169
www.angoothachaap.blogspot.com
www.angoothachaap.blogspot.com
5.3 Some practical engineering aspects of groundwater
5.3.1 Groundwater and engineering
The presence of water in rocks and its movement through them are of great importance tomany human activities such as farming. However, this brief account is limited to some ofthe more important geological aspects of groundwater which are linked to engineering.These are: (a) water supply from subsurface sources, (b) drainage of marshes, and (c)disposal of toxic waste underground. The other aspects of equal or greater importance tomost engineers, which are normally covered in a separate course of soil mechanics, areomitted or have been referred to briefly. They include pore fluid pressure in soils, theeffect that the presence of water has on the strengths and other mechanical properties ofsoils, and the relationship between settlement of buildings and the loss of pore water fromclay.
5.3.2 Ground water inventory
In arid regions, groundwater may be the only dependable source of water supply formuch of the year, unless water is piped over long distances. It has the bonus quality ofbeing filtered naturally. There are advantages also, which may outweigh any extra costper litre, in having some supply from wells in areas like England that depend mainly onsurface reservoirs. Problems such as creating a watertight reservoir in chalk lands, oracquiring its site, are avoided. The water is often more palatable than alternative surfacewater. Underground reservoirs are seldom drained entirely during droughts, and deepwells can draw on reserves temporarily, on the understanding that replenishment will beallowed to take place during the next winter. An important consideration in manyschemes of supply is that groundwater resources can be developed more rapidly than a surface reservoir can be built. The lead time between the conception of a reservoir and its completion is conditioned not only by construction times and technical delays, but alsoby the statutory procedures of acquiring approval, permissions and land, and allowingappeals by those affected. Where a relatively quick solution must be found to a supply ofwater or to insure against drought, a groundwater scheme should be considered.
In assessing the feasibility of any scheme of groundwater supply and in planning it, geological and hydrological information is essential. A first step is to evaluate thepermeabilities of the rocks and soils present in the area, and to determine their structure.This identifies aquifers and aquicludes and outlines the hydrologic units present. Thecommon aquifers include: (a) sand and gravel deposits, occurring as drift in glaciatedareas, or as alluvial cones (especially in semi-arid hilly regions); (b) sandstones, forexample the Bunter Sandstone and Keuper Sandstones (Waterstones) in the EnglishMidlands; (c) certain permeable limestones such as chalk; and (d) fissured or deeplyweathered igneous rocks, especially in tropical areas. A small local supply may beobtained from a single well in an alluvial cone, but a large scheme usually draws on the
Geology for civil engineers 170
www.angoothachaap.blogspot.com
www.angoothachaap.blogspot.com
groundwater in an extensive, thick, permeable layer. Potential supply of groundwater from the hydrologic unit selected for investigation is
then assessed by drawing up a groundwater inventory, by evaluating the equation
The values of these quantities for the hydrologic unit can be assessed from records ormeasured. In the natural state there is equilibrium within the unit, and the groundwaterincrement is balanced over long periods by natural discharge. In a scheme of groundwatersupply, it is artificially discharged through wells. The safe yield of the hydrologic unit is equal to its groundwater increment. If more water than this is withdrawn by pumpingfrom deep wells, then finite reserves rather than current resources are being exploited.This may be justified during a summer drought, but as standard practice over years it willproduce a serious drop in level of the water table or the piezometric surface of theaquifer. These can be monitored using wells. Recovery to normal after a major loweringof the water table is likely to require a span of time comparable to the period ofoverexploitation. Some semi-arid and desert areas in the USA, and in other countries,have been overexploited in this way. The water which makes the desert bloom issometimes being irreversibly mined, and in these-cases it will run out. In coastal areas, careless exploitation may lead to serious settlement (Section 5.2.4) and to invasion of irrigation wells by brine. Some areas of South-east England have been over-exploited, but drilling is now controlled by legislation. Recharging of aquifers by artificial means is done by pumping surface water down dumb wells into them, or by guiding its flow acrossspreads of gravel or other pervious rock on the aquifer, and so encouraging infiltration.
The investigations that preceded a scheme of groundwater supply from Permian strata in south Durham have been described in an unpublished paper to a conference in 1969 byA.S.Burgess and T.Cairney. The decision to opt for wells rather than a reservoir wasweighted in this project by the need for a source of water capable of rapid development.The potential of the aquifer, the Magnesian Limestone, to give substantial yields wasalready appreciated from limited exploitation of it. The limestone is 150 m thick, but lessthan 30 m of it behaves as a good aquif er. The best yield comes from an oolitic layernear the middle, with a significant contribution from the heavily jointed limestone aboveand below it into those boreholes that intersect major fractures. The limestone has agentle dip to the east, which is complicated by very open folds about east-west axes, and by low pre-Permian hills that protrude through the aquifer. Recharge is limited to thewestern outcrop of the limestone, where drift is thin or absent, and where some streamsvanish down sink holes. Wells in this part of the area are of the water-table type (see Section 5.3.3). To the east, water in the aquifer is confined by overlying impervious strataand by a thicker cover of glacial clays.
An area of 160 km2 was investigated by a primary programme of 42 small-diameter boreholes used to prove the local geology, to provide samples for testing and to giveinformation about water levels. A secondary programme of 15 larger-diameter holes were bored for test pumping, and from these the aquifer’s transmissibility and storage
total precipition = evaporation + direct runoff + groundwater increment (by infiltration)
Subsurface (ground) water 171
www.angoothachaap.blogspot.com
www.angoothachaap.blogspot.com
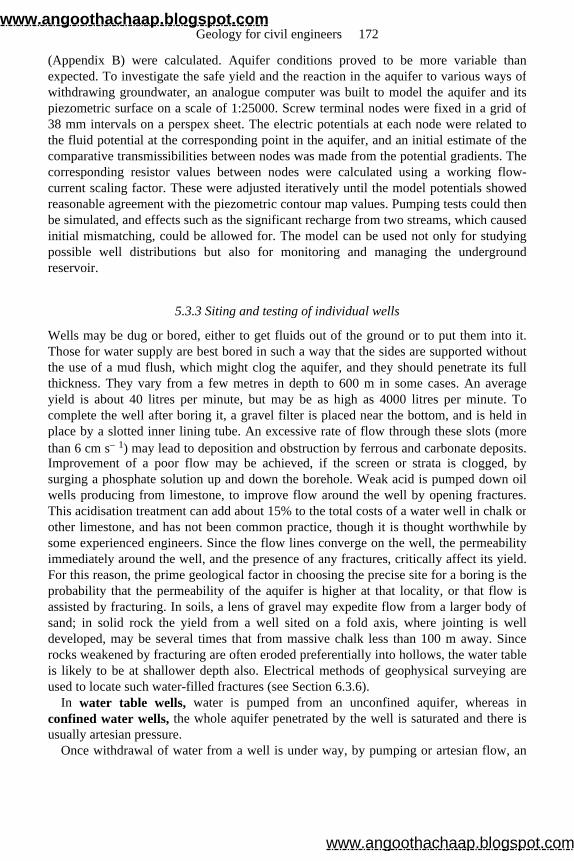
(Appendix B) were calculated. Aquifer conditions proved to be more variable thanexpected. To investigate the safe yield and the reaction in the aquifer to various ways ofwithdrawing groundwater, an analogue computer was built to model the aquifer and itspiezometric surface on a scale of 1:25000. Screw terminal nodes were fixed in a grid of38 mm intervals on a perspex sheet. The electric potentials at each node were related tothe fluid potential at the corresponding point in the aquifer, and an initial estimate of thecomparative transmissibilities between nodes was made from the potential gradients. Thecorresponding resistor values between nodes were calculated using a working flow-current scaling factor. These were adjusted iteratively until the model potentials showedreasonable agreement with the piezometric contour map values. Pumping tests could thenbe simulated, and effects such as the significant recharge from two streams, which causedinitial mismatching, could be allowed for. The model can be used not only for studyingpossible well distributions but also for monitoring and managing the undergroundreservoir.
5.3.3 Siting and testing of individual wells
Wells may be dug or bored, either to get fluids out of the ground or to put them into it.Those for water supply are best bored in such a way that the sides are supported withoutthe use of a mud flush, which might clog the aquifer, and they should penetrate its fullthickness. They vary from a few metres in depth to 600 m in some cases. An averageyield is about 40 litres per minute, but may be as high as 4000 litres per minute. Tocomplete the well after boring it, a gravel filter is placed near the bottom, and is held inplace by a slotted inner lining tube. An excessive rate of flow through these slots (morethan 6 cm s– 1) may lead to deposition and obstruction by ferrous and carbonate deposits. Improvement of a poor flow may be achieved, if the screen or strata is clogged, bysurging a phosphate solution up and down the borehole. Weak acid is pumped down oilwells producing from limestone, to improve flow around the well by opening fractures.This acidisation treatment can add about 15% to the total costs of a water well in chalk orother limestone, and has not been common practice, though it is thought worthwhile bysome experienced engineers. Since the flow lines converge on the well, the permeabilityimmediately around the well, and the presence of any fractures, critically affect its yield.For this reason, the prime geological factor in choosing the precise site for a boring is theprobability that the permeability of the aquifer is higher at that locality, or that flow isassisted by fracturing. In soils, a lens of gravel may expedite flow from a larger body ofsand; in solid rock the yield from a well sited on a fold axis, where jointing is welldeveloped, may be several times that from massive chalk less than 100 m away. Sincerocks weakened by fracturing are often eroded preferentially into hollows, the water tableis likely to be at shallower depth also. Electrical methods of geophysical surveying areused to locate such water-filled fractures (see Section 6.3.6).
In water table wells, water is pumped from an unconfined aquifer, whereas inconfined water wells, the whole aquifer penetrated by the well is saturated and there is usually artesian pressure.
Once withdrawal of water from a well is under way, by pumping or artesian flow, an
Geology for civil engineers 172
www.angoothachaap.blogspot.com
www.angoothachaap.blogspot.com
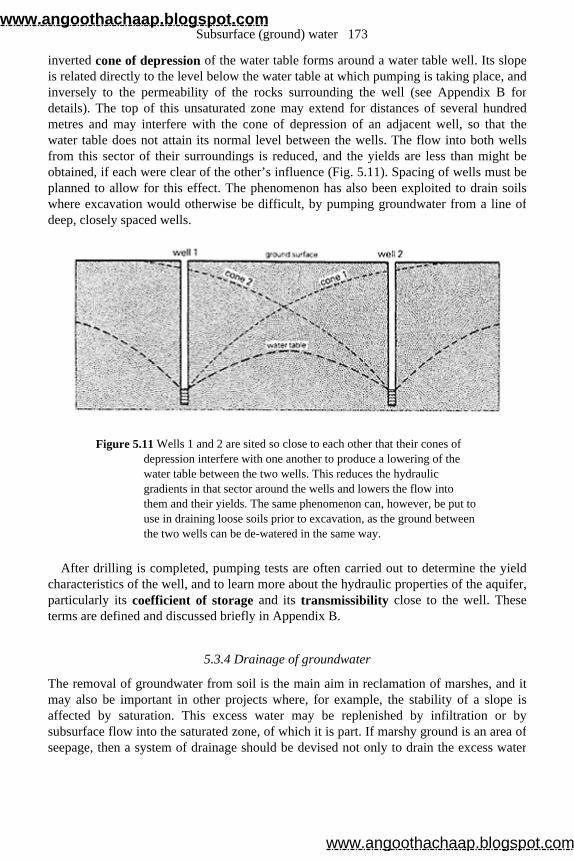
inverted cone of depression of the water table forms around a water table well. Its slopeis related directly to the level below the water table at which pumping is taking place, andinversely to the permeability of the rocks surrounding the well (see Appendix B fordetails). The top of this unsaturated zone may extend for distances of several hundredmetres and may interfere with the cone of depression of an adjacent well, so that thewater table does not attain its normal level between the wells. The flow into both wellsfrom this sector of their surroundings is reduced, and the yields are less than might beobtained, if each were clear of the other’s influence (Fig. 5.11). Spacing of wells must be planned to allow for this effect. The phenomenon has also been exploited to drain soilswhere excavation would otherwise be difficult, by pumping groundwater from a line ofdeep, closely spaced wells.
Figure 5.11 Wells 1 and 2 are sited so close to each other that their cones of depression interfere with one another to produce a lowering of the water table between the two wells. This reduces the hydraulic gradients in that sector around the wells and lowers the flow into them and their yields. The same phenomenon can, however, be put to use in draining loose soils prior to excavation, as the ground between the two wells can be de-watered in the same way.
After drilling is completed, pumping tests are often carried out to determine the yieldcharacteristics of the well, and to learn more about the hydraulic properties of the aquifer,particularly its coefficient of storage and its transmissibility close to the well. These terms are defined and discussed briefly in Appendix B.
5.3.4 Drainage of groundwater
The removal of groundwater from soil is the main aim in reclamation of marshes, and itmay also be important in other projects where, for example, the stability of a slope isaffected by saturation. This excess water may be replenished by infiltration or bysubsurface flow into the saturated zone, of which it is part. If marshy ground is an area ofseepage, then a system of drainage should be devised not only to drain the excess water
Subsurface (ground) water 173
www.angoothachaap.blogspot.com
www.angoothachaap.blogspot.com
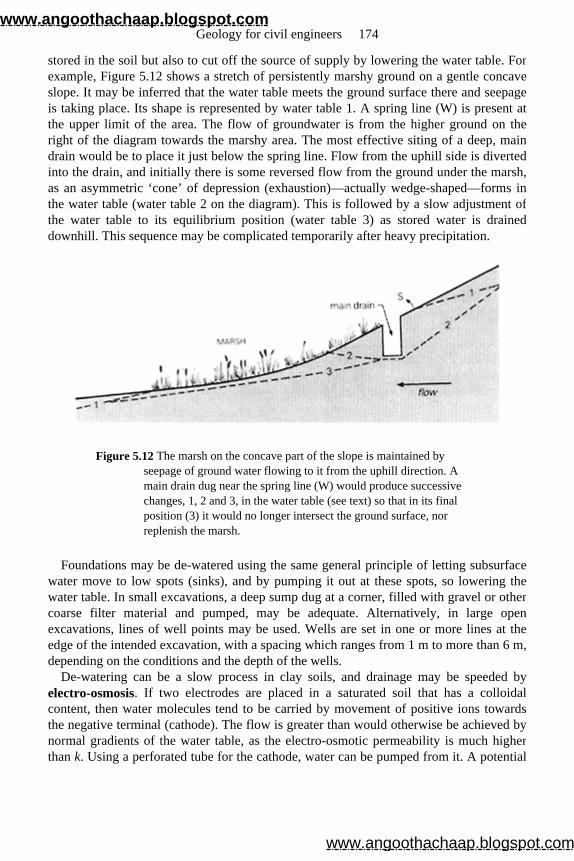
stored in the soil but also to cut off the source of supply by lowering the water table. Forexample, Figure 5.12 shows a stretch of persistently marshy ground on a gentle concaveslope. It may be inferred that the water table meets the ground surface there and seepageis taking place. Its shape is represented by water table 1. A spring line (W) is present atthe upper limit of the area. The flow of groundwater is from the higher ground on theright of the diagram towards the marshy area. The most effective siting of a deep, maindrain would be to place it just below the spring line. Flow from the uphill side is divertedinto the drain, and initially there is some reversed flow from the ground under the marsh,as an asymmetric ‘cone’ of depression (exhaustion)—actually wedge-shaped—forms in the water table (water table 2 on the diagram). This is followed by a slow adjustment ofthe water table to its equilibrium position (water table 3) as stored water is draineddownhill. This sequence may be complicated temporarily after heavy precipitation.
Figure 5.12 The marsh on the concave part of the slope is maintained by seepage of ground water flowing to it from the uphill direction. A main drain dug near the spring line (W) would produce successive changes, 1, 2 and 3, in the water table (see text) so that in its final position (3) it would no longer intersect the ground surface, nor replenish the marsh.
Foundations may be de-watered using the same general principle of letting subsurface water move to low spots (sinks), and by pumping it out at these spots, so lowering thewater table. In small excavations, a deep sump dug at a corner, filled with gravel or othercoarse filter material and pumped, may be adequate. Alternatively, in large openexcavations, lines of well points may be used. Wells are set in one or more lines at theedge of the intended excavation, with a spacing which ranges from 1 m to more than 6 m,depending on the conditions and the depth of the wells.
De-watering can be a slow process in clay soils, and drainage may be speeded by electro-osmosis. If two electrodes are placed in a saturated soil that has a colloidal content, then water molecules tend to be carried by movement of positive ions towardsthe negative terminal (cathode). The flow is greater than would otherwise be achieved bynormal gradients of the water table, as the electro-osmotic permeability is much higher than k. Using a perforated tube for the cathode, water can be pumped from it. A potential
Geology for civil engineers 174
www.angoothachaap.blogspot.com
www.angoothachaap.blogspot.com
of the order of 100 V is generally suitable. Clays can be drained this way, but not sands,however fine.
5.3.5 Disposal of toxic waste, and storage of fluids, underground
Disposal of toxic waste and noxious fluids underground, by tipping them down disusedmine shafts or pumping them down dumb wells, is practised more often in the USA thanin Britain. Much of the brine pumped out with oil is disposed of in this way, and atpresent more than 200 wells are used in the USA to inject acid and alkali wastes,pumping liquors and uranium mill wastes into deep rocks. The technique has become of increased interest in Britain as controls on dumping at sea and on the surface becomemore strict and are fully implemented.
Underground disposal is an acceptable practice where the local geology and hydrologyare favourable, and where there are rigorous engineering and administrative controls. Themost important aspect, geologically, is that there must be a negligible rate of groundwatermovement near the storage area. For example, salinity of the groundwater at the storagearea would indicate that it is connate, and would be a useful criterion of limited flowthrough the rock.
Disposal wells for toxic waste basically require a pervious reservoir layer of sandstonefor injection, overlain by an impervious layer of shale or salt which seals it. Groundwaterflow should be very slow, since any movement carries a risk of contaminatingneighbouring water wells or springs. If, however, the fluid added to the groundwater wereimmiscible with it, and also less dense so that it floats on top, its movement laterallywould be restricted by certain types of structure affecting the reservoir layer. Where thereservoir layer is concave downwards under the impervious seal, for example in ananticline (Fig. 5.13), the lighter fluid rises and is trapped there. Accumulations ofpetroleum (that is, of oil and natural gas) occur naturally in structures of this type, whichare called oil traps. (There is not always petroleum present to fill them.)
Oil traps can be used to store imported natural gas, and a few schemes of this type exist. A feasibility study of some structures in England was made before the developmentof North Sea resources. Theoretically they could be used to store strategic oil reserves,but only at an unacceptable cost, with present technology, of not being able to recover alarge percentage of the oil in the reservoir. So far, underground storage of oil and ofliquefied frozen gas has been in large artificial caverns. For oil, these are excavated inimpervious rocks; for liquefied gas they are excavated in soils or soft rocks, and thegroundwater frozen by refrigeration makes the walls of the cavern impermeable. InGermany, salt domes provide excellent sites for stores, as the salt is easily excavated andimpermeable. In Scandinavia and America, unlined caverns in crystalline rocks are used.They are not completely sealed as, unlike the salt chambers, they are not free of fractures,and groundwater tends to flow into them. The buoyancy and immiscibility of the oilprevent any leakage, however, by outward flow against the hydraulic gradient of thegroundwater.
Subsurface (ground) water 175
www.angoothachaap.blogspot.com
www.angoothachaap.blogspot.com
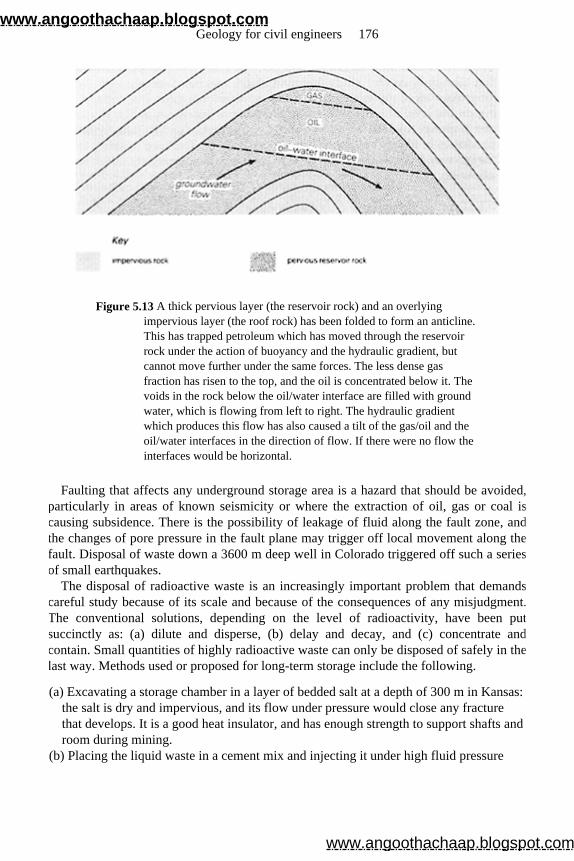
Figure 5.13 A thick pervious layer (the reservoir rock) and an overlying impervious layer (the roof rock) has been folded to form an anticline. This has trapped petroleum which has moved through the reservoir rock under the action of buoyancy and the hydraulic gradient, but cannot move further under the same forces. The less dense gas fraction has risen to the top, and the oil is concentrated below it. The voids in the rock below the oil/water interface are filled with ground water, which is flowing from left to right. The hydraulic gradient which produces this flow has also caused a tilt of the gas/oil and the oil/water interfaces in the direction of flow. If there were no flow the interfaces would be horizontal.
Faulting that affects any underground storage area is a hazard that should be avoided, particularly in areas of known seismicity or where the extraction of oil, gas or coal iscausing subsidence. There is the possibility of leakage of fluid along the fault zone, andthe changes of pore pressure in the fault plane may trigger off local movement along thefault. Disposal of waste down a 3600 m deep well in Colorado triggered off such a seriesof small earthquakes.
The disposal of radioactive waste is an increasingly important problem that demands careful study because of its scale and because of the consequences of any misjudgment.The conventional solutions, depending on the level of radioactivity, have been putsuccinctly as: (a) dilute and disperse, (b) delay and decay, and (c) concentrate andcontain. Small quantities of highly radioactive waste can only be disposed of safely in thelast way. Methods used or proposed for long-term storage include the following.
(a) Excavating a storage chamber in a layer of bedded salt at a depth of 300 m in Kansas: the salt is dry and impervious, and its flow under pressure would close any fracture that develops. It is a good heat insulator, and has enough strength to support shafts and room during mining.
(b) Placing the liquid waste in a cement mix and injecting it under high fluid pressure
Geology for civil engineers 176
www.angoothachaap.blogspot.com
www.angoothachaap.blogspot.com
into deep shale layers: the high pressure produces local fracturing and makes possible the injection into shale.
At present, the UK is participating in a European programme of assessing how best todispose of small quantities of highly radioactive waste from nuclear power plants. TheUK Atomic Energy Authority has commissioned studies at Harwell (Robins et al. 1981)and by the BGS (Gray et al. 1976, Chapman 1979). These studies deal with relevantgeological criteria concerning waste disposal (Gray et al. 1976), geochemicalconsiderations of granites, argillaceous rocks and evaporite formations (Chapman 1979)and an investigation into the characteristics of certain argillaceous strata (Robins et al.1981). Subsequent follow-up work has examined, in more detail, southern Scottishgranites and evaporite (gypsum) formations in northern England (Northumberland) aspotential radioactive waste disposal sites, but no firm conclusions have been reached asyet, and investigations are proceeding.
General criteria by which sites will be graded include population density, present landusage, accessibility and local amenities. The main geological criteria being assessed arethe nature of the rocks, their physical and chemical properties, the seismic stability of thesite from the geological history and the site’s proximity to seismic zones, the permeabilityof the rocks and their nearness to pervious strata (or pervious zones), their susceptibilityto the effects of major climatic changes including possible glaciation, and the possibleeffects on the potential site of nearby mining or drilling for minerals or dam construction.
An issue of Geoscience Canada (in reference list under Fyfe et al. 1980) was devotedto nuclear waste disposal, and the papers included the use of seismic techniques inidentifying potential disposal sites, seismic risk, and geochemistry of radioactive wastedisposal. The papers in this journal also provide an excellent bibliography of otherrelevant papers in this important and complex subject.
References and selected reading
Bell, F.G. 1978. Petrographical factors relating to the porosity and permeability in the FellSandstone. Q. J. Engng Geol . 11 , 113–26.
British Standards Institution 1972. Sulphate-resisting Portland cement . Br. Stand. Inst. Rep. BS 4027: Part 2.
Cedergren, H.R. 1977. Seepage, drainage and flow nets , 2nd edn. Chichester: Wiley. Chapman, N.A. 1979. Geochemical considerations in the choice of a host rock for the
disposal of high level radioactive waste . Rep. Inst. Geol. Sci. no. 79/14. Clark, L. 1977. The analysis and planning of step drawdown tests. Q. J. Engng Geol . 10 ,
125–43. Domenico, P. 1972. Concepts and models in groundwater . New York: McGraw-Hill. Fyfe, W.S. and many other authors 1980. Nuclear waste disposal. Geosci. Canada 6 (4). Galley, J.E. (ed.) 1968. Subsurface disposal in geologic basins—a study of reservoir
strata. Mem. Am. Assoc. Petrol. Geol . 10. Geological Society, London, and Institution of Water Engineers 1963. Joint symposium.
Ground water: geological and engineering aspects. J. Inst. Water Engrs 17 (3), 153–291.
Subsurface (ground) water 177
www.angoothachaap.blogspot.com
www.angoothachaap.blogspot.com

Gray, D.A., J.D.Mather and I.B.Harrison 1974. Review of ground water pollution from waste sites in England and Wales with provisional guidelines for future site selection. Q. J. Engng Geol . 7 , 181–98.
Gray, D.A. et al. 1976. Disposal of highly active, solid radioactive wastes into geological formations—relevant geological criteria for the United Kingdom . Rep. Inst. Geol. Sci. no. 76/12.
Hodgson, A.V. and M.D.Gardiner 1971. An investigation of the aquifer potential of the Fell Sandstone of Northumberland. Q. J. Engng Geol . 4 , 91–110.
Hubbert, M.K. 1940. The theory of groundwater motion. J. Geol . 48 , 785–944. Jones, G.P. 1971. Management of underground water resources. Q. J. Engng Geol . 4 ,
317–54. Krynine, D.P. and W.R.Judd 1957. Principles of engineering geology and geotechnics .
New York: McGraw-Hill. Penman, H.L. 1950. Evaporation over the British Isles. Q. J. R. Meteorol. Soc. 76 , 372. Robins, N.S., B.A.Martin and M.A.Brightman 1981. Borehole drilling and completion:
details for the Harwell research site . Inst. Geol. Sci. Rep. no. ENPU 81–9: Harwell. Water Data Unit (current). The surface water yearbook of Great Britain . London:
HMSO.
Geology for civil engineers 178
www.angoothachaap.blogspot.com
www.angoothachaap.blogspot.com
6 Geological exploration of an engineering site
6.1 General considerations
6.1.1 Introduction
Good professional practice in the exploration of an engineering site is described in BS5930:1981, Code of Practice for Site Investigations, which should be referred to byprofessional engineers as a source of definitions, and as an authoritative statement of theobjects, scope, procedures and methods of site investigation. It covers testing ofmechanical and other properties of soils and rocks, which conventionally forms part of acivil engineering course taught by engineers. This chapter deals, however, only with thegeological and geophysical surveys used to investigate what rocks and soils are present,and how they are distributed under the site.
The exploration of a site to assess the feasibility of a project, to plan and design appropriate foundations, and to draw up bills of quantity for excavation normally requiresthat most of the following information be obtained:
(a) what rocks and soils are present, including the sequence of strata, the nature and thicknesses of superficial deposits and the presence of igneous intrusions;
(b) how these rocks are distributed over, and under, the site (that is, their structure); (c) the frequency and orientation of joints in the different bodies of rock and the location
of any faults; (d) the presence and extent of any weathering of the rocks, and particularly of any
soluble rocks such as limestone; (e) the groundwater conditions, including the position of the water table, and whether the
groundwater contains noxious material in solution, such as sulphates, which may affect cement with which it comes in contact;
(f) the presence of economic deposits which may have been extracted by mining or quarrying, to leave concealed voids or disturbed ground; and
(g) the suitability of local rocks and soils, especially those to be excavated, as construction materials.
Special information such as the seismicity of the region or the pattern of sediment movement in an estuary may also be required.
Much of this exploration, particularly the making of geological maps, is normallycarried out in large projects by a professional engineering geologist. The role of theengineer, and his need to understand geological terms, concepts and methodology even
www.angoothachaap.blogspot.com
www.angoothachaap.blogspot.com
while employing a consultant, has been discussed earlier (Section 1.1). In limited sites the engineer may have to collect his own geological data, and make elementary, but crucial,geological decisions on, for example, whether or not a boring has reached bedrock, or hasstruck a boulder in the overlying till.
6.1.2 Inductive reasoning
Most conclusions reached by mathematical arguments are achieved by deductive reasoning. In using this method, a relationship between physical quantities is accepted asbeing generally true, and expressed as a scientific principle. Then, in the simplest case,the answer to a specific problem is found by substituting numerical values into thegeneral equation that describes the relationship. In other uses of deduction, more subtlegeneral relationships between the physical quantities may be deduced by mathematical argument. This type of reasoning is objective, and a logical person or a logical machine,suitably skilled, arrives at the same conclusion. The answer is usually unique, as distinctfrom ‘most probable’, and its error is governed by the precision with which the physical quantities are determined. The method is tidy and intellectually satisfying, and there isunderstandably a temptation to think of it as the only respectable way to arrive at ascientific conclusion.
Its limitation is that it depends on the existence of established principles and on their suitability to take full account of the physical conditions in which the problem is set.There has to be a logical method, other than deduction, of deriving principles; problemscan only be solved if these principles assist prediction in the complex circumstances thatoccur naturally, as distinct from in laboratories and other environments controlled andrefined by man.
This other method of reaching a conclusion is called inductive reasoning or inference. A general principle is arrived at by recognising the pattern in a set of observations, and predictions are then made. That is to say, the general principle isinferred from the specific cases. It is comparable to a game where card players each play a card, then a bystander indicates who has won each round of play. The point of the gameis that each player tries to discover what the rules are.
The uses and nature of inference, intertwined with deduction, are shown by the following adaptation of a game described by Gardner (1969). Any number can play. Eachplayer draws a block of 7 × 7 squares. Each square is a discrete location in a small two-dimensional, timeless universe, and may be occupied by any one of four types ofphenomenon, characterised by the symbols +, O, #, * (Fig. 6.1). The distribution is known only to the designer, who has planned the universe before the game starts. Theaim of each competitor is to discover what symbol the designer has put in each square,that is, the complete distribution of symbols in the block of squares. Discovery can bemade by asking the designer what is present in any square, at any stage of the game,before the final scoring. Enquiry may be made as often as is preferred. Alternatively theplayer may infer what symbol is present; but whether rightly or wrongly is not confirmedtill the final scoring. A correct inference scores +1 and a mistake scores –1. The squares filled by asking the designer neither add to, nor detract from, the final score. This can
Geology for civil engineers 180
www.angoothachaap.blogspot.com
www.angoothachaap.blogspot.com
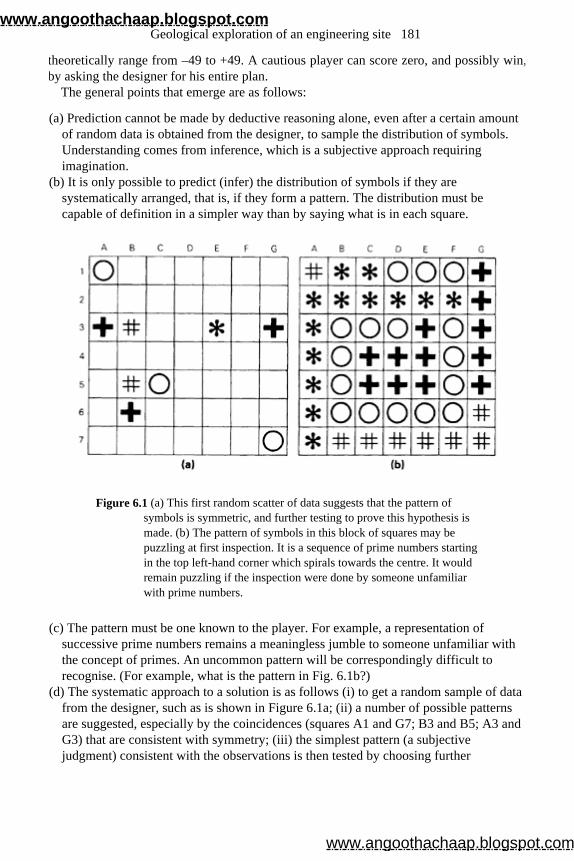
theoretically range from –49 to +49. A cautious player can score zero, and possibly win, by asking the designer for his entire plan.
The general points that emerge are as follows:
(a) Prediction cannot be made by deductive reasoning alone, even after a certain amount of random data is obtained from the designer, to sample the distribution of symbols. Understanding comes from inference, which is a subjective approach requiring imagination.
(b) It is only possible to predict (infer) the distribution of symbols if they are systematically arranged, that is, if they form a pattern. The distribution must be capable of definition in a simpler way than by saying what is in each square.
Figure 6.1 (a) This first random scatter of data suggests that the pattern of symbols is symmetric, and further testing to prove this hypothesis is made. (b) The pattern of symbols in this block of squares may be puzzling at first inspection. It is a sequence of prime numbers starting in the top left-hand corner which spirals towards the centre. It would remain puzzling if the inspection were done by someone unfamiliar with prime numbers.
(c) The pattern must be one known to the player. For example, a representation of successive prime numbers remains a meaningless jumble to someone unfamiliar with the concept of primes. An uncommon pattern will be correspondingly difficult to recognise. (For example, what is the pattern in Fig. 6.1b?)
(d) The systematic approach to a solution is as follows (i) to get a random sample of data from the designer, such as is shown in Figure 6.1a; (ii) a number of possible patterns are suggested, especially by the coincidences (squares A1 and G7; B3 and B5; A3 and G3) that are consistent with symmetry; (iii) the simplest pattern (a subjective judgment) consistent with the observations is then tested by choosing further
Geological exploration of an engineering site 181
www.angoothachaap.blogspot.com
www.angoothachaap.blogspot.com
information from the designer to prove its existence, and allow discrimination between it and other hypothetical patterns; (iv) feeling moderately certain because the new data are similar to what we predicted, the postulated pattern now becomes the guiding principle that allows us first to see what additional information from the designer is needed to define one symmetric segment of the pattern adequately, and secondly to predict the content of the remaining squares.
6.1.3 Systematic exploration of a site
The methodology of site exploration hangs on a framework of inductive reasoning similarto that used in the game described earlier. Geological information available at the start ofexploration is assessed against known patterns of rock distribution (that is, againststratigraphical and structural models). The working hypothesis obtained is then checkedby results acquired at later stages, and there is a progressive defining, and refining, of thegeological model. Choices, similar to those of the game, are offered to the player. He caninsure himself against a disastrous negative score by intensive checking. This may requirea profusion of drill holes, or even excavation of the entire site, and he may be defeated bya more skilled competitor. Successful exploration not only acquires all necessaryinformation about the subsurface, but does so as economically ac possible. Informationshould not be bought if existing data are available on file. A well-sited drill hole whichtests a geological model will be as informative as two or three randomly sited. Localdetail that is of little service in planning or costing an extended site should not be boughtat excessive cost.
The most elaborate exploration is needed for a large area where no systematicexploration or construction has been carried out, that is, an extended greenfield site.Systematic exploration may involve up to five procedural stages:
(1) preliminary investigation using published information and other existing data; (2) a detailed geological survey of the site, possibly with a photogeology study; (3) applied geophysical surveys as a reconnaissance of the subsurface geology; (4) boring, drilling and excavation to provide confirmation of the previous results, and
quantitative detail at critical points on the site; and (5) testing of soils and rocks to assess their suitability, particularly their mechanical
properties (soil mechanics and rock mechanics), either in situ or from samples.
In major projects all of these investigations may be carried out. In minor projects, orwhere the site is small and has previously been built on, only stages (4) and (5) may benecessary, together with (1), which is cheap and always worth doing. A report byDumbleton and West (1972a) is a useful and comprehensive guide to site investigation.
Geology for civil engineers 182
www.angoothachaap.blogspot.com
www.angoothachaap.blogspot.com
6.2 Preliminary investigation
6.2.1 Sources of information for UK site investigation
The first stage of investigation is to search for and study existing information. This maybe adequate for an initial estimate of feasibility, planning and costing of the project, andto plan the full exploration of the site. It provides a geological model which isprogressively refined by data from detailed surveys and drilling. It is referred to as a deskstudy.
The main sources of information are the following:
(a) The British Geological Survey (see Appendix C). The publications of most use to engineers are the 6 in: 1 mile and 1:10000 maps, and the District Memoirs. The Memoir describes the geology of the area covered by the 1 in: 1 mile (or 1:50000) map which encompasses the ground of the larger-scale map. Information about the rock types in the strata at any locality is obtained by referring to the section of the Memoir dealing with rocks of that age, and then to the specific area. Any lateral changes of sequence across an extended site may be inferred from comparing sequences of the same age at different localities. Attention is drawn to rocks of economic interest in the Generalised Section on the right-hand side of the map, and this may be supplemented by a brief account of mineral veins in the Memoir, or a fuller one in a special Economic Memoir dealing, for example, with a coalfield. This information provides warning that there might be old mineral workings or other disturbed ground (such as fill at the site of an old quarry) where coals, ironstones and fireclays come to outcrop. The other statutory duties of the BGS include acquisition and curating of information, such as borehole logs and measurements of the engineering properties of rocks.
It is important that, before any actual exploratory work is carried out on the site, the engineer assesses, by studying the BGS information available, any problems that are likely to be encountered. Since many 1:10000 geological sheets are not published, a preliminary study of a site should involve a visit to the nearest BGS offices, where unpublished maps can be made available for examination. The librarian at a BGS office will usually help in this, and Appendix C gives the addresses of the main BGS offices throughout the UK.
(b) National Coal Board Area Offices. Old coal workings present one of the most frequent problems affecting sites in industrial Britain. The problems increase as land previously rejected for building is reassessed by developers as part of larger schemes of rejuvenation. Coal has been mined in the UK from formations other than Upper Carboniferous Coal Measures. If coal-bearing strata crop out at the site, information about past and present extraction should be sought from the NCB. The Board holds mining plans on behalf of HM Inspectorate of Mines, and these can be inspected at the Area Offices. The catalogue of abandoned mines and plans, with supplements up to 1938, may be available there. Copies are rare, but are available in a few national libraries. The Estates Manager, NCB, will provide a copy of plans and a report, which
Geological exploration of an engineering site 183
www.angoothachaap.blogspot.com
www.angoothachaap.blogspot.com
offers no firm opinion on the site but is useful preliminary information, for a small fee. (c) Library of Health and Safety Division, Department of Energy, London. Information
about abandoned mineral workings other than coal must usually be sought from the Department of Energy. Their service is, however, only that of a reference library. The searcher must visit London and make what notes and tracings he or she requires.
Information about disturbed ground and the stability of areas, where the cause of possibletrouble precedes the 19th century laws about mining records, may be available from localarchives, libraries, private firms or individuals. A comprehensive study (see Appendix D)might include the following:
(d) The Ordnance Survey: to compare past and present site topography, including changes in benchmark levels.
(e) The British Museum: to study old maps and records (these may be available locally and should be sought there first).
(f) Local Authority Offices and local museums: for information about records of ground collapses.
(g) Local mining and engineering organisations.
Before committing himself to extensive research, the engineer should, however, considerwhether the information from these minor sources might not be obtained moreeconomically and quickly from investigation of the site itself.
6.2.2 Geology of the site
After the desk study has been completed, an assessment of the on-site geology must bemade before any geophysical work, drilling or rock testing is carried out.
First, the engineer or geological surveyor should be able to recognise and evaluate anylandforms (that is, characteristic shapes of the ground surface) that occur on the site. Thisallows him to trace boundaries across areas in which there are few outcrops, and to drawinferences about the distribution of solid rocks or superficial deposits concealed under acover of soil. Section 3.6 gives full details on landforms. In general, landforms producedby erosion of the land surface convey information about the distribution of the solidrocks, whereas landforms resulting from deposition are related to superficial deposits.Identification of landforms may be greatly assisted by a photogeology study. Airphotographs of the area (see Fig. 6.2) are obtained from an air survey, which is a meansof rapid reconnaissance of an extended site, such as a new road, and also provides abird’s-eye view that allows the geological interpreter to see each landform in its entirety,so making appreciation of its complete shape easier than it would be on the ground. He orshe is further assisted by the accentuation of relief produced by vertical exaggerationwhen he views photographs stereoscopically. The vegetation patterns and the tone andtexture (that is, the pattern of varied tone) often provide additional information about thenear-surface rocks, and in some cases about their water content. A survey done on colourfilm produces more data, but is more expensive. The rarer surveys employing infra-redphotography usually serve aims other than geological, but are a way of tackling such
Geology for civil engineers 184
www.angoothachaap.blogspot.com
www.angoothachaap.blogspot.com
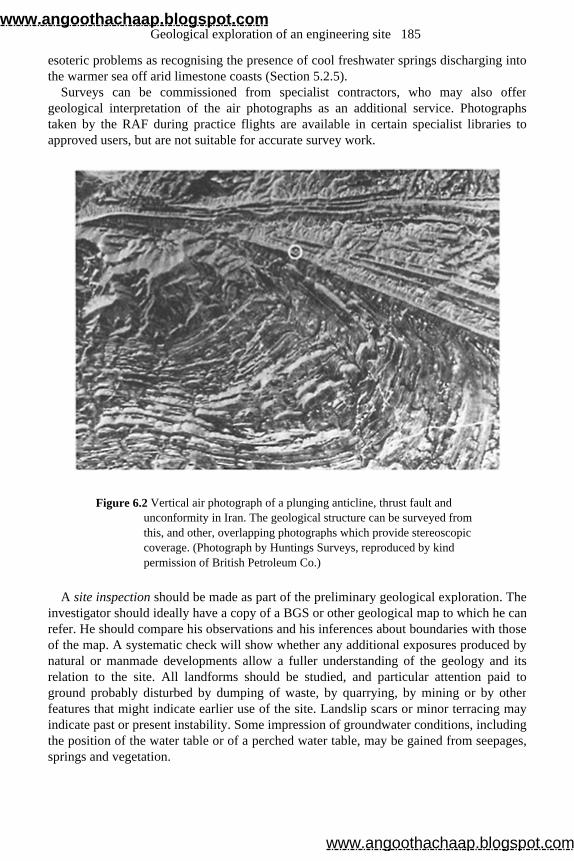
esoteric problems as recognising the presence of cool freshwater springs discharging intothe warmer sea off arid limestone coasts (Section 5.2.5).
Surveys can be commissioned from specialist contractors, who may also offer geological interpretation of the air photographs as an additional service. Photographstaken by the RAF during practice flights are available in certain specialist libraries toapproved users, but are not suitable for accurate survey work.
Figure 6.2 Vertical air photograph of a plunging anticline, thrust fault and unconformity in Iran. The geological structure can be surveyed from this, and other, overlapping photographs which provide stereoscopic coverage. (Photograph by Huntings Surveys, reproduced by kind permission of British Petroleum Co.)
A site inspection should be made as part of the preliminary geological exploration. The investigator should ideally have a copy of a BGS or other geological map to which he canrefer. He should compare his observations and his inferences about boundaries with thoseof the map. A systematic check will show whether any additional exposures produced bynatural or manmade developments allow a fuller understanding of the geology and itsrelation to the site. All landforms should be studied, and particular attention paid toground probably disturbed by dumping of waste, by quarrying, by mining or by otherfeatures that might indicate earlier use of the site. Landslip scars or minor terracing mayindicate past or present instability. Some impression of groundwater conditions, includingthe position of the water table or of a perched water table, may be gained from seepages,springs and vegetation.
Geological exploration of an engineering site 185
www.angoothachaap.blogspot.com
www.angoothachaap.blogspot.com
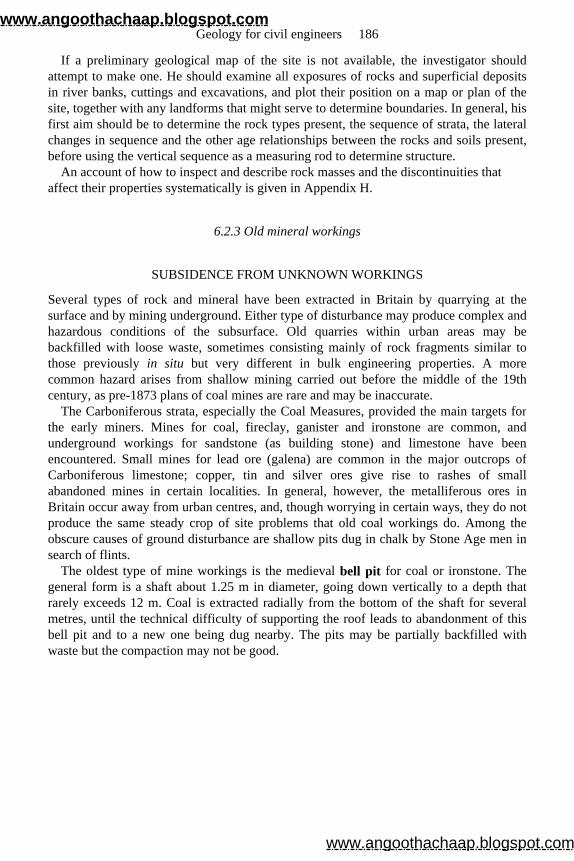
If a preliminary geological map of the site is not available, the investigator should attempt to make one. He should examine all exposures of rocks and superficial depositsin river banks, cuttings and excavations, and plot their position on a map or plan of thesite, together with any landforms that might serve to determine boundaries. In general, hisfirst aim should be to determine the rock types present, the sequence of strata, the lateralchanges in sequence and the other age relationships between the rocks and soils present,before using the vertical sequence as a measuring rod to determine structure.
An account of how to inspect and describe rock masses and the discontinuities that affect their properties systematically is given in Appendix H.
6.2.3 Old mineral workings
SUBSIDENCE FROM UNKNOWN WORKINGS
Several types of rock and mineral have been extracted in Britain by quarrying at thesurface and by mining underground. Either type of disturbance may produce complex andhazardous conditions of the subsurface. Old quarries within urban areas may bebackfilled with loose waste, sometimes consisting mainly of rock fragments similar tothose previously in situ but very different in bulk engineering properties. A morecommon hazard arises from shallow mining carried out before the middle of the 19thcentury, as pre-1873 plans of coal mines are rare and may be inaccurate.
The Carboniferous strata, especially the Coal Measures, provided the main targets for the early miners. Mines for coal, fireclay, ganister and ironstone are common, and underground workings for sandstone (as building stone) and limestone have beenencountered. Small mines for lead ore (galena) are common in the major outcrops ofCarboniferous limestone; copper, tin and silver ores give rise to rashes of smallabandoned mines in certain localities. In general, however, the metalliferous ores inBritain occur away from urban centres, and, though worrying in certain ways, they do notproduce the same steady crop of site problems that old coal workings do. Among theobscure causes of ground disturbance are shallow pits dug in chalk by Stone Age men insearch of flints.
The oldest type of mine workings is the medieval bell pit for coal or ironstone. The general form is a shaft about 1.25 m in diameter, going down vertically to a depth thatrarely exceeds 12 m. Coal is extracted radially from the bottom of the shaft for severalmetres, until the technical difficulty of supporting the roof leads to abandonment of thisbell pit and to a new one being dug nearby. The pits may be partially backfilled withwaste but the compaction may not be good.
Geology for civil engineers 186
www.angoothachaap.blogspot.com
www.angoothachaap.blogspot.com
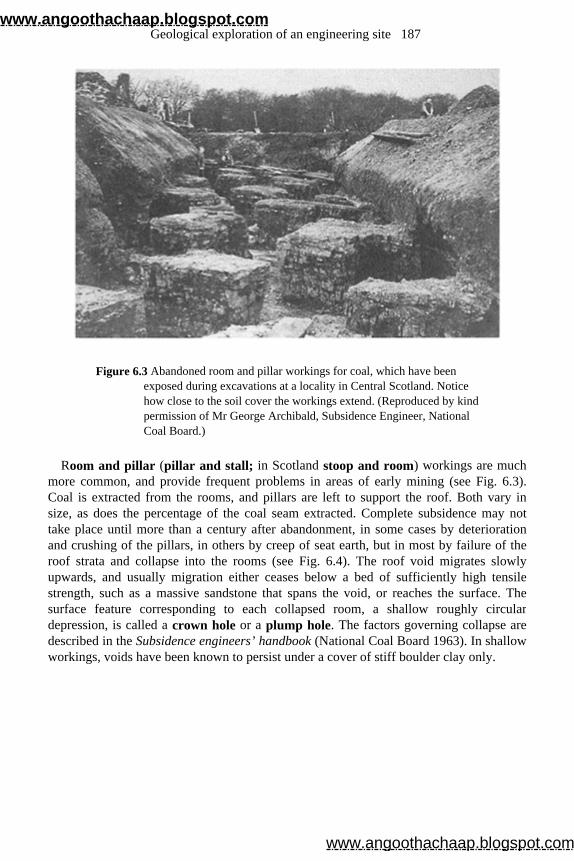
Figure 6.3 Abandoned room and pillar workings for coal, which have been exposed during excavations at a locality in Central Scotland. Notice how close to the soil cover the workings extend. (Reproduced by kind permission of Mr George Archibald, Subsidence Engineer, National Coal Board.)
Room and pillar (pillar and stall; in Scotland stoop and room) workings are much more common, and provide frequent problems in areas of early mining (see Fig. 6.3). Coal is extracted from the rooms, and pillars are left to support the roof. Both vary insize, as does the percentage of the coal seam extracted. Complete subsidence may nottake place until more than a century after abandonment, in some cases by deteriorationand crushing of the pillars, in others by creep of seat earth, but in most by failure of theroof strata and collapse into the rooms (see Fig. 6.4). The roof void migrates slowly upwards, and usually migration either ceases below a bed of sufficiently high tensilestrength, such as a massive sandstone that spans the void, or reaches the surface. Thesurface feature corresponding to each collapsed room, a shallow roughly circulardepression, is called a crown hole or a plump hole. The factors governing collapse are described in the Subsidence engineers’ handbook (National Coal Board 1963). In shallowworkings, voids have been known to persist under a cover of stiff boulder clay only.
Geological exploration of an engineering site 187
www.angoothachaap.blogspot.com
www.angoothachaap.blogspot.com
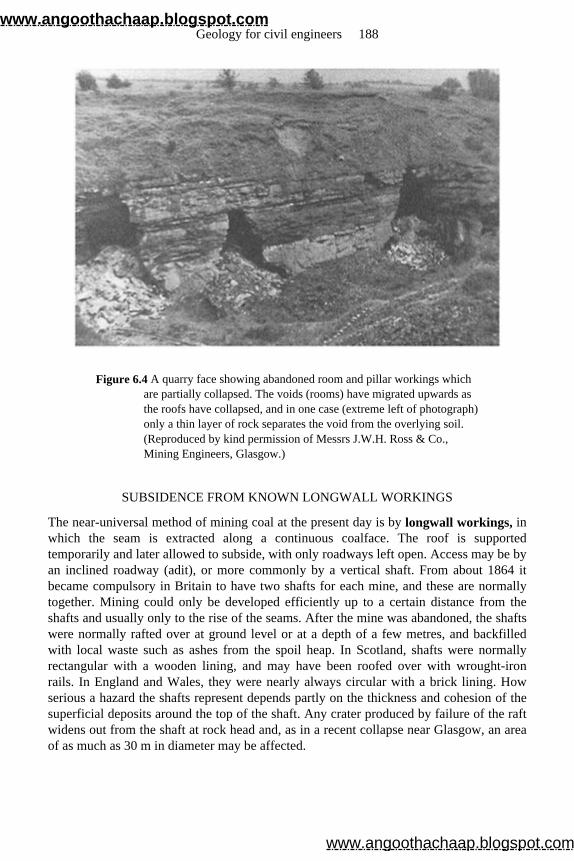
Figure 6.4 A quarry face showing abandoned room and pillar workings which are partially collapsed. The voids (rooms) have migrated upwards as the roofs have collapsed, and in one case (extreme left of photograph) only a thin layer of rock separates the void from the overlying soil. (Reproduced by kind permission of Messrs J.W.H. Ross & Co., Mining Engineers, Glasgow.)
SUBSIDENCE FROM KNOWN LONGWALL WORKINGS
The near-universal method of mining coal at the present day is by longwall workings, in which the seam is extracted along a continuous coalface. The roof is supportedtemporarily and later allowed to subside, with only roadways left open. Access may be byan inclined roadway (adit), or more commonly by a vertical shaft. From about 1864 itbecame compulsory in Britain to have two shafts for each mine, and these are normallytogether. Mining could only be developed efficiently up to a certain distance from theshafts and usually only to the rise of the seams. After the mine was abandoned, the shaftswere normally rafted over at ground level or at a depth of a few metres, and backfilledwith local waste such as ashes from the spoil heap. In Scotland, shafts were normallyrectangular with a wooden lining, and may have been roofed over with wrought-iron rails. In England and Wales, they were nearly always circular with a brick lining. Howserious a hazard the shafts represent depends partly on the thickness and cohesion of thesuperficial deposits around the top of the shaft. Any crater produced by failure of the raftwidens out from the shaft at rock head and, as in a recent collapse near Glasgow, an areaof as much as 30 m in diameter may be affected.
Geology for civil engineers 188
www.angoothachaap.blogspot.com
www.angoothachaap.blogspot.com
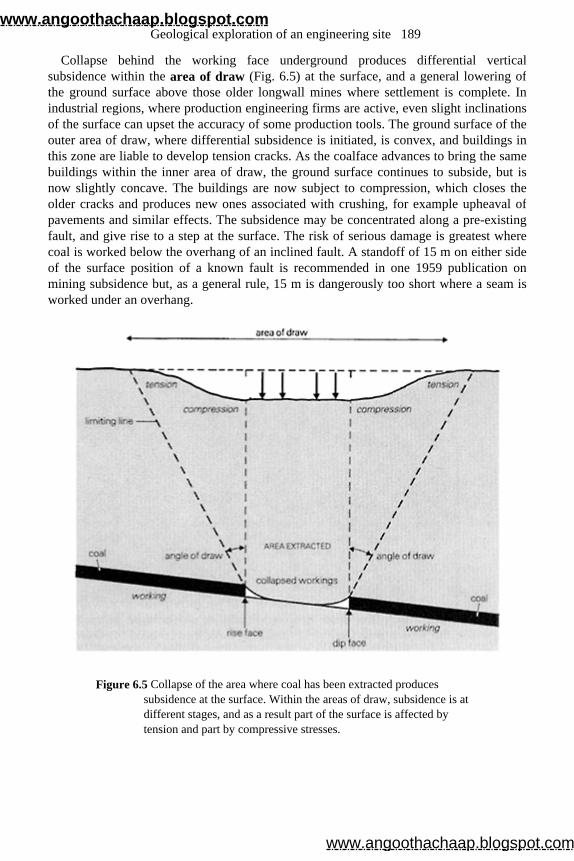
Collapse behind the working face underground produces differential verticalsubsidence within the area of draw (Fig. 6.5) at the surface, and a general lowering ofthe ground surface above those older longwall mines where settlement is complete. Inindustrial regions, where production engineering firms are active, even slight inclinationsof the surface can upset the accuracy of some production tools. The ground surface of theouter area of draw, where differential subsidence is initiated, is convex, and buildings inthis zone are liable to develop tension cracks. As the coalface advances to bring the samebuildings within the inner area of draw, the ground surface continues to subside, but isnow slightly concave. The buildings are now subject to compression, which closes theolder cracks and produces new ones associated with crushing, for example upheaval ofpavements and similar effects. The subsidence may be concentrated along a pre-existing fault, and give rise to a step at the surface. The risk of serious damage is greatest wherecoal is worked below the overhang of an inclined fault. A standoff of 15 m on either sideof the surface position of a known fault is recommended in one 1959 publication onmining subsidence but, as a general rule, 15 m is dangerously too short where a seam isworked under an overhang.
Figure 6.5 Collapse of the area where coal has been extracted produces subsidence at the surface. Within the areas of draw, subsidence is at different stages, and as a result part of the surface is affected by tension and part by compressive stresses.
Geological exploration of an engineering site 189
www.angoothachaap.blogspot.com
www.angoothachaap.blogspot.com
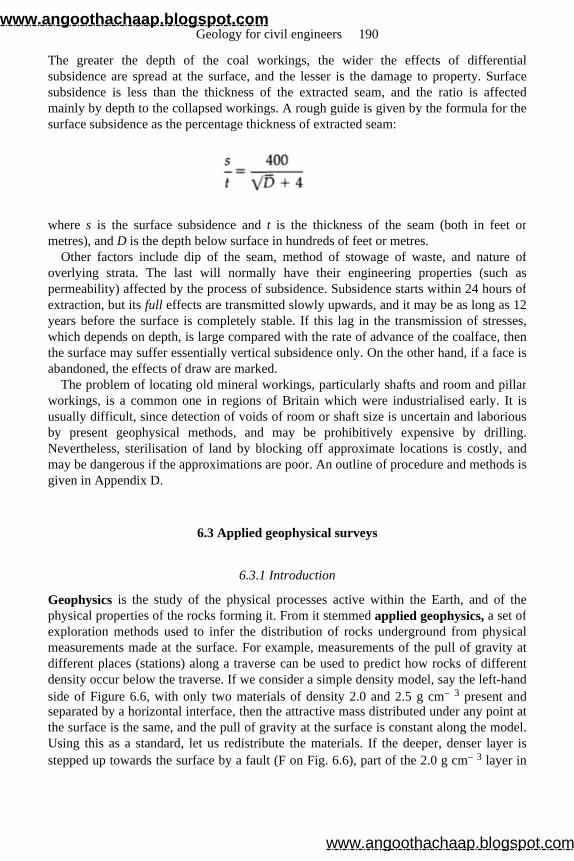
The greater the depth of the coal workings, the wider the effects of differentialsubsidence are spread at the surface, and the lesser is the damage to property. Surfacesubsidence is less than the thickness of the extracted seam, and the ratio is affectedmainly by depth to the collapsed workings. A rough guide is given by the formula for thesurface subsidence as the percentage thickness of extracted seam:
where s is the surface subsidence and t is the thickness of the seam (both in feet or metres), and D is the depth below surface in hundreds of feet or metres.
Other factors include dip of the seam, method of stowage of waste, and nature ofoverlying strata. The last will normally have their engineering properties (such aspermeability) affected by the process of subsidence. Subsidence starts within 24 hours ofextraction, but its full effects are transmitted slowly upwards, and it may be as long as 12 years before the surface is completely stable. If this lag in the transmission of stresses,which depends on depth, is large compared with the rate of advance of the coalface, thenthe surface may suffer essentially vertical subsidence only. On the other hand, if a face isabandoned, the effects of draw are marked.
The problem of locating old mineral workings, particularly shafts and room and pillar workings, is a common one in regions of Britain which were industrialised early. It isusually difficult, since detection of voids of room or shaft size is uncertain and laboriousby present geophysical methods, and may be prohibitively expensive by drilling.Nevertheless, sterilisation of land by blocking off approximate locations is costly, andmay be dangerous if the approximations are poor. An outline of procedure and methods isgiven in Appendix D.
6.3 Applied geophysical surveys
6.3.1 Introduction
Geophysics is the study of the physical processes active within the Earth, and of the physical properties of the rocks forming it. From it stemmed applied geophysics, a set of exploration methods used to infer the distribution of rocks underground from physicalmeasurements made at the surface. For example, measurements of the pull of gravity atdifferent places (stations) along a traverse can be used to predict how rocks of differentdensity occur below the traverse. If we consider a simple density model, say the left-hand side of Figure 6.6, with only two materials of density 2.0 and 2.5 g cm– 3 present and separated by a horizontal interface, then the attractive mass distributed under any point atthe surface is the same, and the pull of gravity at the surface is constant along the model.Using this as a standard, let us redistribute the materials. If the deeper, denser layer isstepped up towards the surface by a fault (F on Fig. 6.6), part of the 2.0 g cm– 3 layer in
Geology for civil engineers 190
www.angoothachaap.blogspot.com
www.angoothachaap.blogspot.com
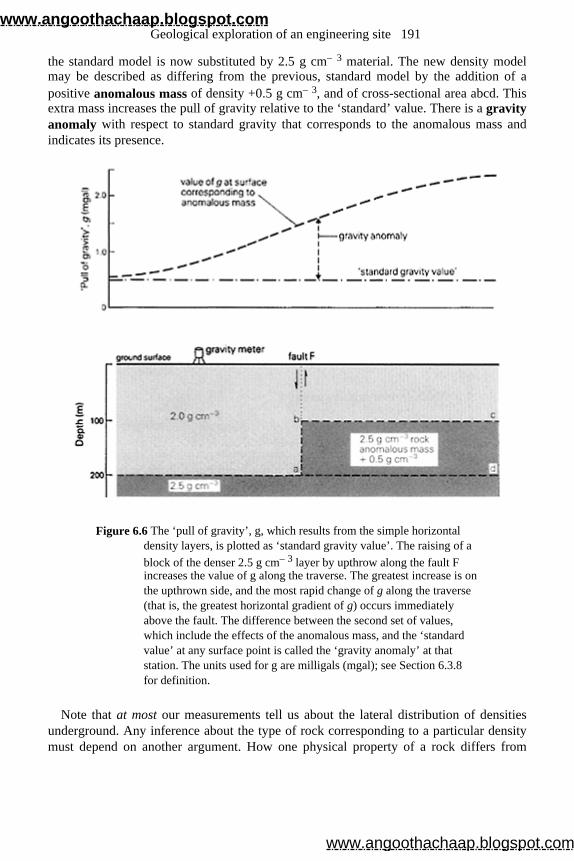
the standard model is now substituted by 2.5 g cm– 3 material. The new density model may be described as differing from the previous, standard model by the addition of apositive anomalous mass of density +0.5 g cm– 3, and of cross-sectional area abcd. This extra mass increases the pull of gravity relative to the ‘standard’ value. There is a gravity anomaly with respect to standard gravity that corresponds to the anomalous mass and indicates its presence.
Figure 6.6 The ‘pull of gravity’, g, which results from the simple horizontal density layers, is plotted as ‘standard gravity value’. The raising of a block of the denser 2.5 g cm– 3 layer by upthrow along the fault F increases the value of g along the traverse. The greatest increase is on the upthrown side, and the most rapid change of g along the traverse (that is, the greatest horizontal gradient of g) occurs immediately above the fault. The difference between the second set of values, which include the effects of the anomalous mass, and the ‘standard value’ at any surface point is called the ‘gravity anomaly’ at that station. The units used for g are milligals (mgal); see Section 6.3.8 for definition.
Note that at most our measurements tell us about the lateral distribution of densitiesunderground. Any inference about the type of rock corresponding to a particular densitymust depend on another argument. How one physical property of a rock differs from
Geological exploration of an engineering site 191
www.angoothachaap.blogspot.com
www.angoothachaap.blogspot.com
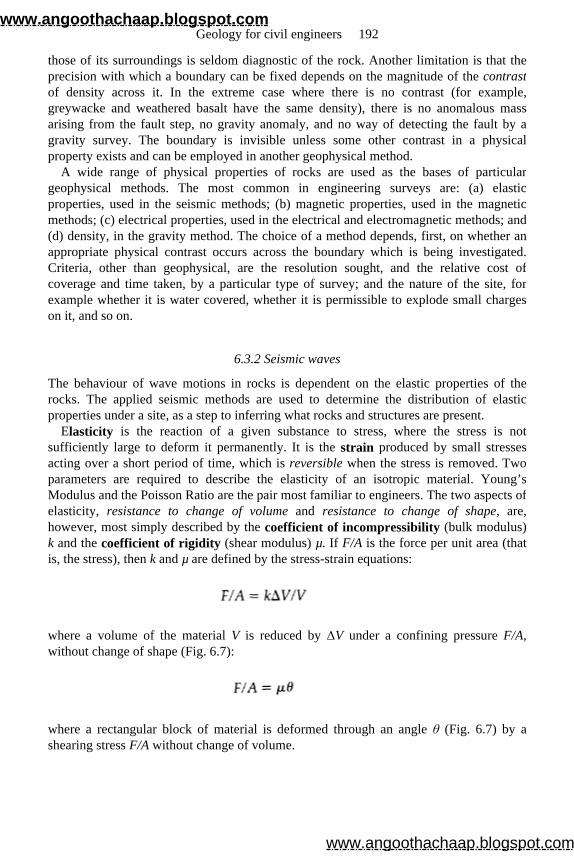
those of its surroundings is seldom diagnostic of the rock. Another limitation is that theprecision with which a boundary can be fixed depends on the magnitude of the contrastof density across it. In the extreme case where there is no contrast (for example,greywacke and weathered basalt have the same density), there is no anomalous massarising from the fault step, no gravity anomaly, and no way of detecting the fault by agravity survey. The boundary is invisible unless some other contrast in a physicalproperty exists and can be employed in another geophysical method.
A wide range of physical properties of rocks are used as the bases of particulargeophysical methods. The most common in engineering surveys are: (a) elasticproperties, used in the seismic methods; (b) magnetic properties, used in the magneticmethods; (c) electrical properties, used in the electrical and electromagnetic methods; and(d) density, in the gravity method. The choice of a method depends, first, on whether anappropriate physical contrast occurs across the boundary which is being investigated.Criteria, other than geophysical, are the resolution sought, and the relative cost ofcoverage and time taken, by a particular type of survey; and the nature of the site, for example whether it is water covered, whether it is permissible to explode small chargeson it, and so on.
6.3.2 Seismic waves
The behaviour of wave motions in rocks is dependent on the elastic properties of therocks. The applied seismic methods are used to determine the distribution of elasticproperties under a site, as a step to inferring what rocks and structures are present.
Elasticity is the reaction of a given substance to stress, where the stress is not sufficiently large to deform it permanently. It is the strain produced by small stresses acting over a short period of time, which is reversible when the stress is removed. Two parameters are required to describe the elasticity of an isotropic material. Young’s Modulus and the Poisson Ratio are the pair most familiar to engineers. The two aspects ofelasticity, resistance to change of volume and resistance to change of shape, are, however, most simply described by the coefficient of incompressibility (bulk modulus) k and the coefficient of rigidity (shear modulus) µ. If F/A is the force per unit area (that is, the stress), then k and µ are defined by the stress-strain equations:
where a volume of the material V is reduced by ∆V under a confining pressure F/A, without change of shape (Fig. 6.7):
where a rectangular block of material is deformed through an angle θ (Fig. 6.7) by a shearing stress F/A without change of volume.
Geology for civil engineers 192
www.angoothachaap.blogspot.com
www.angoothachaap.blogspot.com
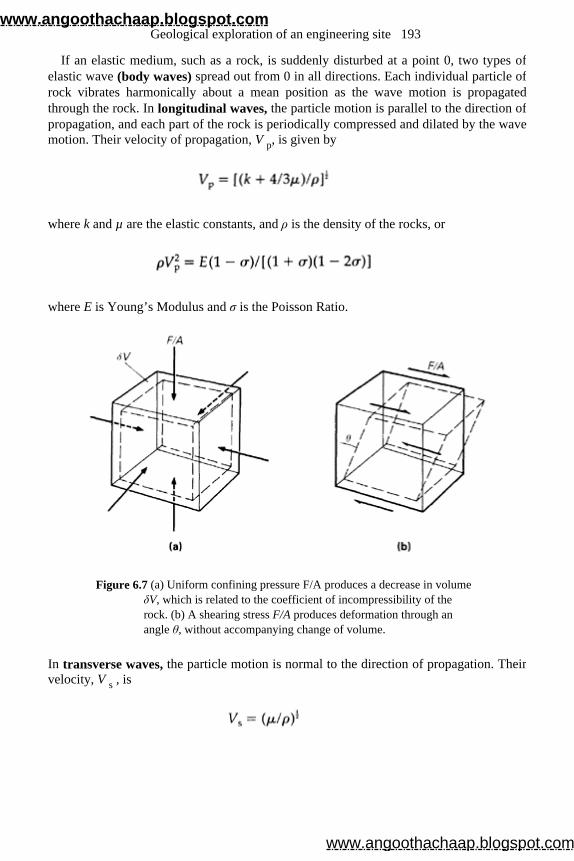
If an elastic medium, such as a rock, is suddenly disturbed at a point 0, two types of elastic wave (body waves) spread out from 0 in all directions. Each individual particle ofrock vibrates harmonically about a mean position as the wave motion is propagatedthrough the rock. In longitudinal waves, the particle motion is parallel to the direction of propagation, and each part of the rock is periodically compressed and dilated by the wavemotion. Their velocity of propagation, V p, is given by
where k and µ are the elastic constants, and ρ is the density of the rocks, or
where E is Young’s Modulus and σ is the Poisson Ratio.
Figure 6.7 (a) Uniform confining pressure F/A produces a decrease in volume δV, which is related to the coefficient of incompressibility of the rock. (b) A shearing stress F/A produces deformation through an angle θ, without accompanying change of volume.
In transverse waves, the particle motion is normal to the direction of propagation. Their velocity, V s , is
Geological exploration of an engineering site 193
www.angoothachaap.blogspot.com
www.angoothachaap.blogspot.com
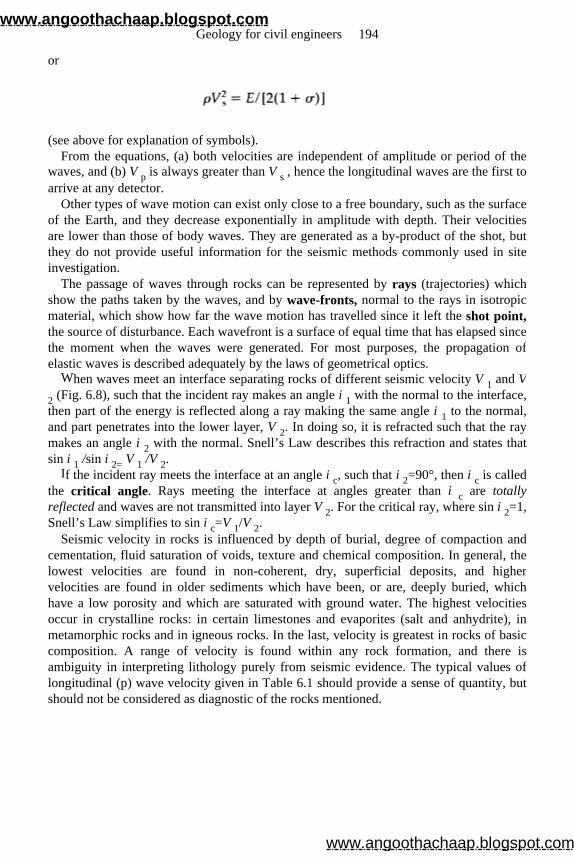
or
(see above for explanation of symbols). From the equations, (a) both velocities are independent of amplitude or period of the
waves, and (b) V p is always greater than V s , hence the longitudinal waves are the first to arrive at any detector.
Other types of wave motion can exist only close to a free boundary, such as the surfaceof the Earth, and they decrease exponentially in amplitude with depth. Their velocitiesare lower than those of body waves. They are generated as a by-product of the shot, but they do not provide useful information for the seismic methods commonly used in siteinvestigation.
The passage of waves through rocks can be represented by rays (trajectories) which show the paths taken by the waves, and by wave-fronts, normal to the rays in isotropic material, which show how far the wave motion has travelled since it left the shot point,the source of disturbance. Each wavefront is a surface of equal time that has elapsed sincethe moment when the waves were generated. For most purposes, the propagation ofelastic waves is described adequately by the laws of geometrical optics.
When waves meet an interface separating rocks of different seismic velocity V 1 and V2 (Fig. 6.8), such that the incident ray makes an angle i 1 with the normal to the interface, then part of the energy is reflected along a ray making the same angle i 1 to the normal, and part penetrates into the lower layer, V 2. In doing so, it is refracted such that the raymakes an angle i 2 with the normal. Snell’s Law describes this refraction and states that sin i 1 /sin i 2= V 1 /V 2.
If the incident ray meets the interface at an angle i c, such that i 2=90°, then i c is called the critical angle. Rays meeting the interface at angles greater than i c are totally reflected and waves are not transmitted into layer V 2. For the critical ray, where sin i 2=1, Snell’s Law simplifies to sin i c=V 1/V 2.
Seismic velocity in rocks is influenced by depth of burial, degree of compaction and cementation, fluid saturation of voids, texture and chemical composition. In general, thelowest velocities are found in non-coherent, dry, superficial deposits, and higher velocities are found in older sediments which have been, or are, deeply buried, whichhave a low porosity and which are saturated with ground water. The highest velocitiesoccur in crystalline rocks: in certain limestones and evaporites (salt and anhydrite), inmetamorphic rocks and in igneous rocks. In the last, velocity is greatest in rocks of basiccomposition. A range of velocity is found within any rock formation, and there isambiguity in interpreting lithology purely from seismic evidence. The typical values oflongitudinal (p) wave velocity given in Table 6.1 should provide a sense of quantity, butshould not be considered as diagnostic of the rocks mentioned.
Geology for civil engineers 194
www.angoothachaap.blogspot.com
www.angoothachaap.blogspot.com
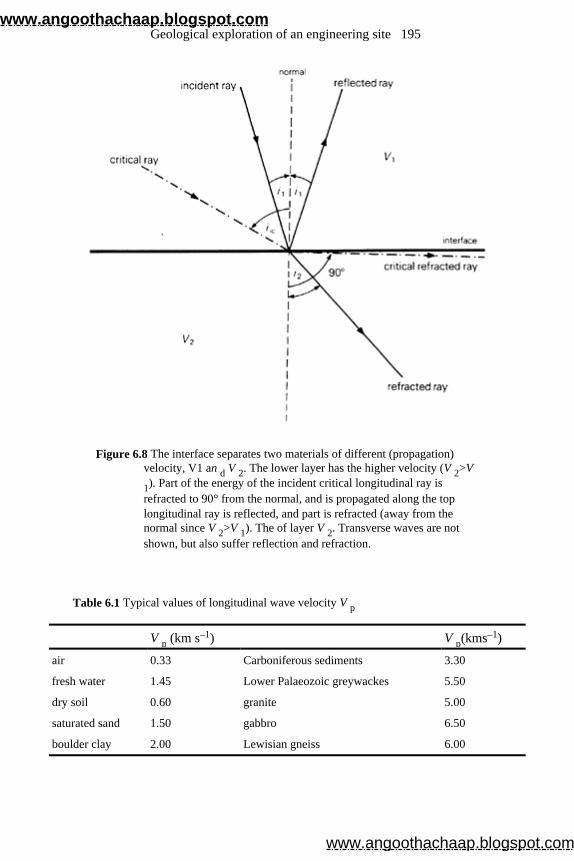
Figure 6.8 The interface separates two materials of different (propagation) velocity, V1 an d V 2. The lower layer has the higher velocity (V 2>V 1). Part of the energy of the incident critical longitudinal ray is refracted to 90° from the normal, and is propagated along the top longitudinal ray is reflected, and part is refracted (away from the normal since V 2>V 1). The of layer V 2. Transverse waves are not shown, but also suffer reflection and refraction.
Table 6.1 Typical values of longitudinal wave velocity V p
V p (km s–1) V p(kms–1)
air 0.33 Carboniferous sediments 3.30
fresh water 1.45 Lower Palaeozoic greywackes 5.50
dry soil 0.60 granite 5.00
saturated sand 1.50 gabbro 6.50
boulder clay 2.00 Lewisian gneiss 6.00
Geological exploration of an engineering site 195
www.angoothachaap.blogspot.com
www.angoothachaap.blogspot.com
6.3.3 Seismic-refraction method
In the applied seismic methods, waves are generated at a shot point usually by firing off asmall explosive charge electrically or, in adaptations of the method, by dropping a weightor by hitting a metal plate with a sledgehammer. The arrival of the waves at variousstations on a line of traverse is detected by seismometers planted at the surface, or by hydrophones in water-covered areas. These convert ground or water motions into avarying electrical current. This is transmitted along wires linking each detector to aseismograph, where the output from each channel is amplified and recorded. On the seismic record (seismogram), the ground motion at each detector is represented by a lineof wiggles on one trace of the record. The time taken by the waves as they followdifferent paths between shot point and detector can be measured as the moment ofexplosion, and time marks (usually at 0.01 s) are recorded also.
In the simplest and most commonly used seismic-refraction method (Fig. 6.9), only the times of the first pulse of energy to arrive at each detector are used. For this reason,seismic-refraction apparatus is simpler and cheaper than that needed for seismic-reflection surveys, in which more complex electronic equipment is essential to give auseful record of later, reflected arrivals. The first arrivals at detectors close to the shot point travel directly along the ground surface. A plot of arrival times (T) against distance (X) of each corresponding detector from the shot point gives a straight line. Its gradient isthe reciprocal of the velocity (V 1) of the rock at the surface. If the rock layer below layerV 1 has a higher velocity V 2, there is a critically refracted ray which travels along the topof V 2. If layers V 1 and V 2 are coupled mechanically, such that the top of V 2 cannot vibrate without exciting waves at the base of V 1 (and this is the natural state of subsurface rocks), then waves pass through the interface from layer V 2 to V 1, and in the process are refracted to continue towards the surface at an angle i c to the normal. Paths of this type (where the ray first plunges through layer V 1 at the critical angle, then the wave travels rapidly along the top of refractor V 2, emerging through layer V 1 at the critical angle) gradually overtake the direct ray. The delay in going down to and up fromV 2 is compensated as X increases by faster travel through the refractor. Critically refracted compressional waves eventually become the first to arrive at the detectorsbeyond a particular value of X. The gradient of the T-X values of these arrivals bears a simple relation to the velocity of a horizontal refractor. The depth d 1 from surface to interface may be obtained from the T-X graph, using the equation
Geology for civil engineers 196
www.angoothachaap.blogspot.com
www.angoothachaap.blogspot.com
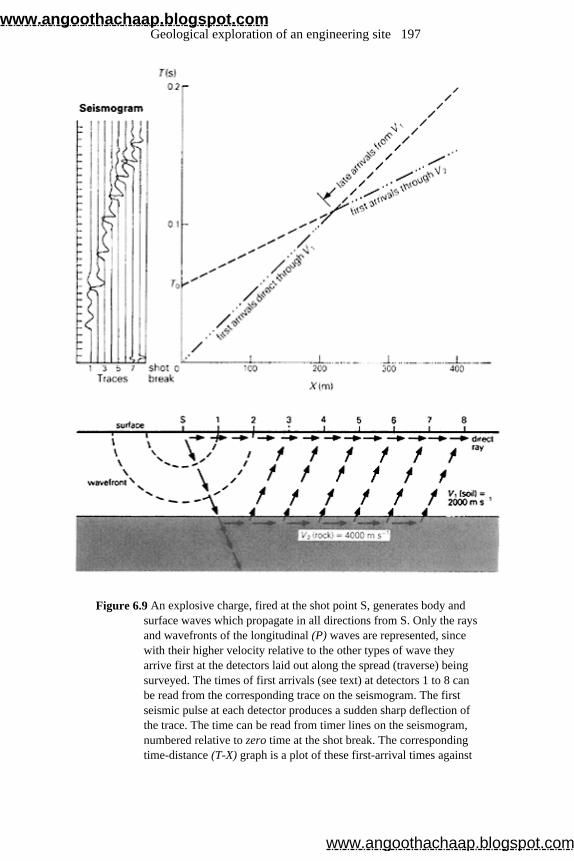
Figure 6.9 An explosive charge, fired at the shot point S, generates body and surface waves which propagate in all directions from S. Only the rays and wavefronts of the longitudinal (P) waves are represented, since with their higher velocity relative to the other types of wave they arrive first at the detectors laid out along the spread (traverse) being surveyed. The times of first arrivals (see text) at detectors 1 to 8 can be read from the corresponding trace on the seismogram. The first seismic pulse at each detector produces a sudden sharp deflection of the trace. The time can be read from timer lines on the seismogram, numbered relative to zero time at the shot break. The corresponding time-distance (T-X) graph is a plot of these first-arrival times against
Geological exploration of an engineering site 197
www.angoothachaap.blogspot.com
www.angoothachaap.blogspot.com
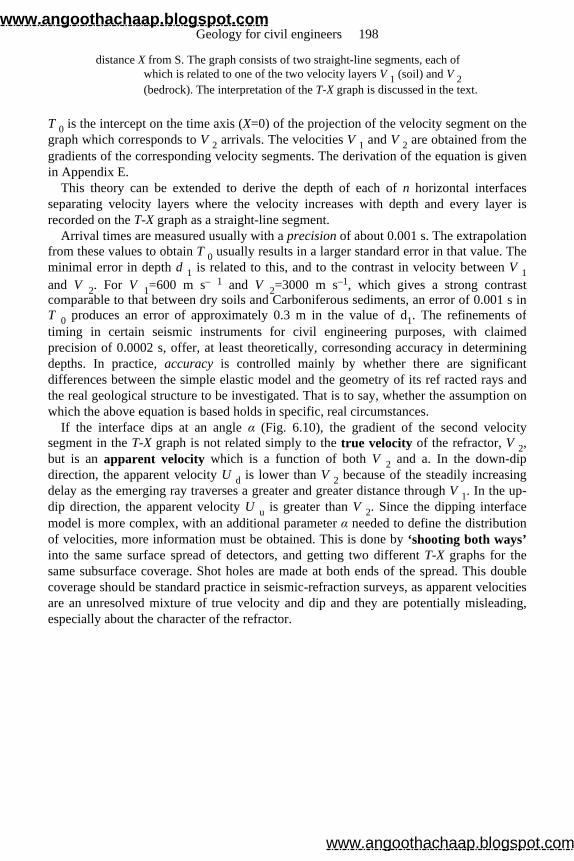
distance X from S. The graph consists of two straight-line segments, each of which is related to one of the two velocity layers V 1 (soil) and V 2 (bedrock). The interpretation of the T-X graph is discussed in the text.
T 0 is the intercept on the time axis (X=0) of the projection of the velocity segment on thegraph which corresponds to V 2 arrivals. The velocities V 1 and V 2 are obtained from the gradients of the corresponding velocity segments. The derivation of the equation is givenin Appendix E.
This theory can be extended to derive the depth of each of n horizontal interfaces separating velocity layers where the velocity increases with depth and every layer isrecorded on the T-X graph as a straight-line segment.
Arrival times are measured usually with a precision of about 0.001 s. The extrapolation from these values to obtain T 0 usually results in a larger standard error in that value. Theminimal error in depth d 1 is related to this, and to the contrast in velocity between V 1and V 2. For V 1=600 m s– 1 and V 2=3000 m s–1, which gives a strong contrast comparable to that between dry soils and Carboniferous sediments, an error of 0.001 s inT 0 produces an error of approximately 0.3 m in the value of d1. The refinements of timing in certain seismic instruments for civil engineering purposes, with claimedprecision of 0.0002 s, offer, at least theoretically, corresonding accuracy in determiningdepths. In practice, accuracy is controlled mainly by whether there are significant differences between the simple elastic model and the geometry of its ref racted rays andthe real geological structure to be investigated. That is to say, whether the assumption onwhich the above equation is based holds in specific, real circumstances.
If the interface dips at an angle α (Fig. 6.10), the gradient of the second velocitysegment in the T-X graph is not related simply to the true velocity of the refractor, V 2, but is an apparent velocity which is a function of both V 2 and a. In the down-dip direction, the apparent velocity U d is lower than V 2 because of the steadily increasing delay as the emerging ray traverses a greater and greater distance through V 1. In the up-dip direction, the apparent velocity U u is greater than V 2. Since the dipping interface model is more complex, with an additional parameter α needed to define the distribution of velocities, more information must be obtained. This is done by ‘shooting both ways’ into the same surface spread of detectors, and getting two different T-X graphs for the same subsurface coverage. Shot holes are made at both ends of the spread. This doublecoverage should be standard practice in seismic-refraction surveys, as apparent velocities are an unresolved mixture of true velocity and dip and they are potentially misleading,especially about the character of the refractor.
Geology for civil engineers 198
www.angoothachaap.blogspot.com
www.angoothachaap.blogspot.com
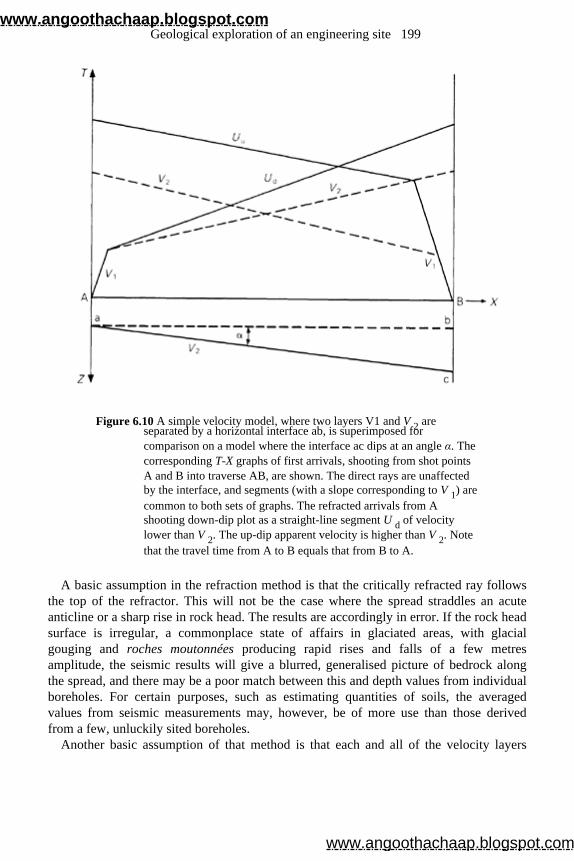
Figure 6.10 A simple velocity model, where two layers V1 and V 2 are separated by a horizontal interface ab, is superimposed for comparison on a model where the interface ac dips at an angle α. The corresponding T-X graphs of first arrivals, shooting from shot points A and B into traverse AB, are shown. The direct rays are unaffected by the interface, and segments (with a slope corresponding to V 1) are common to both sets of graphs. The refracted arrivals from A shooting down-dip plot as a straight-line segment U d of velocity lower than V 2. The up-dip apparent velocity is higher than V 2. Note that the travel time from A to B equals that from B to A.
A basic assumption in the refraction method is that the critically refracted ray followsthe top of the refractor. This will not be the case where the spread straddles an acuteanticline or a sharp rise in rock head. The results are accordingly in error. If the rock headsurface is irregular, a commonplace state of affairs in glaciated areas, with glacialgouging and roches moutonnées producing rapid rises and falls of a few metres amplitude, the seismic results will give a blurred, generalised picture of bedrock alongthe spread, and there may be a poor match between this and depth values from individualboreholes. For certain purposes, such as estimating quantities of soils, the averagedvalues from seismic measurements may, however, be of more use than those derived from a few, unluckily sited boreholes.
Another basic assumption of that method is that each and all of the velocity layers
Geological exploration of an engineering site 199
www.angoothachaap.blogspot.com
www.angoothachaap.blogspot.com
present in the model are recorded as a segment on the T-X graph, and hence that the distribution of velocity with depth above the principal refractor (usually bedrock in siteexploration) can be determined from the graph. This is not always the case. Theconversion of measured times to depths to the refractor is dependent on this velocitydistribution. If, however, there is a decrease of velocity with depth across any interface(that is, a low-velocity layer is present in the subsurface), then critical refraction does not take place, and there are no refracted arrivals through that layer. The velocity distributioninferred from the T-X graph is in error. If the layer is of uniform thickness, then the refractor is plotted systematically too deep. Its shape is almost correct, but effectively thevertical scale of the cross section is wrong. Some independent check on velocitydistribution, or of scale, is essential. This is most simply, and most commonly, done byintegrating seismic-refraction traverses and borings into one exploration programme. Aboring provides not only greater accuracy at a key point, but also a measure of the‘scaling error’ of the seismic profile around it. Geological conditions likely to give rise to a low-velocity layer above rock head include a raised beach where estuarine clays rest onpeat, or a sub-arctic region of thick soils where the ground water near the surface is frozen, or where boulder clay rests on sand and gravel.
The seismic-refraction method is commonly used in site exploration to determine depthto rock head in a reconnaissance survey, or in an area where boring is difficult orforbidden.
Some engineering properties of the bedrock may be inferred from its velocity. This is used empirically as a crude measure (‘rippability’, Section 7.2.2) of suitability of the rock for extraction by a caterpillar tractor ‘ripper’. If density and V p and V s are known, the bulk elastic properties in situ can be derived, for example below a dam site. Fielddeterminations of velocity differ in value from those made in the laboratory using smallcoherent specimens of the same rock. The ratio of the in situ value to the laboratory value is called the fracture index (F), and is a measure of fracturing of the rock mass. F is acriterion used to recognise areas of rock of poor quality for foundations so that the intakeof grout into broken rock can be assessed, and it can be correlated with core recovery. If aborehole geophone (seismometer) is used to make a velocity log of a drilled hole, the time delay across a fracture may be observed and the fracture pinpointed. This techniquehas been used to locate major joints which affect the stability of a rock f ace, and whichneed to be rock bolted.
6.3.4 Seismic-reflection method
The physical property that controls the amplitude (and hence clarity on a seismogram) ofa reflection is acoustic impedance, ρV, the product of density and seismic velocity of the rock. The ratio of the amplitude of the reflected wave to that of the incident wave iscalled the reflectivity, R, at an interface. It is related to the contrast of acousticimpedance and to the angle of incidence. For incidence normal to the interface, we have
Geology for civil engineers 200
www.angoothachaap.blogspot.com
www.angoothachaap.blogspot.com
where ρ 1 V 1 is the acoustic impedance of the upper layer and ρ 2 V 2 that of the lower layer. If the lower layer 2 has a greater acoustic impedance, there is no phase change onreflection. If, however, it has a lesser acoustic impedance, the reflected wave suffers aphase inversion. That is, if the reflection from an interface where ρ 2 V 2 is greater than ρ1 V 1 appears as a peak on a seismogram, the reflection from an interface where ρ 1 V 1 is greater would have the same amplitude, but record as a trough. As a result reflectionsfrom the top and bottom of a limestone interbedded in shales, which is thin comparedwith the wavelength of the seismic waves being used, interfere destructively with oneanother. The layer could only be located by higher-frequency waves of shorter wavelength. In effect, small objects, of fine detail, cannot be detected by waves longerthan their dimensions. The resolution in locating larger objects is at best about one-quarter of a wavelength and in some cases, especially sparker surveys (see below), isseveral times worse because of the slow decay of the source pulse oscillation. Thesearguments for using high-frequency seismic waves must be balanced, however, against their limited penetration. They are reflected and scattered as they meet minor structureswhich longer waves ignore, and are rapidly attenuated in comparison with lower-frequency waves.
The geometry of the reflection method is simple. There are only two elements of path from shot point to geophone—an incident ray to, and a reflected ray from, the interface. If the average velocity between surface and a horizontal interface is and the depth is Z,then at a seismometer at distance X from the shot point we have
For normal incidence, where X=0, this simplifies to Z= T/2. Reflected waves are the basis of the best systems of detection, for example when light
waves are used in human sight, or when seismic waves are used in applied geophysics.The seismic-reflection methods yield the least ambiguous answers, and the highestresolution in locating interfaces, but only where structural complexity does not produce sudden and unpredictable lateral changes in the distribution of velocity . They have been developed and refined by af fluent patrons, the petroleum companies, to serve astheir principal tool of exploration. Much of this work is done by large contractors whooffer this one special service. Their techniques, as evolved to investigate depths of a fewkilometres, and the large structures in which petroleum occurs, use frequencies in therange 10–100 Hz and are unsuitable for nearly all engineering purposes. Therequirements of exploration at most sites are: (a) penetration of less than 100 m, (b) highresolution, (c) simple logistics, and (d) modest costs.
These have been met to a large extent for surveys of water-covered areas by
Geological exploration of an engineering site 201
www.angoothachaap.blogspot.com
www.angoothachaap.blogspot.com
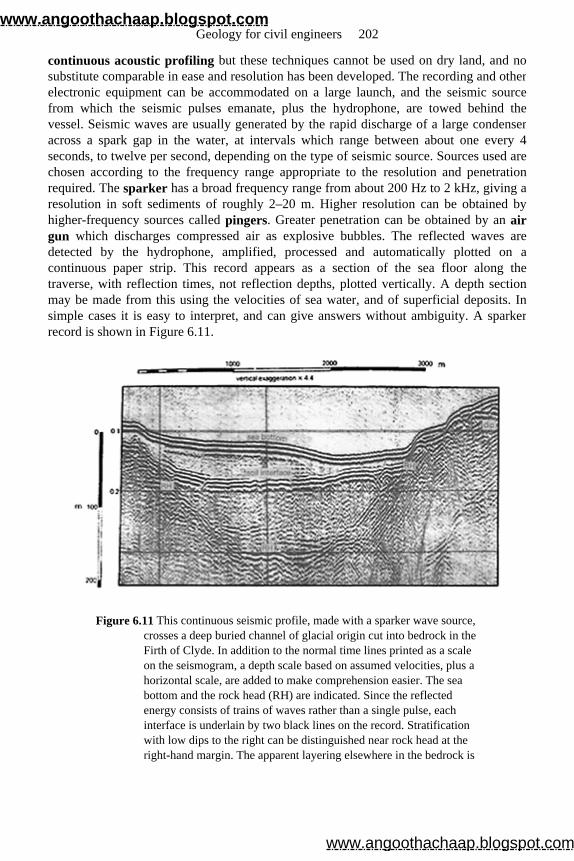
continuous acoustic profiling but these techniques cannot be used on dry land, and nosubstitute comparable in ease and resolution has been developed. The recording and otherelectronic equipment can be accommodated on a large launch, and the seismic sourcefrom which the seismic pulses emanate, plus the hydrophone, are towed behind thevessel. Seismic waves are usually generated by the rapid discharge of a large condenseracross a spark gap in the water, at intervals which range between about one every 4seconds, to twelve per second, depending on the type of seismic source. Sources used arechosen according to the frequency range appropriate to the resolution and penetrationrequired. The sparker has a broad frequency range from about 200 Hz to 2 kHz, giving a resolution in soft sediments of roughly 2–20 m. Higher resolution can be obtained by higher-frequency sources called pingers. Greater penetration can be obtained by an air gun which discharges compressed air as explosive bubbles. The reflected waves aredetected by the hydrophone, amplified, processed and automatically plotted on acontinuous paper strip. This record appears as a section of the sea floor along thetraverse, with reflection times, not reflection depths, plotted vertically. A depth sectionmay be made from this using the velocities of sea water, and of superficial deposits. Insimple cases it is easy to interpret, and can give answers without ambiguity. A sparkerrecord is shown in Figure 6.11.
Figure 6.11 This continuous seismic profile, made with a sparker wave source, crosses a deep buried channel of glacial origin cut into bedrock in the Firth of Clyde. In addition to the normal time lines printed as a scale on the seismogram, a depth scale based on assumed velocities, plus a horizontal scale, are added to make comprehension easier. The sea bottom and the rock head (RH) are indicated. Since the reflected energy consists of trains of waves rather than a single pulse, each interface is underlain by two black lines on the record. Stratification with low dips to the right can be distinguished near rock head at the right-hand margin. The apparent layering elsewhere in the bedrock is
Geology for civil engineers 202
www.angoothachaap.blogspot.com
www.angoothachaap.blogspot.com
spurious, and results from reverberations in the water. The sedimentary infill of the channel is of two types, separated by a regular, distinct bedding plane. The nature of the infill may be surmised from a knowledge of regional geology, but can be proved only by drilling and sampling.
6.3.5 Seismic surveys: case history
As part of the Lake Winnipeg Regulation Project (Prior & Mann 1972), an 8-mile channel and a 2-mile channel were needed to supplement natural outflow. It was intended to remove 30 million cubic metres of soil by dredging, and it was essential in selecting aroute that rock (Precambrian granite; Vp=5400 m s– 1) excavation be avoided. The exploration of the 2-mile channel was attempted initially by drilling alone, until it was clear that the grid of holes needed to cover the large areas of the possible route wouldcost an estimated $3 million and take two years. A reconnaissance by seismic-refraction surveys was the only way of carrying out the job in the time available. Since rock head iscritically close to the channel invert in several areas, an accuracy of ±1.5 m (5 ft) in defining it was desired. This would have been impossible by the seismic method alone, asthe velocity distribution above bedrock is complex and is not defined fully by the T-Xgraphs of first arrivals. Part of the area was covered by shallow lakes, where ice (VP=3300 m s– 1) covered lake water (V P=1450 m s– 1). On land, frozen soils (V P=1830–2440 m s– 1) overlay a variable thickness of unfrozen peat and muskeg (as low as VP=340 m s– 1); between these deposits and bedrock were glacial clays (V P=1570 m s– 1) with patches of till (V P=2130–2750 m s–1). That is, there was both a velocity reversalwith depth (a low-velocity layer), and a lateral change in the velocity distribution. Severerockhead relief was another source of error, as computed seismic depth is the minimalradial depth from a seismometer location, whereas drill depth is obtained from rock headdirectly under the seismometer.
For these reasons, the seismic results had to be checked and calibrated by a relatively large number of drill holes. These were usually sited at culminations in rock head, andprofiles were ‘draped’ between the control points. Over the ice, overall accuracy of theseismic results, compared with drill depths, was better than 10%, that is, within 1 m. At athird of the check points, the error was less than 0.3 m, but at three places where bedrockrelief was severe, seismic depths were out by more than 3 m. Over land, predicted depthswere within 2 m of the drill depths in the nine cases where a check was possible.
To prove 1.5 km of channel through an area of shallow bedrock required 20 km of seismic traverse and 70 drill holes, each about 10 m long. The combination of seismicsurveys and drilling was the cheapest and most efficient way of exploration, including theexamination of nearby alternative routes. The total cost was $1.2 million.
6.3.6 Electrical methods
Several methods of prospecting for minerals and of investigating geological conditionshave been developed using the electrical properties of rocks. The resistivity method is the one that has been most used in engineering. It depends on the property of resistivity,
Geological exploration of an engineering site 203
www.angoothachaap.blogspot.com
www.angoothachaap.blogspot.com
which is the electrical resistance between opposite faces of a unit cube of a given rock.The SI unit is the ohm metre (ohm m). The values of resistivity of rocks and mineralsrange from 10– 6 to over 1012 ohm m, with no simple relationship of the spread of values to a genetic classification of rocks. Some minerals, like clays, conduct electricity well,but the predominant factor controlling the resistivity of most rocks is the presence orabsence of ground water in them, and the relative concentration of electrolyte (dissolvedsalts). A sand saturated with brackish water will have a very low resistivity. The samesand, if it lay above the water table and had air, not water, in its pores, would have a highresistivity. Crystalline rocks normally have high resistivities, except locally where theyare broken by faults or joints and ground water fills the voids.
Resistivity is measured along traverses in the field by inserting two metal stakes (thecurrent electrodes C1 and C2 in Fig. 6.12) and applying a current. The circuit iscompleted by flow through the subsurface. There is a matching drop of electricalpotential at the surface, which is measured over a distance a by inserting two similar stakes (the potential electrodes, P1 and P2) into the ground. In the commonly used Wenner arrangement, one has C1P1=P1P2=P2C2=a. If the traverse is underlain by an isotropic rock of uniform resistivity, the flow lines of the electricity are circular arcspassing through C1 and C2, and the corresponding equipotential surfaces are orthogonalto them. For the Wenner arrangement of electrodes, the resistivity ρ of the rock is given by
where V is the voltage between the potential electrodes, I is the current flowing between the current electrodes, and a is the separation of the electrodes.
Where a layer ρ 1 of lower resistivity overlies one of high resistivity ρ 2, the flow lines are distorted from circular arcs, with flow preferentially concentrated in the goodconductor ρ 1. If resistivity is measured and calculated from the above equation, it would have a value intermediate between ρ 1 and ρ 2. It is referred to as a value of apparent resistivity ρ α. The percentage of the total current flowing through the lower rock layer ρ 2depends on its depth relative to a, and on the contrast in resistivity with ρ 1.As a is increased, the flow of current through layer ρ 2 increases and ρ α tends towards the value ρ 2. That is, for small values of a, ρ α approximates to ρ 1 , and for values large compared with the depth to ρ 2, to ρ 2.
In the commonly used procedure of a depth probe, the centre of the electrode arrangement is kept fixed, but the spacing a is increased by progressive steps to givedeeper and deeper penetration by the current. A typical two-layer curve, where ρ α /ρ 1 is plotted against a/h, is shown in Figure 6.12. The inflection point is related to the depth to the interface separating the two layers. A rule of thumb (valid for a range of resistivitiesand thicknesses only) is that the depth to the interface is equal to two-thirds of the value of a at which the corresponding inflection point occurs. Accurate values may be obtainedby comparing the observed curve with families of standard theoretical curves for a rangeof models. More accurate resistivity models may be obtained using a computer
Geology for civil engineers 204
www.angoothachaap.blogspot.com
www.angoothachaap.blogspot.com
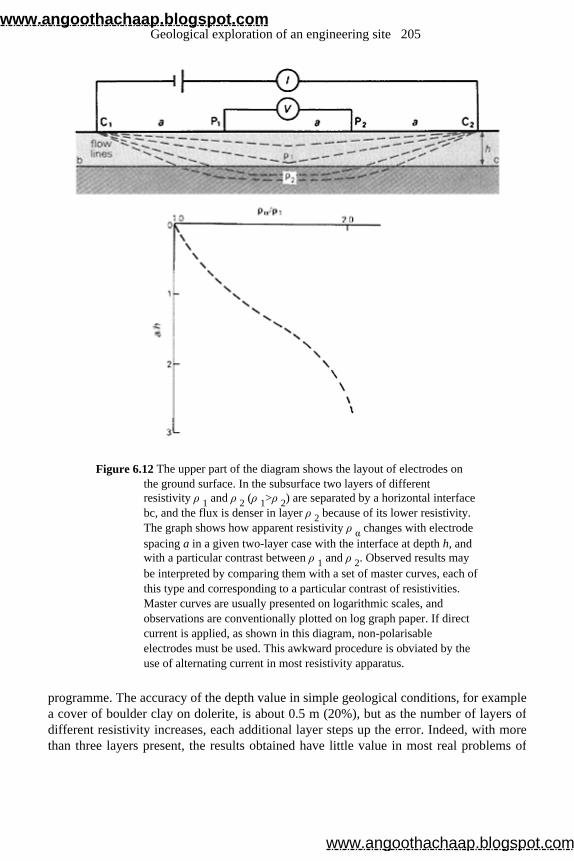
Figure 6.12 The upper part of the diagram shows the layout of electrodes on the ground surface. In the subsurface two layers of different resistivity ρ 1 and ρ 2 (ρ 1>ρ 2) are separated by a horizontal interface bc, and the flux is denser in layer ρ 2 because of its lower resistivity. The graph shows how apparent resistivity ρ α changes with electrode spacing a in a given two-layer case with the interface at depth h, and with a particular contrast between ρ 1 and ρ 2. Observed results may be interpreted by comparing them with a set of master curves, each of this type and corresponding to a particular contrast of resistivities. Master curves are usually presented on logarithmic scales, and observations are conventionally plotted on log graph paper. If direct current is applied, as shown in this diagram, non-polarisable electrodes must be used. This awkward procedure is obviated by the use of alternating current in most resistivity apparatus.
programme. The accuracy of the depth value in simple geological conditions, for examplea cover of boulder clay on dolerite, is about 0.5 m (20%), but as the number of layers ofdifferent resistivity increases, each additional layer steps up the error. Indeed, with morethan three layers present, the results obtained have little value in most real problems of
Geological exploration of an engineering site 205
www.angoothachaap.blogspot.com
www.angoothachaap.blogspot.com
site exploration. In horizontal investigations, the electrode spacing is kept constant, and the spread is
moved laterally in successive steps. This technique is used to trace an interface of markedresistivity contrast, and the electrode spacing is chosen after a depth probe has shownwhat value of a corresponds to the inflection point. It is also used to locate steep zones oflow or high resistivity, such as water-bearing fractures or dykes.
The resistivity method has been, and to a limited extent still is, used in surveys to determine depths to rock head over a wide area. Since a depth probe, with maximumvalues of a about 15 m, can be completed by a team of three in about 10 min, extended sites can be covered quickly and relatively cheaply. The geological interpretation of theresistivity model is, however, more prone to error than the interpretation of seismicresults, and the results must be treated with greater caution. More borings must be madeas a control. In one survey where the thicknesses of a boulder clay overburden obtainedby resistivity and by boring were compared, a difference of 5 m in depth to rock headbetween resistivity value and bore was found at one point, though the average differencewas only 0.5 m.
The method is best suited to problems where ground water is involved, such as surveying the water table or locating water-bearing fissures. It is a useful guide in sitingwells for water supply, or in detecting where leakage is taking place. The more ingeniousand unusual applications include following the flow of grout underground into an ill-defined cavity after lowering its resistivity with some added salt.
Two other electrical methods have some engineering applications, though their main use is to prospect for sulphide ore bodies. The self-potential method (often abbreviated to SP) measures natural changes of potential at the ground surf ace by connecting a millivoltmeter to two electrodes. These must be non-polarisable and are normally copper rods immersed in a copper sulphate solution held in porous pots. In permeable rocks,filtration of ground water through pores in the rock produces an increase in the electricalpotential in the direction of water flow, and the potential gradient is proportional to theintensity of seepage. The method is used to detect leakage paths in earth dams. Periodicmeasurement at such localities shows whether leakage is increasing with time, andwhether fines are being washed out of the fill.
The induced polarisation method (IP) requires that a current be passed through the ground for a short period, then interrupted. The difference of potential between theelectrodes does not disappear immediately, but decays at a rate determined by the type ofrock and its degree of saturation by ground water. The applications to engineering arebroadly similar to those of the resistivity method, but in some cases afford greateraccuracy.
6.3.7 Magnetic method
The Earth’s magnetic field (that is, the geomagnetic field) changes slowly with time, and from place to place. The variation with geographical position includes a gradual changeof magnetic intensity from about 0.3 oersted (Oe) at the Equator to 0.7Oe at the Poles. The SI units of magnetic flux density are the weber per square metre (Wb m– 2) and the
Geology for civil engineers 206
www.angoothachaap.blogspot.com
www.angoothachaap.blogspot.com
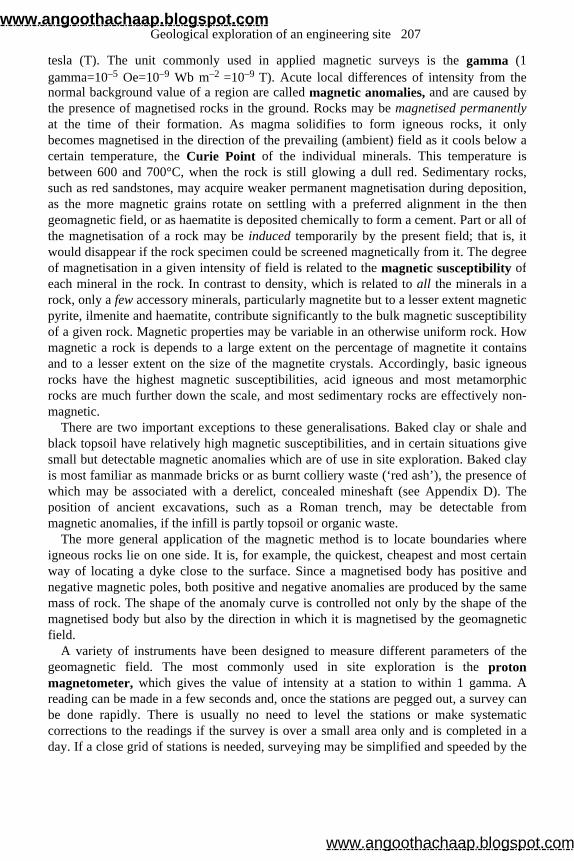
tesla (T). The unit commonly used in applied magnetic surveys is the gamma (1 gamma=10–5 Oe=10–9 Wb m–2 =10–9 T). Acute local differences of intensity from thenormal background value of a region are called magnetic anomalies, and are caused by the presence of magnetised rocks in the ground. Rocks may be magnetised permanentlyat the time of their formation. As magma solidifies to form igneous rocks, it onlybecomes magnetised in the direction of the prevailing (ambient) field as it cools below acertain temperature, the Curie Point of the individual minerals. This temperature is between 600 and 700°C, when the rock is still glowing a dull red. Sedimentary rocks, such as red sandstones, may acquire weaker permanent magnetisation during deposition,as the more magnetic grains rotate on settling with a preferred alignment in the thengeomagnetic field, or as haematite is deposited chemically to form a cement. Part or all ofthe magnetisation of a rock may be induced temporarily by the present field; that is, itwould disappear if the rock specimen could be screened magnetically from it. The degreeof magnetisation in a given intensity of field is related to the magnetic susceptibility of each mineral in the rock. In contrast to density, which is related to all the minerals in a rock, only a few accessory minerals, particularly magnetite but to a lesser extent magnetic pyrite, ilmenite and haematite, contribute significantly to the bulk magnetic susceptibilityof a given rock. Magnetic properties may be variable in an otherwise uniform rock. Howmagnetic a rock is depends to a large extent on the percentage of magnetite it containsand to a lesser extent on the size of the magnetite crystals. Accordingly, basic igneousrocks have the highest magnetic susceptibilities, acid igneous and most metamorphicrocks are much further down the scale, and most sedimentary rocks are effectively non-magnetic.
There are two important exceptions to these generalisations. Baked clay or shale and black topsoil have relatively high magnetic susceptibilities, and in certain situations givesmall but detectable magnetic anomalies which are of use in site exploration. Baked clayis most familiar as manmade bricks or as burnt colliery waste (‘red ash’), the presence of which may be associated with a derelict, concealed mineshaft (see Appendix D). The position of ancient excavations, such as a Roman trench, may be detectable frommagnetic anomalies, if the infill is partly topsoil or organic waste.
The more general application of the magnetic method is to locate boundaries where igneous rocks lie on one side. It is, for example, the quickest, cheapest and most certainway of locating a dyke close to the surface. Since a magnetised body has positive andnegative magnetic poles, both positive and negative anomalies are produced by the samemass of rock. The shape of the anomaly curve is controlled not only by the shape of themagnetised body but also by the direction in which it is magnetised by the geomagneticfield.
A variety of instruments have been designed to measure different parameters of thegeomagnetic field. The most commonly used in site exploration is the proton magnetometer, which gives the value of intensity at a station to within 1 gamma. A reading can be made in a few seconds and, once the stations are pegged out, a survey canbe done rapidly. There is usually no need to level the stations or make systematiccorrections to the readings if the survey is over a small area only and is completed in aday. If a close grid of stations is needed, surveying may be simplified and speeded by the
Geological exploration of an engineering site 207
www.angoothachaap.blogspot.com
www.angoothachaap.blogspot.com
use of a nylon cord net, of say 10 × 10 m2, knotted to locate stations at 1-m intervals. The outer corners of the net are fitted to survey pegs.
The contoured results (an isogram map) of a survey carried out by Dr George Maxwell over an abandoned mineshaft are shown in Figure 6.13. The position of the shaft’s rectangular outline is approximate as there is no confirmatory surface feature. It was sunkafter publication of the First Edition of the Ordnance Survey 1:2500 plans, andabandoned and landscaped before publication of the Second Edition. The nature of thecapping of the shaft, which produces the positive magnetic anomaly, is unknown, but itseems unlikely that iron railings are present. Other anomalies in the geomagnetic field aretypical of a colliery yard. The locating of such abandoned shafts is discussed in Appendix D.
Figure 6.13 The position of a concealed mineshaft is shown by the rectangle on the map. The magnetic anomalies related to it and to the colliery yard are derived by contouring the readings taken by a proton magnetometer at 100 gamma interval between isogams. Further information is given in the text. (The results are reproduced by courtesy of Dr George Maxwell.)
6.3.8 Gravity method
The gravitational attraction between two masses, m 1 and m 2, which are a distance rapart, is defined by Newton’s Law:
where G is the universal gravitational constant. It has a value of only 6.67 × 10⁻¹¹ m3 kg–1 s–2 (6.67×10⁻⁸ cgs cgs units), which means that gravity is a weak force compared, forexample, with magnetic attraction.
If the Earth is one of the two masses, then its gravitational attraction is more generally described in terms of the acceleration g it evokes in the other mass. Since F=m 1 g, then we have
Geology for civil engineers 208
www.angoothachaap.blogspot.com
www.angoothachaap.blogspot.com
Gravitational acceleration g has traditionally been expressed in cgs units of cm s– 2, called for this purpose a gal (after Galileo). Its value ranges from just under 978 gal athigh altitude at the Equator, to over 983 gal at sea level at the Poles. A smaller unit, themilligal (equal to 0.001 gal) has conventionally been used in exploration surveys.
Gravity meters, f or example the commonly used Worden Meter, can be read to a precision of 0.01 mgal, though slight irregularities in instrumental drift make theaccuracy less. Errors in correcting for elevation, irregular terrain around the meter station,and tidal effects normally reduce the accuracy of a corrected reading to about 0.03 mgalunder favourable circumstances (a small flat site), but the error may be closer to 0.1 mgal where topography is irregular. Although this is a small fraction of the total Earth’s gravity field, it is an insensitive measure of changing subsurface conditions, and for thisreason the gravity method has had limited application to engineering problems.
If the Earth were composed of concentric shells of rock, each of different density, then the corrected values of g would change systematically, and predictably, from the equatorto the poles. A theoretical value of gravity corresponding to each value of latitude can be computed for the simple Earth model. Comparison of observed values of g corrected for elevation, etc. with the theoretical value for the same station normally shows adifference called the Bouguer anomaly at the station. Bouguer anomalies exist becausethe density layering in the Earth is not simply concentric. Folds, faults and igneousintrusions bring denser rocks close to the surface in some areas, resulting in anomalousmasses with respect to a horizontally layered Earth (see Section 6.3.1 and Fig. 6.6).
The magnitude of a Bouguer anomaly is related to the size of structure and to the density contrast across the interface being investigated. Since structures of interest in siteexploration are relatively small, the gravity method is usable only if the density contrastis relatively large, and even then only as a reconnaissance method because of poorresolution. This condition is met in two types of problem. The first is searching for largeunderground caverns in thick limestone, where the contrast may be as high as 2.7 g cm– 3between limestone and air. The second is tracing buried channels where an infill ofunconsolidated drift deposits may differ in density by about 0.5 g cm– 3 from the solid rocks, for example Carboniferous sediments. The cavities produced by mining do notgive rise to gravity anomalies large enough to be recognised with certainty in a surveywith a standard gravity meter. A new generation of more sensitive instruments with asensitivity of 0.001 mgal may be of use for this purpose (Appendix D).
6.4 Drilling, boring, trenching and pitting
6.4.1 Drilling and boring
Quantitative information about a site at various points is usually required and can be
Geological exploration of an engineering site 209
www.angoothachaap.blogspot.com
www.angoothachaap.blogspot.com
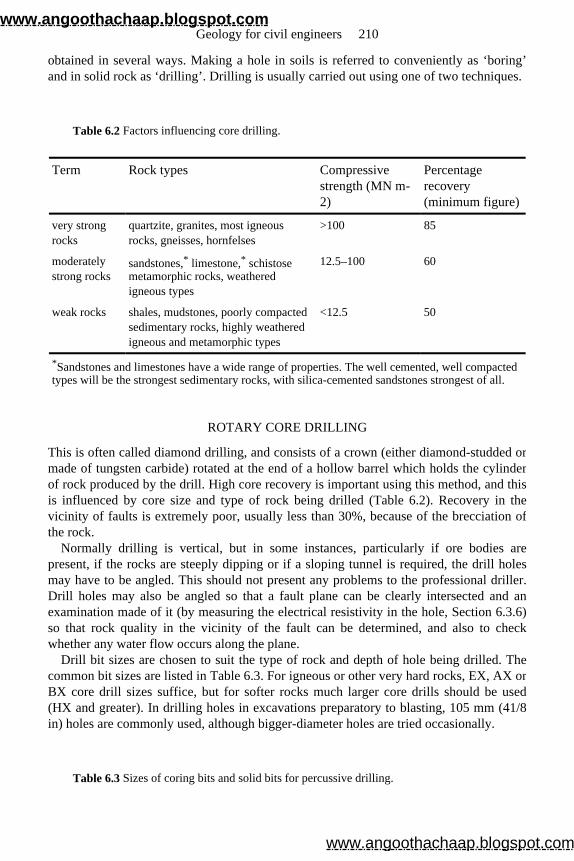
obtained in several ways. Making a hole in soils is referred to conveniently as ‘boring’ and in solid rock as ‘drilling’. Drilling is usually carried out using one of two techniques.
ROTARY CORE DRILLING
This is often called diamond drilling, and consists of a crown (either diamond-studded or made of tungsten carbide) rotated at the end of a hollow barrel which holds the cylinderof rock produced by the drill. High core recovery is important using this method, and thisis influenced by core size and type of rock being drilled (Table 6.2). Recovery in the vicinity of faults is extremely poor, usually less than 30%, because of the brecciation ofthe rock.
Normally drilling is vertical, but in some instances, particularly if ore bodies arepresent, if the rocks are steeply dipping or if a sloping tunnel is required, the drill holesmay have to be angled. This should not present any problems to the professional driller.Drill holes may also be angled so that a fault plane can be clearly intersected and anexamination made of it (by measuring the electrical resistivity in the hole, Section 6.3.6) so that rock quality in the vicinity of the fault can be determined, and also to checkwhether any water flow occurs along the plane.
Drill bit sizes are chosen to suit the type of rock and depth of hole being drilled. Thecommon bit sizes are listed in Table 6.3. For igneous or other very hard rocks, EX, AX or BX core drill sizes suffice, but for softer rocks much larger core drills should be used(HX and greater). In drilling holes in excavations preparatory to blasting, 105 mm (41/8in) holes are commonly used, although bigger-diameter holes are tried occasionally.
Table 6.2 Factors influencing core drilling.
Term Rock types Compressive strength (MN m-2)
Percentage recovery (minimum figure)
very strong rocks
quartzite, granites, most igneous rocks, gneisses, hornfelses
>100 85
moderately strong rocks
sandstones,* limestone,* schistose metamorphic rocks, weathered igneous types
12.5–100 60
weak rocks shales, mudstones, poorly compacted sedimentary rocks, highly weathered igneous and metamorphic types
<12.5 50
*Sandstones and limestones have a wide range of properties. The well cemented, well compacted types will be the strongest sedimentary rocks, with silica-cemented sandstones strongest of all.
Table 6.3 Sizes of coring bits and solid bits for percussive drilling.
Geology for civil engineers 210
www.angoothachaap.blogspot.com
www.angoothachaap.blogspot.com
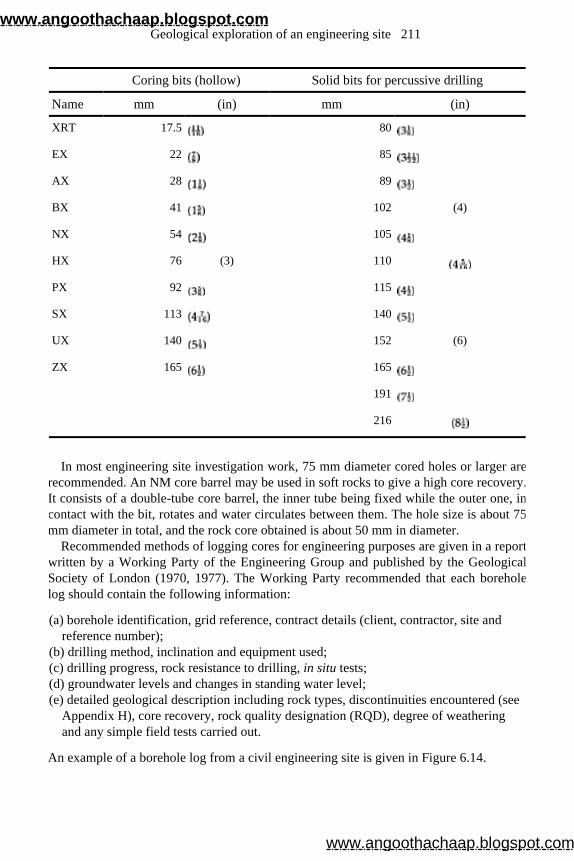
In most engineering site investigation work, 75 mm diameter cored holes or larger are recommended. An NM core barrel may be used in soft rocks to give a high core recovery.It consists of a double-tube core barrel, the inner tube being fixed while the outer one, in contact with the bit, rotates and water circulates between them. The hole size is about 75mm diameter in total, and the rock core obtained is about 50 mm in diameter.
Recommended methods of logging cores for engineering purposes are given in a reportwritten by a Working Party of the Engineering Group and published by the GeologicalSociety of London (1970, 1977). The Working Party recommended that each boreholelog should contain the following information:
(a) borehole identification, grid reference, contract details (client, contractor, site and reference number);
(b) drilling method, inclination and equipment used; (c) drilling progress, rock resistance to drilling, in situ tests; (d) groundwater levels and changes in standing water level; (e) detailed geological description including rock types, discontinuities encountered (see
Appendix H), core recovery, rock quality designation (RQD), degree of weathering and any simple field tests carried out.
An example of a borehole log from a civil engineering site is given in Figure 6.14.
Coring bits (hollow) Solid bits for percussive drilling
Name mm (in) mm (in)
XRT 17.5 80 EX 22 85 AX 28 89 BX 41 102 (4)
NX 54 105 HX 76 (3) 110 PX 92 115 SX 113 140 UX 140 152 (6)
ZX 165 165 191 216
Geological exploration of an engineering site 211
www.angoothachaap.blogspot.com
www.angoothachaap.blogspot.com
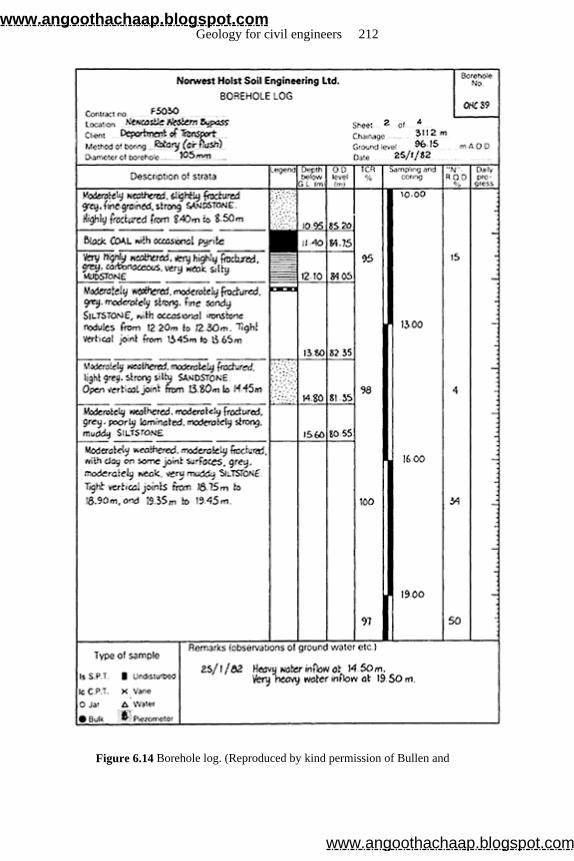
Figure 6.14 Borehole log. (Reproduced by kind permission of Bullen and
Geology for civil engineers 212
www.angoothachaap.blogspot.com
www.angoothachaap.blogspot.com
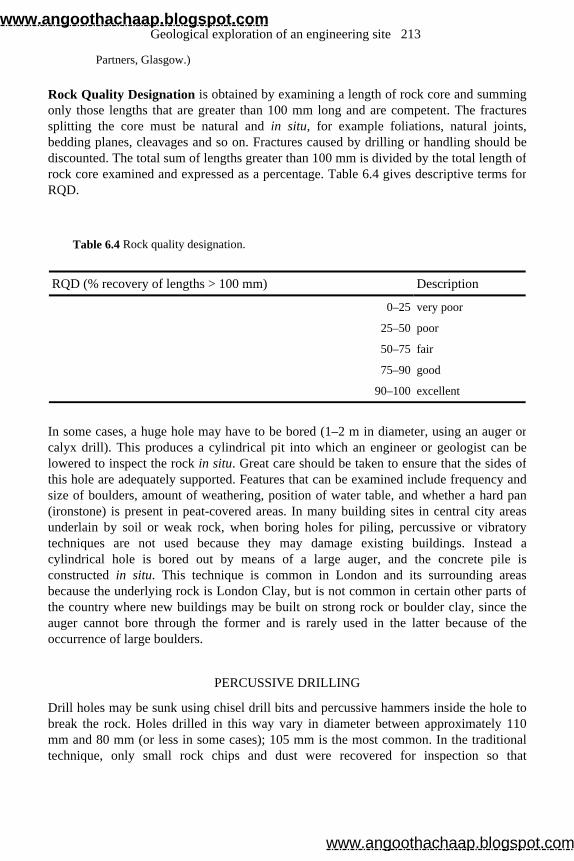
Partners, Glasgow.)
Rock Quality Designation is obtained by examining a length of rock core and summingonly those lengths that are greater than 100 mm long and are competent. The fracturessplitting the core must be natural and in situ, for example foliations, natural joints,bedding planes, cleavages and so on. Fractures caused by drilling or handling should bediscounted. The total sum of lengths greater than 100 mm is divided by the total length ofrock core examined and expressed as a percentage. Table 6.4 gives descriptive terms for RQD.
In some cases, a huge hole may have to be bored (1–2 m in diameter, using an auger or calyx drill). This produces a cylindrical pit into which an engineer or geologist can belowered to inspect the rock in situ. Great care should be taken to ensure that the sides ofthis hole are adequately supported. Features that can be examined include frequency andsize of boulders, amount of weathering, position of water table, and whether a hard pan(ironstone) is present in peat-covered areas. In many building sites in central city areas underlain by soil or weak rock, when boring holes for piling, percussive or vibratorytechniques are not used because they may damage existing buildings. Instead acylindrical hole is bored out by means of a large auger, and the concrete pile isconstructed in situ. This technique is common in London and its surrounding areas because the underlying rock is London Clay, but is not common in certain other parts ofthe country where new buildings may be built on strong rock or boulder clay, since theauger cannot bore through the former and is rarely used in the latter because of theoccurrence of large boulders.
PERCUSSIVE DRILLING
Drill holes may be sunk using chisel drill bits and percussive hammers inside the hole tobreak the rock. Holes drilled in this way vary in diameter between approximately 110mm and 80 mm (or less in some cases); 105 mm is the most common. In the traditionaltechnique, only small rock chips and dust were recovered for inspection so that
Table 6.4 Rock quality designation.
RQD (% recovery of lengths > 100 mm) Description
0–25 very poor
25–50 poor
50–75 fair
75–90 good
90–100 excellent
Geological exploration of an engineering site 213
www.angoothachaap.blogspot.com
www.angoothachaap.blogspot.com
information on the rock mass obtained by this method was very limited. Recently aSwedish company (Hagconsult) has introduced an improvement. Their techniqueinvolves lowering a miniature television camera into the hole and examining the rockquality and other properties of the rock mass, including fissures, joints, weathering andthe location of any fault planes. (Note that this technique does not work if the hole isfilled with water: the drill hole must be dry.)
Such small-diameter boreholes may be used for hydraulic pressure testing to provide information on permeability of the rock mass and indicate zones where grouting isnecessary. Miniature-television inspection will confirm these data, as well as providinginformation on joints and faults including their dips and strikes.
This technique has been widely used in recent years for inspecting a rock mass in situ, and ascertaining whether it would be suitable as an underground storage site for oil orgas. For example, it was employed in examining the rock at Cromarty in northernScotland where the construction of a large oil refinery was being considered.
Borehole deformation devices can give details on plate and jack loading tests and in situ stress and shear movements.
Drill cores provide material for laboratory testing of seismic velocity, permeability,saturation moisture content and compressive strength of the rock type(s) drilled as well asproducing material for petrographic examination. A chemical analysis of the main oreminerals in a core sample may be carried out to detect any anomalous fraction, such ashigh sulphur content and high water content—both hydroxyl (OH) and absorbed water. From this the presence of minutely sized minerals such as clays and sulphides can bepredicted.
6.4.2 Trenching and pitting
In superficial deposits, digging a trench or sinking a pit or shaft to bedrock is usually thebest means of obtaining information. Trenches may be dug by hand, but a mechanicalback-acting shovel is the neatest and quickest method to use. Once again it must be emphasised that all pits or trenches must be adequately side-supported before any inspection is made.
Trenches and pits have two purposes:
(a)They allow a visual inspection of a deep and wide section of the superficial deposits. Complete sections can be drawn and layers of strata delineated. Provided that enough trenches or pits have been sunk, an accurate three-dimensional picture of the superficial geology of any site can be obtained. In this, the different types of overburden and their thicknesses will be shown, and also data such as frequency and size of boulders, areas of good quality sand and gravel (see (b)) and location of buried channels.
(b)They allow large-scale sampling and investigation of the material of the superficial deposits to be made. The general map of the superficial deposits will reveal the main varieties of strata and their approximate volumes. Any sands and gravels found will have to be tested so that their mineralogy (percentage of quartz grains present) and particular size distribution (using sieves of varying sizes) can be determined. If, for
Geology for civil engineers 214
www.angoothachaap.blogspot.com
www.angoothachaap.blogspot.com
example, the grading of the sand conforms to a’zone 2’ type, then it is highly probable that any concrete required in site construction work can be made using these sand deposits. Any impurities found in sands or gravels must always be clearly defined. Such impurities include salts, pyrite or other sulphides, and organic matter—particularly coal. Coal is often found in British sands, particularly from North-east England and the Midland Valley of Scotland, because of the presence of Carboniferous rocks containing coal seams underlying many of the superficial deposits in these regions.
6.4.3 Groundwater conditions
All of the trenches and pits (and large-diameter drill holes) should be left open and notbackfilled immediately so that groundwater conditions can be observed over as long aperiod as possible. The level at which water is encountered in each hole or pit must berecorded, and also which horizons yield water and which strata are under artesianpressure. Artesian conditions in strata below a road route or a heavy building must beassessed carefully in case there is a danger of hydraulic failure of the soil or rock mass.From such studies the direction of flow of water can be estimated (Section 5.2.3) anddrainage measures decided, especially in cases where the water table lies close to thesurface.
Where the strata consist of dipping beds of alternating low and high permeability, asimple water table does not exist. Each aquifer has its own piezometric surface (seeSection 5.1.2) and each of these surfaces is a measure of the lateral change of pore fluidpressure in a particular layer. The study of pore pressure is an important part of acomplete site investigation programme. To determine pore pressure or water level and tomonitor changes in them, piezometer tubes or tips are installed in the ground so that pitsand trenches need not be left open but can be backfilled after inspection.
References and selected reading
Attewell P.B. and I.W.Farmer 1976. Principles of engineering geology (Chapter 7). London: Chapman and Hall.
Bogolovsky, V.A. and A.A.Ogilvy 1970. Application of geophysical methods for studying the technical status of earth dams. Geophys. Prospect . 18 , 758–73.
British Standards Institution 1981. Code of Practice for Site Investigations. BS 5930:1981 (formerly CP 2001).
Buist, D.S., A.D.Burnett, and M.K.Sanders 1978. Engineering geological case study of the site investigation and design of a major trunk road cutting in Carboniferous rocks. Q. J. Engng Geol . 11 , 161–76.
Clark, A.R. and D.K.Johnson 1975. Geotechnical mapping as an integral part of site investigation—two case histories. Q. J. Engng Geol . 8 , 211–24.
Cooke, R.U., A.S.Goudie, and J.C.Doornkamp 1978. Middle East—review and bibliography of geomorphological contributions. Q. J. Engng Geol . 11 , 9–18.
Cratchley, C.R., P.Grainger, D.M.McCann and D.I.Smith 1972. Some applications of
Geological exploration of an engineering site 215
www.angoothachaap.blogspot.com
www.angoothachaap.blogspot.com
geophysical techniques in engineering geology with special reference to the Foyers hydro-electric scheme. Proc. 24th Int. Geol. Congr . 13 , 163–75.
Dearman, W.R. and P.F.Fookes 1974. Engineering geological mapping for civil engineering practice in the United Kingdom. Q. J. Engng Geol . 7 , 223–56.
Dumbleton, M.J. and G.West 1972a. Guidance on planning, directing and reporting site investigations . Transp. Road Res. Lab. Rep. LR 625.
Dumbleton, M.J. and G.West 1972b. Preliminary sources of site information for roads in Britain. Q. J. Engng Geol . 5 , 15–18.
Eastaff, D.J. , C.J.Beggs and M.D.McElhinney 1978. Middle-East—geotechnical data collection. Q. J. Engng Geol . 11 , 51–63.
Gardner, M. 1969. A new pencil-and-paper game based on inductive reasoning. Scient. Am . 221 (5), 140–4.
Geological Society Engineering Group Working Party 1970/1977. (1st and 2nd Rep.) The logging of rock cores for engineering purposes. Q. J. Engng Geol . 3 , 1–24; Q. J. Engng Geol . 10 , 45–52.
Geological Society Engineering Group Working Party 1972. The preparation of maps and plans in terms of engineering geology. Q. J. Engng Geol . 5 , 295–382.
Grainger, P. and D.M.McCann 1977. Interborehole acoustic measurements in site investigation. Q. J. Engng Geol . 10 , 241–55.
Griffiths, D.H. and R.F.King 1965. Applied geophysics for engineers and geologists . Oxford: Pergamon.
Knill, J.L. and D.G.Price 1972. Seismic evaluation of rock masses. Proc. 24th Int. Geol. Congr. 13 , 176–82.
Lee, A.J. 1966. The effect of faulting on mining subsidence. Trans Inst. Mining Engrs 125 , 735–43.
McDowell, P.W. 1970. The advantages and limitations of geoelectrical methods in the foundation investigation of the tracked hovercraft experimental site in Cambridgeshire. Q. J. Engng Geol . 3 , 119–26.
McQuillin, R. and D.A.Ardus 1977. Exploring the geology of shelf seas . London: Graham & Trotman.
Miller, V. 1961. Photogeology . New York: McGraw-Hill. Moore, J.F.A. 1974. Mapping major joints in the Lower Oxford Clay using terrestrial
photogrammetry. Q. J. Engng Geol . 7 , 57–68. National Coal Board 1963. Subsidence engineers’ handbook . London: National Coal
Board. Newbery, J. and A.Siva Subramaniam 1977. Geotechnical aspects of route location
studies for M4 north of Cardiff. Q. J. Engng Geol . 10 , 423–41. Norman, J.W., T.H.Leibowitz, and P.G.Fookes 1975. Factors affecting the detection of
slope instability with air photographs in an area near Sevenoaks, Kent. Q. J. Engng Geol . 8 , 159–76.
Powell, M. (ed.) 1970. Preventing foundation failures in new dwellings . Regd. House Bldrs Fdn Man., Nat. Housebldg Council.
Prior, J.W. and W.K.Mann 1972. Location of by-pass channels in Manitoba using a combined seismic-drilling programme. Proc. 24th Int. Geol. Congr. 13 , 217–24.
Robbie, J.A. 1972. The Institute of Geological Sciences and the Scottish environment. Proc. 24th Int. Geol. Congr . 13 , 55–63.
Wakeling, T.R.M. 1972. The planning of site investigations for highways. Q. J. Engng Geol 5 , 7–14.
Geology for civil engineers 216
www.angoothachaap.blogspot.com
www.angoothachaap.blogspot.com

Watson, I. 1971. A preliminary report on new photogeological studies to detect unstable natural slopes. Q. J. Engng Geol . 4 , 133–7.
Geological exploration of an engineering site 217
www.angoothachaap.blogspot.com
www.angoothachaap.blogspot.com
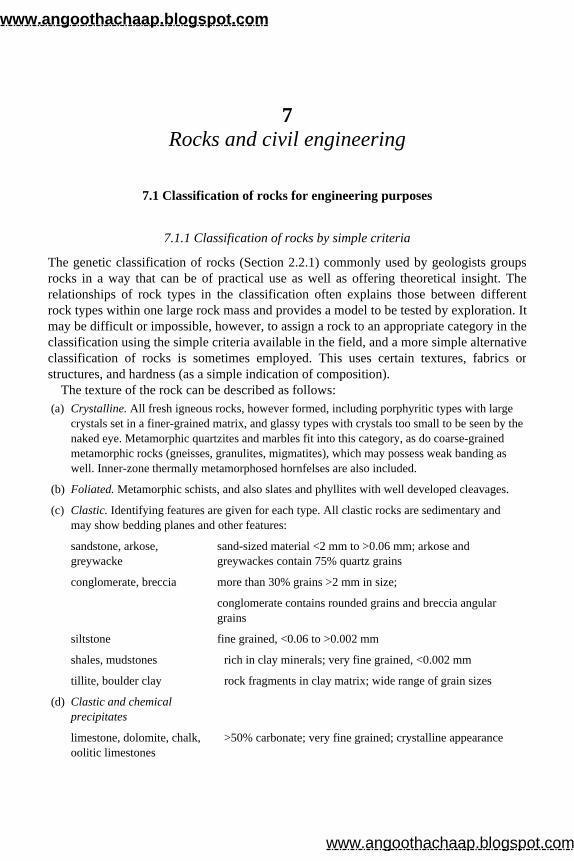
7 Rocks and civil engineering
7.1 Classification of rocks for engineering purposes
7.1.1 Classification of rocks by simple criteria
The genetic classification of rocks (Section 2.2.1) commonly used by geologists groups rocks in a way that can be of practical use as well as offering theoretical insight. Therelationships of rock types in the classification often explains those between differentrock types within one large rock mass and provides a model to be tested by exploration. Itmay be difficult or impossible, however, to assign a rock to an appropriate category in theclassification using the simple criteria available in the field, and a more simple alternativeclassification of rocks is sometimes employed. This uses certain textures, fabrics orstructures, and hardness (as a simple indication of composition).
The texture of the rock can be described as follows: (a) Crystalline. All fresh igneous rocks, however formed, including porphyritic types with large
crystals set in a finer-grained matrix, and glassy types with crystals too small to be seen by the naked eye. Metamorphic quartzites and marbles fit into this category, as do coarse-grained metamorphic rocks (gneisses, granulites, migmatites), which may possess weak banding as well. Inner-zone thermally metamorphosed hornfelses are also included.
(b) Foliated. Metamorphic schists, and also slates and phyllites with well developed cleavages.
(c) Clastic. Identifying features are given for each type. All clastic rocks are sedimentary and may show bedding planes and other features:
sandstone, arkose, greywacke
sand-sized material <2 mm to >0.06 mm; arkose and greywackes contain 75% quartz grains
conglomerate, breccia more than 30% grains >2 mm in size;
conglomerate contains rounded grains and breccia angular grains
siltstone fine grained, <0.06 to >0.002 mm
shales, mudstones rich in clay minerals; very fine grained, <0.002 mm
tillite, boulder clay rock fragments in clay matrix; wide range of grain sizes
(d) Clastic and chemical precipitates
limestone, dolomite, chalk, oolitic limestones
>50% carbonate; very fine grained; crystalline appearance
www.angoothachaap.blogspot.com
www.angoothachaap.blogspot.com
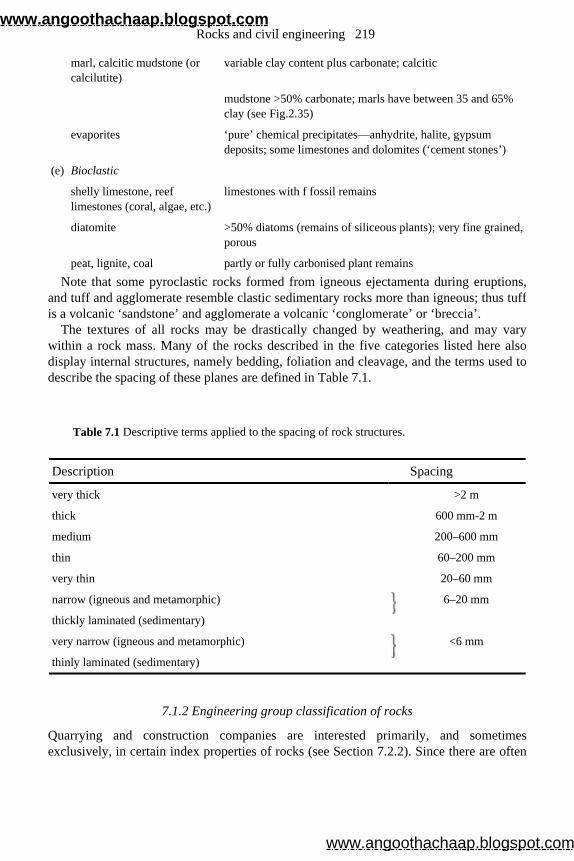
Note that some pyroclastic rocks formed from igneous ejectamenta during eruptions,and tuff and agglomerate resemble clastic sedimentary rocks more than igneous; thus tuffis a volcanic ‘sandstone’ and agglomerate a volcanic ‘conglomerate’ or ‘breccia’.
The textures of all rocks may be drastically changed by weathering, and may vary within a rock mass. Many of the rocks described in the five categories listed here alsodisplay internal structures, namely bedding, foliation and cleavage, and the terms used todescribe the spacing of these planes are defined in Table 7.1.
7.1.2 Engineering group classification of rocks
Quarrying and construction companies are interested primarily, and sometimesexclusively, in certain index properties of rocks (see Section 7.2.2). Since there are often
marl, calcitic mudstone (or calcilutite)
variable clay content plus carbonate; calcitic
mudstone >50% carbonate; marls have between 35 and 65% clay (see Fig.2.35)
evaporites ‘pure’ chemical precipitates—anhydrite, halite, gypsum deposits; some limestones and dolomites (‘cement stones’)
(e) Bioclastic
shelly limestone, reef limestones (coral, algae, etc.)
limestones with f fossil remains
diatomite >50% diatoms (remains of siliceous plants); very fine grained, porous
peat, lignite, coal partly or fully carbonised plant remains
Table 7.1 Descriptive terms applied to the spacing of rock structures.
Description Spacing
very thick >2 m
thick 600 mm-2 m
medium 200–600 mm
thin 60–200 mm
very thin 20–60 mm
narrow (igneous and metamorphic)
6–20 mm
thickly laminated (sedimentary)
very narrow (igneous and metamorphic)
<6 mm
thinly laminated (sedimentary)
Rocks and civil engineering 219
www.angoothachaap.blogspot.com
www.angoothachaap.blogspot.com
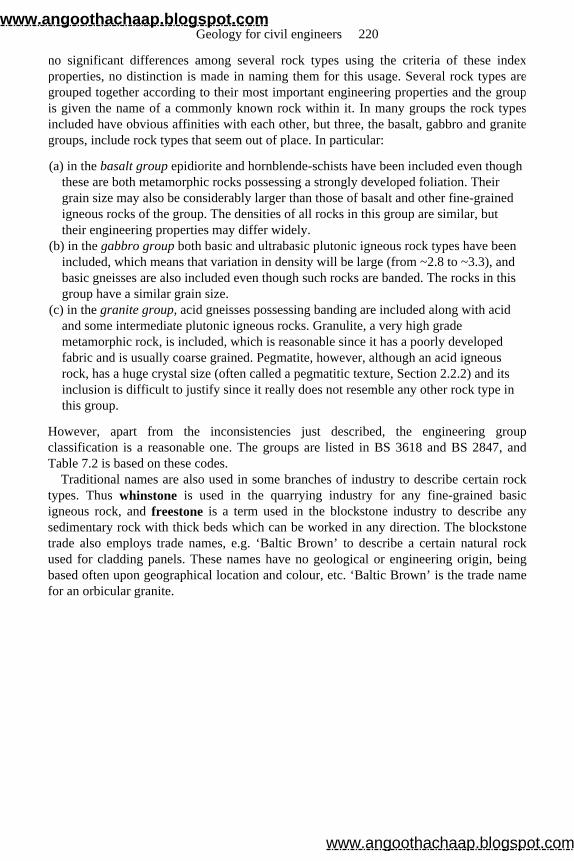
no significant differences among several rock types using the criteria of these indexproperties, no distinction is made in naming them for this usage. Several rock types aregrouped together according to their most important engineering properties and the groupis given the name of a commonly known rock within it. In many groups the rock typesincluded have obvious affinities with each other, but three, the basalt, gabbro and granitegroups, include rock types that seem out of place. In particular:
(a) in the basalt group epidiorite and hornblende-schists have been included even though these are both metamorphic rocks possessing a strongly developed foliation. Their grain size may also be considerably larger than those of basalt and other fine-grained igneous rocks of the group. The densities of all rocks in this group are similar, but their engineering properties may differ widely.
(b) in the gabbro group both basic and ultrabasic plutonic igneous rock types have been included, which means that variation in density will be large (from ~2.8 to ~3.3), and basic gneisses are also included even though such rocks are banded. The rocks in this group have a similar grain size.
(c) in the granite group, acid gneisses possessing banding are included along with acid and some intermediate plutonic igneous rocks. Granulite, a very high grade metamorphic rock, is included, which is reasonable since it has a poorly developed fabric and is usually coarse grained. Pegmatite, however, although an acid igneous rock, has a huge crystal size (often called a pegmatitic texture, Section 2.2.2) and its inclusion is difficult to justify since it really does not resemble any other rock type in this group.
However, apart from the inconsistencies just described, the engineering groupclassification is a reasonable one. The groups are listed in BS 3618 and BS 2847, andTable 7.2 is based on these codes.
Traditional names are also used in some branches of industry to describe certain rock types. Thus whinstone is used in the quarrying industry for any fine-grained basic igneous rock, and freestone is a term used in the blockstone industry to describe any sedimentary rock with thick beds which can be worked in any direction. The blockstonetrade also employs trade names, e.g. ‘Baltic Brown’ to describe a certain natural rock used for cladding panels. These names have no geological or engineering origin, beingbased often upon geographical location and colour, etc. ‘Baltic Brown’ is the trade name for an orbicular granite.
Geology for civil engineers 220
www.angoothachaap.blogspot.com
www.angoothachaap.blogspot.com
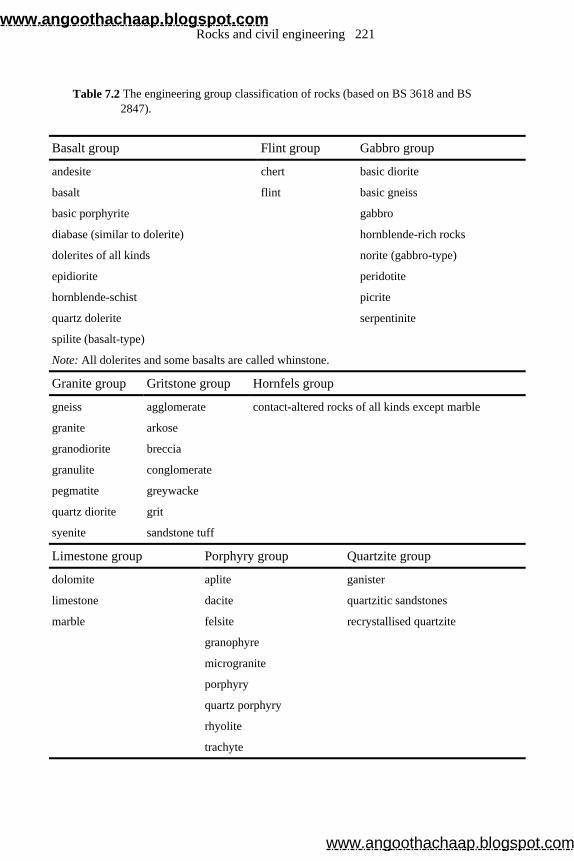
Table 7.2 The engineering group classification of rocks (based on BS 3618 and BS 2847).
Basalt group Flint group Gabbro group
andesite chert basic diorite
basalt flint basic gneiss
basic porphyrite gabbro
diabase (similar to dolerite) hornblende-rich rocks
dolerites of all kinds norite (gabbro-type)
epidiorite peridotite
hornblende-schist picrite
quartz dolerite serpentinite
spilite (basalt-type)
Note: All dolerites and some basalts are called whinstone.
Granite group Gritstone group Hornfels group
gneiss agglomerate contact-altered rocks of all kinds except marble
granite arkose
granodiorite breccia
granulite conglomerate
pegmatite greywacke
quartz diorite grit
syenite sandstone tuff
Limestone group Porphyry group Quartzite group
dolomite aplite ganister
limestone dacite quartzitic sandstones
marble felsite recrystallised quartzite
granophyre
microgranite
porphyry
quartz porphyry
rhyolite
trachyte
Rocks and civil engineering 221
www.angoothachaap.blogspot.com
www.angoothachaap.blogspot.com
7.2 Engineering properties of rocks
7.2.1 Isotropism
The arrangement of mineral constituents and textural elements of a rock in threedimensions is described as its fabric. In metamorphic rocks parallel orientation of minerals occurs (e.g. in schists and well banded gneisses) and such rocks are said to beanisotropic. Rocks that have no preferred arrangement of their components (e.g. manyplutonic and hypobassal igneous rocks, and metamorphic hornfelses) are said to beisotropic.
7.2.2 Rock index properties
Certain properties of rocks are of particular importance to the engineer as they may affectthe planning and cost of a project. Prior knowledge of these index properties from tests will guide decisions such as whether a body of rock will be blasted by explosives or beremoved more simply for ripping (see p. 228), and whether excavated rock can serve assuitable constructional material for a specific purpose or lacks the essentialcharacteristics. These index properties are now defined.
SPECIFIC GRAVITY
(1) Dry apparent specific gravity determination (G b). Two methods need to be employed, depending upon the porosity of the rock sample:
(a) Method for rocks with higher porosities (>10%); this laboratory test is used for many sedimentary rocks and highly weathered igneous and metamorphic rocks. First, the sample is oven dried at 105°C for 12 h (or until constant weight), and weighed (W 1). Then the rock sample is immediately coated with paraffin wax or some other material whose density ( γ
w) is known. The wax layer is cooled and the sample weighed (W 2).
Schist group Artificial group
phyllite clinker(BS 1165)
schist air-cooled slag (BS 1047)
slate
all severely sheared rocks
Geology for civil engineers 222
www.angoothachaap.blogspot.com
www.angoothachaap.blogspot.com
The volume of water (V) displaced by the sample is measured.
Then dry apparent specific gravity of rock G b=W 1/V 1
(b) Method for rocks with lower porosities (<10%); well compacted or cemented sedimentary rocks, all fresh igneous and metamorphic rocks. A Walker Balance is used. The sample is suspended in air and weighed (W 1). It is immersed in water and weighed again (W 2). Then G b=W 1/(W 1–W 2). If a White Specific Gravity Balance is used, G b can be read directly from the balance (accurate to 0.01).
(2) Saturated apparent specific gravity determination (G b(sat)). If the saturation moisture content (i s or S) and its dry apparent specific gravity (G b) are known, then:
(i s is defined on p. 222.)
(3) Solid mineral grain specific gravity determination (G s). If is and G b are known, then G s can be calculated since
G s can be obtained directly using a density bottle:
(a) Dry the density bottle and stopper at 105°C and weigh (W 1). (b) The rock should be crushed to a mesh size about equal to the grain size of the rock.
A sample should be dried (105°C for 4 h) and put into the density bottle (about one-third full) and weighed (W 2).
(c) Distilled water is added to the density bottle until the sample of rock powder is covered, and the density bottle is then placed in a desiccator which is evacuated slowly of air.
(d) Release vacuum and vibrate bottle gently. Repeat (c) and (d) until no more air issues from sample.
(e) Fill density bottle with distilled water, put in stopper, and keep in a constant temperature bath for 1 h, adding water to the bottle if its volume decreases.
(f) Wipe dry the stoppered density bottle and weigh (W 3). Empty, clean and refill density bottle with distilled water, and keep at a constant temperature for 1 h. Then wipe clean and reweigh (W 4).
Rocks and civil engineering 223
www.angoothachaap.blogspot.com
www.angoothachaap.blogspot.com
Two determinations should be made for each sample and the results then averaged.
MOISTURE CONTENT
To determine the moisture content (w or m), the rock sample is weighed immediately onbeing removed from its airtight container, e.g. a plastic bag (W 1). The rock sample isdried to constant weight in an oven at 105°C for 12 h. Cool in a desiccator and reweigh(W 2). Then:
SATURATION MOISTURE CONTENT
If the sample has already had its moisture content determined, it has therefore been ovendried and weighed (W 2). Place sample in wire basket and immerse in water for at least 12h. Remove and weigh after surface drying (W 3). Then, saturation moisture content (i s orS) is expressed by the equation:
If the sample is very weak, immerse in water first (before oven drying) and obtain weightof saturated sample. Then oven dry and reweigh, before obtaining is.
POROSITY
Porosity, n, is dimensionless, and is the ratio of the volume of voids in a soil or rock, V v ,to the total volume, V T , that is n =V v /V T (cf. void ratio which is the ratio of thevolume of voids, V v, to the volume of solids, V s; or V v /V s). It is expressed as apercentage or as a decimal fraction. In rocks, 10% is average, 5% is low, and 15% or lessis high.
Relationships between the index properties G b, G s, i s and n can be expressed in theform of a nomogram (Fig. 7.1) designed by Duncan (1969).
Geology for civil engineers 224
www.angoothachaap.blogspot.com
www.angoothachaap.blogspot.com
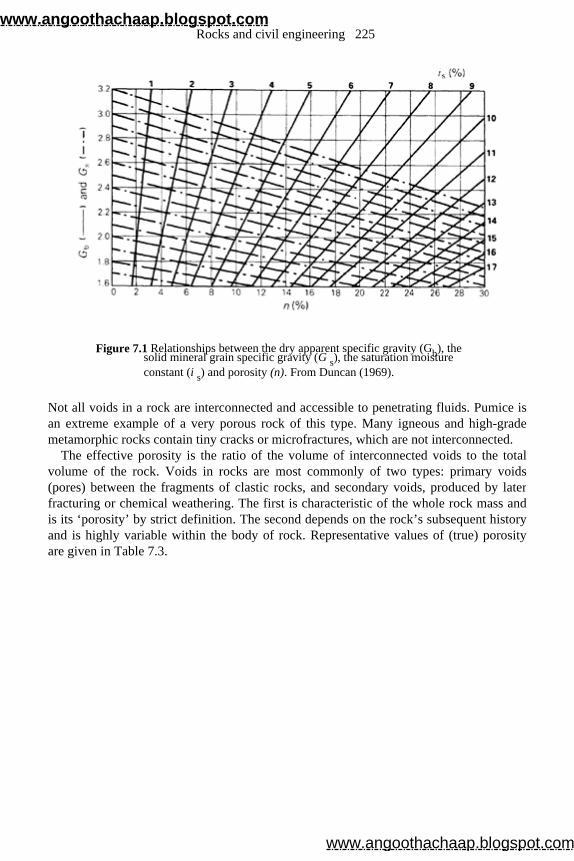
Figure 7.1 Relationships between the dry apparent specific gravity (Gb), the solid mineral grain specific gravity (G s), the saturation moisture constant (i s) and porosity (n). From Duncan (1969).
Not all voids in a rock are interconnected and accessible to penetrating fluids. Pumice isan extreme example of a very porous rock of this type. Many igneous and high-grade metamorphic rocks contain tiny cracks or microfractures, which are not interconnected.
The effective porosity is the ratio of the volume of interconnected voids to the total volume of the rock. Voids in rocks are most commonly of two types: primary voids(pores) between the fragments of clastic rocks, and secondary voids, produced by laterfracturing or chemical weathering. The first is characteristic of the whole rock mass andis its ‘porosity’ by strict definition. The second depends on the rock’s subsequent history and is highly variable within the body of rock. Representative values of (true) porosityare given in Table 7.3.
Rocks and civil engineering 225
www.angoothachaap.blogspot.com
www.angoothachaap.blogspot.com
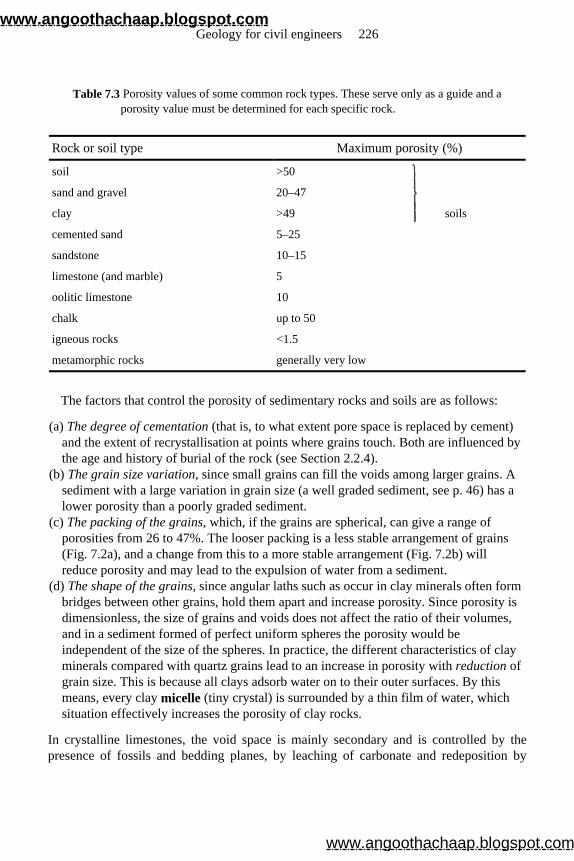
The factors that control the porosity of sedimentary rocks and soils are as follows:
(a) The degree of cementation (that is, to what extent pore space is replaced by cement) and the extent of recrystallisation at points where grains touch. Both are influenced by the age and history of burial of the rock (see Section 2.2.4).
(b) The grain size variation, since small grains can fill the voids among larger grains. A sediment with a large variation in grain size (a well graded sediment, see p. 46) has a lower porosity than a poorly graded sediment.
(c) The packing of the grains, which, if the grains are spherical, can give a range of porosities from 26 to 47%. The looser packing is a less stable arrangement of grains (Fig. 7.2a), and a change from this to a more stable arrangement (Fig. 7.2b) will reduce porosity and may lead to the expulsion of water from a sediment.
(d) The shape of the grains, since angular laths such as occur in clay minerals often form bridges between other grains, hold them apart and increase porosity. Since porosity is dimensionless, the size of grains and voids does not affect the ratio of their volumes, and in a sediment formed of perfect uniform spheres the porosity would be independent of the size of the spheres. In practice, the different characteristics of clay minerals compared with quartz grains lead to an increase in porosity with reduction of grain size. This is because all clays adsorb water on to their outer surfaces. By this means, every clay micelle (tiny crystal) is surrounded by a thin film of water, which situation effectively increases the porosity of clay rocks.
In crystalline limestones, the void space is mainly secondary and is controlled by thepresence of fossils and bedding planes, by leaching of carbonate and redeposition by
Table 7.3 Porosity values of some common rock types. These serve only as a guide and a porosity value must be determined for each specific rock.
Rock or soil type Maximum porosity (%)
soil >50
sand and gravel 20–47
clay >49 soils
cemented sand 5–25
sandstone 10–15
limestone (and marble) 5
oolitic limestone 10
chalk up to 50
igneous rocks <1.5
metamorphic rocks generally very low
Geology for civil engineers 226
www.angoothachaap.blogspot.com
www.angoothachaap.blogspot.com
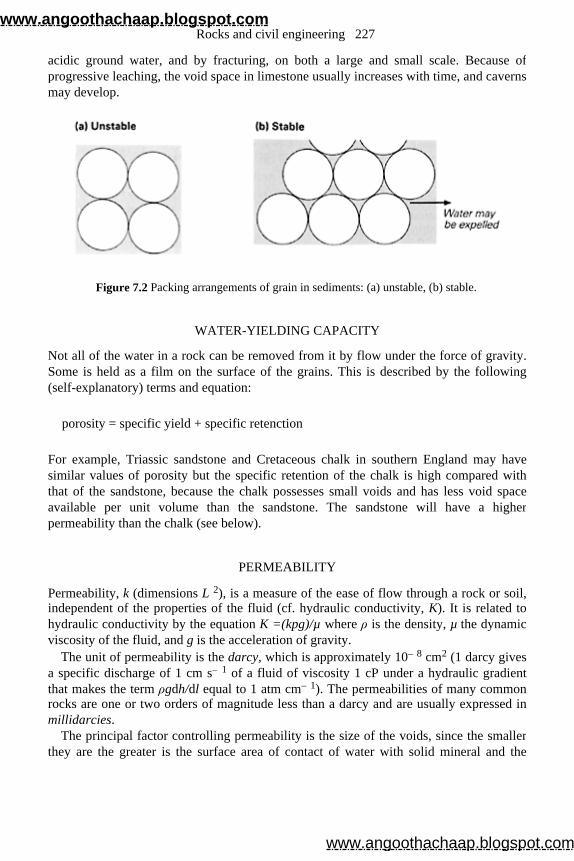
acidic ground water, and by fracturing, on both a large and small scale. Because ofprogressive leaching, the void space in limestone usually increases with time, and cavernsmay develop.
Figure 7.2 Packing arrangements of grain in sediments: (a) unstable, (b) stable.
WATER-YIELDING CAPACITY
Not all of the water in a rock can be removed from it by flow under the force of gravity.Some is held as a film on the surface of the grains. This is described by the following(self-explanatory) terms and equation:
For example, Triassic sandstone and Cretaceous chalk in southern England may havesimilar values of porosity but the specific retention of the chalk is high compared withthat of the sandstone, because the chalk possesses small voids and has less void spaceavailable per unit volume than the sandstone. The sandstone will have a higherpermeability than the chalk (see below).
PERMEABILITY
Permeability, k (dimensions L 2), is a measure of the ease of flow through a rock or soil,independent of the properties of the fluid (cf. hydraulic conductivity, K). It is related to hydraulic conductivity by the equation K =(kpg)/µ where ρ is the density, µ the dynamic viscosity of the fluid, and g is the acceleration of gravity.
The unit of permeability is the darcy, which is approximately 10– 8 cm2 (1 darcy gives a specific discharge of 1 cm s– 1 of a fluid of viscosity 1 cP under a hydraulic gradient that makes the term ρgdh/dl equal to 1 atm cm– 1). The permeabilities of many commonrocks are one or two orders of magnitude less than a darcy and are usually expressed inmillidarcies.
The principal factor controlling permeability is the size of the voids, since the smaller they are the greater is the surface area of contact of water with solid mineral and the
porosity = specific yield + specific retenction
Rocks and civil engineering 227
www.angoothachaap.blogspot.com
www.angoothachaap.blogspot.com
greater are the capillary forces restraining flow. In loose soils permeability increases withthe (diameter)2 of the grains. Flow also takes place through secondary voids such as joints, and rocks of this character are usually referred to as pervious rather thanpermeable.
A rough estimate of k may be obtained from grain size, and a better approximation byusing a permeameter for a laboratory test. A reliable value of bulk permeability of a rockbody is best obtained by well tests in the field (Section 5.1.2).
HYDRAULIC CONDUCTIVITY
The hydraulic conductivity, K, which is called the coefficient of permeability in someolder publications, is a measure of the ease of flow of water through a soil or rock under a given hydraulic gradient. It is defined by Darcy’s Law, by which it is determined experimentally (Section 5.1.1). Hydraulic conductivity (dimensions L S –1) is linked to the rock index property permeability (k), and also to the viscosity and density of the fluid (water). It is not a rock index property. It has the dimensions of a velocity and is oftenexpressed as metres per day (m day– 1). Typical values for soils are: clays 0–1 m day– 1; sand 10–260 m day– 1; gravel up to 300 m day–1.
SWELLING COEFFICIENT (E s)
This is a measure of the change of length of a sample which was initially oven dried thensoaked in water till it became fully saturated, expressed as a ratio of the original (dry) andfinal (saturated) lengths. This swelling behaviour is related to the amount of expansiveclay minerals contained in a rock. The behaviour of rocks in water can be expressed interms of their ability to resist slaking when exposed to water, using the slake durability test (Franklin et al. 1971).
SEISMIC VELOCITIES (Vp and Vs)
These are discussed fully elsewhere (see Section 6.3.2).
REBOUND NUMBER
Rebound number (R) is measured using a Schmidt Concrete Test Hammer, type N, and is used to assess in situ strength of rocks. The rebound height of the hammer is expressedas a percentage of the forward travel distance of the hammer mass.
UNIAXIAL (OR UNCONFINED) COMPRESSIVE STRENGTH
Before measuring the strength of a specimen of rock it is important to ensure that the rockspecimen has been correctly prepared. The procedures are outlined below.
Geology for civil engineers 228
www.angoothachaap.blogspot.com
www.angoothachaap.blogspot.com
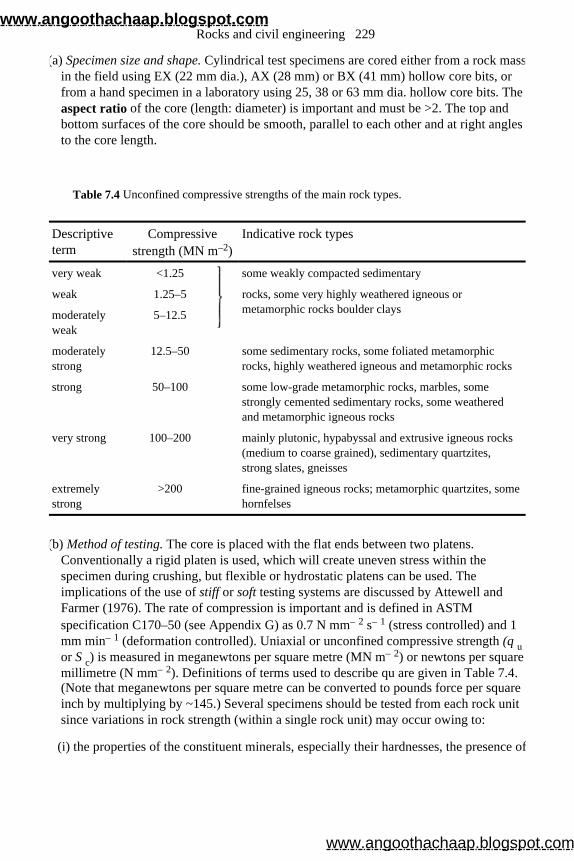
(a) Specimen size and shape. Cylindrical test specimens are cored either from a rock mass in the field using EX (22 mm dia.), AX (28 mm) or BX (41 mm) hollow core bits, or from a hand specimen in a laboratory using 25, 38 or 63 mm dia. hollow core bits. The aspect ratio of the core (length: diameter) is important and must be >2. The top and bottom surfaces of the core should be smooth, parallel to each other and at right angles to the core length.
(b) Method of testing. The core is placed with the flat ends between two platens. Conventionally a rigid platen is used, which will create uneven stress within the specimen during crushing, but flexible or hydrostatic platens can be used. The implications of the use of stiff or soft testing systems are discussed by Attewell and Farmer (1976). The rate of compression is important and is defined in ASTM specification C170–50 (see Appendix G) as 0.7 N mm– 2 s– 1 (stress controlled) and 1 mm min– 1 (deformation controlled). Uniaxial or unconfined compressive strength (q u or S c) is measured in meganewtons per square metre (MN m– 2) or newtons per square millimetre (N mm– 2). Definitions of terms used to describe qu are given in Table 7.4. (Note that meganewtons per square metre can be converted to pounds force per square inch by multiplying by ~145.) Several specimens should be tested from each rock unit since variations in rock strength (within a single rock unit) may occur owing to:
(i) the properties of the constituent minerals, especially their hardnesses, the presence of
Table 7.4 Unconfined compressive strengths of the main rock types.
Descriptive term
Compressive strength (MN m–2)
Indicative rock types
very weak <1.25
some weakly compacted sedimentary
weak 1.25–5 rocks, some very highly weathered igneous or metamorphic rocks boulder clays moderately
weak 5–12.5
moderately strong
12.5–50 some sedimentary rocks, some foliated metamorphic rocks, highly weathered igneous and metamorphic rocks
strong 50–100 some low-grade metamorphic rocks, marbles, some strongly cemented sedimentary rocks, some weathered and metamorphic igneous rocks
very strong 100–200 mainly plutonic, hypabyssal and extrusive igneous rocks (medium to coarse grained), sedimentary quartzites, strong slates, gneisses
extremely strong
>200 fine-grained igneous rocks; metamorphic quartzites, some hornfelses
Rocks and civil engineering 229
www.angoothachaap.blogspot.com
www.angoothachaap.blogspot.com
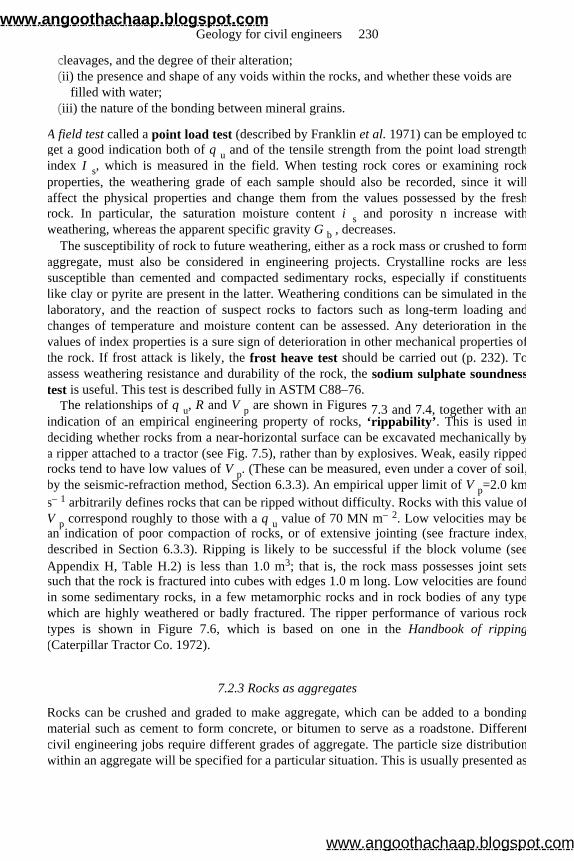
cleavages, and the degree of their alteration; (ii) the presence and shape of any voids within the rocks, and whether these voids are
filled with water; (iii) the nature of the bonding between mineral grains.
A field test called a point load test (described by Franklin et al. 1971) can be employed toget a good indication both of q u and of the tensile strength from the point load strengthindex I s, which is measured in the field. When testing rock cores or examining rockproperties, the weathering grade of each sample should also be recorded, since it willaffect the physical properties and change them from the values possessed by the freshrock. In particular, the saturation moisture content i s and porosity n increase withweathering, whereas the apparent specific gravity G b , decreases.
The susceptibility of rock to future weathering, either as a rock mass or crushed to formaggregate, must also be considered in engineering projects. Crystalline rocks are lesssusceptible than cemented and compacted sedimentary rocks, especially if constituentslike clay or pyrite are present in the latter. Weathering conditions can be simulated in thelaboratory, and the reaction of suspect rocks to factors such as long-term loading andchanges of temperature and moisture content can be assessed. Any deterioration in thevalues of index properties is a sure sign of deterioration in other mechanical properties ofthe rock. If frost attack is likely, the frost heave test should be carried out (p. 232). Toassess weathering resistance and durability of the rock, the sodium sulphate soundnesstest is useful. This test is described fully in ASTM C88–76.
The relationships of q u, R and V p are shown in Figures 7.3 and 7.4, together with anindication of an empirical engineering property of rocks, ‘rippability’. This is used indeciding whether rocks from a near-horizontal surface can be excavated mechanically bya ripper attached to a tractor (see Fig. 7.5), rather than by explosives. Weak, easily rippedrocks tend to have low values of V p. (These can be measured, even under a cover of soil,by the seismic-refraction method, Section 6.3.3). An empirical upper limit of V p=2.0 kms– 1 arbitrarily defines rocks that can be ripped without difficulty. Rocks with this value ofV p correspond roughly to those with a q u value of 70 MN m– 2. Low velocities may bean indication of poor compaction of rocks, or of extensive jointing (see fracture index,described in Section 6.3.3). Ripping is likely to be successful if the block volume (seeAppendix H, Table H.2) is less than 1.0 m3; that is, the rock mass possesses joint setssuch that the rock is fractured into cubes with edges 1.0 m long. Low velocities are foundin some sedimentary rocks, in a few metamorphic rocks and in rock bodies of any typewhich are highly weathered or badly fractured. The ripper performance of various rocktypes is shown in Figure 7.6, which is based on one in the Handbook of ripping(Caterpillar Tractor Co. 1972).
7.2.3 Rocks as aggregates
Rocks can be crushed and graded to make aggregate, which can be added to a bondingmaterial such as cement to form concrete, or bitumen to serve as a roadstone. Differentcivil engineering jobs require different grades of aggregate. The particle size distributionwithin an aggregate will be specified for a particular situation. This is usually presented as
Geology for civil engineers 230
www.angoothachaap.blogspot.com
www.angoothachaap.blogspot.com
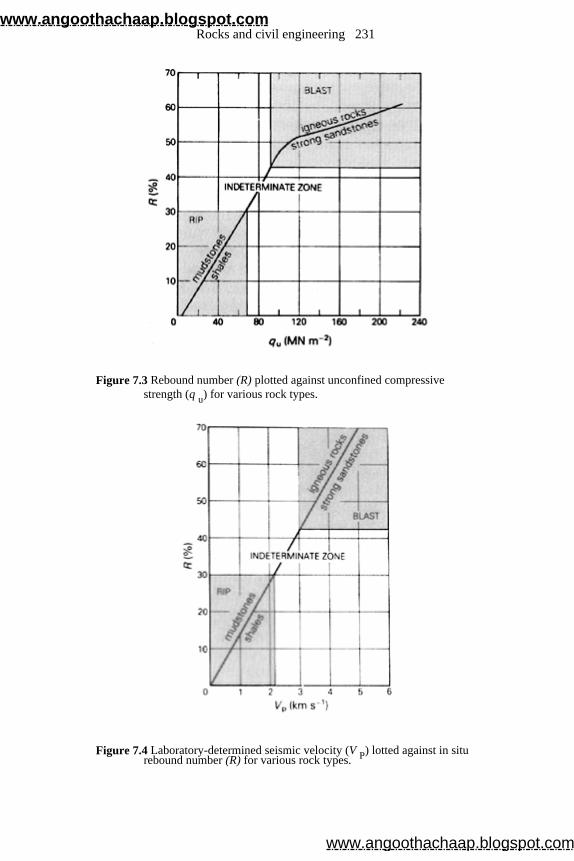
Figure 7.3 Rebound number (R) plotted against unconfined compressive strength (q u) for various rock types.
Figure 7.4 Laboratory-determined seismic velocity (V P) lotted against in situ rebound number (R) for various rock types.
Rocks and civil engineering 231
www.angoothachaap.blogspot.com
www.angoothachaap.blogspot.com
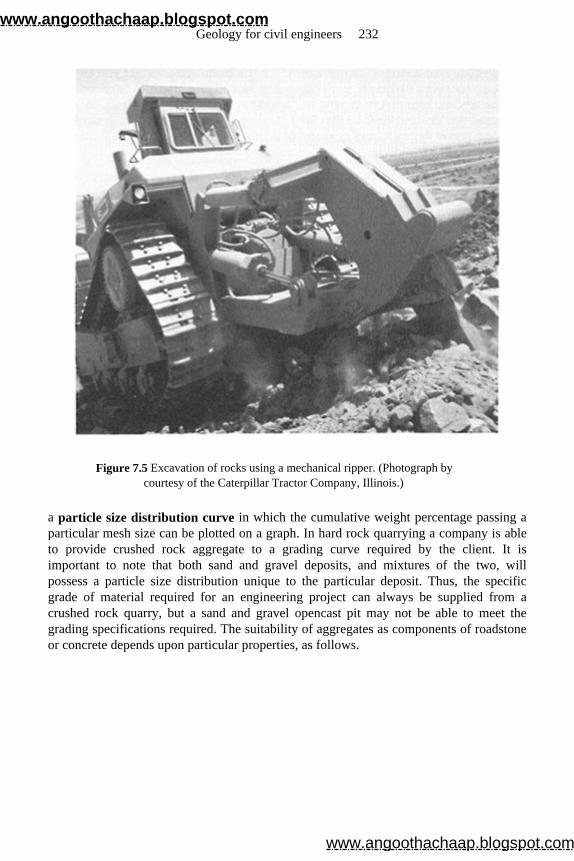
Figure 7.5 Excavation of rocks using a mechanical ripper. (Photograph by courtesy of the Caterpillar Tractor Company, Illinois.)
a particle size distribution curve in which the cumulative weight percentage passing aparticular mesh size can be plotted on a graph. In hard rock quarrying a company is ableto provide crushed rock aggregate to a grading curve required by the client. It isimportant to note that both sand and gravel deposits, and mixtures of the two, willpossess a particle size distribution unique to the particular deposit. Thus, the specific grade of material required for an engineering project can always be supplied from acrushed rock quarry, but a sand and gravel opencast pit may not be able to meet thegrading specifications required. The suitability of aggregates as components of roadstoneor concrete depends upon particular properties, as follows.
Geology for civil engineers 232
www.angoothachaap.blogspot.com
www.angoothachaap.blogspot.com
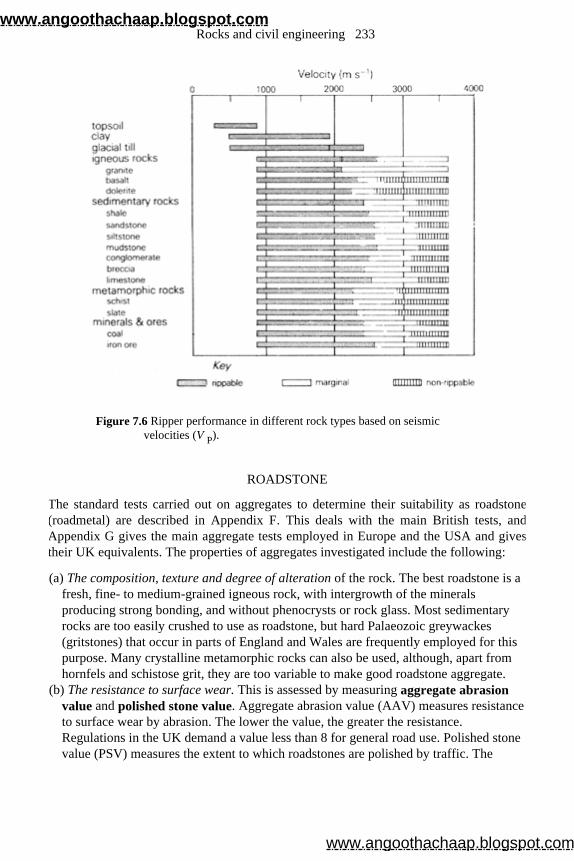
Figure 7.6 Ripper performance in different rock types based on seismic velocities (V P).
ROADSTONE
The standard tests carried out on aggregates to determine their suitability as roadstone(roadmetal) are described in Appendix F. This deals with the main British tests, andAppendix G gives the main aggregate tests employed in Europe and the USA and givestheir UK equivalents. The properties of aggregates investigated include the following:
(a) The composition, texture and degree of alteration of the rock. The best roadstone is a fresh, fine- to medium-grained igneous rock, with intergrowth of the minerals producing strong bonding, and without phenocrysts or rock glass. Most sedimentary rocks are too easily crushed to use as roadstone, but hard Palaeozoic greywackes (gritstones) that occur in parts of England and Wales are frequently employed for this purpose. Many crystalline metamorphic rocks can also be used, although, apart from hornfels and schistose grit, they are too variable to make good roadstone aggregate.
(b) The resistance to surface wear. This is assessed by measuring aggregate abrasion value and polished stone value. Aggregate abrasion value (AAV) measures resistance to surface wear by abrasion. The lower the value, the greater the resistance. Regulations in the UK demand a value less than 8 for general road use. Polished stone value (PSV) measures the extent to which roadstones are polished by traffic. The
Rocks and civil engineering 233
www.angoothachaap.blogspot.com
www.angoothachaap.blogspot.com
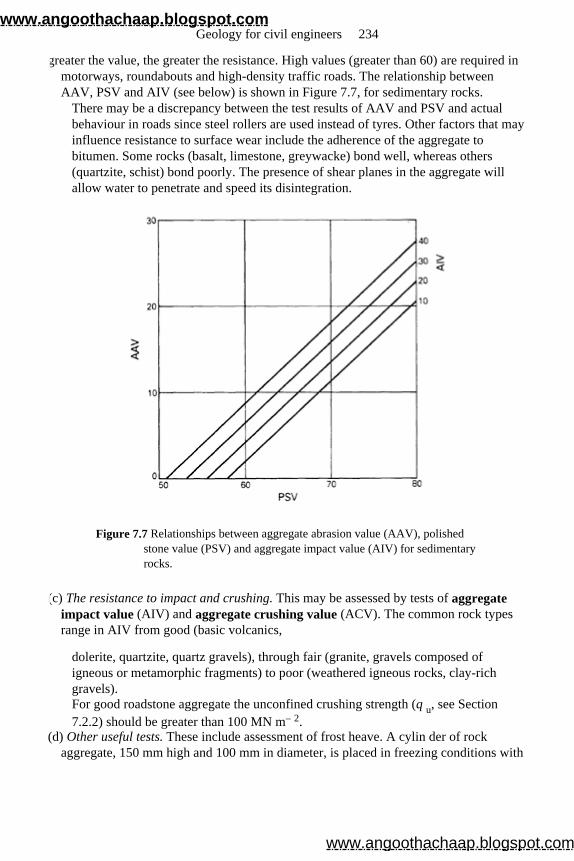
greater the value, the greater the resistance. High values (greater than 60) are required in motorways, roundabouts and high-density traffic roads. The relationship between AAV, PSV and AIV (see below) is shown in Figure 7.7, for sedimentary rocks.
There may be a discrepancy between the test results of AAV and PSV and actual behaviour in roads since steel rollers are used instead of tyres. Other factors that may influence resistance to surface wear include the adherence of the aggregate to bitumen. Some rocks (basalt, limestone, greywacke) bond well, whereas others (quartzite, schist) bond poorly. The presence of shear planes in the aggregate will allow water to penetrate and speed its disintegration.
Figure 7.7 Relationships between aggregate abrasion value (AAV), polished stone value (PSV) and aggregate impact value (AIV) for sedimentary rocks.
(c) The resistance to impact and crushing. This may be assessed by tests of aggregate impact value (AIV) and aggregate crushing value (ACV). The common rock types range in AIV from good (basic volcanics,
dolerite, quartzite, quartz gravels), through fair (granite, gravels composed of igneous or metamorphic fragments) to poor (weathered igneous rocks, clay-rich gravels). For good roadstone aggregate the unconfined crushing strength (q u, see Section 7.2.2) should be greater than 100 MN m– 2.
(d) Other useful tests. These include assessment of frost heave. A cylin der of rock aggregate, 150 mm high and 100 mm in diameter, is placed in freezing conditions with
Geology for civil engineers 234
www.angoothachaap.blogspot.com
www.angoothachaap.blogspot.com
its base in flowing water for 250 h. The expansion (or heave) suffered by the specimen must be less than 12 mm.
Tests of 10% fines, specific gravity, water absorption and bulk density are also used andare described in Appendix F. Further, technical details are available in BS 812 (1977).The main US tests are given in Appendix G with their British Standard equivalents.
CONCRETE
The suitability of aggregate for use in concrete can be assessed on the following criteria:
(a) The aggregate should be free from sulphide minerals, especially pyrite. Coal, clay and organic matter should also be absent.
(b) The specific gravity should usually be high, but this criterion depends upon the purpose for which the concrete is needed.
(c) The material should be well graded, with a wide range of particle sizes (see p. 46). (d) The fragments should have a rough surface, so that a good bond can be achieved
between the aggregate and the cement paste. (e) Chalcedonic silica (flint, chert, agate) and glassy siliceous rocks (rhyolite, pitchstone)
are often undesirable in gravel aggregate since they react with highly alkaline cements. (This problem can be overcome by using a low-alkali cement.) An assessment of their relative abundance in the gravel should be made.
(f) The amount of acid-soluble material (sulphate) should be measured. (g) The shrinkage of the concrete as it dries should be measured. This test is made on
cubes of concrete prepared from the aggregate and the shrinkage is expressed as a percentage. Low-shrinkage concrete has values less than 0.045%.
The tests on concrete are given in Appendix F. Special aggregates are required for particular purposes; for example, where a concrete
is going to be subjected to marked changes of temperature, the coefficient of expansionand the variation of this within an aggregate are important (Table 7.5). Differentialexpansion on heating produces stresses within the concrete. Fire-resistant concrete oftenuses artificial aggregate (slag) or limestone because of their consistency and uniformity ofexpansion. Again, prestressed concrete in high-rise buildings needs low-shrinkagequalities, and limestone and pure quartz gravels provide them. Oil platforms require low-density aggregates (limestone, granite), with low shrinkage. In contrast, atomic reactorsrequire high-density aggregate, and barite has been used in addition, to increase thedensity.
Rocks and civil engineering 235
www.angoothachaap.blogspot.com
www.angoothachaap.blogspot.com
7.2.4 Characteristics of some common rock types as aggregates
The following may serve as a practical guide in assessing the suitability of a particularrock mass as a source of aggregate. In all cases, weathered rock and fault zones should beavoided because of loss of rock quality.
AGGREGATES COMPOSED OF FRESH IGNEOUS ROCK
(a) Basic igneous rocks have better PSV and worse AAV than acid igneous rocks. (b) Fine-grained rocks have poorer PSV and much better AAV and AIV than coarse-
grained rocks of the same composition. (c) A very small amount of weathering of a roadstone aggregate is advantageous as it
helps bonding of the aggregate to bitumen. Greater weathering severely reduces the qualities of the rock.
(d) Basic igneous rocks have poorer concrete shrinkage values than acid igneous rocks. The latter are extremely good (less than 0.040%).
(e) Fine-grained, non-vesicular, non-porphyritic rocks have better shrinkage values than their coarse-grained equivalents.
Note that all aggregates required for a project must have current test certificates for theengineering tests specified, and testing should be carried out regularly. Aggregateproduced from weathered or highly weathered igneous rock will often be unsuitable forengineering use.
The common sources of aggregate among igneous rocks are varieties of dolerite, basalt and granite. Dolerites have a good AAV where the grain size is very small, and the bestPSV where the grain size is very large, such as may occur in a very thick igneous sheet.Basalts are more uniform in grain size, and the PSV and AIV do not usually vary muchthrough a rock mass. The zone between different lava flows should be avoided because ofthe concentration of vesicles and amygdales. Granites are prone to weathering which haspenetrated deep into the rock mass along fractures. There is a consequent drop incrushing strength and impact value. Even in areas of glacial erosion, alteration may affectrock at depths more than 25 m below the surface. Clear of these zones of poor rock,
Table 7.5 Coefficients of expansion of some rock aggregates.
calcareous rocks (limestones) 1.3 x 10⁻⁶ºC–1
crystalline igneous rocks 2.2 x 10⁻⁶ °C–1
compact rocks (shales,marls) 2.8 x 10– 6ºC–1
indurated light-coloured rocks (quartzites) 3.6 x 10– 6ºC– 1
cemented light-coloured rocks (sandstones, gritstones) 3.8 x 10– 6ºC– 1
Geology for civil engineers 236
www.angoothachaap.blogspot.com
www.angoothachaap.blogspot.com
granite is typically uniform in essential properties for an aggregate. Occasionally, mica-rich granites are found, which may be unsuitable for aggregate use, especially if there ismore than 10% mica, but tests should be carried out to examine the suitability of the rockas aggregate.
AGGREGATES COMPOSED OF SEDIMENTARY ROCK
The qualities of sedimentary rocks are very variable and most are unsuitable for use asaggregates. The factors influencing PSV, AAV and AIV can be summarised thus:
Greywacke (gritstone) has a good PSV, but the AAV often prevents it from meeting standards in the UK. Conglomerate, sandstone (often from colliery tips) and shale (fromoilshale spoil heaps) are occasionally used as rockfill, including road formation beneaththe sub-base, where specifications are undemanding. In general, however, their useshould be avoided unless extensive tests are carried out. As in other sedimentary rocks,porosity (n) tends to be inversely proportional to unconfined crushing strength; thusaggregates with low n values will be best. Limestones are used as aggregate, particularly the indurated varieties with low porosity. As roadstone aggregate, marbles are moresuitable than limestones, but their PSV is low (almost always less than 50). Limestone is,however, an excellent concrete aggregate because of its very low shrinkage quality.
AGGREGATES COMPOSED OF METAMORPHIC ROCK
Among the metamorphic rocks, the fine-grained, non-foliated types, such as hornfelses and quartzites, have the best compressive strengths, low shrinkage values and good AIVand AAV, though their PSV is usually only moderate or poor (less than 57). The foliatedmetamorphic rocks (slate, schist) have good impact values and crushing strengthsperpendicular to the banding, but poor values parallel to the banding. They are only usedin concrete or road aggregate as fill material, except in the case of high-grade, coarse-grained gneisses, which have properties similar to those of granite. They may, however,be an ideal hydraulic stone for sea defences and dam walls, as they split readily into natural slabs which have high resistance to erosion.
Engineering test data and mean values for several different rock types are given in Appendix F.
GRAVEL
Gravel and sand are widely quarried from natural deposits in the UK. Production of sand
higher porosity gives better PSV, worse AAV and worse AIV
lower quartz fines give better PSV, better AAV and worse AIV
lower quartz fragments give better PSV, better AAV and better AIV
lower feldspar gives better PSV, unaltered AAV and better AIV
higher clay gives better PSV, worse AAV and worse AIV
Rocks and civil engineering 237
www.angoothachaap.blogspot.com
www.angoothachaap.blogspot.com
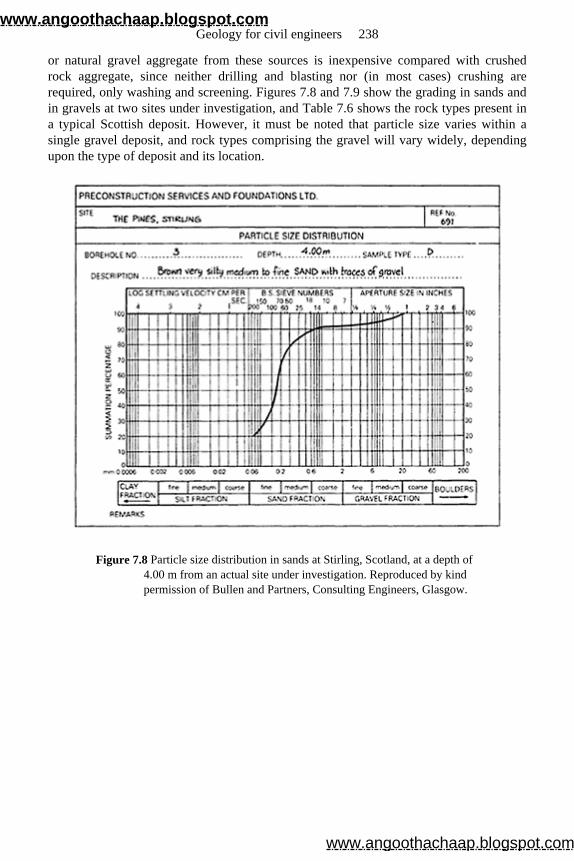
or natural gravel aggregate from these sources is inexpensive compared with crushedrock aggregate, since neither drilling and blasting nor (in most cases) crushing arerequired, only washing and screening. Figures 7.8 and 7.9 show the grading in sands and in gravels at two sites under investigation, and Table 7.6 shows the rock types present in a typical Scottish deposit. However, it must be noted that particle size varies within asingle gravel deposit, and rock types comprising the gravel will vary widely, dependingupon the type of deposit and its location.
Figure 7.8 Particle size distribution in sands at Stirling, Scotland, at a depth of 4.00 m from an actual site under investigation. Reproduced by kind permission of Bullen and Partners, Consulting Engineers, Glasgow.
Geology for civil engineers 238
www.angoothachaap.blogspot.com
www.angoothachaap.blogspot.com
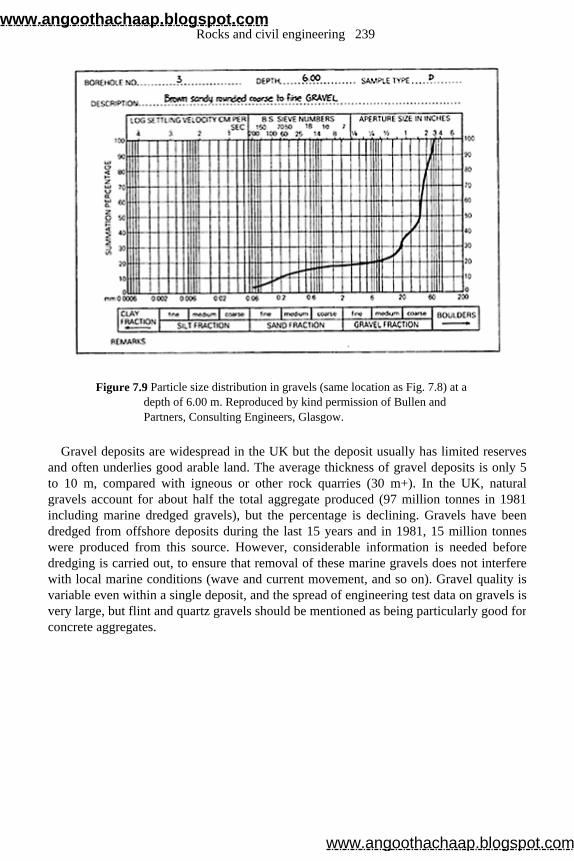
Figure 7.9 Particle size distribution in gravels (same location as Fig. 7.8) at a depth of 6.00 m. Reproduced by kind permission of Bullen and Partners, Consulting Engineers, Glasgow.
Gravel deposits are widespread in the UK but the deposit usually has limited reservesand often underlies good arable land. The average thickness of gravel deposits is only 5to 10 m, compared with igneous or other rock quarries (30 m+). In the UK, naturalgravels account for about half the total aggregate produced (97 million tonnes in 1981including marine dredged gravels), but the percentage is declining. Gravels have beendredged from offshore deposits during the last 15 years and in 1981, 15 million tonneswere produced from this source. However, considerable information is needed beforedredging is carried out, to ensure that removal of these marine gravels does not interferewith local marine conditions (wave and current movement, and so on). Gravel quality isvariable even within a single deposit, and the spread of engineering test data on gravels isvery large, but flint and quartz gravels should be mentioned as being particularly good forconcrete aggregates.
Rocks and civil engineering 239
www.angoothachaap.blogspot.com
www.angoothachaap.blogspot.com
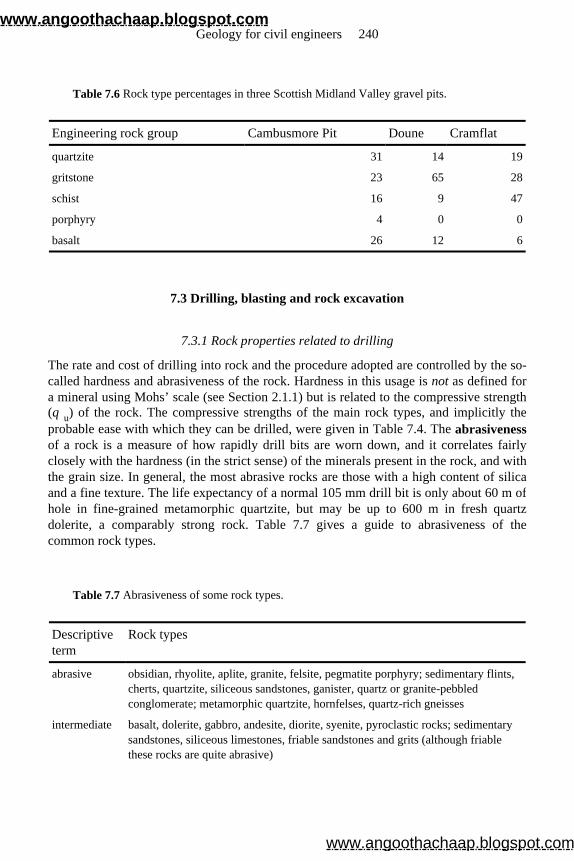
7.3 Drilling, blasting and rock excavation
7.3.1 Rock properties related to drilling
The rate and cost of drilling into rock and the procedure adopted are controlled by the so-called hardness and abrasiveness of the rock. Hardness in this usage is not as defined for a mineral using Mohs’ scale (see Section 2.1.1) but is related to the compressive strength(q u) of the rock. The compressive strengths of the main rock types, and implicitly theprobable ease with which they can be drilled, were given in Table 7.4. The abrasiveness of a rock is a measure of how rapidly drill bits are worn down, and it correlates fairlyclosely with the hardness (in the strict sense) of the minerals present in the rock, and withthe grain size. In general, the most abrasive rocks are those with a high content of silicaand a fine texture. The life expectancy of a normal 105 mm drill bit is only about 60 m ofhole in fine-grained metamorphic quartzite, but may be up to 600 m in fresh quartzdolerite, a comparably strong rock. Table 7.7 gives a guide to abrasiveness of the common rock types.
Table 7.6 Rock type percentages in three Scottish Midland Valley gravel pits.
Engineering rock group Cambusmore Pit Doune Cramflat
quartzite 31 14 19
gritstone 23 65 28
schist 16 9 47
porphyry 4 0 0
basalt 26 12 6
Table 7.7 Abrasiveness of some rock types.
Descriptive term
Rock types
abrasive obsidian, rhyolite, aplite, granite, felsite, pegmatite porphyry; sedimentary flints, cherts, quartzite, siliceous sandstones, ganister, quartz or granite-pebbled conglomerate; metamorphic quartzite, hornfelses, quartz-rich gneisses
intermediate basalt, dolerite, gabbro, andesite, diorite, syenite, pyroclastic rocks; sedimentary sandstones, siliceous limestones, friable sandstones and grits (although friable these rocks are quite abrasive)
Geology for civil engineers 240
www.angoothachaap.blogspot.com
www.angoothachaap.blogspot.com
7.3.2 Blasting techniques
Full accounts of rock blasting methods are given by Langefors and Kihlström (1973) and McGregor (1968). A useful handbook has been produced by Du Pont (1963). There arethree main stages in excavating rock by explosives and reducing it to manageable-sized pieces: drilling, blasting, and secondary blasting or drop-balling. The particular technique, including the choice of explosives and how they are placed within the rock,depends on the following factors:
(a) The type of rock: there may be relatively soft sedimentary layers requiring low-density, low-strength explosives, or hard crystalline rocks requiring high-density, high-strength explosives.
(b) The degree of fragmentation required, especially in quarry work where the rock must be suitable for the loading and crushing machinery.
(c) The shot-hole condition, which may be dry or wet. For the latter, a water-resistant explosive, such as gelignite or TNT-based slurry, is required. If the shot holes are partially filled with water, a waterresistant type of explosive is used until the charge column has been brought above the water line.
(d) The size of the shot hole, which can be anything from 75 mm (3 in) to 300 mm (12 in) in diameter (see Table 6.3). In the UK, 105-mm holes are the most common, for both quarrying and other excavation. Very large diameter holes (300 mm or greater) are unsuitable for rock blasting where the compressive strength of the rock is more than 170 MN m– 2.
Present methods vary widely in choice and positioning of explosives. A technique which was widespread, but has increasingly been superseded by other methods because of theimproved efficiency of modern drilling methods, is heading blasting. Small tunnels are driven into the rock mass for about 15 m, then side tunnels are driven parallel to theoutside face of the rock mass from the tunnel ends. Chambers are made at intervals alongthese drives and packed with explosives, and these charges are then fired. This techniqueoriginally used black powder (a mixture of charcoal, potassium nitrate and sulphur) butimproved safety precautions have stopped the use of this explosive mixture.
Drill holes are commonly of three types:
(a)Small-diameter (75 mm or less) short holes are used where the rock face is being excavated in steps (benches). Vertical holes up to 5 m deep are drilled in a line parallel to the free face. The horizontal distance from the bottom of the holes to the free face must always be less than the depth of the hole. By this method the yield of rock is 8–11 tonnes per kilogram of explosive (the blasting ratio).
(b)Small-diameter long holes are used where ground vibration from blasting must be
least abrasive all weathered igneous and decomposed rocks, serpentine; metamorphic slates, schists, marbles; sedimentary limestones, clays, shales, mudstones, marls, chalk, coals
Rocks and civil engineering 241
www.angoothachaap.blogspot.com
www.angoothachaap.blogspot.com
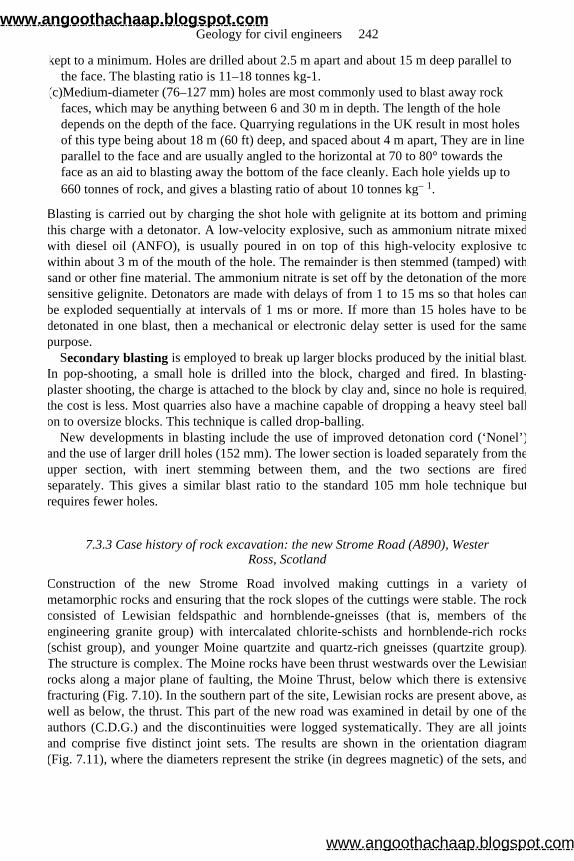
kept to a minimum. Holes are drilled about 2.5 m apart and about 15 m deep parallel to the face. The blasting ratio is 11–18 tonnes kg-1.
(c)Medium-diameter (76–127 mm) holes are most commonly used to blast away rock faces, which may be anything between 6 and 30 m in depth. The length of the hole depends on the depth of the face. Quarrying regulations in the UK result in most holes of this type being about 18 m (60 ft) deep, and spaced about 4 m apart, They are in line parallel to the face and are usually angled to the horizontal at 70 to 80° towards the face as an aid to blasting away the bottom of the face cleanly. Each hole yields up to 660 tonnes of rock, and gives a blasting ratio of about 10 tonnes kg– 1.
Blasting is carried out by charging the shot hole with gelignite at its bottom and primingthis charge with a detonator. A low-velocity explosive, such as ammonium nitrate mixedwith diesel oil (ANFO), is usually poured in on top of this high-velocity explosive towithin about 3 m of the mouth of the hole. The remainder is then stemmed (tamped) withsand or other fine material. The ammonium nitrate is set off by the detonation of the moresensitive gelignite. Detonators are made with delays of from 1 to 15 ms so that holes canbe exploded sequentially at intervals of 1 ms or more. If more than 15 holes have to bedetonated in one blast, then a mechanical or electronic delay setter is used for the samepurpose.
Secondary blasting is employed to break up larger blocks produced by the initial blast.In pop-shooting, a small hole is drilled into the block, charged and fired. In blasting-plaster shooting, the charge is attached to the block by clay and, since no hole is required,the cost is less. Most quarries also have a machine capable of dropping a heavy steel ballon to oversize blocks. This technique is called drop-balling.
New developments in blasting include the use of improved detonation cord (‘Nonel’)and the use of larger drill holes (152 mm). The lower section is loaded separately from theupper section, with inert stemming between them, and the two sections are firedseparately. This gives a similar blast ratio to the standard 105 mm hole technique butrequires fewer holes.
7.3.3 Case history of rock excavation: the new Strome Road (A890), Wester Ross, Scotland
Construction of the new Strome Road involved making cuttings in a variety ofmetamorphic rocks and ensuring that the rock slopes of the cuttings were stable. The rockconsisted of Lewisian feldspathic and hornblende-gneisses (that is, members of theengineering granite group) with intercalated chlorite-schists and hornblende-rich rocks(schist group), and younger Moine quartzite and quartz-rich gneisses (quartzite group).The structure is complex. The Moine rocks have been thrust westwards over the Lewisianrocks along a major plane of faulting, the Moine Thrust, below which there is extensivefracturing (Fig. 7.10). In the southern part of the site, Lewisian rocks are present above, aswell as below, the thrust. This part of the new road was examined in detail by one of theauthors (C.D.G.) and the discontinuities were logged systematically. They are all jointsand comprise five distinct joint sets. The results are shown in the orientation diagram(Fig. 7.11), where the diameters represent the strike (in degrees magnetic) of the sets, and
Geology for civil engineers 242
www.angoothachaap.blogspot.com
www.angoothachaap.blogspot.com
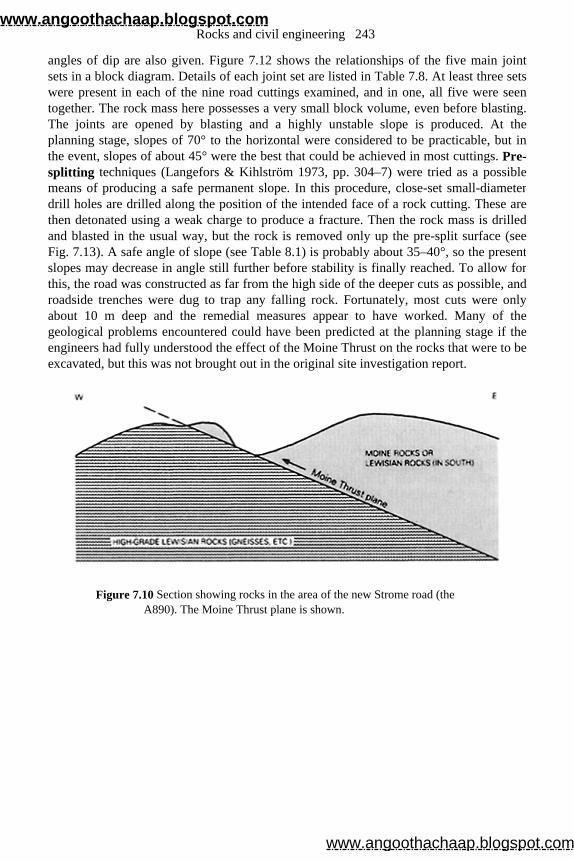
angles of dip are also given. Figure 7.12 shows the relationships of the five main joint sets in a block diagram. Details of each joint set are listed in Table 7.8. At least three sets were present in each of the nine road cuttings examined, and in one, all five were seentogether. The rock mass here possesses a very small block volume, even before blasting.The joints are opened by blasting and a highly unstable slope is produced. At theplanning stage, slopes of 70° to the horizontal were considered to be practicable, but in the event, slopes of about 45° were the best that could be achieved in most cuttings. Pre-splitting techniques (Langefors & Kihlström 1973, pp. 304–7) were tried as a possible means of producing a safe permanent slope. In this procedure, close-set small-diameter drill holes are drilled along the position of the intended face of a rock cutting. These arethen detonated using a weak charge to produce a fracture. Then the rock mass is drilledand blasted in the usual way, but the rock is removed only up the pre-split surface (see Fig. 7.13). A safe angle of slope (see Table 8.1) is probably about 35–40°, so the present slopes may decrease in angle still further before stability is finally reached. To allow forthis, the road was constructed as far from the high side of the deeper cuts as possible, androadside trenches were dug to trap any falling rock. Fortunately, most cuts were onlyabout 10 m deep and the remedial measures appear to have worked. Many of thegeological problems encountered could have been predicted at the planning stage if theengineers had fully understood the effect of the Moine Thrust on the rocks that were to beexcavated, but this was not brought out in the original site investigation report.
Figure 7.10 Section showing rocks in the area of the new Strome road (the A890). The Moine Thrust plane is shown.
Rocks and civil engineering 243
www.angoothachaap.blogspot.com
www.angoothachaap.blogspot.com
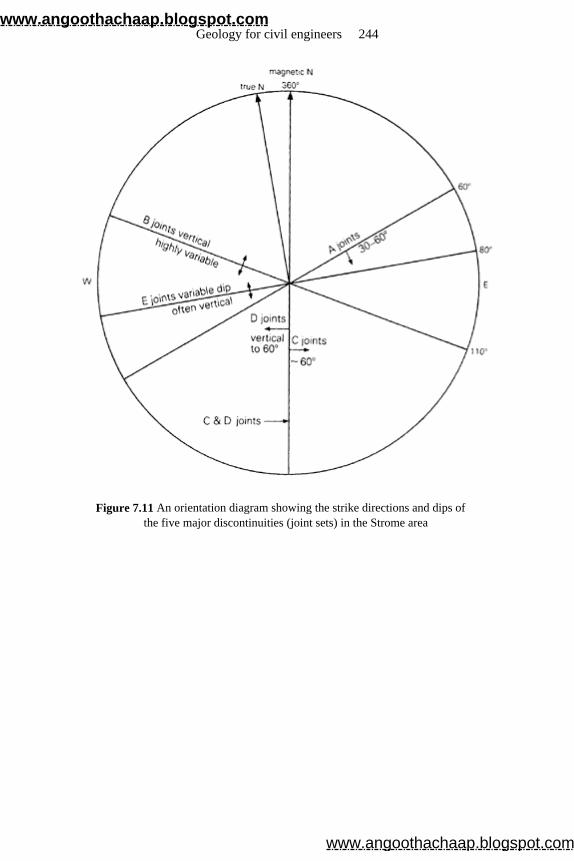
Figure 7.11 An orientation diagram showing the strike directions and dips of the five major discontinuities (joint sets) in the Strome area
Geology for civil engineers 244
www.angoothachaap.blogspot.com
www.angoothachaap.blogspot.com
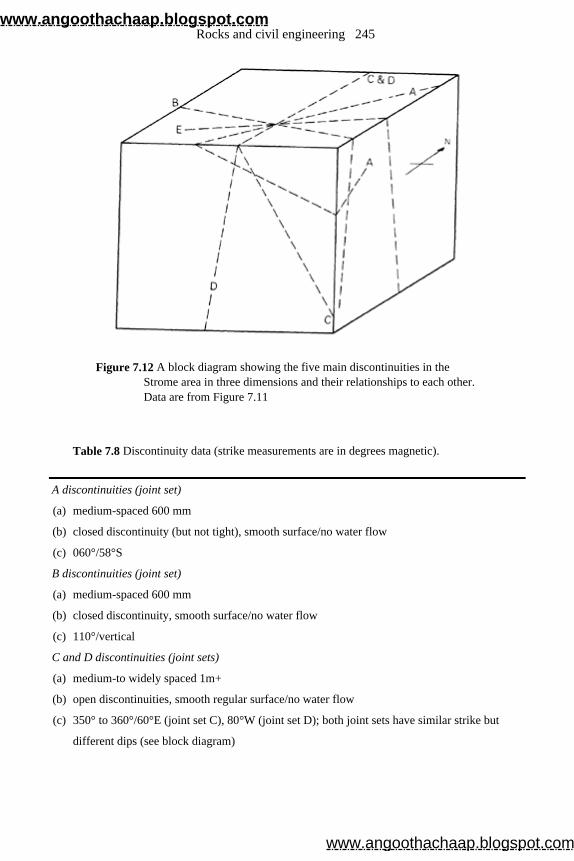
Figure 7.12 A block diagram showing the five main discontinuities in the Strome area in three dimensions and their relationships to each other. Data are from Figure 7.11
Table 7.8 Discontinuity data (strike measurements are in degrees magnetic).
A discontinuities (joint set)
(a) medium-spaced 600 mm
(b) closed discontinuity (but not tight), smooth surface/no water flow
(c) 060°/58°S
B discontinuities (joint set)
(a) medium-spaced 600 mm
(b) closed discontinuity, smooth surface/no water flow
(c) 110°/vertical
C and D discontinuities (joint sets)
(a) medium-to widely spaced 1m+
(b) open discontinuities, smooth regular surface/no water flow
(c) 350° to 360°/60°E (joint set C), 80°W (joint set D); both joint sets have similar strike but
different dips (see block diagram)
Rocks and civil engineering 245
www.angoothachaap.blogspot.com
www.angoothachaap.blogspot.com

Figure 7.13 Pre-split rock surface in a road cutting for the M90 motorway near Perth, Scotland.
7.3.4 Test problem
The reader can test his or her grasp of this and the previous chapter by analysing the datashown in Table 7.9. These are measurements made on various rock types that crop out inan area where large-scale excavation for a concrete dam is required. The relationships ofthe rocks are shown on the section (Fig. 7.14).
E discontinuities (joint set)
(a) medium-spaced 600 mm
(b) closed discontinuity, smooth surface/no water flow
(c) 080°/vertical but variable—always steep
Geology for civil engineers 246
www.angoothachaap.blogspot.com
www.angoothachaap.blogspot.com
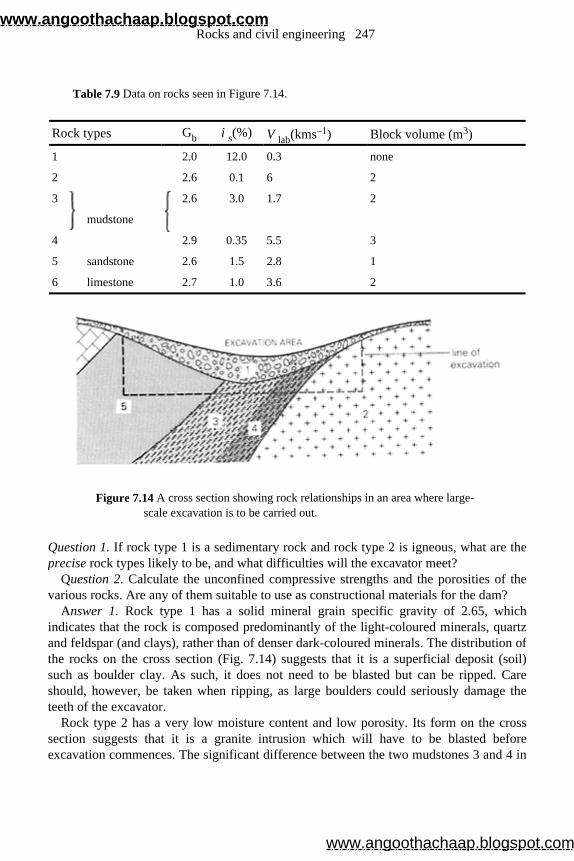
Figure 7.14 A cross section showing rock relationships in an area where large-scale excavation is to be carried out.
Question 1. If rock type 1 is a sedimentary rock and rock type 2 is igneous, what are the precise rock types likely to be, and what difficulties will the excavator meet?
Question 2. Calculate the unconfined compressive strengths and the porosities of the various rocks. Are any of them suitable to use as constructional materials for the dam?
Answer 1. Rock type 1 has a solid mineral grain specific gravity of 2.65, whichindicates that the rock is composed predominantly of the light-coloured minerals, quartz and feldspar (and clays), rather than of denser dark-coloured minerals. The distribution of the rocks on the cross section (Fig. 7.14) suggests that it is a superficial deposit (soil) such as boulder clay. As such, it does not need to be blasted but can be ripped. Careshould, however, be taken when ripping, as large boulders could seriously damage theteeth of the excavator.
Rock type 2 has a very low moisture content and low porosity. Its form on the crosssection suggests that it is a granite intrusion which will have to be blasted beforeexcavation commences. The significant difference between the two mudstones 3 and 4 in
Table 7.9 Data on rocks seen in Figure 7.14.
Rock types Gb i s(%) V lab(kms–1) Block volume (m3)
1 2.0 12.0 0.3 none
2 2.6 0.1 6 2
3
2.6 3.0 1.7 2
mudstone
4 2.9 0.35 5.5 3
5 sandstone 2.6 1.5 2.8 1
6 limestone 2.7 1.0 3.6 2
Rocks and civil engineering 247
www.angoothachaap.blogspot.com
www.angoothachaap.blogspot.com

Table 7.9 is that the latter occurs within the thermal aureole of the granite and has been baked. This has altered the engineering properties (lowered porosity, increased specificgravity). As a result, whereas mudstone 3 can be ripped, mudstone 4 will almost certainlyhave to be blasted. The pattern of blasting of rocks 2 and 4 should be chosen carefully toproduce small blocks that are suitable f or easy loading. The initial block volume in theserocks is such that huge blocks are defined by the natural fracture pattern and they wouldbe difficult to excavate without further breakage.
Answer 2. The rocks have porosities and compressive strengths as follows:
(1) n=24.0%, q u<10 MN m–2. (2) n=0.26%, q u>250 MN m–2. (3) n=7.8%, q u=50 MN m–2. (4) n=0.96%, q u=175 MN m–2. (5) n=3.9%, q u=85 MN m–2. (6) n=2.70%, q u>105 MN m–2.
n values are obtained from the nomogram (Fig. 7.1) by plotting in G b and i s values. V labvalues are plotted into Fig. 7.4 and R values obtained, which are then plotted into Fig. 7.3to get q u.
An outer skin of strong rock is used to form a hydraulic stone facing to an earth-type dam, and large blocks of either the granite (2) or the metamorphosed mudstone (4) would be suitable. Types 2, 4, 5 and 6 would provide good coarse aggregate to fill the core of anearth dam. Types 1 and 3 may give rise to problems and should not be used for thispurpose. If the structure were a concrete dam, the best aggregate for the concrete wouldbe the granite (2) and the limestone (6), as they have the quality of low shrinkage. Sincethe granite must be excavated, it makes sense to crush it and use it as aggregate, ratherthan quarry the limestone (6) only for that purpose.
References and selected reading
Attewell, P.B. and I.W.Farmer 1976. Principles of engineering geology . London: Chapman and Hall.
British Standards Institution 1965. Specification for aggregates from natural sources for concrete (including granolithic). Br. Stand. Inst. Rep. BS 882 and 1201.
British Standards Institution 1967. Specification for gravel aggregates for surface treatment (including surface dressings on roads) . Br. Stand. Inst. Rep. BS 1984.
British Standards Institution 1971. Glossary of mining terms. Section 5: Geology . Br. Stand. Inst. Rep. BS 3618.
British Standards Institution 1973. Methods for the sampling and testing of light-weight aggregates for concrete . Br. Stand. Inst. Rep. BS 3681: Part 2. British Standards Institution 1977. Methods for sampling and testing of mineral
aggregates , sands and fillers . Br. Stand. Inst. Rep. BS 812. Building Research Station 1968. Shrinkage of natural aggregates in concrete . Bldg Res.
Stn Dig. 35. Building Research Establishment 1973. Concrete: materials . Bldg Res. Stn Dig. 150.
Geology for civil engineers 248
www.angoothachaap.blogspot.com
www.angoothachaap.blogspot.com
Caterpillar Tractor Co. 1972. Handbook of ripping . Illinois: Caterpillar Tractor Co. Duncan, N. 1969. Engineering geology and rock mechanics (2 vols). London: Leonard
Hill. Du Pont, E.J. 1963. Blaster’s handbook . USA: E.I.Du Pont de Nemours & Co. Edwards, A.G. 1967. Properties of concrete made with Scottish crushed rock
aggregates . Bldg Res. Stn Eng. Pap. 42. Edwards, A.G. 1970. Scottish aggregates: rock constituents and suitability for concrete .
Bldg Res. Stn 28/70. Franklin, J.A., E.Broch and G.Walton 1971. Logging the mechanical character of rock.
Trans Inst. Min. Metall . 80 , A1–9. Hartley, A. 1974. A review of the geological factors influencing the mechanical
properties of road surface aggregates. Q. J. Engng Geol . 7 , 69–100. Hawkes, I. and M.Mellor 1970. Uniaxial testing in rock mechanics laboratories. Engng
Geol . 4 , 177–286. Hawkes, J.R. and J.R.Hosking 1972. British arenaceous rocks for skid-resistant
surfaces . Transp. Road Res. Lab. Rep. LR 488. Imperial Chemical Industries 1972. Pamphlets on the use of explosives in different
situations . Stevenston, Scotland: Nobels’ Explosive Co. Jaeger, C. 1972. Rock mechanics and engineering . Cambridge: Cambridge University
Press. Langefors, U. and K.Kihlström 1973. The modern technique of rock blasting . New York:
Wiley. McGregor, K. 1968. Drilling of rocks . London: McLaren. Matheson, G.D. 1983. Guidance on pre-split blasting in highway rock excavation .
Working Paper 1982/3. Scottish Brartch TRRL. Orchard, D.F. 1979. Concrete technology (Vols 1 and 2), 4th edn. London: Applied
Science. Road Research Laboratory 1959. Roadstone test data presented in tabular form . Rd Res.
Lab. Rd Note 24. Williams, A.R. and G.Lees 1970. Topographical and petrological variation of road
aggregates and the wet skidding resistance of tyres. Q. J. Engng Geol . 2 , 217–35.
Rocks and civil engineering 249
www.angoothachaap.blogspot.com
www.angoothachaap.blogspot.com
8 Principal geological factors affecting certain
engineering projects
8.1 Stability of slopes and cuttings
8.1.1 Geological factors affecting the stability of a new excavation
The static conditions that control the initial and also the later stability of a steep face cutinto soil or rock, and which may determine the need for support or remedial treatment,are as follows.
The properties in bulk, particularly the shear strength, of the material forming the cutting: the stability of a cutting in rock is usually dependent on the occurrence of jointsand other planes of weakness, and on the amount of cohesion and the friction across theseplanes.
The structure of the rocks and soils, and specifically how any planes of weakness areorientated relative to the newly exposed face: for example, horizontal bedding planes inpoorly jointed sandstone often give nearvertical faces which are stable, whereas faults orjoints striking parallel to the new face, and dipping steeply towards it, will probably beplanes of movement or potential instability.
The groundwater conditions: saturation significantly lowers the strength of most soilscompared with their values when dry. Certain soils weaken to a stage at which they runlike viscous liquids. High pore pressure of ground water in a layer, or in a plane ofweakness, lowers frictional resistance to movement. (The mechanism is the same as thatwhich allows a hovercraft to glide over water, or land on a high-pressure cushion of air.) A dramatic and tragic example of instability triggered by high pore pressure within abody of soils was the Aberfan disaster in 1966, when a spoil heap of mine waste sliddownwards on to a Welsh village enveloping and destroying a large part of the localschool.
Stresses produced by natural loads adjacent to the cutting: steep-sided valleys or mounds affect the state of stress in the ground near the surf ace, not only belowthemselves but also for some distance around. This lateral change in stress conditionsmay be sufficient to cause instability of weak rocks and soils. For example, valley bulges(Section 3.5.8) are produced in this way, and they may be accompanied by instability of an adjacent slope.
www.angoothachaap.blogspot.com
www.angoothachaap.blogspot.com
8.1.2 Other geological factors causing instability of existing slopes
An initially stable slope may become unstable with the passage of time because of humandisturbance. This may consist of adding a fresh load such as a spoil heap, removingsupport by excavating, or triggering movement by vibrations from nearby heavymachinery. The common geological causes are as follows.
Weathering of the soil or rock of the slope so that it becomes weaker: this may affectthe bulk of the material (for example, boulder clay) or may be concentrated along planesin a rock. Chemical alteration of existing minerals is important under certain conditions,as is mechanical break-down in others (Section 3.2.3), Periglacial weathering in Pleistocene times also affects the stability of some present-day cliffs.
Erosion of the slope by a river or other natural agent, usually at its base but possibly along a weaker layer or plane, may cause undermining to take place.
Change in water content of the soil or rock: heavy rain, especially after a drought, saturates the material forming the slope, increasing its mass and the gravitational pull ona given volume, and also reducing the strength of soils and the friction along anydiscontinuities.
8.1.3 Types of failure of soil slopes
Instability of soils on a slope may take one of the following forms.
Creep occurs on steep slopes and produces a downhill movement at low rates (less than 10 mm per year) of the top few metres of soil (see Fig. 8.1). It is facilitated by the effects of frost, and by heavy rain washing out fines from the soil. Any excavation on a slopeaffected by creep is likely to increase movement. Creep may be recognisable bydisplacement of fencing or of a cover of turf, or by drag effects of strata under the soil.
Flow is a rapid movement of waterlogged soil, broken rock and mud down hill, usuallyafter prolonged rain.
Scree or talus slide occurs where rock fragments spall off a fractured rock mass which has been subjected to mechanical weathering. They rest at a natural angle of repose at thefoot of the slope. Excavation at the foot of a scree slope, or inadequate drainage, whichincrease pore water pressure in the mass, will lead to instability of the slope.
Translational failure involves movement along a particular plane of weakness in thesoils of the slope. For example, in a slope formed of a clay layer in sand layers,deterioration of the shear strength of the clay may lead to movement at the boundary ofclay and sand. Failure of this type may occur with slope angles as low as 6°.
Principal geological factors affecting certain engineering projects 251
www.angoothachaap.blogspot.com
www.angoothachaap.blogspot.com
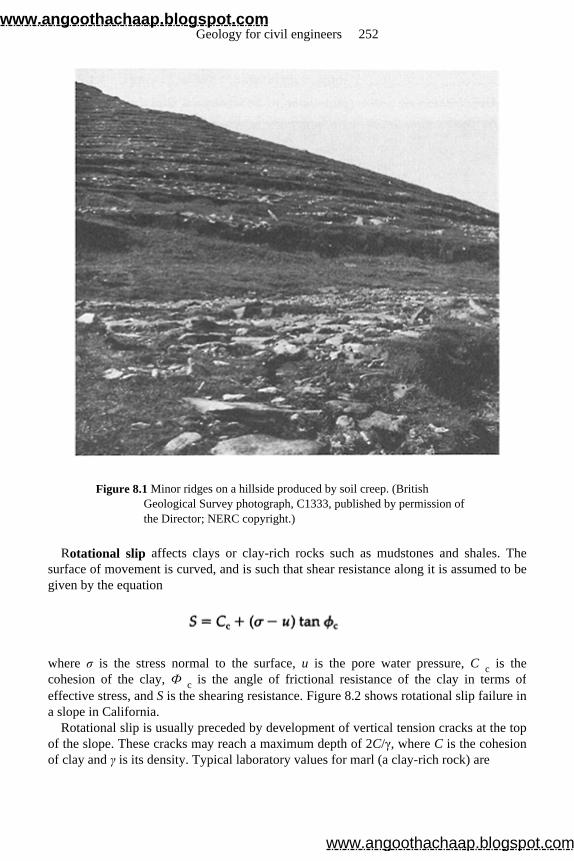
Figure 8.1 Minor ridges on a hillside produced by soil creep. (British Geological Survey photograph, C1333, published by permission of the Director; NERC copyright.)
Rotational slip affects clays or clay-rich rocks such as mudstones and shales. The surface of movement is curved, and is such that shear resistance along it is assumed to begiven by the equation
where σ is the stress normal to the surface, u is the pore water pressure, C c is the cohesion of the clay, Ф c is the angle of frictional resistance of the clay in terms ofeffective stress, and S is the shearing resistance. Figure 8.2 shows rotational slip failure in a slope in California.
Rotational slip is usually preceded by development of vertical tension cracks at the topof the slope. These cracks may reach a maximum depth of 2C/γ, where C is the cohesion of clay and γ is its density. Typical laboratory values for marl (a clay-rich rock) are
Geology for civil engineers 252
www.angoothachaap.blogspot.com
www.angoothachaap.blogspot.com
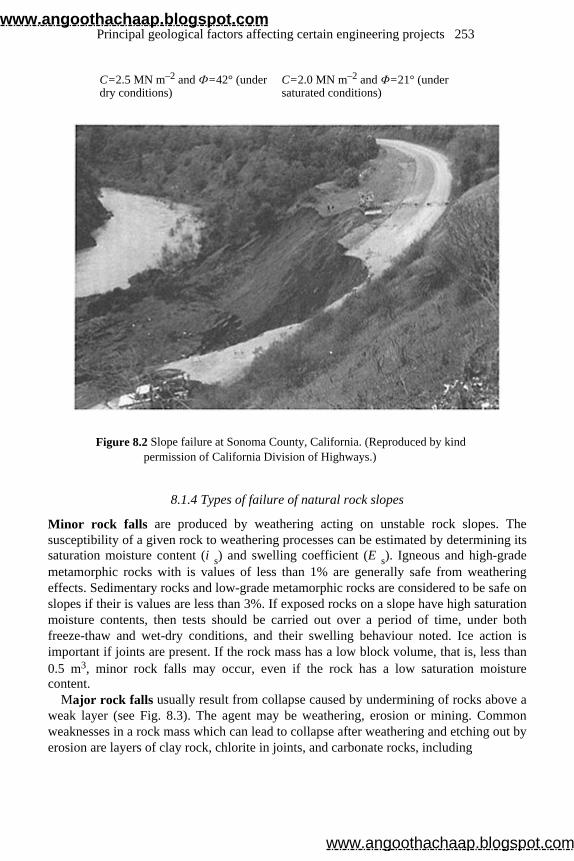
Figure 8.2 Slope failure at Sonoma County, California. (Reproduced by kind permission of California Division of Highways.)
8.1.4 Types of failure of natural rock slopes
Minor rock falls are produced by weathering acting on unstable rock slopes. The susceptibility of a given rock to weathering processes can be estimated by determining itssaturation moisture content (i s) and swelling coefficient (E s). Igneous and high-grade metamorphic rocks with is values of less than 1% are generally safe from weatheringeffects. Sedimentary rocks and low-grade metamorphic rocks are considered to be safe on slopes if their is values are less than 3%. If exposed rocks on a slope have high saturationmoisture contents, then tests should be carried out over a period of time, under bothfreeze-thaw and wet-dry conditions, and their swelling behaviour noted. Ice action is important if joints are present. If the rock mass has a low block volume, that is, less than0.5 m3, minor rock falls may occur, even if the rock has a low saturation moisture content.
Major rock falls usually result from collapse caused by undermining of rocks above aweak layer (see Fig. 8.3). The agent may be weathering, erosion or mining. Common weaknesses in a rock mass which can lead to collapse after weathering and etching out byerosion are layers of clay rock, chlorite in joints, and carbonate rocks, including
C=2.5 MN m–2 and Ф=42° (under dry conditions)
C=2.0 MN m–2 and Φ=21° (under saturated conditions)
Principal geological factors affecting certain engineering projects 253
www.angoothachaap.blogspot.com
www.angoothachaap.blogspot.com
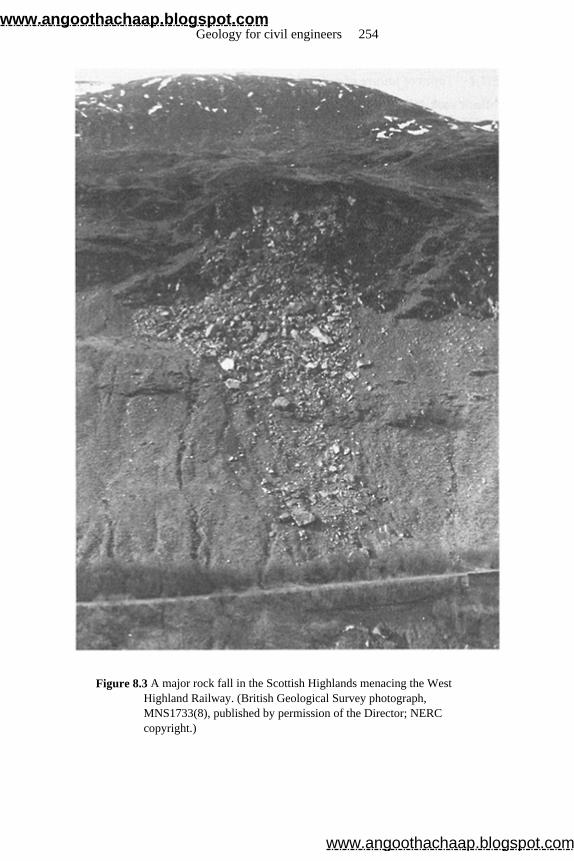
Figure 8.3 A major rock fall in the Scottish Highlands menacing the West Highland Railway. (British Geological Survey photograph, MNS1733(8), published by permission of the Director; NERC copyright.)
Geology for civil engineers 254
www.angoothachaap.blogspot.com
www.angoothachaap.blogspot.com
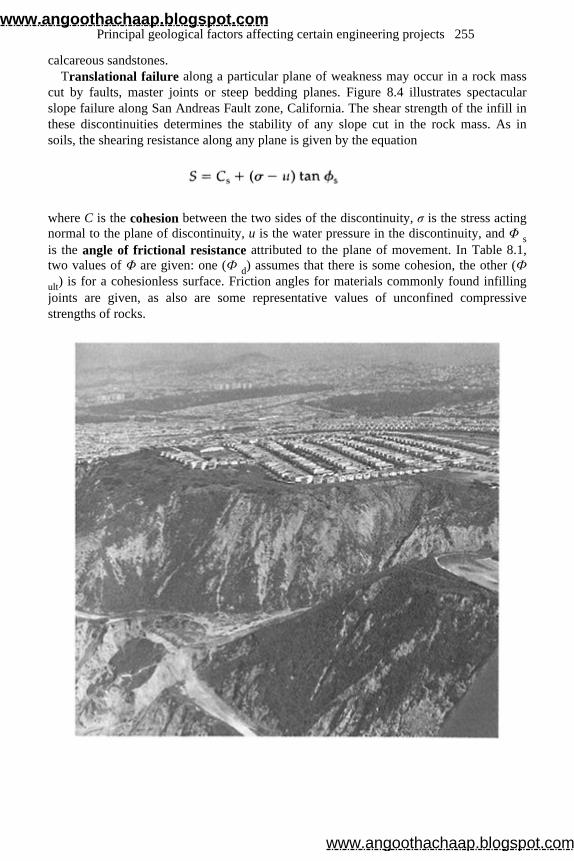
calcareous sandstones. Translational failure along a particular plane of weakness may occur in a rock mass
cut by faults, master joints or steep bedding planes. Figure 8.4 illustrates spectacular slope failure along San Andreas Fault zone, California. The shear strength of the infill inthese discontinuities determines the stability of any slope cut in the rock mass. As insoils, the shearing resistance along any plane is given by the equation
where C is the cohesion between the two sides of the discontinuity, σ is the stress acting normal to the plane of discontinuity, u is the water pressure in the discontinuity, and Φ sis the angle of frictional resistance attributed to the plane of movement. In Table 8.1, two values of Φ are given: one (Ф d) assumes that there is some cohesion, the other (Фult) is for a cohesionless surface. Friction angles for materials commonly found infillingjoints are given, as also are some representative values of unconfined compressivestrengths of rocks.
Principal geological factors affecting certain engineering projects 255
www.angoothachaap.blogspot.com
www.angoothachaap.blogspot.com
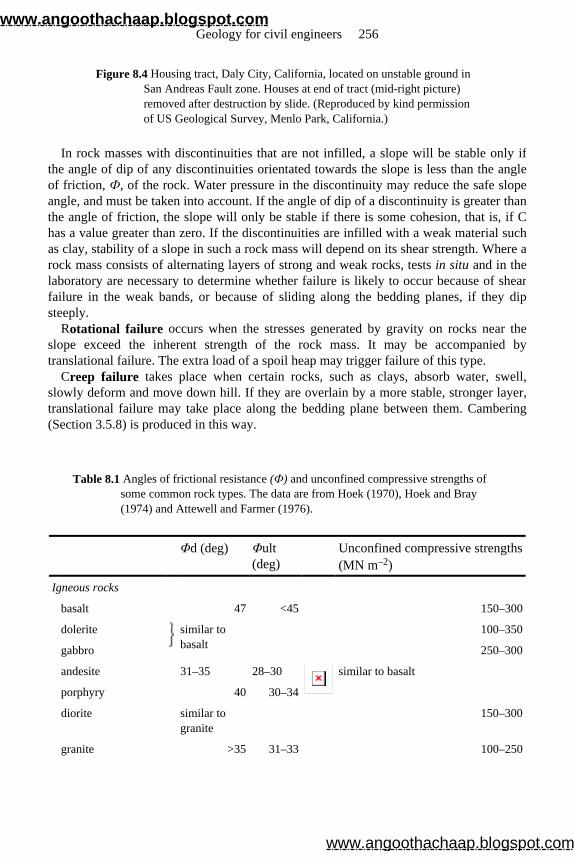
Figure 8.4 Housing tract, Daly City, California, located on unstable ground in San Andreas Fault zone. Houses at end of tract (mid-right picture) removed after destruction by slide. (Reproduced by kind permission of US Geological Survey, Menlo Park, California.)
In rock masses with discontinuities that are not infilled, a slope will be stable only if the angle of dip of any discontinuities orientated towards the slope is less than the angleof friction, Ф, of the rock. Water pressure in the discontinuity may reduce the safe slope angle, and must be taken into account. If the angle of dip of a discontinuity is greater thanthe angle of friction, the slope will only be stable if there is some cohesion, that is, if Chas a value greater than zero. If the discontinuities are infilled with a weak material suchas clay, stability of a slope in such a rock mass will depend on its shear strength. Where arock mass consists of alternating layers of strong and weak rocks, tests in situ and in the laboratory are necessary to determine whether failure is likely to occur because of shearfailure in the weak bands, or because of sliding along the bedding planes, if they dipsteeply.
Rotational failure occurs when the stresses generated by gravity on rocks near theslope exceed the inherent strength of the rock mass. It may be accompanied bytranslational failure. The extra load of a spoil heap may trigger failure of this type.
Creep failure takes place when certain rocks, such as clays, absorb water, swell,slowly deform and move down hill. If they are overlain by a more stable, stronger layer,translational failure may take place along the bedding plane between them. Cambering(Section 3.5.8) is produced in this way.
Table 8.1 Angles of frictional resistance (Ф) and unconfined compressive strengths of some common rock types. The data are from Hoek (1970), Hoek and Bray (1974) and Attewell and Farmer (1976).
Φd (deg) Φult (deg)
Unconfined compressive strengths (MN m–2)
Igneous rocks
basalt 47 <45 150–300
dolerite similar to basalt
100–350
gabbro 250–300
andesite 31–35 28–30 similar to basalt
porphyry 40 30–34
diorite similar to granite
150–300
granite >35 31–33 100–250
Geology for civil engineers 256
www.angoothachaap.blogspot.com
www.angoothachaap.blogspot.com
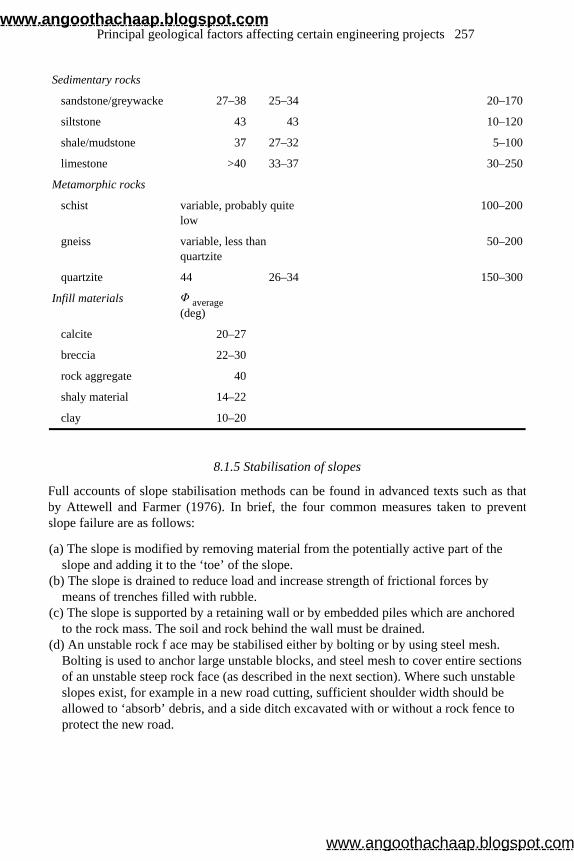
8.1.5 Stabilisation of slopes
Full accounts of slope stabilisation methods can be found in advanced texts such as thatby Attewell and Farmer (1976). In brief, the four common measures taken to preventslope failure are as follows:
(a) The slope is modified by removing material from the potentially active part of the slope and adding it to the ‘toe’ of the slope.
(b) The slope is drained to reduce load and increase strength of frictional forces by means of trenches filled with rubble.
(c) The slope is supported by a retaining wall or by embedded piles which are anchored to the rock mass. The soil and rock behind the wall must be drained.
(d) An unstable rock f ace may be stabilised either by bolting or by using steel mesh. Bolting is used to anchor large unstable blocks, and steel mesh to cover entire sections of an unstable steep rock face (as described in the next section). Where such unstable slopes exist, for example in a new road cutting, sufficient shoulder width should be allowed to ‘absorb’ debris, and a side ditch excavated with or without a rock fence to protect the new road.
Sedimentary rocks
sandstone/greywacke 27–38 25–34 20–170
siltstone 43 43 10–120
shale/mudstone 37 27–32 5–100
limestone >40 33–37 30–250
Metamorphic rocks
schist variable, probably quite low
100–200
gneiss variable, less than quartzite
50–200
quartzite 44 26–34 150–300
Infill materials Φ average (deg)
calcite 20–27
breccia 22–30
rock aggregate 40
shaly material 14–22
clay 10–20
Principal geological factors affecting certain engineering projects 257
www.angoothachaap.blogspot.com
www.angoothachaap.blogspot.com
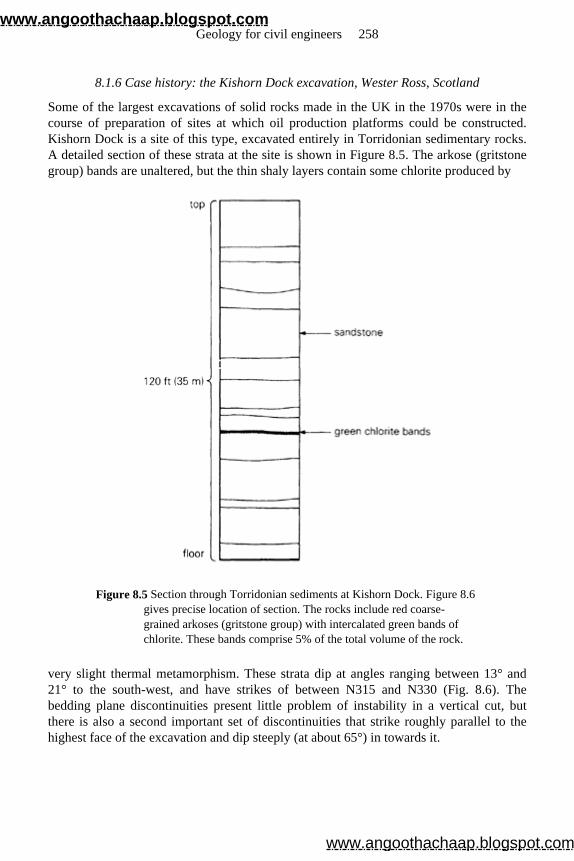
8.1.6 Case history: the Kishorn Dock excavation, Wester Ross, Scotland
Some of the largest excavations of solid rocks made in the UK in the 1970s were in thecourse of preparation of sites at which oil production platforms could be constructed.Kishorn Dock is a site of this type, excavated entirely in Torridonian sedimentary rocks.A detailed section of these strata at the site is shown in Figure 8.5. The arkose (gritstone group) bands are unaltered, but the thin shaly layers contain some chlorite produced by
Figure 8.5 Section through Torridonian sediments at Kishorn Dock. Figure 8.6 gives precise location of section. The rocks include red coarse-grained arkoses (gritstone group) with intercalated green bands of chlorite. These bands comprise 5% of the total volume of the rock.
very slight thermal metamorphism. These strata dip at angles ranging between 13° and 21° to the south-west, and have strikes of between N315 and N330 (Fig. 8.6). The bedding plane discontinuities present little problem of instability in a vertical cut, butthere is also a second important set of discontinuities that strike roughly parallel to thehighest face of the excavation and dip steeply (at about 65°) in towards it.
Geology for civil engineers 258
www.angoothachaap.blogspot.com
www.angoothachaap.blogspot.com
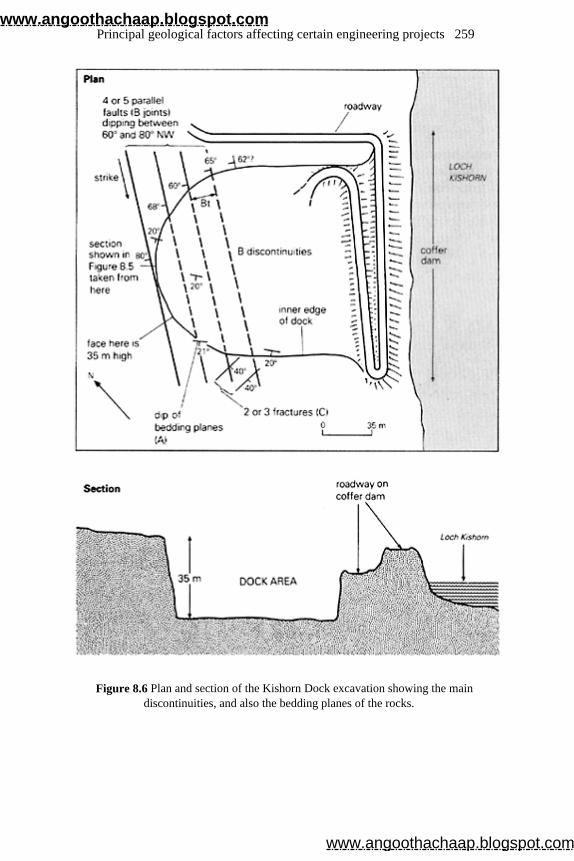
Figure 8.6 Plan and section of the Kishorn Dock excavation showing the main discontinuities, and also the bedding planes of the rocks.
Principal geological factors affecting certain engineering projects 259
www.angoothachaap.blogspot.com
www.angoothachaap.blogspot.com
Table 8.2 gives data on all the discontinuities present. They are small reverse faults,which are secondary features related to the Kishorn Thrust Plane. This is not present atKishorn Dock but crops out nearby. Before erosion to present land surface level, it lay afew hundred metres above the reverse faults seen in the Dock. The relationship of thrustand minor faults below it is a familiar model in structural geology, and the pattern couldhave been expected at the stage of preliminary investigation.
These discontinuities and the broken rock adjacent to them make the rock mass at Kishorn Dock inhomogeneous, potentially unstable in vertical cuts, and awkward toexcavate. For example, a flat floor is an essential feature for a dock of this type, but wasdiffficult to achieve as mechanical shovels tended to gouge the fracture zonespreferentially and to overexcavate locally. It also proved difficult to blast clean-angled benches on the excavated face, and raised the important question of what angle of slopewas needed to make them safe. On the western side of the excavation, the strike of the reverse faults is tangential to the excavated face of the dock, and their dip is away fromthe face at steep angles (more than 65°). When blasting took place there, the nearest faultplane to the face tended to open and the wedge of rock between the plane and the facewould spall off, leaving the Dock face with a dangerous overhang. The most stable dockface there would be one with a low angle of slope (to the horizontal): theoretically a slopeat right angles to the angle of dip of the reverse faults (i.e. an angle of about 30°). This angle would fit well with the friction-angle data given in Table 8.1 (see sandstone). In practice, this was not feasible because of cost, and because there was insufficient freeground at the edge of the excavation to allow these shallower-angled benches to be dug. Instead, the slope angle of the main bench was reduced from vertical to 75°, and chain
Table 8.2 Discontinuity data (see Appendix H).
A discontinuities (bedding planes)
(a) Spacing variable (see section)
(b) Tight discontinuity, rough irregular surface/no water flow
(c) 330°/20° SW (dip variable between 13° and 21°)
B discontinuities (set of parallel faults—very rare)
(a) Very widely spaced 18 m
(b) Open discontinuity 10 mm, smooth with slickensides/no water flow
(c) 025° to 030°/60° to 80° NW
C discontinuities (joint set) found in south excavation
(a) Very widely spaced 15 m
(b) Open discontinuity, smooth surface/no water flow
(c) 090º/40° S
Geology for civil engineers 260
www.angoothachaap.blogspot.com
www.angoothachaap.blogspot.com
mesh was hung on the face to minimise the risk from any rock fall. Stability of the face in the western part of the dock was confused and reduced by the
presence of another important set of joints (the C joints in Fig. 8.6). The same considerations ruled out a slope of 35° but the angle was reduced from 80° to 45° and the face was hung with chain mesh. These solutions proved to be adequate, and during thefirst two-year period after construction no rockfall occurred.
8.2 Impounded surf ace water: geology of reservoir and dam sites
8.2.1 Leakage and other considerations
A reservoir is meant to hold water, hence the principal geological criterion of thesuitability of a reservoir site is that the rocks and soils around and below it form animpervious basin naturally, without need of excessive and expensive grouting of potentialleakage paths. Other geological factors to consider are the consequence of a change in theposition of the water table as the reservoir fills, and the rate at which sediment willaccumulate in the reservoir.
The important sources of leakage from a reservoir are (a) through permeable soils, (b) through rock aquifers, and (c) along faults and master joints.
(a) In regions that have escaped glacial erosion, there may be a thick mantle of weathered rock forming a permeable soil. In glaciated regions, however, soils (most notably boulder clay) may form a useful impervious skin below the reservoir, but other deposits (particularly sand and gravel) may offer paths for leakage. Buried channels infilled with sand and gravel are a possible hazard in both types of region. Superficial deposits can present other problems as well. Drift obscures the shape of the rock-head surface. Peat may flavour and colour the water in the reservoir, and may need to be removed before filling. A change in the water table as the reservoir fills may affect the stability of screes and other soils on the hillsides and cause landslides.
(b) Leakage through rock aquifers is controlled by their structure, and its relationship to the hydraulic gradients produced by the head of water in the new reservoir. For example, leakage along the sandstone layer (Fig. 8.7) would take place in structure ‘b’ but not in ‘a’. The hydraulic gradient slopes down from the reservoir end of the aquifer to its outcrop in an adjacent valley. If, however, the water table in an aquifer, which forms one side of the reservoir (Fig. 8.7), were higher than the top water level of the impounded water, then flow would be towards the reservoir, and there would be replenishment rather than leakage. In general, dips of the aquifer towards the reservoir inhibit leakage along it. Springs and seepages may be useful in indicating the position of the water table and the movement of ground water around the reservoir. Ideally, a reservoir should be sited on impervious rocks or, if only some layers are impervious, on a syncline plunging upstream. Limestone, and to a lesser extent sandstone with a calcareous cement, may present serious hazards. The calcite dissolves, especially if the water has been in contact with peat and is slightly acidic, and leakage paths
Principal geological factors affecting certain engineering projects 261
www.angoothachaap.blogspot.com
www.angoothachaap.blogspot.com
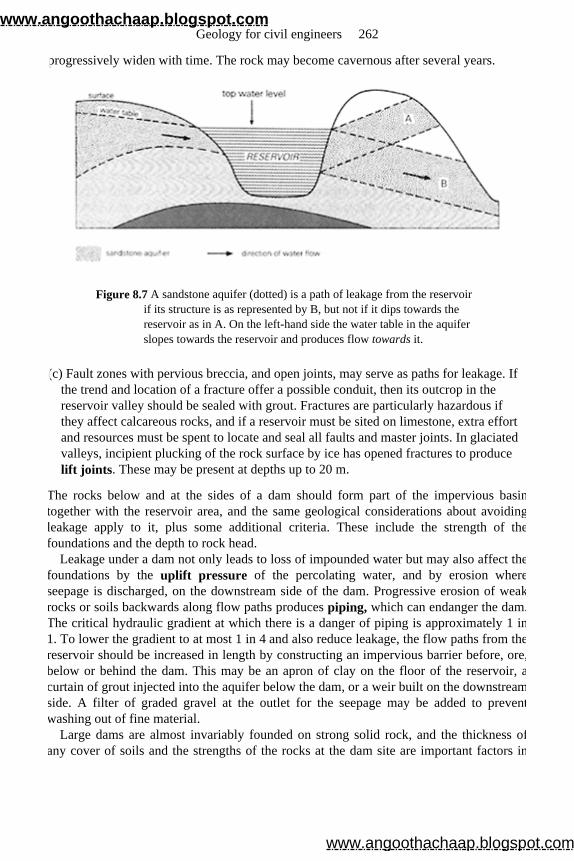
progressively widen with time. The rock may become cavernous after several years.
Figure 8.7 A sandstone aquifer (dotted) is a path of leakage from the reservoir if its structure is as represented by B, but not if it dips towards the reservoir as in A. On the left-hand side the water table in the aquifer slopes towards the reservoir and produces flow towards it.
(c) Fault zones with pervious breccia, and open joints, may serve as paths for leakage. If the trend and location of a fracture offer a possible conduit, then its outcrop in the reservoir valley should be sealed with grout. Fractures are particularly hazardous if they affect calcareous rocks, and if a reservoir must be sited on limestone, extra effort and resources must be spent to locate and seal all faults and master joints. In glaciated valleys, incipient plucking of the rock surface by ice has opened fractures to produce lift joints. These may be present at depths up to 20 m.
The rocks below and at the sides of a dam should form part of the impervious basintogether with the reservoir area, and the same geological considerations about avoidingleakage apply to it, plus some additional criteria. These include the strength of thefoundations and the depth to rock head.
Leakage under a dam not only leads to loss of impounded water but may also affect thefoundations by the uplift pressure of the percolating water, and by erosion whereseepage is discharged, on the downstream side of the dam. Progressive erosion of weakrocks or soils backwards along flow paths produces piping, which can endanger the dam.The critical hydraulic gradient at which there is a danger of piping is approximately 1 in1. To lower the gradient to at most 1 in 4 and also reduce leakage, the flow paths from thereservoir should be increased in length by constructing an impervious barrier before, ore,below or behind the dam. This may be an apron of clay on the floor of the reservoir, acurtain of grout injected into the aquifer below the dam, or a weir built on the downstreamside. A filter of graded gravel at the outlet for the seepage may be added to preventwashing out of fine material.
Large dams are almost invariably founded on strong solid rock, and the thickness ofany cover of soils and the strengths of the rocks at the dam site are important factors in
Geology for civil engineers 262
www.angoothachaap.blogspot.com
www.angoothachaap.blogspot.com
planning and costing the construction and possibly in designing the dam. The additionalexcavation required at a site over a glacial rock basin, compared with one over a rockbarrier which lies a few hundred metres away, may add significantly to the costs. It isimportant, therefore, to explore the position of rock head within the entire area of choice,and to make a contour map of this. The methods of systematic exploration are describedin Chapter 6. Seismic-refraction surveys should be used, combined with borings, todefine rock head, and may also be combined with laboratory measurements of specimensto delineate areas of badly fractured or rotten rock. At the later stages of exploration,rocks at the dam site should be inspected in situ for weathering and fracture, by digging pits or by boring large-diameter holes. Particular attention should be paid to mappingfractures which might behave as zones of seepage from the reservoir, and as zones ofweakness under and at the sides of the dam.
8.2.2 Case history: leakage from Clubbiedean Dam, Midlothian, Scotland
An account of a major dam or of a spectacular disaster might be invoked to illustratethese basic geological points, but this can be done more simply by referring to a modestlyscaled problem described by Sivasubramaniam and Carter (1969). Clubbiedean Dam is asmall earth dam built in 1850 which impounds water for seasonal storage. Leakage hadpersisted over a long period, with eventually some local collapse and visible free flowinto the ground through cracks at the bottom and sides of the depressions. The successionof strata at the dam site (see Fig. 8.8) is as follows.
Middle Sandstone—soft and permeable near rock head but otherwise well cemented Middle Marl—calcareous mudstone Bottom Sandstone—hard pink sandstone Basal Beds—conglomerate with marl Lavas—impermeable except where jointed
The impermeable cover of boulder clay on the reservoir site, which might have affordedsome protection against leakage, had been mostly stripped away either for use as fill inthe dam, or as a result of erosion. The strata are folded into a shallow syncline, and thedam is founded on the northern flank of the syncline.
Leakage and subsidence were due to seepage through the sandstones, which had increased as solution cavities formed and quartz grains were washed away. The TopSandstone was most affected by cavities, and the Middle and Bottom Sandstones weresimilarly weakened where they were near the surface. The cavernous zone may haveextended to a depth of about 10 m below rock head. During the site investigation by trialpits and bores, there was loss of circulation of drilling water, some sudden drops indrilling rods and poor core recovery.
Carboniferous Calcareous shales and thin limestones
Old Red Sandstone Top Sandstone—a soft grey limy sandstone
Top Marl—calcareous mudstone
Principal geological factors affecting certain engineering projects 263
www.angoothachaap.blogspot.com
www.angoothachaap.blogspot.com
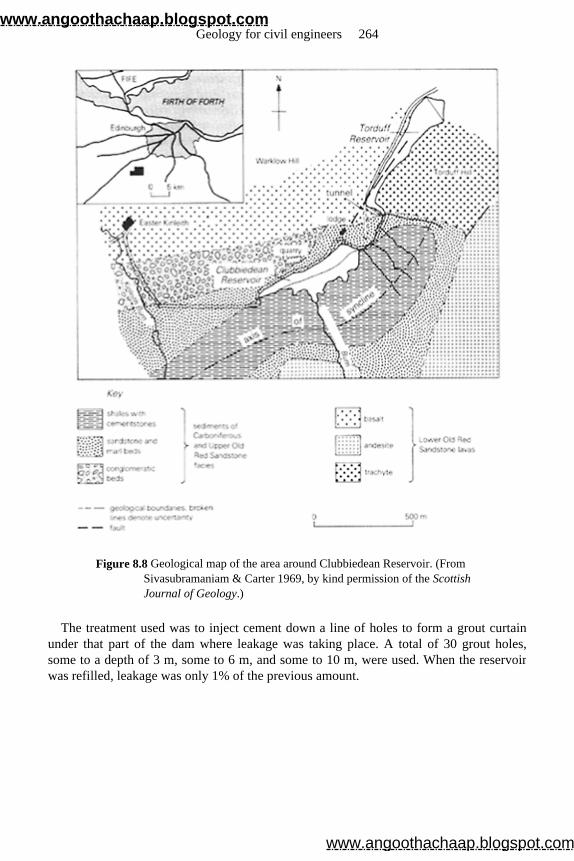
Figure 8.8 Geological map of the area around Clubbiedean Reservoir. (From Sivasubramaniam & Carter 1969, by kind permission of the Scottish Journal of Geology.)
The treatment used was to inject cement down a line of holes to form a grout curtain under that part of the dam where leakage was taking place. A total of 30 grout holes,some to a depth of 3 m, some to 6 m, and some to 10 m, were used. When the reservoirwas refilled, leakage was only 1% of the previous amount.
Geology for civil engineers 264
www.angoothachaap.blogspot.com
www.angoothachaap.blogspot.com
8.3 Geology of tunnels
8.3.1 Geological considerations in tunnelling
In few engineering projects are the feasibility, the planning, the costing, the design, thetechniques used and the risk of serious accidents during construction so dependent on thegeology of the site as in tunnelling. The area in which a tunnel is built is determined byits purpose, but the decision to tunnel, rather than, say, build a bridge, is influenced bythe relative geological difficulties, and the precise line of tunnel may be determined by achoice of favourable or difficult local geological conditions. The relative ease ofextraction of the rocks and the stability of the rock and face are prime factors in rates ofprogress and setting costs, and also in determining whether a rock-boring machine can be used, whether the ground needs support and whether it is necessary to use compressedair. For example, if a buried channel or deep scour on the sea floor, infilled with saturatedsand and gravel, were unexpectedly encountered, the resultant inrush of water at thetunnel face would result in a serious accident.
The geological factors considered in tunnelling projects are as follows:
(a) the ease of extraction of the rocks and soils; (b) the strength of the rocks and the need to support them; (c) the amount inadvertently excavated beyond the perimeter of the tunnel outline (that
is, overbreak), particularly where explosives are used; (d) the groundwater conditions and the need for drainage; and (e) the temperature in very deep tunnels and the need for ventilation.
The amount or degree of change in these conditions along the tunnel line can be as important in planning and costs as their average or maximum values. The change isrelated to structure, which controls not only what type of rock is present in a particularsegment of the tunnel but also how its layering and other anisotropic properties areorientated relative to the tunnel face, and how weakened it is by fracture. Ideal geologicalconditions for excavation of a tunnel are to encounter only one type of rock, devoid offault zones or intrusions, which is easily excavated but is stiff enough not to needimmediate support near the face, which is impermeable and which is not adverselyaffected on exposure to air. By a fortunate chance, large areas of London are underlain bya layer (the London Clay) which approaches this ideal, and the most extensive system oftunnels in Britain (the London Underground and the London sewerage tunnels) areexcavated partly in it. Uniform geological conditions allow a uniform, if moderate, rate ofprogress without the troublesome and time-consuming need for changes of techniques,imbalances in the effort required from different work sections, and elaborate andvulnerable arrangements.
Principal geological factors affecting certain engineering projects 265
www.angoothachaap.blogspot.com
www.angoothachaap.blogspot.com
8.3.2 Methods of excavation
The main problem in constructing a tunnel through non-cohesive soils or weak (‘soft’) rocks is to support the ground rather than to excavate it. Excavation is usually done by asoft-ground tunnelling machine fitted with a rotary cutting head. This may have a full-face rotary breasting system which remains in contact with the soil face as the cutter headmoves. Small slices of soil are fed through slots into the cutter head. The working face issupported by compressed fluid, which may be compressed air either in the tunnel or,where a complex machine is used, restricted to the face area by a pressure bulkhead. Theolder method of having compressed air in the tunnel itself carries the risk of disabilities toworkers, and requires time spent unproductively at the end of each shift ondecompression. In recent successful developments, a slurry of mud and water withthixotropic clay added is used at the face instead of air. The clay impedes settlementwithin the slurry, and tends to form a sealing cake on the face. As the machine advances,supports are installed behind it. The type used depends on the particular geologicalconditions.
The principal factor controlling rate of progress and costs in constructing a tunnel in strong (‘hard’) rocks is usually relative ease of excavation. The traditional method is toblast out successive sections of the tunnel by drilling a pattern of holes in the rock,charging them with explosives and firing. The need for any support and the type ofsupport used are dependent on the relative stability of the roof and walls of the tunnel.For example, widely spaced rock bolts and wire mesh might be used as a shield for smallloose fragments, and closely spaced ring beams might be employed where there was a danger of a rock fall. This approach is still used for the majority of modest projects ofunderground excavation, such as short, large-diameter rail or highway tunnels. Since theearly 1950s, however, the use of explosives has been increasingly replaced by rock-boring machines for certain types of major tunnelling projects. The machines are heavy and expensive and may be designed specially for one major tunnel. Machines equippedwith special cutters containing closely spaced tungsten carbide inserts seem to be capableof tackling rocks with compressive strengths in excess of 300 MN m– 2. The limiting factor in design is the strength of the cutter edge. The cutters usually wear out but, if theymeet a hard block of rock during boring, they may smash on impact. Their rate of wearand replacement is an important economic factor in tunnel costs.
8.3.3 Complications arising from local geological conditions
In soft-rock tunnels, heterogeneous rock or variable conditions at the face can produceserious problems and add to costs. A boulder clay or other soil containing large pebblescreates a near-impossible problem for existing slurry-face machines. Hard-rock rolling cutters can cope with hard boulders but have difficulty in other soft soils. A mixed face ofhard rock and wet non-cohesive soil presents an even worse headache to the engineer. The variation in strength of the soils along the tunnel line should ideally be anticipated sothat appropriate support can be used while the face is being excavated. Inability to do so
Geology for civil engineers 266
www.angoothachaap.blogspot.com
www.angoothachaap.blogspot.com
can result in overexcavation. Apart from the obvious variations of strength among soiltypes (for example, between non-cohesive sand and partly consolidated clay), variation related to saturation and porosity may produce significant differences. A small differencein water content can change an otherwise stable soil into running ground. Unstable soilscan be consolidated by injecting chemicals or cement into them, or by freezing them.
In hard-rock tunnels, the relative difficulty of excavating particular rocks dependspartly on whether explosives or a rock-boring machine is used. Nevertheless, bothmethods share some important factors. The rate of excavation in both cases is inverselyrelated to the crushing strength of the rocks, and directly related to the amount offracturing. When explosives are used, the relationship to strength is complicated by theway in which some weak non-brittle rocks, such as mica-schist, react to blast, and do not pull well for a given charge; and by the much greater role that fracturing plays. Fractures serve both as paths for expanding gases from the explosion, and as planes of weaknessalong which the rock will part. In tunnelling, the ease of drilling shot holes is dependenton the hardness and abrasiveness of the rock face (Section 7.3.1), and also on the variation of hardness within it, since, at a sharp boundary between hard and soft, the drill tends to be deflected. The hard mineral most likely to give any trouble is one of thevarieties of silica, such as quartz, flint or chert, occurring as veins or nodular concretions.Shales containing ironstone nodules can also be an awkward mixture. Relatively hardminerals and strong rocks are often produced by thermal metamorphism. A weak, soft,calcareous schist may be altered to a strong, hard calc-hornfels. This has proved to be a significant geological factor in certain hydroelectric projects where the reservoir is sitedon the high ground corresponding to the outcrop of a large granite intrusion. Tunnellingwithin the thermal aureole tends to become increasingly difficult as the granite isapproached.
Excessive ease of extraction because of overhelpful planes of weakness can lead to overbreak (Fig. 8.9) and to potential rockfalls from the roof. A certain amount of excess excavation between the ideal outer surface of the lining and a pay line is usually coveredby contract, but allowance for treating any overbreak beyond that is likely to be borne bythe contractor and should be allowed for in his tender. Overbreak depends on theintensity of jointing and the presence of other planes of weakness, such as bedding andschistosity, and also on the orientation of the dominant planes relative to the tunnel face.In general, massive uniform rock, properly blasted, will give a clean section; wellbedded, fractured rock will give overbreak. This is greatest in steeply dipping layerswhere the tunnel is parallel to their strike. For example, the overbreak in micaschists wasobserved to vary in one tunnel from values of 16% across the foliation to 40% along it.
Predicting instability of the roof and the need to support and backfill parts of a tunnel are problems common to excavation both by explosives and by a rock-boring machine—as are seepage, water-filled soils in channels or fissures, swelling and popping rock, and high temperatures.
Principal geological factors affecting certain engineering projects 267
www.angoothachaap.blogspot.com
www.angoothachaap.blogspot.com
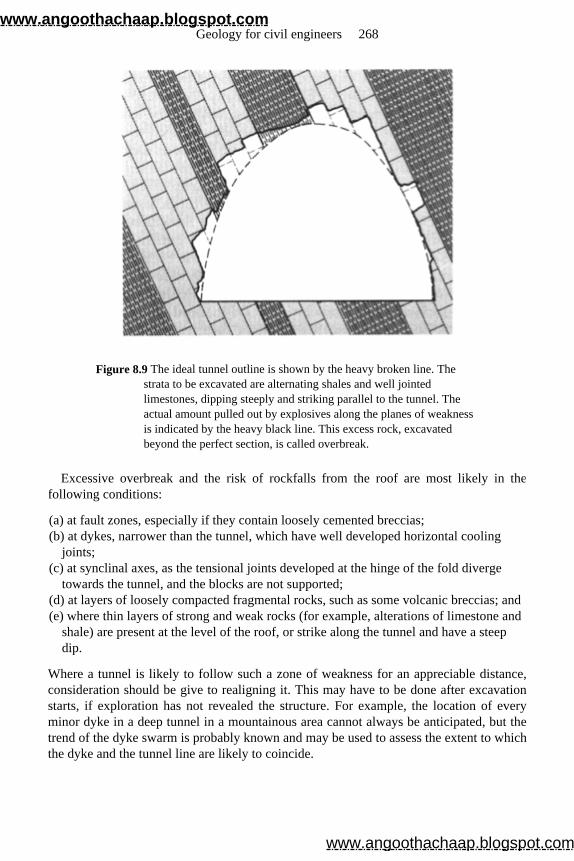
Figure 8.9 The ideal tunnel outline is shown by the heavy broken line. The strata to be excavated are alternating shales and well jointed limestones, dipping steeply and striking parallel to the tunnel. The actual amount pulled out by explosives along the planes of weakness is indicated by the heavy black line. This excess rock, excavated beyond the perfect section, is called overbreak.
Excessive overbreak and the risk of rockfalls from the roof are most likely in the following conditions:
(a) at fault zones, especially if they contain loosely cemented breccias; (b) at dykes, narrower than the tunnel, which have well developed horizontal cooling
joints; (c) at synclinal axes, as the tensional joints developed at the hinge of the fold diverge
towards the tunnel, and the blocks are not supported; (d) at layers of loosely compacted fragmental rocks, such as some volcanic breccias; and (e) where thin layers of strong and weak rocks (for example, alterations of limestone and
shale) are present at the level of the roof, or strike along the tunnel and have a steep dip.
Where a tunnel is likely to follow such a zone of weakness for an appreciable distance,consideration should be give to realigning it. This may have to be done after excavationstarts, if exploration has not revealed the structure. For example, the location of everyminor dyke in a deep tunnel in a mountainous area cannot always be anticipated, but thetrend of the dyke swarm is probably known and may be used to assess the extent to whichthe dyke and the tunnel line are likely to coincide.
Geology for civil engineers 268
www.angoothachaap.blogspot.com
www.angoothachaap.blogspot.com
The amount of seepage into a tunnel through pervious rocks and joints may be a significant factor in design. It must be assessed from a knowledge of groundwaterconditions, bulk permeabilities of rocks and the geological structure. For example,crystalline rocks, such as granite, gneisses and schists, are typically dry except for flowalong joints and faults, and perhaps at the margins of any dykes which cut them. Inpervious rocks, the flow of ground water into the tunnel is likely to increase at fault zonesand at synclinal axes (which tend to channel flow towards the tunnel). Water-filled fissures, especially in limestones, present a more serious hazard, which must be insuredagainst in certain projects by probing ahead of the working face with small horizontalboreholes. The consequences of driving the tunnel into the wet soils of a buried channelcut into the solid rock are so serious that exploration must be thorough enough todelineate rock head everywhere along most tunnel lines, particularly under the sea, underestuaries and under rivers. Depressions in the rock-head surface may be preglacial channels or trenches scoured by strong tidal currents, or large fissures leached inlimestone, which have subsequently been infilled with Pleistocene or recent sediments. Inareas which have not been glacially eroded, the bedrock near the surface may be alteredby periglacial or other weathering, and consequently have a permeability and strengthintermediate between its values when fresh and those of any residual soils formed from it.
The temperatures in a tunnel prior to ventilation are related mainly to distance from the surface, the thermal conductivity of the rocks and the amount of water circulating throughthem. It is a significant factor only in very deep tunnels. Any sudden drop in temperatureat the tunnel face is usually an indication that heat is being drawn from the rocks bycirculation of water close to the face, and it may serve as a warning of a water-filled fissure and the threat of a sudden inrush. Inflow of warm water occurred in tunnelsthrough the Alps.
At depths below about 150 m, the pressure of overburden is augmented locally byappreciable secondary stresses in some parts of the excavation. The resultant strain in therocks around the tunnel may take the form of swelling into the tunnel in shales, or some movement along bedding or other planes of weakness in brittle rocks. It may, however,produce explosive scaling from the surface of massive brittle rocks which cannot makesuch adjustments. This is called a rock-burst or popping rock and it can be hazardous. It is probably the cause of many of the minor tremors generated as mining subsidence takesplace.
The prediction of ground conditions and how they vary along the line of a tunnel follows the general lines of site exploration described in Chapter 6, with appropriate emphases. Zones of weakness and permeability—particularly fault zones, buried channels, lenses of waterlogged running sand, and dykes—must be delineated with especial care. The rocks in many major tunnelling projects are covered by water, andcontinuous seismic-reflection profiling can be used to advantage. There is always need for a line of borings near the proposed tunnel, to prove the geology and provide samplesfor physical measurements. As a final check, test drilling may be done ahead of theworking face by driving small holes outwards from the face parallel to the tunnel axis toconfirm the prognosis and to ensure that no hazards are encountered unexpectedly. Thesepoints are illustrated in the case history described in the next section.
Principal geological factors affecting certain engineering projects 269
www.angoothachaap.blogspot.com
www.angoothachaap.blogspot.com
Any need to change the method of excavation or support because of an unforeseenchange of geological conditions can be a difficult and costly decision for a contractor.The accurate prediction of all such changes before excavation starts is more than can beprovided by present exploratory methods. Some geological complications and hazardsonly become known as tunnelling proceeds. For these reasons, it is very important thatthe fullest possible appraisal of the geology is made, and that exploration is not thought to be finished once excavation has started.
8.3.4 Case history: the proposed Channel Tunnel
The project to build a tunnel under the English Channel and link England to France byrail was shelved as one of the cuts made in British public expenditure in the mid-1970s. This was done, however, at a stage when the geology of the site had been investigatedand assessed by members of the Channel Tunnel Study Group as part of a comprehensivestudy and estimate of costs (well over £1000 m at present). The project seemedreasonably sound in terms of technical feasibility, and the prospects were encouragingand realistic enough to attract some private capital. The following account is drawnmainly from Destombes and Shephard-Thorn (1971), and from an account by Hanlon (1973). The geological investigations and tests were carried out in 1964–65.
Where the Channel narrows, Cretaceous Chalk crops out on both coasts, and its lowdips suggested that it might be continuous at the level of the tunnel from one end to theother. The geology below the Channel for some distance on both sides of the shortestroute was reconnoitred using shallow seismic-reflection profiling (sparker). A pattern of lines, trending NE-SW at 0.5 km intervals, were linked by 12 tie lines to give severalhundreds of kilometres of continuous profile. As a control on the interpretation of theselines, and to provide samples for testing, 73 boreholes were made in the sea floor and, inall, 6 km of cores were recovered. Microfossils from them were used to recognise finerdivisions within the Chalk, and so assist in delineating the detailed structure of thelayering. Laboratory tests of permeability, water content, density and compressivestrength were made, plus some others related to the problems of this particular tunnel; forexample, ultrasonic velocity determinations for detailed sparker interpretation, variationin clay and calcite content, static strain modulus and slaking tests.
The investigations showed that the Chalk is folded gently into one major anticline and several lesser folds, all trending east—west. The maximum dips, up to 15°, are found on the French side. One fault with a throw of only 12 m was mapped, and the few othersdetected were even smaller. Tests in boreholes adjacent to some of them showed nosignificant increase of bulk permeability, and it is inferred that they are sealed by latermineralisation or by clay. They do not represent a serious hazard. The sea floor is sweptby tidal currents and superficial deposits are generally thin. Sand, migrating slowly ingiant sand waves, is present near the French coast. There are also several deep hollowscut into the bedrock, which are filled with Pleistocene silt and sandy clay. The largest inmid-Channel extends to 140 m below sea level. Fortunately, the Chalk below them is unaffected by periglacial weathering and there is more than 25 m of sound rock above thetunnel along its entire route. This is considered to be an adequate safety margin. The lack
Geology for civil engineers 270
www.angoothachaap.blogspot.com
www.angoothachaap.blogspot.com
of weathering of the Chalk in the hollows indicates that the infill of drift was alreadypresent as a protective cover before the last glaciation (an alternative explanation, whichis possible but less likely, is that some of the hollows are scours cut by strong tidalcurrents, which have been filled with recent sediment).
The lowered sea levels of Pleistocene times left the present sea bed of the Channel exposed to periglacial weathering, which has increased the permeability and lowered thestrength of the Chalk by breakage and fissuring. The seismic velocity in the weatheredChalk is up to 30% less than in fresh rock. (This effect must be allowed for ininterpretation of the sparker profiles.) The white Upper Chalk is the only layer seriouslyaffected. The penetration of the weathering, particularly along joints, is controlled partlyby the minor folds. The badly weathered zones can admit large amounts of water to lowerlevels to produce serious and unexpected water problems, but the tunnel line is sitedsafely below all known hazards of this type.
The permeability of chalk is inversely related to its clay content. A Channel Tunnel cut in chalk consisting of more than 80% calcite would probably suffer serious seepage, andthis limit was a vital criterion in selecting which layer of the Chalk the tunnel shouldfollow. The Chalk Marl, a layer up to 30 m thick within the Lower Chalk, has a suitablepermeability combined with adequate strength to support the forward area until lining canbe installed. It consists of a series of units, each 0.3–0.7 m thick, with clay-rich rock at the base grading upwards into purer, harder chalk. The ribs of chalk give strength and theclay acts as a sealant. The permeability of the matrix of the Chalk Marl is nearly zeroacross the bedding, and the effective bulk permeability in situ is entirely due to fissures. Assessments of strength are borne out by the fact that older trial tunnels excavated in the1880s are still standing although they are unlined. The ease of excavation of the ChalkMarl by rotary cutting machines is shown by results of 30 m per day during trials.
It is possible to route the tunnel through Chalk Marl for most of its length, and the main geological complications are at the coasts. The low dips on the English side giveconsiderable freedom of choice horizontally in siting terminal facilities, but the steep dipsand narrower outcrops on the French side are more restrictive, unless a geological penaltyis accepted. For example, the tunnel should preferably avoid the water-bearing sandstones that occur below the Chalk.
Despite the careful preliminary investigation and its favourable results, there is still apossibility that some water-filled fissures (joints or bedding-planes) have not been delineated by the survey, and indeed cannot be recognised by present techniques withcertainty. They present a potential hazard which must be insured against by stipulatingthat small-diameter holes should be bored ahead of the tunnel face to probe the rocks ahead. These holes would be fitted with valves so that they could be sealed and, ifnecessary, grout could be pumped into any pervious zone they penetrated, so as to seal it.The cost of this procedure would be determined largely by time delays when drilling ofthe main tunnels was halted.
The proposed design includes two main traffic tunnels and a central service tunnel. The main tunnels were costed on the basis of a diameter of 6.85 m, which wouldaccommodate lorries at least 4 m high loaded on rail transporters. The service tunnelwould be advanced first, and borings could be made sideways from it to probe conditions
Principal geological factors affecting certain engineering projects 271
www.angoothachaap.blogspot.com
www.angoothachaap.blogspot.com
along the sites of the two main tunnels. The net progress, including lining, was projectedto 0.5 km per month for the service tunnel, and 0.75 km per month for the main tunnels.These estimates are based on an aimed excavation rate of 6 m per hour by the rotaryboring machines.
The Study Group also reported on the geological factors relevant to an alternative ‘immersed tube’ scheme, in which an open trench would be excavated in the Channel floor, and special caissons, which would serve as segments of the tunnel, would be sunkinto it. The topography of the sea bed is the most important factor in the choice of routeand the feasibility of this scheme. The principal geological consideration is ease ofexcavation of the trench. It was concluded that no particular difficulties would be likelywhere Chalk cropped out, but that the silt in the buried channels would be liable tocollapse into the trench during construction. Mobile sand waves would also be a problemlocally. Otherwise there appeared to be no serious problem of silting up of the trench bythe movement of recent sediments.
References and selected reading
Anderson, J.G.C. 1970. Geological factors in the design and construction of the Ffestiniog pumped storage scheme, Merioneth, Wales. Q. J. Engng Geol . 2 , 183–94.
Attewell, P.B. and I.W.Farmer 1976. Principles of engineering geology . London: Chapman and Hall.
Bishop, A.W. 1973. The stability of tips and spoil heaps. Q. J. Engng Geol . 6 , 335–76. Carter, P. and D.Mills 1976. Engineering geological investigations for the Kielder
tunnels. Q.J. Engng Geol . 9 , 125–42. Destombes, J.P. and E.R.Shephard-Thorn. 1971. Geological results of the Channel tunnel
site investigation 1964–65 . Rep. Inst. Geol. Sci. 71/11. Fookes, P.G. and M.Sweeney 1976. Stabilization and control of local rock falls and
degrading rock slopes. Q. J. Engng Geol . 9 , 37–56. Geological Society Engineering Group Working Party 1977. The description of rock
masses for engineering purposes. Q. J. Engng Geol . 10 , 335–88. Hanlon, J. 1973. Bore of the century? The Channel tunnel. New Scientist 60 , 92–110. Hoek, E. 1970. Estimating the stability of excavated slopes in opencast mines. Trans.
Inst. Min. Metall . 109–32. Hoek, E. 1973. Method for the rapid assessment of the stability of three-dimensional rock
slopes. Q. J. Engng Geol . 6 , 243–56. Hoek, E. and J.W.Bray 1974. Rock slope engineering . London: Inst. Min. Metall. Hutchinson, J.N. and D.Brunsden 1974. Mudflows: a review and classification. Q. J.
Engng Geol . 7 , 327–8. Little, A.L. 1977. Investigating old dams. Q. J. Engng Geol 10 , 271–80. Londe, P. 1973. Analysis of the stability of rock slopes. Q. J. Engng Geol . 6 , 93–124. McGregor, K. 1968. Drilling of rocks . London: McLaren. Robbins, R.J. 1976. Mechanised tunnelling—progress and expectations. Trans Inst. Min.
Metall . 85A , 41–50. Sivasubramaniam, A. and A.V.F.Carter 1969. The investigation and treatment of leakage
through Carboniferous rocks at Clubbiedean Dam, Midlothian. Scott. J. Geol . 5 , 207–
Geology for civil engineers 272
www.angoothachaap.blogspot.com
www.angoothachaap.blogspot.com

23. Stevenson, P.C. and W.R.Moore 1976. A logical loop for the geological investigation of
dam sites. Q. J. Engng Geol . 9 , 65–72. Wahlstrom, E.E. 1973. Tunnelling in rock . Amsterdam: Elsevier. Walhstrom, E.E. 1974. Dams, dam foundations, and reservoir sites . Amsterdam:
Elsevier. Walters, R.C.S. 1962. Damgeology . London: Butterworths. Watkins, M.D. 1970. Terminology for describing the spacing of discontinuities of rock
masses. Q. J. Engng Geol . 3 , 193–5. Weeks, A.G. 1969. The stability of natural slopes in south-east England as affected by
periglacial activity. Q. J. Engng Geol . 2 , 49–62. Wood, A.M.M. 1972. Tunnels for roads and motorways. Q. J. Engng Geol . 5 , 111–26. Zaruba, Q. and V.Mencl 1969. Landslides and their control . Amsterdam: Elsevier. Zaruba, Q. and V.Mencl 1976. Engineering geology . Prague: Academia.
Principal geological factors affecting certain engineering projects 273
www.angoothachaap.blogspot.com
www.angoothachaap.blogspot.com
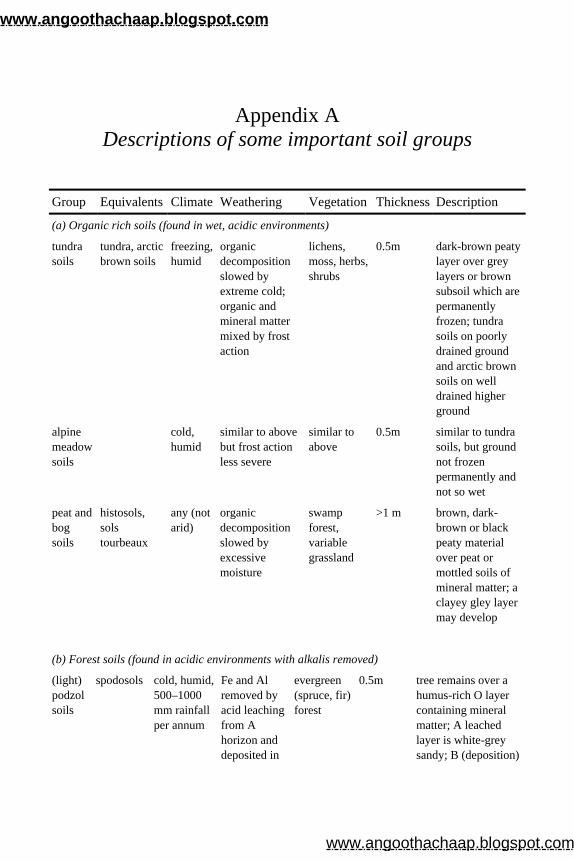
Appendix A Descriptions of some important soil groups
Group Equivalents Climate Weathering Vegetation Thickness Description
(a) Organic rich soils (found in wet, acidic environments)
tundra soils
tundra, arctic brown soils
freezing, humid
organic decomposition slowed by extreme cold; organic and mineral matter mixed by frost action
lichens, moss, herbs, shrubs
0.5m dark-brown peaty layer over grey layers or brown subsoil which are permanently frozen; tundra soils on poorly drained ground and arctic brown soils on well drained higher ground
alpine meadow soils
cold, humid
similar to above but frost action less severe
similar to above
0.5m similar to tundra soils, but ground not frozen permanently and not so wet
peat and bog soils
histosols, sols tourbeaux
any (not arid)
organic decomposition slowed by excessive moisture
swamp forest, variable grassland
>1 m brown, dark-brown or black peaty material over peat or mottled soils of mineral matter; a clayey gley layer may develop
(b) Forest soils (found in acidic environments with alkalis removed)
(light) podzol soils
spodosols cold, humid, 500–1000 mm rainfall per annum
Fe and Al removed by acid leaching from A horizon and deposited in
evergreen (spruce, fir) forest
0.5m tree remains over a humus-rich O layer containing mineral matter; A leached layer is white-grey sandy; B (deposition)
www.angoothachaap.blogspot.com
www.angoothachaap.blogspot.com
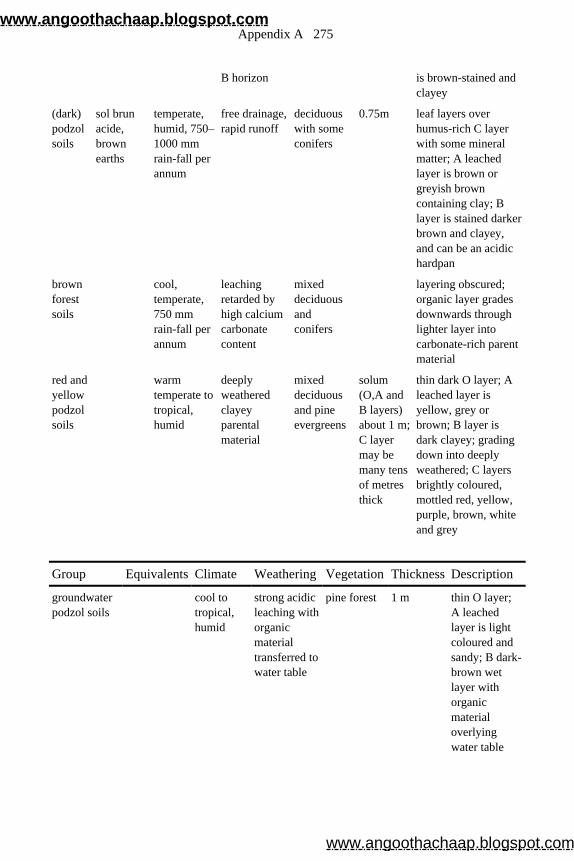
B horizon is brown-stained and clayey
(dark) podzol soils
sol brun acide, brown earths
temperate, humid, 750–1000 mm rain-fall per annum
free drainage, rapid runoff
deciduous with some conifers
0.75m leaf layers over humus-rich C layer with some mineral matter; A leached layer is brown or greyish brown containing clay; B layer is stained darker brown and clayey, and can be an acidic hardpan
brown forest soils
cool, temperate, 750 mm rain-fall per annum
leaching retarded by high calcium carbonate content
mixed deciduous and conifers
layering obscured; organic layer grades downwards through lighter layer into carbonate-rich parent material
red and yellow podzol soils
warm temperate to tropical, humid
deeply weathered clayey parental material
mixed deciduous and pine evergreens
solum (O,A and B layers) about 1 m; C layer may be many tens of metres thick
thin dark O layer; A leached layer is yellow, grey or brown; B layer is dark clayey; grading down into deeply weathered; C layers brightly coloured, mottled red, yellow, purple, brown, white and grey
Group Equivalents Climate Weathering Vegetation Thickness Description
groundwater podzol soils
cool to tropical, humid
strong acidic leaching with organic material transferred to water table
pine forest 1 m thin O layer; A leached layer is light coloured and sandy; B dark-brown wet layer with organic material overlying water table
Appendix A 275
www.angoothachaap.blogspot.com
www.angoothachaap.blogspot.com
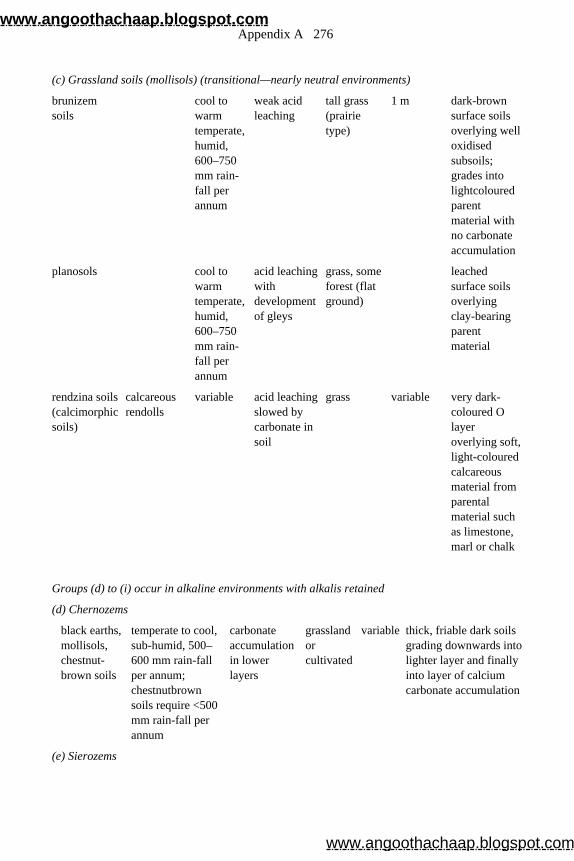
(c) Grassland soils (mollisols) (transitional—nearly neutral environments)
brunizem soils
cool to warm temperate, humid, 600–750 mm rain-fall per annum
weak acid leaching
tall grass (prairie type)
1 m dark-brown surface soils overlying well oxidised subsoils; grades into lightcoloured parent material with no carbonate accumulation
planosols cool to warm temperate, humid, 600–750 mm rain-fall per annum
acid leaching with development of gleys
grass, some forest (flat ground)
leached surface soils overlying clay-bearing parent material
rendzina soils (calcimorphic soils)
calcareous rendolls
variable acid leaching slowed by carbonate in soil
grass variable very dark-coloured O layer overlying soft, light-coloured calcareous material from parental material such as limestone, marl or chalk
Groups (d) to (i) occur in alkaline environments with alkalis retained
(d) Chernozems
black earths, mollisols, chestnut-brown soils
temperate to cool, sub-humid, 500–600 mm rain-fall per annum; chestnutbrown soils require <500 mm rain-fall per annum
carbonate accumulation in lower layers
grassland or cultivated
variable thick, friable dark soils grading downwards into lighter layer and finally into layer of calcium carbonate accumulation
(e) Sierozems
Appendix A 276
www.angoothachaap.blogspot.com
www.angoothachaap.blogspot.com
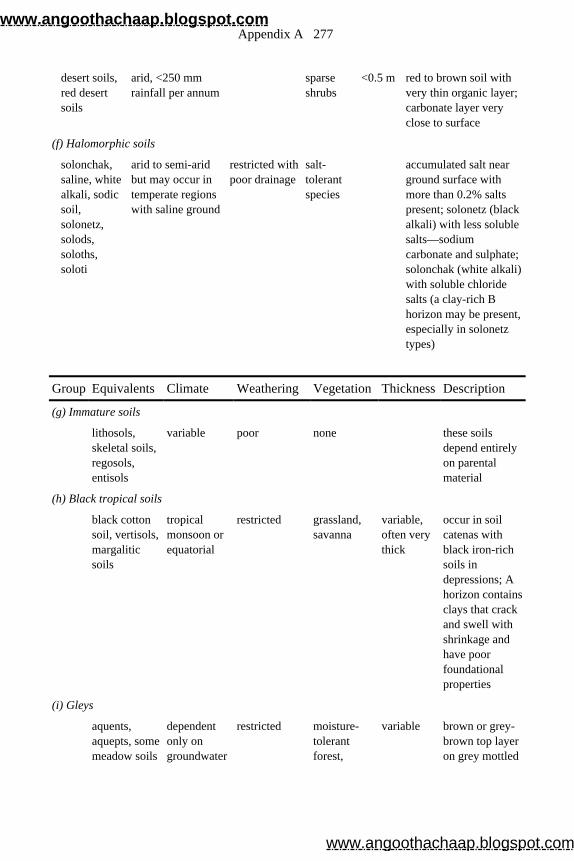
desert soils, red desert soils
arid, <250 mm rainfall per annum
sparse shrubs
<0.5 m red to brown soil with very thin organic layer; carbonate layer very close to surface
(f) Halomorphic soils
solonchak, saline, white alkali, sodic soil, solonetz, solods, soloths, soloti
arid to semi-arid but may occur in temperate regions with saline ground
restricted with poor drainage
salt-tolerant species
accumulated salt near ground surface with more than 0.2% salts present; solonetz (black alkali) with less soluble salts—sodium carbonate and sulphate; solonchak (white alkali) with soluble chloride salts (a clay-rich B horizon may be present, especially in solonetz types)
Group Equivalents Climate Weathering Vegetation Thickness Description
(g) Immature soils
lithosols, skeletal soils, regosols, entisols
variable poor none these soils depend entirely on parental material
(h) Black tropical soils
black cotton soil, vertisols, margalitic soils
tropical monsoon or equatorial
restricted grassland, savanna
variable, often very thick
occur in soil catenas with black iron-rich soils in depressions; A horizon contains clays that crack and swell with shrinkage and have poor foundational properties
(i) Gleys
aquents, aquepts, some meadow soils
dependent only on groundwater
restricted moisture-tolerant forest,
variable brown or grey-brown top layer on grey mottled
Appendix A 277
www.angoothachaap.blogspot.com
www.angoothachaap.blogspot.com

conditions grassland, semi-marsh
gley horizon; parent material often impermeable clay-rich rocks
(j) Laterites
krasnozems, ferralites, ferruginous soils, latosols, oxisols, ultisols
equatorial to sub-tropical, high rainfall
free drainage, intense surface leaching with permanent waterlogging at depth
forest, thorn, savanna soils are very poor
very thick red layers with high clay content; matrix often aggregated into concretions (murram) by high alumina and iron content
Appendix A 278
www.angoothachaap.blogspot.com
www.angoothachaap.blogspot.com
Appendix B Hydraulic properties and pumping tests of an
aquifer
The important hydraulic properties of a soil or rock are:
(a) the amount of water it can hold in its voids; (b) the amount that can be drained from it; and (c) the ease with which the water can flow through it.
These may be expressed as its porosity, specific yield and coefficient of permeability.These parameters are defined elsewhere (Section 5.1.1). In hydro-geological work, including water supply, it has been conventional, however, to describe the hydraulicproperties of an aquifer by other, equivalent parameters. For example, permeability isexpressed in practical terms as discharge per unit of time, rather than as velocity of flow.This hydraulic conductivity is usually designated K rather than k. It is expressed as the discharge (m3 day– 1) through a cross-sectional area of 1 m2 under a hydraulic gradient of 1 in 1.
The ability to permit flow through voids may also be expressed by the aquifer’s transmissibility, which is the rate of flow of ground water (m3 day– 1 m– 1) through a vertical strip of aquifer 1 m wide extending the full length of the saturated aquifer under ahydraulic gradient of 1 in 1.
The storage capacity of the aquifer is defined by its coefficient of storage (S). It is the ratio of the volume of water derived from storage in a vertical column extending throughthe full thickness of the aquifer to the corresponding volume of the aquifer, expressed asa decimal. The water is assumed to be yielded during a reduction in head equivalent to afall in water level of 1 m, and the column rests on a base of 1 m2.
While a well is discharging, water is being drawn from the rocks around it to produce acone of depression (exhaustion) in the water table, or a cone of pressure relief in confined water, with a matching cone-shaped depression in the piezometric surface.Hydraulic gradients are produced radially inwards around the well and induce flow intoit. The dimensions of the cone of depression (Fig. B. 1) formed by a well being pumped from a depth H below the original water table, in an aquifer of permeability k, are related to the quantity Q yielded under steady-state flow conditions by the equation
www.angoothachaap.blogspot.com
www.angoothachaap.blogspot.com
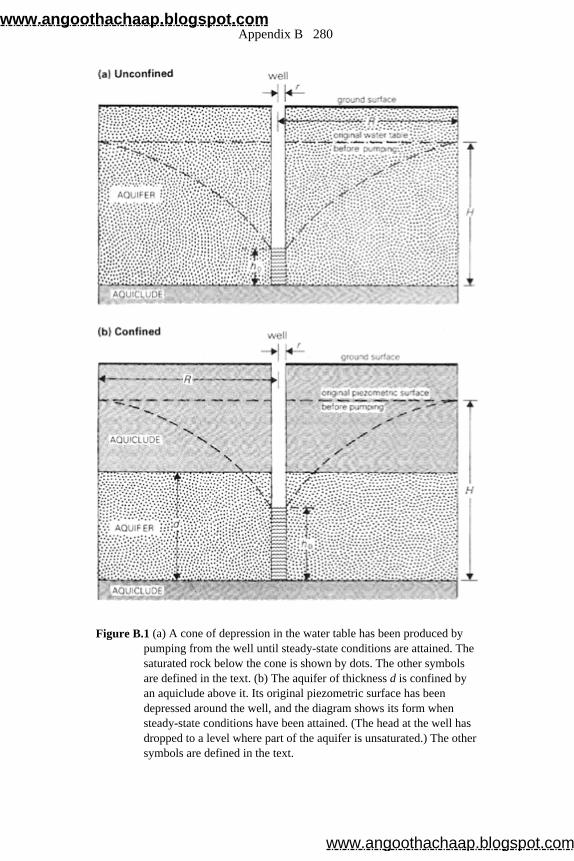
Figure B.1 (a) A cone of depression in the water table has been produced by pumping from the well until steady-state conditions are attained. The saturated rock below the cone is shown by dots. The other symbols are defined in the text. (b) The aquifer of thickness d is confined by an aquiclude above it. Its original piezometric surface has been depressed around the well, and the diagram shows its form when steady-state conditions have been attained. (The head at the well has dropped to a level where part of the aquifer is unsaturated.) The other symbols are defined in the text.
Appendix B 280
www.angoothachaap.blogspot.com
www.angoothachaap.blogspot.com
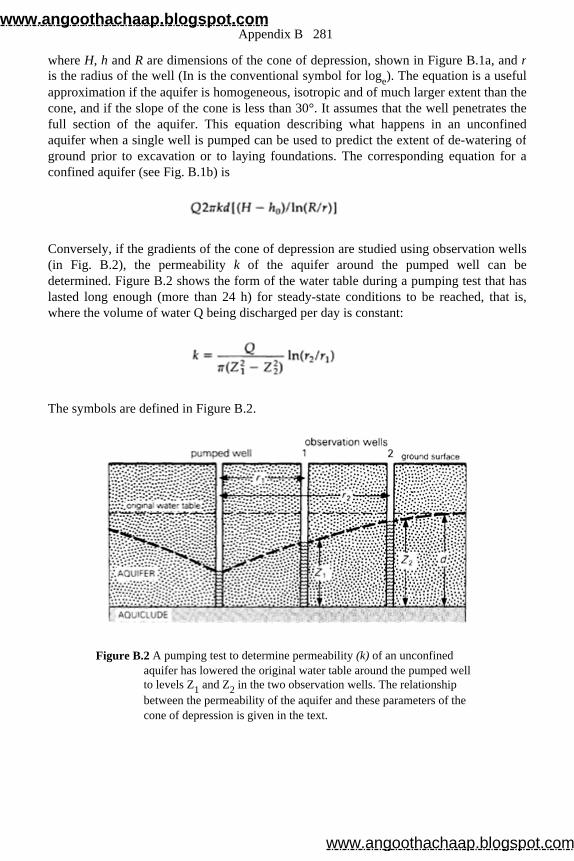
where H, h and R are dimensions of the cone of depression, shown in Figure B.1a, and ris the radius of the well (In is the conventional symbol for loge). The equation is a useful approximation if the aquifer is homogeneous, isotropic and of much larger extent than thecone, and if the slope of the cone is less than 30°. It assumes that the well penetrates the full section of the aquifer. This equation describing what happens in an unconfinedaquifer when a single well is pumped can be used to predict the extent of de-watering of ground prior to excavation or to laying foundations. The corresponding equation for a confined aquifer (see Fig. B.1b) is
Conversely, if the gradients of the cone of depression are studied using observation wells(in Fig. B.2), the permeability k of the aquifer around the pumped well can be determined. Figure B.2 shows the form of the water table during a pumping test that haslasted long enough (more than 24 h) for steady-state conditions to be reached, that is, where the volume of water Q being discharged per day is constant:
The symbols are defined in Figure B.2.
Figure B.2 A pumping test to determine permeability (k) of an unconfined aquifer has lowered the original water table around the pumped well to levels Z1 and Z2 in the two observation wells. The relationship between the permeability of the aquifer and these parameters of the cone of depression is given in the text.
Appendix B 281
www.angoothachaap.blogspot.com
www.angoothachaap.blogspot.com
Appendix C The British Geological Survey and other
governmental Geological Surveys
A general account of the British Geological Survey, and the Divisions and Units within itare comprehensively listed in the Annual Reports of the BGS. Up to 1983 the British Geological Survey (BGS) was known as the Institute of Geological Sciences (IGS). Fieldinvestigations for each region of the UK (for example, Scotland North Lowlands District)are carried out by a team of geologists under the supervision of a District Geologist. Inaddition, special investigations are the responsibility of a number of specialist units.
The national headquarters are at:
British Geological Survey, Nicker Hill, Keyworth, Nottingham NG12 5GQ
Field staff at this office cover southern and central England. Local offices at Exeter,Newcastle and Aberystwyth deal with south-west England, northern England and Wales.
There is a major regional office at:
Murchison House, West Mains Road, Edinburgh EH9 3LA
Field staff here cover Scotland, Northern Ireland (which also has a local office in Belfast)and the northern part of the UK Continental Shelf.
Information about subsidiary offices (for example, in Belfast and Exeter) may be obtained from these two centres. Local data, including unpublished 1/10560 field maps,are deposited in local offices. Some specialist Units have their offices at Keyworth(including the Engineering Geology Unit).
The objects of the BGS include the following:
(a) Preparation and keeping under revision the geological map of Britain and of its surrounding seas. The standard scale of survey on land is 1:10560 or 1:10000. Maps are published and sold of those areas where mining, special academic interest or other activity produces a demand. The price (in 1984) of a 5×5 km2 map on a scale of 1:10560 was £8.45 from HMSO or its agents. A complete set of maps, including those not available from HMSO, may be consulted at the appropriate BGS office by
www.angoothachaap.blogspot.com
www.angoothachaap.blogspot.com
arrangement. Photocopies of unpublished or out-of-print 6 in sheets may be obtained for £8.05 (in 1984) for National Grid sheets and £5.75 (in 1984) for County sheets (that is, the older 2×3 mile2 sheets indexed by county boundaries). A range of geological maps, some on smaller scales, others giving detail of certain information such as the nature of superficial deposits is also published.
(b) Investigation by the methods of structural interpretation, geophysics and boring of the subsurface geology of the UK and the British continental shelf. The activities of the specialist Units include geophysical surveys on land and sea and the commissioning of deep borings at localities of special interest.
(c) Conservation, correlation and interpretation of geological information made available under statutory and other arrangements, derived from mining, quarrying, other excavations, boring and prospecting work in Britain and its continental shelf. By law, the logs of all mineral borings penetrating more than 100 ft (30 m) and water borings more than 50 ft (15 m) below surface in the UK must be deposited with the BGS, where they are held for five years on a confidential basis if so requested. This information, excluding that which is confidential, is available to enquirers on an ad hoc basis by arrangement. Because of the inclusion of material with different degrees of confidentiality, it is not normally possible for complete files of bore records to be placed at the enquirer’s disposal. A separate statute covers data from surveys carried out by the petroleum industry in British waters. Geophysical and other data are deposited with the two Continental Shelf units and the Marine Geophysics unit, and are not immediately available; but under the Petroleum and Submarine Pipeline Act (1975), the Department of Energy is empowered to release certain categories of data, including well logs, six years after the granting of an Exploration Licence. Enquiries should be made to the Petroleum Directorate, Department of Energy, Thames House South, Millbank, London SW1, or to the Continental Shelf Division, British Geological Survey, Keyworth.
(d) Application of the results to practical objectives. The BGS provides information and advice to private commercial parties by publication and on a personal basis. The type and quality of geotechnical information that might be made available from file, for certain urban areas, is indicated by the Special Engineering Geology Sheet, Geology of Belfast and District, 1971, on a scale of 1:21120 (3 in to 1 mile). A similar map of Newcastle was published in 1976, and more recent ones include the Firth of Forth. The Belfast map contains a contoured map of rock head, contoured thicknesses of the estuarine clays (the most troublesome ‘soil’ in the area for an engineer), and a table of the geotechnical properties of the rocks. An account of the aims in making the map, and of its use for preliminary investigations only, may be found in Wilson (1972).
Advice given and work done may be on a payment basis if there is a significant use ofstaff’s time or facilities. Charges may be made if work exceeds half a day of staff time,but this would be quoted and agreed in advance.
The BGS is, however, unable to undertake a consultant role which might result in legalcontroversy, that is, where it represented a private client in opposition to, or incompetition with, another. Its units undertake investigations and other consultative workfor Government departments, National Boards and local authorities, in some cases
Appendix C 283
www.angoothachaap.blogspot.com
www.angoothachaap.blogspot.com
automatically under statute, in others by special contract. The Ministry of Transportrefers all road projects within Britain costing over £1m to the BGS for geological appraisal.
Activities of the BGS related to engineering projects have included:
(a) studies of a prospective site for a third London airport, and of a reservoir storage scheme in the Wash, for the Department of the Environment;
(b) interpretation of marine boreholes for the Channel Tunnel project; (c) preparation of maps of drift lithology and thicknesses at Irvine New Town; (d) study of a zone of instability in the Severn Gorge for the Telford Development
Corporation; (e) work on the stability of pit tips in Kent for the NCB; and (f) assessment of potential sites for toxic and nuclear waste disposal.
A fuller picture of the practical contribution of BGS is given in Robbie (1972). The organisation and statutory responsibilities of government Geological Surveys in
other countries are broadly similar to those of the BGS. Obvious major differences existfor historical, geographical and political reasons. For example, in some of the English-speaking countries with federal systems of government, including the United States,Canada and Australia, Geological Surveys funded by, and accountable to, individualStates exist side by side with a Federal Geological Survey. The relationship and divisionof function between State and Federal Surveys vary from country to country. In general,the State Surveys tend to devote their resources to more practical tasks related toeconomic and other interests of the State. A Federal Survey’s responsibilities characteristically include the systematic surveying of the entire country and thepublication of a uniform series of geological maps with a standard stratigraphicnomenclature. Since the three countries instanced have areas several times the size ofBritain, the basic scale of mapping is smaller to permit completion of the reconnaissancesurvey in a reasonable time. Detailed surveys are also undertaken for special, usuallyeconomic, reasons. Government Geological Surveys in Canada and Australia havetraditionally had a stronger economic bias, particularly as a service to their mininginterests, than the BGS, but this difference has narrowed in the last decade.
An account of government Geological Surveys in Australia is given by Johns (1976).There are Geological Surveys of Victoria, New South Wales, Queensland, Tasmania,South Australia, Western Australia and the Northern Territory. Nearly all of them pre-date the foundation of the Federal Survey in 1911. This is one of the five branches of theBureau of Geology, Geophysics and Mineral Resources. Its activities include systematicmapping of the continent on a basic scale of 1:250000, and the exploration of thecontinental shelf. Its headquarters are in Canberra. State and Provincial GeologicalSurveys also exist in the United States and Canada, but they are relatively smallcompared with the Federal Survey, the US Geological Survey and the Geological Surveyof Canada. The headquarters of the former are in Washington, and some of the importantactivities are based at Denver and at San Francisco. Descriptions of the GeologicalSurvey of Canada and its responsibilities are available in Blackadar (1976), Lang (1970,pp. 270–2) and Zaslow (1975). The headquarters are in Ottawa.
Appendix C 284
www.angoothachaap.blogspot.com
www.angoothachaap.blogspot.com
References and selected reading
Bazley, R.A.B. and P.I.Manning 1971. Belfast . Sp. Eng. Geol. Sheet 1:21120, Inst. Geol. Sci.
Blackadar, R. 1976. The Geological Survey of Canada, past achievements and future goals . Ottawa: Geological Survey of Canada.
Dearman, W.R., M.S.Money, R.J.Coffey, P.Scott, and M.Wheeler 1977. Engineering geological mapping of the Tyne and Wear conurbation, N.E. England. Q. J. Engng Geol . 10 , 145–68.
Johns, R.K. (ed.) 1976. History and role of government Geological Surveys in Australia . South Australia: A.B.James, Govt Printer.
Lang, A.H. 1970. Prospecting in Canada . Ottawa: Geological Survey of Canada. Robbie, J.A. 1972. The Institute of Geological Sciences and the Scottish environment.
Proc. 24th Int. Geol. Congr . 13 , 55–63. Wilson, H.E. 1972. The geological map and the civil engineers. Proc. 24th Int. Geol.
Congr . 13 , 83–6. Zaslow, M. 1975. Reading the Rocks: the story of the Geological Survey of Canada
1842–1972 . Ottawa: Macmillan.
Appendix C 285
www.angoothachaap.blogspot.com
www.angoothachaap.blogspot.com
Appendix D Exploring for old coal workings in the United
Kingdom
If preliminary investigation indicates that exploitable coal is present at a site, then thepossibility that old room-and-pillar workings are present should be anticipated, particularly near the outcrop of a well documented seam. The presence and location ofabandoned mineshafts are even less predictable at this stage of investigation. Shafts wereused for the purpose of ventilation and pumping duties as well as for winding the coal.Since the pumps were always bucket or ram pumps worked by wooden rods from thesurface, the shafts containing this type of pumping system had always to be placed at thedeepest part of the workings.
Where there is a suspicion of mineral workings, allowance should be made foralternative designs and layout, and the results of the site investigation should be relayedquickly to all concerned. In a large investigation, it is sensible to carry out exploration instages, so that methods are adapted to the specific problems as the overall pictureemerges.
An appreciation of the known geology of any mine plans, and of any surface traces(spoil heaps, old building foundations, crown holes or other evidence of subsidence) isessential to make full use of any further survey results. The National Coal Board offers anexcellent service of reports on mineral properties containing coal or coal and ironstone.The service is relatively fast and its cost is low.
A proton magnetometer survey is the geophysical method that has been used mostoften to search for old shafts. An attempt is first made to determine the outline of thecolliery yard. Then, as yards often conform to a common pattern, the likely position ofthe two shafts may be inferred. In many cases no conclusive trace of a yard remains, anda detailed magnetic survey over the entire site, rather than concentrated on a suspect area,may be the only approach. A grid of 1 m × 1 m stations is required. Anomalies additionalto those associated with the shafts may be produced by other concealed brickwork andironwork, and these spurious sources may well outnumber shafts. Each anomaly ofapproximately the right dimensions must be investigated further by drilling or excavating,bearing in mind that the ground above the shaft may be dangerously unstable. The magnetic method has the more serious disadvantage that a shaft will only give adistinctive anomaly if the backfill is ash or another material of higher susceptibility thanits surroundings. Difficulty in spotting the presence of a shaft may also arise if partialfailure of the soils around its top results in a wider surface area of ash with a taperedmargin instead of a vertical boundary between the fill and the surround. Any use ofmagnetic results must be made with these qualifications in mind, and with caution.
www.angoothachaap.blogspot.com
www.angoothachaap.blogspot.com
Magnetic surveys are of little practical value in sites littered with the debris of longindustrial or urban usage. A site that has been landscaped to a level surface usingindustrial waste is lost to the magnetic survey application. It may, however, serve as arapid and relatively cheap reconnaissance of a less complex site, where a thorough andproductive preliminary investigation has been carried out.
The void of a standard mineshaft produces a maximum gravity anomaly of less than 0.1 mgal. This is too small to be detected with certainty by a standard gravity survey, even with stations on a 1 m×1 m grid. Gravity meters, which are ten times more sensitive than a normal prospecting meter, are being developed, and a few high-resolution surveys have been described in geophysical literature. They are, at least theoretically, capable ofdetecting the void of a shaft, and high-resolution gravity surveys are likely to developinto a standard exploration service offered by specialist contractors. In comparison withproton magnetometer surveys, they will be informative, but neither rapid nor cheap. Tobenefit from the meter’s sensitivity, and to allow isolation of the small gravity anomaliesof the shafts, the levelling of stations and the determination of surface irregularities mustbe correspondingly refined.
Neither of the above geophysical methods is suitable as a technique to locate room-and-pillar workings, and indeed no geophysical method has yet proved satisfactory as a standard tool for this purpose. Excavation is essential after the preliminary investigationsas the principal, or only, method of exploration. Remember that a regular grid of drillholes may match a pattern of pillars.
Rotary drilling with some cored holes may provide useful information. A minimumdiameter of 76 mm is required to give core recovery of good enough quality.
Trenches excavated by small mechanical excavators are very useful to check shallow workings. The ideal method, especially to locate shafts if the site is restricted or meritsintensive exploration, is to use a mechanical back-acting shovel.
Where large underground galleries are preserved, closed-circuit television and photography may be used as additional aids. Remember that in situ inspection of underground workings is dangerous and is a job for a mining engineer. In addition topossible instability of the roof, there may be a hazard from coal gas.
Remedial treatment of old workings lies beyond the scope of this book, but it should bementioned that the most economical method of dealing with certain room-and-pillar workings, where overburden is thin, may be to excavate the remaining coal.
For fuller discussions, including case histories, reference should be made to Maxwell (1976), Price et al. (1969), Dearman et al. (1977) and Taylor (1968). The Department of the Environment has published a useful report by Ove Arup and Partners (1976) onlocating shafts.
References and selected reading
Dearman, W.R., F.J.Baynes and R.Pearson 1977. Geophysical detection of disused mineshafts in the Newcastle upon Tyne area. Q. J. Engng Geol . 10 , 257–69.
Maxwell, G. 1976. Old mine shafts and their location by geophysical surveying. Q. J.
Appendix D 287
www.angoothachaap.blogspot.com
www.angoothachaap.blogspot.com

Engng Geol . 9 , 283–90. Ove Arup and Partners 1976. Reclamation of derelict land: procedure for locating
abandoned mine shafts . Report prepared for the DoE. Price, D.G., A.B.Malkin and J.L.Knill 1969. Foundations of multistorey blocks on the
Coal Measures with special reference to old mine workings. Q. J. Engng Geol . 1 , 271–322.
Taylor, R.K. 1968. Site investigations in coalfields: the problem of shallow mine workings. Q.J.Engng Geol . 1 , 115–33.
Appendix D 288
www.angoothachaap.blogspot.com
www.angoothachaap.blogspot.com
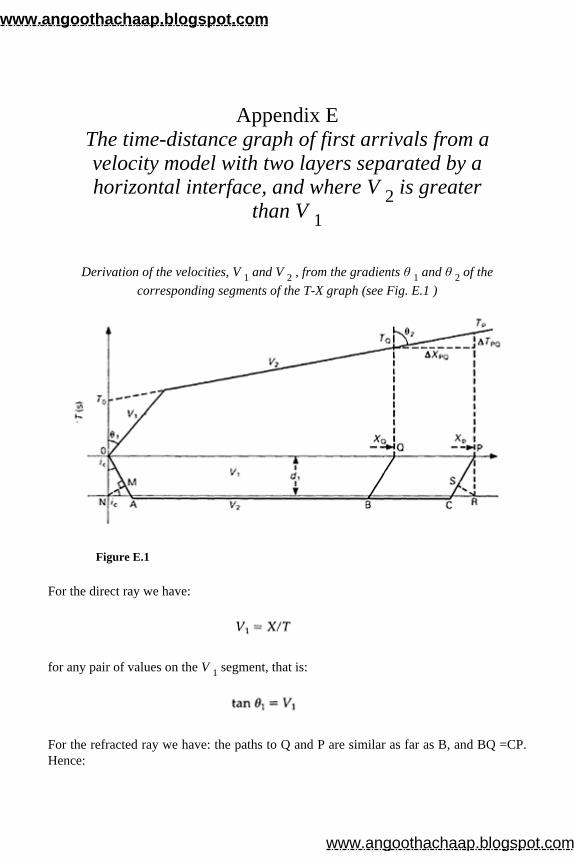
Appendix E The time-distance graph of first arrivals from a velocity model with two layers separated by a horizontal interface, and where V 2 is greater
than V 1
Derivation of the velocities, V 1 and V 2 , from the gradients θ 1 and θ 2 of the corresponding segments of the T-X graph (see Fig. E.1 )
Figure E.1
For the direct ray we have:
for any pair of values on the V 1 segment, that is:
For the refracted ray we have: the paths to Q and P are similar as far as B, and BQ =CP.Hence:
www.angoothachaap.blogspot.com
www.angoothachaap.blogspot.com
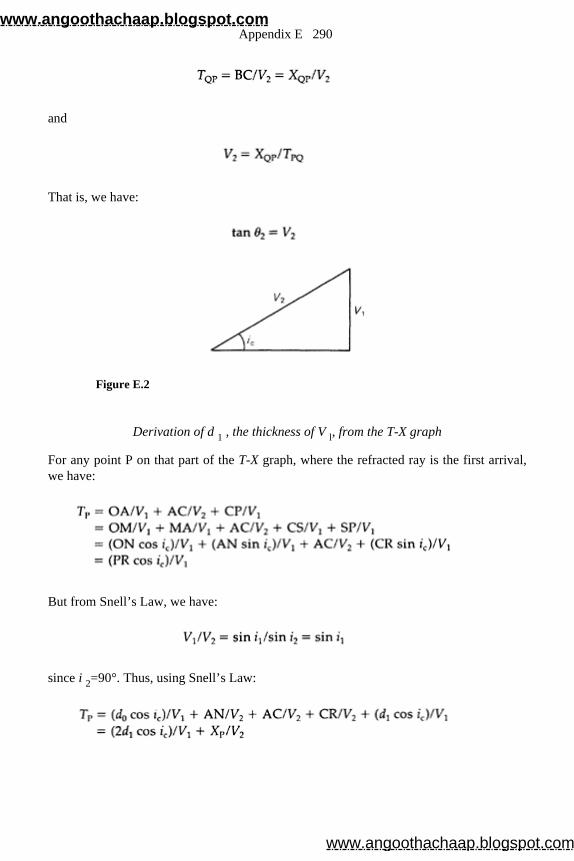
and
That is, we have:
Figure E.2
Derivation of d 1 , the thickness of V l, from the T-X graph
For any point P on that part of the T-X graph, where the refracted ray is the first arrival,we have:
But from Snell’s Law, we have:
since i 2=90°. Thus, using Snell’s Law:
Appendix E 290
www.angoothachaap.blogspot.com
www.angoothachaap.blogspot.com

for X=0, T 0=(2d 1 cos i c)/V 1. Again, using Snell’s Law, sin i 0=V 1 /V 2 , we have:
Therefore, we obtain:
and hence:
Appendix E 291
www.angoothachaap.blogspot.com
www.angoothachaap.blogspot.com
Appendix F Quality of aggregates
Tests on rock aggregates
Classification of an aggregate The rock used should be given a group classification as described in Section 7.1.2 The main groups used as aggregates are basalt, gabbro, granite, porphyry hornfels, schist,quartzite, limestone, gritstone, flint and artificial types.
Particle shape, texture and size Table F.1 gives the main characteristics of particle shape. Generally, rounded particles are easier to work but angular particles bond better with the matrix. The bonding of theaggregate is also related to surface texture. Surface texture is described by one of the sixterms listed and described in Table F.2. The category of surface texture is based on the impression gained by a simple visual examination of hand specimens, and is not a precisepetrographical classification Different specimens of the same rock type may fall intoadjacent categories.
The particle size is determined by a sieve analysis in which a given weight of aggregate is passed through a series of sieves of standard sizes and each fractior resultingis then weighed and related to the original sample weight, as a percentage passing acertain aperture.
The amount of clay, silt or dust in fine or coarse aggregate Three methods can be employed in this determination. These are:
(a) the sedimentation method, which is a gravimetric method used for particles up to 20 µm in size (1 µm=0.001 mm);
(b) the decantation method, which is used for material less than 75 µm in size; (c) the field settling test, which is an approximate volumetric method used for sands and
gravels, but is not used for crushed rock aggregate. It gives a rough guide to the percentage of silt, clay or dust in an aggregate.
www.angoothachaap.blogspot.com
www.angoothachaap.blogspot.com
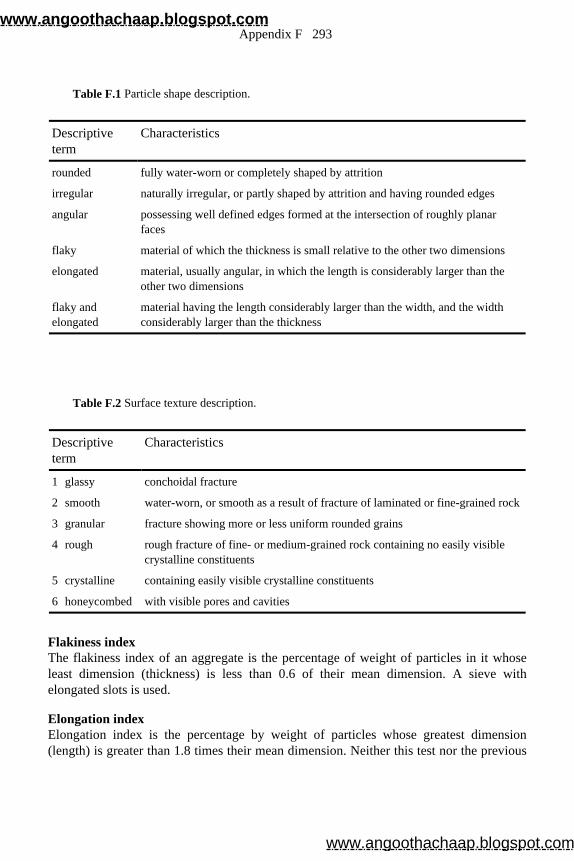
Flakiness index The flakiness index of an aggregate is the percentage of weight of particles in it whoseleast dimension (thickness) is less than 0.6 of their mean dimension. A sieve withelongated slots is used.
Elongation index Elongation index is the percentage by weight of particles whose greatest dimension(length) is greater than 1.8 times their mean dimension. Neither this test nor the previous
Table F.1 Particle shape description.
Descriptive term
Characteristics
rounded fully water-worn or completely shaped by attrition
irregular naturally irregular, or partly shaped by attrition and having rounded edges
angular possessing well defined edges formed at the intersection of roughly planar faces
flaky material of which the thickness is small relative to the other two dimensions
elongated material, usually angular, in which the length is considerably larger than the other two dimensions
flaky and elongated
material having the length considerably larger than the width, and the width considerably larger than the thickness
Table F.2 Surface texture description.
Descriptive term
Characteristics
1 glassy conchoidal fracture
2 smooth water-worn, or smooth as a result of fracture of laminated or fine-grained rock
3 granular fracture showing more or less uniform rounded grains
4 rough rough fracture of fine- or medium-grained rock containing no easily visible crystalline constituents
5 crystalline containing easily visible crystalline constituents
6 honeycombed with visible pores and cavities
Appendix F 293
www.angoothachaap.blogspot.com
www.angoothachaap.blogspot.com
one is applicable to fine material passing a 6.35 mm (¼ in) BS sieve.
Angularity number Angularity (absence of rounding of aggregate particles) affects the ease of handling of amixture of aggregate and binder, whether concrete or bitumen. The angularity number isa measure of the relative angularity based on the percentage of voids in the aggregateafter compaction. The least angular (most rounded) aggregates have 33% voids, and theangularity number of an aggregate is defined as the amount by which the percentage ofvoids exceeds 33. The angularity number usually ranges from 0 to 12.
Ten per cent fines value This gives a measure of the resistance of the aggregate to crushing. The higher the valuethe greater the resistance. The load required to produce 10% fines from the aggregate canbe measured using aggregate impact testing equipment.
Aggregate impact value (AIV) This gives a relative measure of the resistance of the aggregate to sudden impact, whichmay differ from its resistance to a compressive load. The amount of fine material produced is expressed as a percentage of the initial weight of sample, each aggregatesample being treated in the same way.
Aggregate crushing value (ACV) This gives a relative measure of the resistance of an aggregate to crushing under agradually applied compressive load. The test is similar to the one for AIV except that aload is gradually applied. If the results of the AIV test and this one are 30 or more for anaggregate, the result is unclear and determination of the 10% fines value should becarried out.
Crushing strength ( q u )
Determination of the unconfined crushing (or compressive) strength is usually carried outon the solid rock material.
Aggregate abrasion value (AAV) This is a measure of the resistance of aggregates to surface wear by abrasion; the lowerthe value the greater the resistance.
Polished stone value (PSV) This measures the extent to which aggregate will polish from traffic; the greater the valuethe greater the resistance. Figure F.1 gives test values for some rock types.
Appendix F 294
www.angoothachaap.blogspot.com
www.angoothachaap.blogspot.com
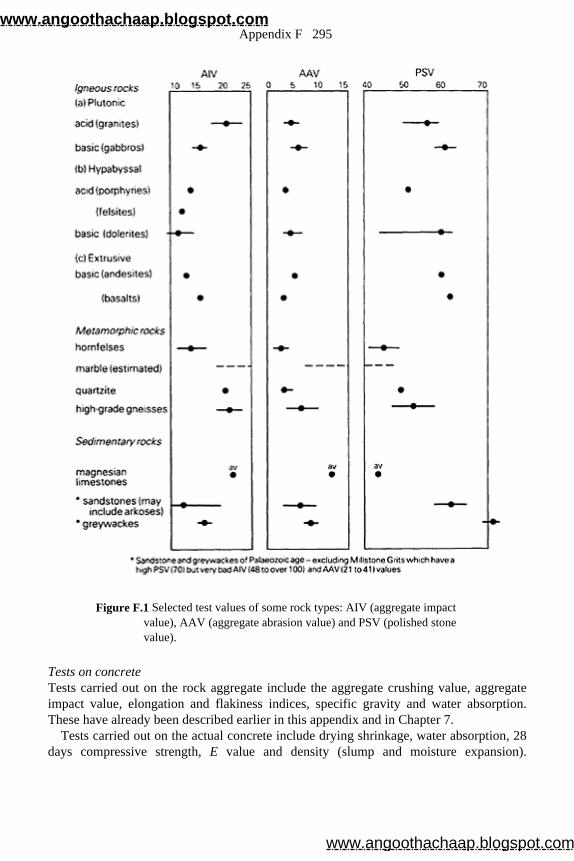
Figure F.1 Selected test values of some rock types: AIV (aggregate impact value), AAV (aggregate abrasion value) and PSV (polished stone value).
Tests on concrete Tests carried out on the rock aggregate include the aggregate crushing value, aggregateimpact value, elongation and flakiness indices, specific gravity and water absorption.These have already been described earlier in this appendix and in Chapter 7.
Tests carried out on the actual concrete include drying shrinkage, water absorption, 28 days compressive strength, E value and density (slump and moisture expansion).
Appendix F 295
www.angoothachaap.blogspot.com
www.angoothachaap.blogspot.com
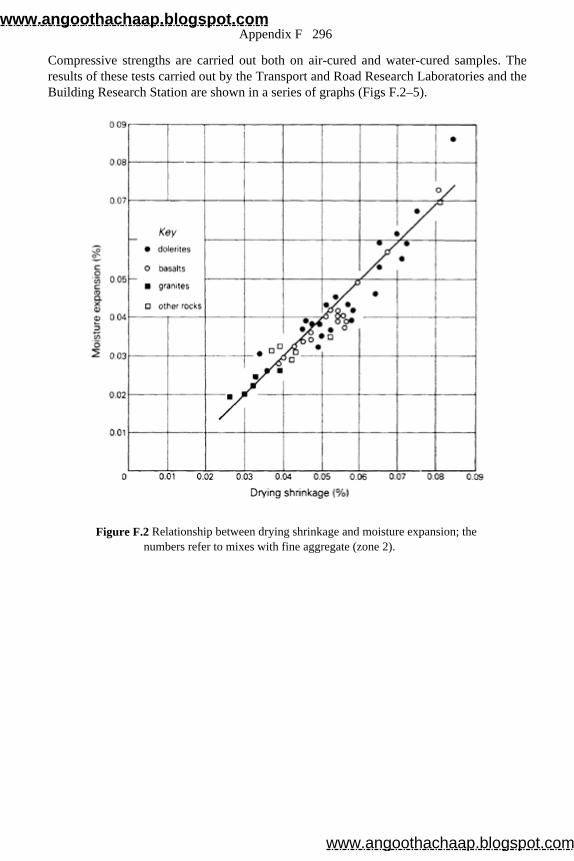
Compressive strengths are carried out both on air-cured and water-cured samples. The results of these tests carried out by the Transport and Road Research Laboratories and theBuilding Research Station are shown in a series of graphs (Figs F.2–5).
Figure F.2 Relationship between drying shrinkage and moisture expansion; the numbers refer to mixes with fine aggregate (zone 2).
Appendix F 296
www.angoothachaap.blogspot.com
www.angoothachaap.blogspot.com
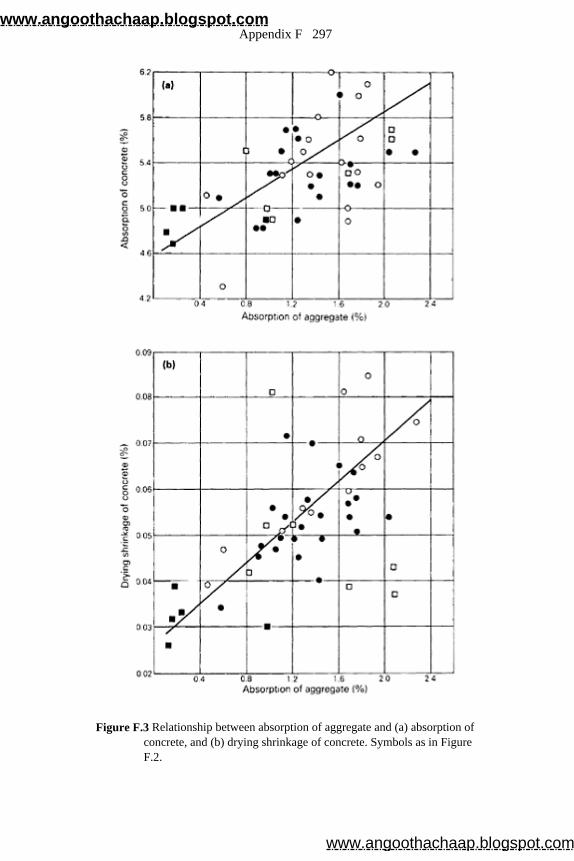
Figure F.3 Relationship between absorption of aggregate and (a) absorption of concrete, and (b) drying shrinkage of concrete. Symbols as in Figure F.2.
Appendix F 297
www.angoothachaap.blogspot.com
www.angoothachaap.blogspot.com
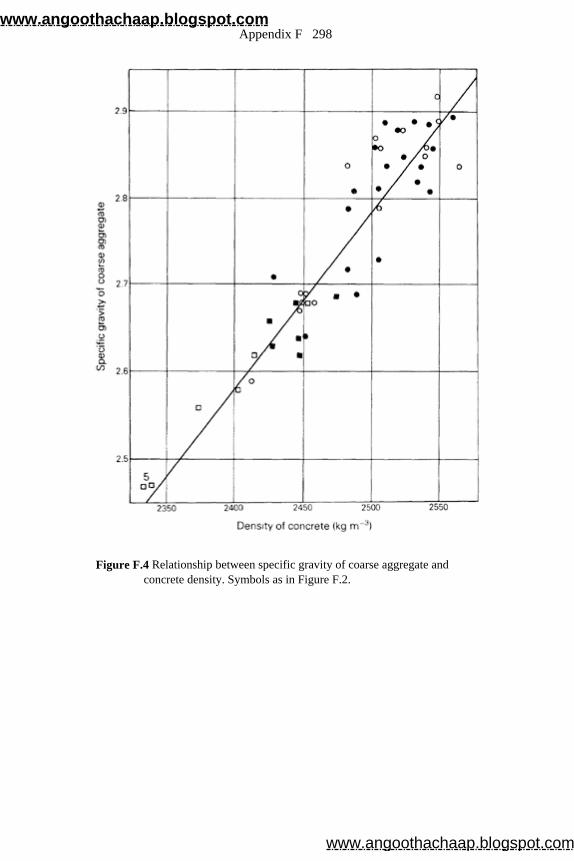
Figure F.4 Relationship between specific gravity of coarse aggregate and concrete density. Symbols as in Figure F.2.
Appendix F 298
www.angoothachaap.blogspot.com
www.angoothachaap.blogspot.com
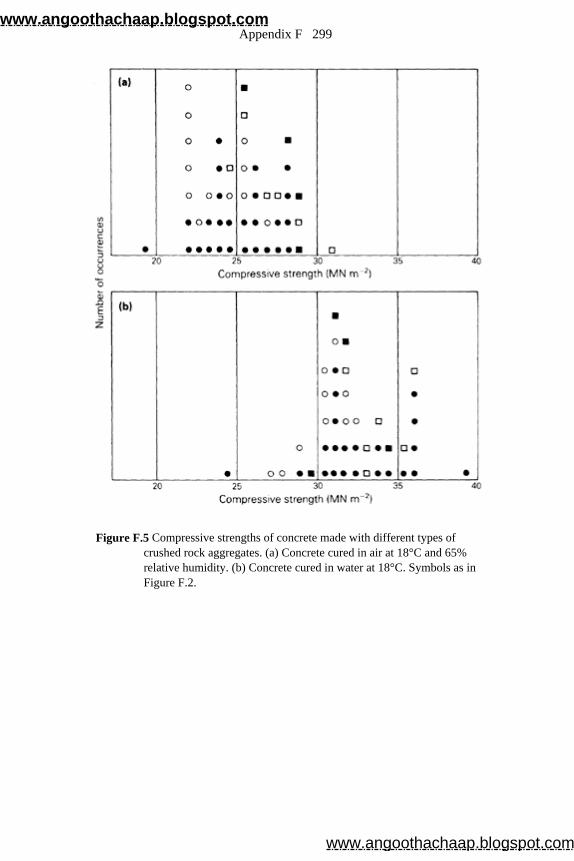
Figure F.5 Compressive strengths of concrete made with different types of crushed rock aggregates. (a) Concrete cured in air at 18°C and 65% relative humidity. (b) Concrete cured in water at 18°C. Symbols as in Figure F.2.
Appendix F 299
www.angoothachaap.blogspot.com
www.angoothachaap.blogspot.com
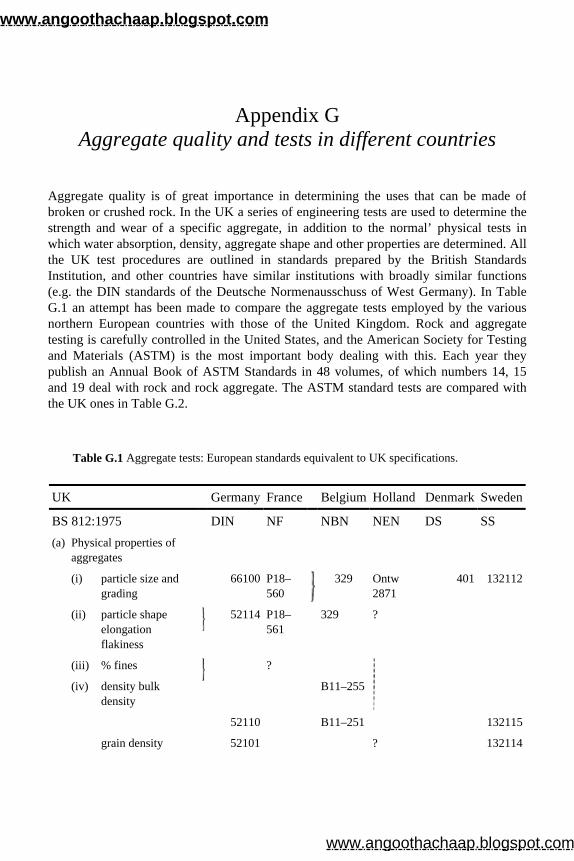
Appendix G Aggregate quality and tests in different countries
Aggregate quality is of great importance in determining the uses that can be made ofbroken or crushed rock. In the UK a series of engineering tests are used to determine thestrength and wear of a specific aggregate, in addition to the normal’ physical tests in which water absorption, density, aggregate shape and other properties are determined. Allthe UK test procedures are outlined in standards prepared by the British StandardsInstitution, and other countries have similar institutions with broadly similar functions(e.g. the DIN standards of the Deutsche Normenausschuss of West Germany). In Table G.1 an attempt has been made to compare the aggregate tests employed by the various northern European countries with those of the United Kingdom. Rock and aggregatetesting is carefully controlled in the United States, and the American Society for Testingand Materials (ASTM) is the most important body dealing with this. Each year theypublish an Annual Book of ASTM Standards in 48 volumes, of which numbers 14, 15and 19 deal with rock and rock aggregate. The ASTM standard tests are compared withthe UK ones in Table G.2.
Table G.1 Aggregate tests: European standards equivalent to UK specifications.
UK Germany France Belgium Holland Denmark Sweden
BS 812:1975 DIN NF NBN NEN DS SS (a) Physical properties of
aggregates
(i) particle size and grading
66100 P18–560
329 Ontw 2871
401 132112
(ii) particle shape elongation flakiness
52114 P18–561
329 ?
(iii) % fines ?
(iv) density bulk density
B11–255
52110 B11–251 132115
grain density 52101 ? 132114
www.angoothachaap.blogspot.com
www.angoothachaap.blogspot.com

(density grade)
(v) porosity 52102 ?
(vi) moisture content B11–201 132113
(vii) water absorption 52103 B11–255 N1562
(viii) saturation moisture content (or coeff)
52113 ?
(b) Aggregate strength and hardness:
(i) crushing strength 52109
52105 B11–252
? 132116?
(ii) impact strength 52109
(iii) 10% fines
(c) Aggregate wear and skid resistance:
(i) abrasion value (AAV) 52108 P18–573
Ontw 2873
(ii) attrition test (see British Rail tests) P18–572
(iii) polished stone value (PSV) Ontw 2872
(d) Chemical tests and weathering tests:
(i) weathering assessment (see Engineers Code of Practice BS 5930)
52106
(ii) frost heave or frost susceptibility PRL LN/765/JCJ
52104 P18–593
401
Table G.2 Aggregate tests: comparison of US and UK specifications.
British Standard
ASTM Standard (Vols 15, 19)
Test (UK) (USA) (a) Sampling, size, shape and classification
(i) particle size and grading BS 812:1 1975 C136–76
(ii) particle shape, elongation, flakiness BS 812:1 1975
Appendix G 301
www.angoothachaap.blogspot.com
www.angoothachaap.blogspot.com
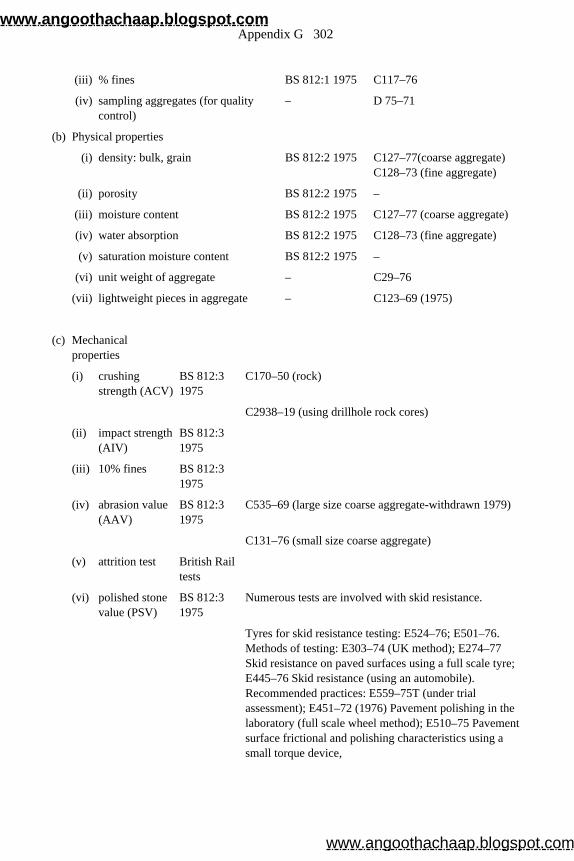
(iii) % fines BS 812:1 1975 C117–76
(iv) sampling aggregates (for quality control)
– D 75–71
(b) Physical properties
(i) density: bulk, grain BS 812:2 1975 C127–77(coarse aggregate) C128–73 (fine aggregate)
(ii) porosity BS 812:2 1975 –
(iii) moisture content BS 812:2 1975 C127–77 (coarse aggregate)
(iv) water absorption BS 812:2 1975 C128–73 (fine aggregate)
(v) saturation moisture content BS 812:2 1975 –
(vi) unit weight of aggregate – C29–76
(vii) lightweight pieces in aggregate – C123–69 (1975)
(c) Mechanical properties
(i) crushing strength (ACV)
BS 812:3 1975
C170–50 (rock)
C2938–19 (using drillhole rock cores)
(ii) impact strength (AIV)
BS 812:3 1975
(iii) 10% fines BS 812:3 1975
(iv) abrasion value (AAV)
BS 812:3 1975
C535–69 (large size coarse aggregate-withdrawn 1979)
C131–76 (small size coarse aggregate)
(v) attrition test British Rail tests
(vi) polished stone value (PSV)
BS 812:3 1975
Numerous tests are involved with skid resistance.
Tyres for skid resistance testing: E524–76; E501–76. Methods of testing: E303–74 (UK method); E274–77 Skid resistance on paved surfaces using a full scale tyre; E445–76 Skid resistance (using an automobile). Recommended practices: E559–75T (under trial assessment); E451–72 (1976) Pavement polishing in the laboratory (full scale wheel method); E510–75 Pavement surface frictional and polishing characteristics using a small torque device,
Appendix G 302
www.angoothachaap.blogspot.com
www.angoothachaap.blogspot.com

(vii) Scratch hardness of coarse aggregate
– C235–68 (withdrawn 1979)
particles
(d) Chemical and weathering tests
(i) Weathering assessment
BS 5930 C217–58 (slate only)
(ii) Frost heave or frost susceptibility
Road Research
?
Lab LN/765/JCJ
(iii) Sodium sulphate soundness test
– C88–76
Appendix G 303
www.angoothachaap.blogspot.com
www.angoothachaap.blogspot.com
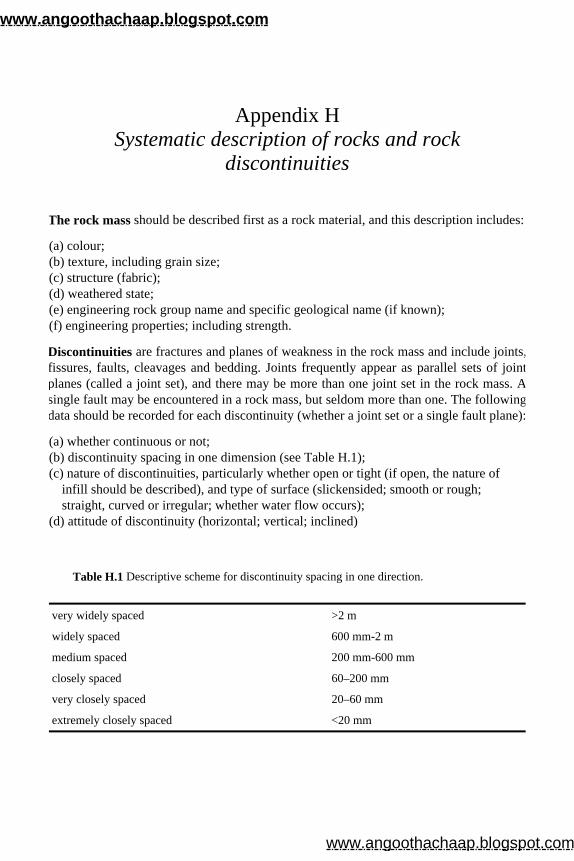
Appendix H Systematic description of rocks and rock
discontinuities
The rock mass should be described first as a rock material, and this description includes:
(a) colour; (b) texture, including grain size; (c) structure (fabric); (d) weathered state; (e) engineering rock group name and specific geological name (if known); (f) engineering properties; including strength.
Discontinuities are fractures and planes of weakness in the rock mass and include joints,fissures, faults, cleavages and bedding. Joints frequently appear as parallel sets of jointplanes (called a joint set), and there may be more than one joint set in the rock mass. Asingle fault may be encountered in a rock mass, but seldom more than one. The followingdata should be recorded for each discontinuity (whether a joint set or a single fault plane):
(a) whether continuous or not; (b) discontinuity spacing in one dimension (see Table H.1); (c) nature of discontinuities, particularly whether open or tight (if open, the nature of
infill should be described), and type of surface (slickensided; smooth or rough; straight, curved or irregular; whether water flow occurs);
(d) attitude of discontinuity (horizontal; vertical; inclined)
Table H.1 Descriptive scheme for discontinuity spacing in one direction.
very widely spaced >2 m
widely spaced 600 mm-2 m
medium spaced 200 mm-600 mm
closely spaced 60–200 mm
very closely spaced 20–60 mm
extremely closely spaced <20 mm
www.angoothachaap.blogspot.com
www.angoothachaap.blogspot.com
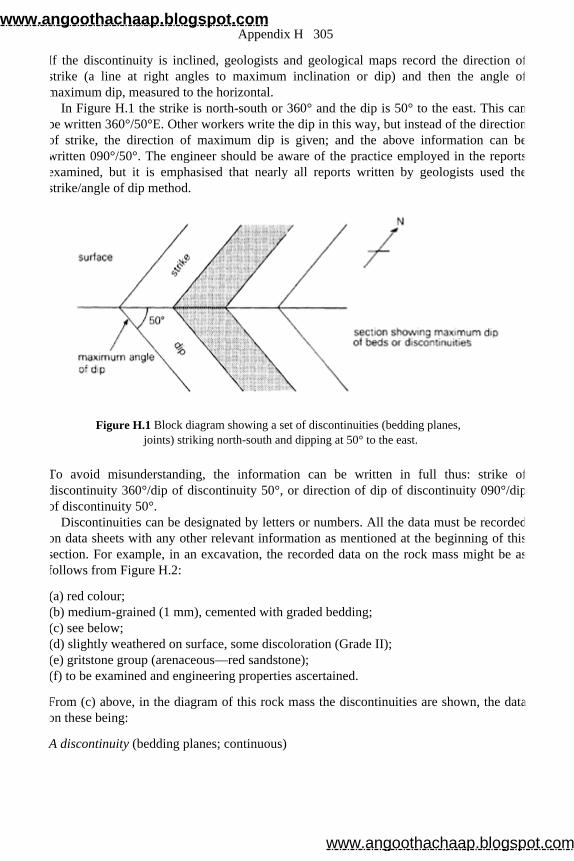
If the discontinuity is inclined, geologists and geological maps record the direction ofstrike (a line at right angles to maximum inclination or dip) and then the angle ofmaximum dip, measured to the horizontal.
In Figure H.1 the strike is north-south or 360° and the dip is 50° to the east. This can be written 360°/50°E. Other workers write the dip in this way, but instead of the directionof strike, the direction of maximum dip is given; and the above information can bewritten 090°/50°. The engineer should be aware of the practice employed in the reports examined, but it is emphasised that nearly all reports written by geologists used thestrike/angle of dip method.
Figure H.1 Block diagram showing a set of discontinuities (bedding planes, joints) striking north-south and dipping at 50° to the east.
To avoid misunderstanding, the information can be written in full thus: strike ofdiscontinuity 360°/dip of discontinuity 50°, or direction of dip of discontinuity 090°/dip of discontinuity 50°.
Discontinuities can be designated by letters or numbers. All the data must be recordedon data sheets with any other relevant information as mentioned at the beginning of thissection. For example, in an excavation, the recorded data on the rock mass might be asfollows from Figure H.2:
(a) red colour; (b) medium-grained (1 mm), cemented with graded bedding; (c) see below; (d) slightly weathered on surface, some discoloration (Grade II); (e) gritstone group (arenaceous—red sandstone); (f) to be examined and engineering properties ascertained.
From (c) above, in the diagram of this rock mass the discontinuities are shown, the dataon these being:
A discontinuity (bedding planes; continuous)
Appendix H 305
www.angoothachaap.blogspot.com
www.angoothachaap.blogspot.com
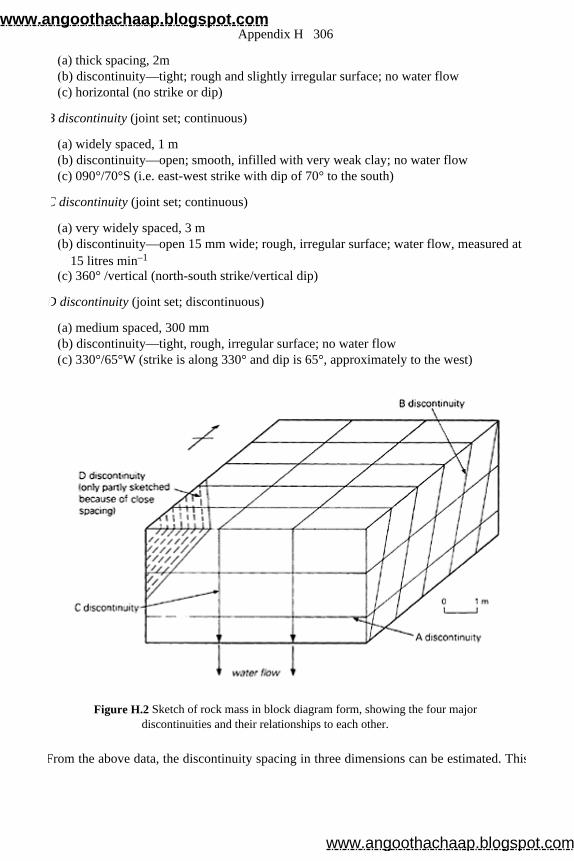
(a) thick spacing, 2m (b) discontinuity—tight; rough and slightly irregular surface; no water flow (c) horizontal (no strike or dip)
B discontinuity (joint set; continuous)
(a) widely spaced, 1 m (b) discontinuity—open; smooth, infilled with very weak clay; no water flow (c) 090°/70°S (i.e. east-west strike with dip of 70° to the south)
C discontinuity (joint set; continuous)
(a) very widely spaced, 3 m (b) discontinuity—open 15 mm wide; rough, irregular surface; water flow, measured at
15 litres min–1 (c) 360° /vertical (north-south strike/vertical dip)
D discontinuity (joint set; discontinuous)
(a) medium spaced, 300 mm (b) discontinuity—tight, rough, irregular surface; no water flow (c) 330°/65°W (strike is along 330° and dip is 65°, approximately to the west)
Figure H.2 Sketch of rock mass in block diagram form, showing the four major discontinuities and their relationships to each other.
From the above data, the discontinuity spacing in three dimensions can be estimated. This
Appendix H 306
www.angoothachaap.blogspot.com
www.angoothachaap.blogspot.com
will give some indication of the size and shape of rock blocks bounded by discontinuities(the block volume of the rock mass). Descriptive terms can be used in accordance withTable H.2.
In addition, rock blocks may be described as blocky (equidimensional), tabular (thickness much less than height or width) or columnar (height much greater than cross section).
Thus, the rock mass which has already been described in detail can be summarised as follows:
reddish, medium-grained, slightly weathered sandstone (gritstone group) showinggraded bedding; bedding planes (A discontinuity) thick, 2 mm, tight, rough and irregular,horizontal; three joint sets occur:
(a) widely spaced, 1 m, open, smooth infilled with very weak clay, 090°/70°S; (b) very widely spaced, 3 m, open 15 mm, rough, irregular with strong water flow 15
litres min– 1, 360°/vertical; (c) medium-spaced, 300 mm, tight, rough, irregular, 3300/650W, producing a large
tabular block volume.
Such a description would apply to a reasonably large rock exposure on a site or to part ofan exposed quarry face. Several such descriptions are needed to give full data on a site orexcavation. All data should be recorded on a map, wherever possible, as well as on datasheets. Engineering properties including strength of material (in MN m–1) can be added to the description later.
Information on joint sets may be given by means of stereographic representation. A joint plane is considered to be within an enclosing sphere, with the normal (line at rightangles) to the joint plane extended to meet the surface of the enclosing sphere. This pointon the surface is then projected towards the north pole of the enclosing sphere, and thestereographic pole of the joint plane is the point where the projection meets the horizontalplane of the sphere. In Figure H.3 the shaded joint plane (A) has its normal (R) meeting the enclosing sphere surface at X. When X is projected to the north pole (P), thestereographic pole of the joint plane is the point Y. The equatorial plane of the enclosingsphere is the stereographic plane. The stereogram is shown in Figure H.4, with great
Table H.2 Descriptive terms for block volume.
very large >2 m
large 600 mm-2 m
medium 200–600 mm
small 60–200 mm
very small <60 mm
Appendix H 307
www.angoothachaap.blogspot.com
www.angoothachaap.blogspot.com
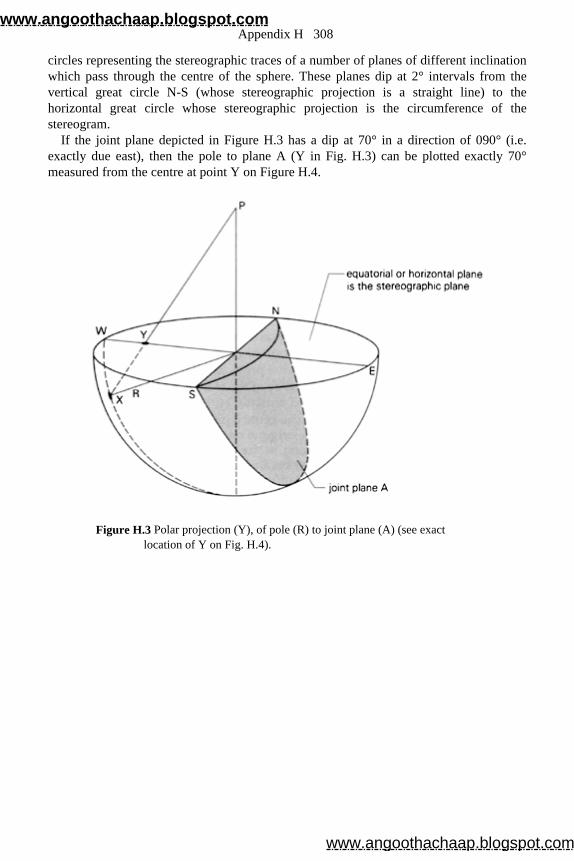
circles representing the stereographic traces of a number of planes of different inclinationwhich pass through the centre of the sphere. These planes dip at 2° intervals from the vertical great circle N-S (whose stereographic projection is a straight line) to the horizontal great circle whose stereographic projection is the circumference of thestereogram.
If the joint plane depicted in Figure H.3 has a dip at 70° in a direction of 090° (i.e. exactly due east), then the pole to plane A (Y in Fig. H.3) can be plotted exactly 70°measured from the centre at point Y on Figure H.4.
Figure H.3 Polar projection (Y), of pole (R) to joint plane (A) (see exact location of Y on Fig. H.4).
Appendix H 308
www.angoothachaap.blogspot.com
www.angoothachaap.blogspot.com
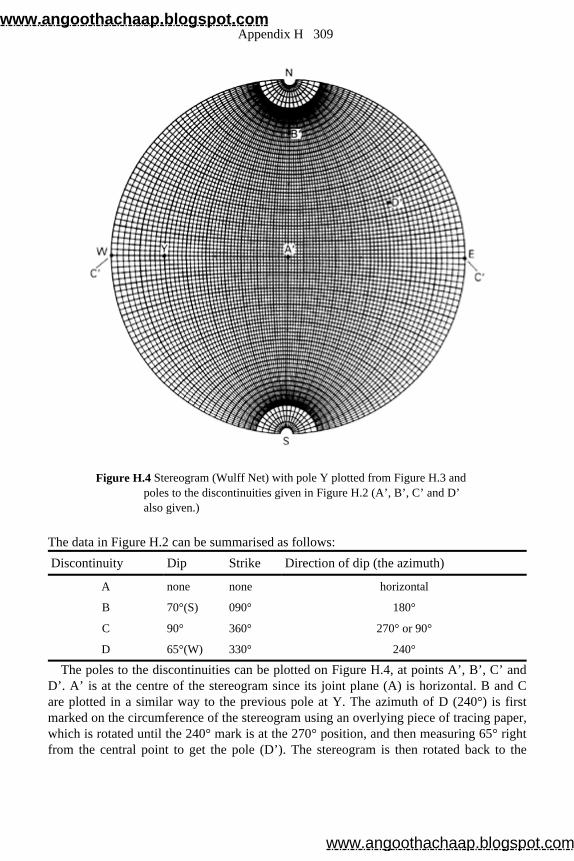
Figure H.4 Stereogram (Wulff Net) with pole Y plotted from Figure H.3 and poles to the discontinuities given in Figure H.2 (A’, B’, C’ and D’ also given.)
The data in Figure H.2 can be summarised as follows:
The poles to the discontinuities can be plotted on Figure H.4, at points A’, B’, C’ and D’. A’ is at the centre of the stereogram since its joint plane (A) is horizontal. B and Care plotted in a similar way to the previous pole at Y. The azimuth of D (240°) is first marked on the circumference of the stereogram using an overlying piece of tracing paper,which is rotated until the 240° mark is at the 270° position, and then measuring 65° right from the central point to get the pole (D’). The stereogram is then rotated back to the
Discontinuity Dip Strike Direction of dip (the azimuth)
A none none horizontal
B 70°(S) 090° 180°
C 90° 360° 270° or 90°
D 65°(W) 330° 240°
Appendix H 309
www.angoothachaap.blogspot.com
www.angoothachaap.blogspot.com

original position. The use of stereographic plots is becoming much more common in theUK. Several regional authorities present data in this way and the Transport and RoadResearch Laboratory (TRRL) has described the method in detail (Matheson 1983).
Reference
Matheson, G.D. 1983. Rock stability assessment in preliminary site investigations—graphical methods . Working Paper 1982/4, Scottish Branch TRRL.
Appendix H 310
www.angoothachaap.blogspot.com
www.angoothachaap.blogspot.com

Index
The pages on which words and phrases of basic importance are most directly defined areshown in bold type, so that the index may be used as a glossary of common geologicalterms and concepts. Numbers in italic type refer to text illustrations.
abrasion value 243 , 307, Table G1, Table G2 abrasiveness 250, Table 7.7 acid rock 31 acidic soils 69, 73 acoustic impedance 209 active ridges 145 aeolian deposits 77 agate 20 age of rocks 111–6, 155–9 agglomerate 39, 228 aggregate 21–2, 84, 241–7, 304–10
abrasion value (AAV) 243 , 307, F10, Table G1, Table G2 amount of clay 304 angularity number 305 classification 242–7, 304 crushing value (ACV) 199, 306 impact value (AIV) 243, 306 , F10, Tables G1, G2 polished stone value (PSV) 242, 307 roadstone 37, 242–3
aggregate tests 310 A horizon 72 algae 69 alkaline soils 73 alluvium 65, 79
alluvial deposits 65 , 78 alluvial fan 79 , 172, 3.7, 5.5
alteration minerals 21–8 amethyst 20 amygdale 36 amygdaloidal texture 33 analogue electrical 170 angle of frictional resistance 264 angular unconformity 142 angularity number 305
www.angoothachaap.blogspot.com
www.angoothachaap.blogspot.com
anhydrite 30 anisotropy 5, 61, 230 anomalous mass 199 anticline 122 , 126, 281, 4.11, 5.13, 8.7 apparent dip 118 apparent resistivity 213 apparent velocity 207 applied geophysics 1, 3, 191, 199–218
gravity anomaly 199–201 gravity meter 217 , 298–9 induced polarisation method 215 magnetic method 216–7, 298–9 resistivity method 213–5 self-potential method 215
aquiclude 172–3, 290 aquifer 172–3, 180–1, 272, 290, App. B
coefficient of storage 182 recharging of 180, 290–3 transmissibility 182
Archaean 112, Table 4.2 area of artesian flow 172–3 area of draw (subsidence) 197 arkose 51, 227 artesian pressure 173 artesian well 172 asbestos 22 ash 39 aspect ratio 237 asthenosphere 95, 145, 157 attapulgite 27 Atterberg plastic state limits 26, Table 2.8 auger 223 augite 15, 23, 25, 36 axial plane 122, 126–30, 142, 279 axial surface 122, 126 axis of fold 122, 126, 162 axis of symmetry 6 azonal soils 73 , 76, Table 3.4
barite 30 basalt group 228, 229, Table 7.2 basalts 21, 246 batholith 43–4, 2.26 bauxite ’ 26 , 70 bed 117 bedding 103,109–11, 316–20
cross 51,99
Index 312
www.angoothachaap.blogspot.com
www.angoothachaap.blogspot.com
dip of 117 graded 49, 107 planes 118–20, 221, 260, 278, 282, 310–20
bell pit 195 bentonite 27 B horizon 72 biological weathering 69 biotite 17, 21, 31, 65, Table 2.11, 3.1 blasting 250–2 blasting ratio 251 blasting techniques 250–2 blende 30 block volume (of rock) 257, 318, Table H.2 body waves 201 bole 40 borehole geophone 103, 209 boring 1, 4.4, 4.21, 181, 189, 209, 211–3, 219–24, 224, 249, 274, 279–81, 290–3, 295 Bouger Anomaly 218 boulder clay 92–3, 6.14, 215, 227, 261, 272, 275 bourne 175 breccia 103, 134, 156, 4.19, 227 , 279 British Geological Survey (BGS) 103, 191 App. C British Standard Code of Practice 1, 188 brucite layer 23 bulk density 243 bulk density test 243 buried channel 92 , 172, 211, 224, 272, 276, 279 buried hill 156
Cainozoic 112 , Table 4.2 calcareous sandstone 55 calcareous shale 55 calcimorphic soils 73, Table 3.4, 76 calcite 29, 43, 55, 78 calcitic mudstone 55 , 227 calcrete 73 caliche 73 , 169 Calyx drill 223 cambering 96 Cambrian 156 capillary fringe 168 capillary zone 167 carbonate 29 , Table 2.10, 55, 57 carbonation 68 Carboniferous Table 4.2, 92, 98, 158–9, 195, 224, 274–5 cassiterite 45 catena 75
Index 313
www.angoothachaap.blogspot.com
www.angoothachaap.blogspot.com

cement 239 central vent 39 centre of symmetry 6 Cenozoic 112, 116, Table 4.2 chain silicates 12 , 14, 25 chalcedonic silica 20 , 245 chalk 57 , 96, 227, 272–4 Channel Tunnel 281–2 chemical sedimentary rocks 45 chemical weathering 68 –64 chert 20–1 C horizon 68 chilled margin 43 chlorite 23 , 54 chrysotile 22 clastic rocks 45, 51, 227 clay gouge 134, 4.19 clay minerals 23–7, 45, 46, 55 clay with flints 95 cleavage 7, 66 cleavage directions 7 clinometer 118 coal 46, 109, 154, 159, 192, 224, 228, 298 Coal Measures 195 coarse grained rocks 32 Code of Practice 1, 188 coefficient of
expansion 244 , 245, Table 7.5 incompressibility 201 rigidity 201 storage 139, 290
cohesion 264 collapse structure 100 colluvium 65 colour 5 competent rock 127 concentric folds 126 conchoidal fracture 7 concordant hypabyssal intrusion 40 concrete 244–5 cone of
depression 181–8 exhaustion 290 pressure relief 290
confined water 172 , 290 confined water wells 181 conglomerate 1, 227, 246
Index 314
www.angoothachaap.blogspot.com
www.angoothachaap.blogspot.com
connate water 164 contact spring 175 continental crust 154 continental deposit 45 continental platform 154 continental shield 154 continuous acoustic profiling 210 continuous seismic profiling 210–3, 281, 6.11 contour map of rock head 117 core 145 core log 145, 6.14 correlating rock layers 108 corrie 89 country rock 44 crag and tail 92 cratons 154 creep of soil 260 creep failure 266 Cretaceous Table 4.2, 160 critical angle 203 critical refraction 203 cross bedding 51 crown hole 197 crush strength 306 crushing value of aggregate 306 crust 145 , 154 crystal habit 9 , Table 2.3 crystal system 5 crystalline 6, 31 crystalline texture 32 crystallisation, order of 32 crystallography 3, 5
elements of symmetry 6 Curie point 215 cyclic sedimentation 159 cyclothem 159
dams 154, 257, 271–5 Darcy’s law 162–3, 170 darcy 236 dark-coloured silicate minerals 11–7, Table 2.6, 24 daughter products 115 , Table 4.3, 116 deductive reasoning 189 deformation (of rocks) 117–34 degree of roundness 47 degree of sorting 47–8 delta 78
Index 315
www.angoothachaap.blogspot.com
www.angoothachaap.blogspot.com
density 9 deposition 81–7, 90–4
from ice 90–3 from meltwaters 93–4
depositional landforms 77, 92, 100 –94 depth probe 213 desert roses 30 destructive plate margins 147 detrital rocks 45 Devonian 58 , Table 4.2 dextral displacement 132 D horizon 72 diad 6 diagenesis 46 differentiation of magma 31 dip 104 , 117–20 dip fault 134 dip-slip 133–4 dip slope 96 direction of maximum dip 117 direction of true dip 117 direct run off 165 discharge (of a river) 79 discontinuities 264, 269
cohesion across 264 extension fracture 130 faults 133–6 shear fracture 131 spacing App. H tension fracture 130
discordant hypabyssal intrusion 40 disharmonic folding 127 disposal of toxic waste 183–5 distributive slicing 134 Doctrine of Uniformitarianism 106–7 dolerite 22, 37, 44, 246, 250 dolomite 46, 227 downthrown side (of fault) 134 draw, area of 197, 6.5 drill bits 219 drill hole 219, 250–2 drilling 219 drop-balling 251, 252 drumlin 92, 100 , 101 dry apparent specific gravity determination (Gb) 231 dumb wells 173 dunes 65 , 78
Index 316
www.angoothachaap.blogspot.com
www.angoothachaap.blogspot.com

duricrust 169 dyke 41–2
detection of 42 joints in 40
dyke swarm 42 dynamic metamorphism 58
earthquakes 148–54
deep 148 shallow 148
earthquake intensity 150 , Table 4.4 earth sciences 2 Elastic Rebound Theory 151 elasticity 201 electrical analogue model 170 electrical methods 213–5
self potential method (SP) 215 induced polarisation method (IP) 215
electro-osmosis, dewatering by 183 elements 27 elements of symmetry 6 elongation index 305 eon 112 epicentre 149 , 150 epithermal deposits 45 epochs 112 equipotential surfaces 169 eras 112 erosion 81–6, 90, 96–9
hollow 97–9 marine 80–7 of slopes 260
erosional landforms 96–100 esker 93 essential minerals 30 evaporites 21 , 57, 228 evolution 3, 111 excavation 1, 220 , 276–7 exfoliation 68 exposure 103 extension fracture 130 extrusive igneous rocks 32, 37–9
fabric of rock 227 , 316 facies, lateral change of 110 failure of slopes 260–6 fault 132, 133–6, 150–41, 185
Index 317
www.angoothachaap.blogspot.com
www.angoothachaap.blogspot.com

breccia 134 leakage through 133 plane 133 spring 176 zone 133
feldspar 18–20, 25, 66 twinning 19 zoning 19
felsite 38 ferricrete 73 fetch 81 field capacity 167 fine-grained rocks 32 finite reserves 179 fireclay 159 first arrivals 205 , 301 fissure openings 38 flakiness index 305 flint 20–1, 229 floodplain 78 flow folding 126 flow from storage 173 flowing artesian well 172–3 flow 169–70
lines 169 net 170
flow of soil 260 fluorite 29 , 45 fluvioglacial 94–5 focus of earthquake 149 folds 122–30 foliation 62, 218 formation 116, 143 fossils 109–11 fracture 7 , 130, 151 fracture index 209 framework silicates 12 freestone 230 friable 39 frictional resistance, angle of 264 , 267 Table 8.1 frost heave 244 frost heave test 239 , 243 Fuller’s Earth 27 fungi 69
gabbro 22 gabbro group 228 , 229
Index 318
www.angoothachaap.blogspot.com
www.angoothachaap.blogspot.com
galena 6, 11, 45 gamma (unit) 216 gangue minerals 28 ganister 159 garnet 12, 18 , 25, 59 geochemistry 3 geological history 107 geological legend 103 , 116 geological map 2, 103, 117–8
survey 1, 3 symbols 104 timescale 111
Geological Society of London 1 geomagnetic field 216 geophone 209 geophysics 3, 199 geosyncline 157 Ghyben-Hertzberg balance 177 gibbsite layer 156 glacial deposits 87–93 glacial drift 65,87 glacial periods 88 glacial striae 90 glassy texture 33 gneiss 59, 227, 247 , 252 goethite 28, 68 graded bedding 49 , 107 grain size 46–7, 51, 235, Table 2.17 granite 43–5, 141, 4.25, 265
formation 43–5 group 228 , 229, 252, Table 7.2
gravel 49, 247 , Table 2.16 gravity anomaly 199, 218 gravity meter 217 gravity method 217–8 Great Ice Age 77, 87 greywacke 51, 246 gritstone group 246 ground water 162–85, 166–9, 172, 174, 215
basins 172 conditions 215, 225 , 260 drainage 182 inventory 179
group, stratigraphic 116 grout 130, 209, 215, 272 groyne 86 gulls 96
Index 319
www.angoothachaap.blogspot.com
www.angoothachaap.blogspot.com
Gutenberg discontinuity 145 gypsum 29 , 169, 228
haematite 28 , 68 half-life 115 halite 29, Table 2.10 halomorphic soils 73, 76, Table 3.4 hand specimen 5 hanging valley 89 hardness 7, Table 2.1 hard pan 75, 169 head deposits 95 heading blasting 251 head of water 162 hexad 6 Himalayas 148 hinge of fold 122–5 hogsback 98 horizontal investigation 215 hornblende 16 hornfels 230, Table 7.2, 2.37 hydration 68 hydraulic conductivity 162, 236 , 290 hydraulic gradient 162 , 182, 236 hydraulic head 162 hydraulic stone 246 hydrodynamic conditions 177 hydrological unit 172 , 179 hydromorphic soils 73 , 76, Table 3.4 hydrophone 205 hydrostatic balance 177 hydrothermal veins 45 hypabyssal igneous rock 32 hypothermal deposits 45
ice front 88–9 ice sheet 88 igneous intrusions (forms) 40 – 4 igneous rocks 11, 30–45 igneous structures 40–4 illite 24 , 26 illuviated layer 72 impervious layer 172 incompetent rock 127 incompressibility, coefficient of 201 index minerals 59 index properties 228
Index 320
www.angoothachaap.blogspot.com
www.angoothachaap.blogspot.com

induced polarisation method 215 inductive reasoning 189 inference 189 inlier 106 Institute of Geological Sciences 294 intake area 172 intensity of earthquake 116, 149 interglacial period 88 intermediate deposit 45 intrazonal soils 73 , 76, Table 3.4 intrinsic permeability 162 intrusive rocks 39–45 iron pan 169 island arcs 148 island silicates 12 isoseismal map 150–2 isostatic recovery 95 , 152 isotherm 139 isotope 115 isotropism 231
jasper 20 joints 132–3, 139, 143, 221, 252–4, 263, 4.25, App. H
columnar 40, 139, 4.24 contraction 139 cooling 139 lift 273
Jurassic 160 , Table 4.2 juvenile water 164
kame 92 kankar 169 K-Ar ages 115 kaolin(ite) 23 , 25, 26 karst topography 70 kettle hole 92 K-feldspar 18–20
lake flats 24 landforms 96 lateral change of facies 110 lava 38 , 42, 98 leached layer 72 leakage (at dams) 272 levées 78 Lewisian gneiss 155 –5, 252
Index 321
www.angoothachaap.blogspot.com
www.angoothachaap.blogspot.com

lichens 69 light-coloured silicate minerals 17–21, Table 2.7, 18 lignite 228 limb of fold 122 limestone 46 , 55 178, 227–
aggregate 246 Cambrian 155 Carboniferous 159 engineering properties App. F
group 229, Table 7.2 limonite 28 , 68 liquefaction 154 liquid limit 26 , 28, Table 2.9 lithosphere 145 loess 65 , 78 London Basin 172 London Clay 173, 277 longitudinal joint 136 longitudinal waves 201 longshore drift 84–6 longwall working 197 low-velocity layer 209 lustre (of a mineral) 8
magma 12 , 23 magnetic field 146, 216
anomaly 147, 215 intensity 216
magnetic method 215–7 magnetic properties 11 magnetic susceptibility 11, 216 , 298, App. D magnetite 28, 146, 216 magnetometer 217 magnitude of an earthquake 149–50 Magnitude Scale of Richter 149 major earthquake zones 147 mantle 145 marble 61, 227, 247 marine deposit 45 marl 56, 228, 282 massive rocks 117 master joint 136 maximum dip 117 mechanical weathering 67 medium grained rocks 32 Mercalli, Modified Scale 150 , Table 4.4 mesosphere 145
Index 322
www.angoothachaap.blogspot.com
www.angoothachaap.blogspot.com

mesothermal deposits 45 Mesozoic 112 , 159, Table 4.2 metallic ore minerals 27 metamorphic
banding 62 grade 59 , 60, Table 2.19 rocks 30, 58–62, 246, Table 2.20 quartzite 227
metamorphism 58 meteoric water 164 mica 17, 21 mica group 17, 21, Table 2.6 micelle 235 microfractures 153 mid-ocean ridges 145 migmatite 62 millidarcies 236 milligal 218 mine shafts 197 minerals 5–30
classification 30, Table 2.10 elements 10 essential 29–30 ore 27, 28, 45 , Table 2.9 oxides 27 rock forming 11, 27 secondary 23, 2.15 sulphates 28 sulphides 27 vein 11
mineral pressure 22 colour 5 density 9 lustre 8–9, Table 2.2 magnetic 11 properties 5–11, 58, Table 2.5 specific gravity 9, 231 streak 6 taste 11
mineralogy 3, 46 minor (hypabyssal) intrusion 39 mixed-layer clays 23 mobile belt 43, 154 , 157 Modified Mercalli Scale 150 , Table 4.4 Mohorovičić discontinuity (‘Moho’) 145 Mohs scale of hardness 7 , 8, Table 2.1 moisture content 232
Index 323
www.angoothachaap.blogspot.com
www.angoothachaap.blogspot.com
montmorillonite 21, 24 , Table 2.1 moraine 90 , 100 mountain building cycle 156 mud slides 95 mudstone 227 muscovite 21 , 25 Myer’s formula 80
National Coal Board (NCB) 192 non-silicate minerals 27 , 29, Table 2.10 normal fault 134 nuclear waste disposal 185
oblique fault 134 oil trap 160 , 184 Old Red Sandstone 274 olivine 12–6, 22, 25 onlap 142 oolitic limestone 55–7, 227 oolites 55 opal 20 ophitic texture 36 ore minerals 28, Table 2.9, 45 organic sedimentary rocks 45 , 227 orogenic cycle 157–9 orthoclase feldspar 20 outcrop 117 outlier 106 overbreak 276 over-deepened valley 89 overlap 142–3 overstep 142–3 oxidation 68 oxides 28, Table 2.9
palaeomagnetism 146 palaeontology 3, 109–11 Palaeozoic 112 , Table 4.2 palygorskite 27 parent isotope 115 particle size distribution curve 242 , 304 parting 7 peat 94 , 101, 159, 228, 272, App. A pedalfers 73 pedocals 73 pegmatite 21, 37 , 229
Index 324
www.angoothachaap.blogspot.com
www.angoothachaap.blogspot.com
pegmatitic texture 36 pellicular water 165 perched water table 172 percussive drilling 223–4 periglacial effects 88 periglacial soil 95 periods 111 permeability 162, 236 Permian 58, 160, Table 4.2 pervious 172 petrogenesis 2 petrology 3 Phanerozoic eon 112 phenocrysts 33 photogeology 1, 191 , 193 pH value 69 phyllite 59 , 227 piezometer 163 , 225 piezometer tubes 225 piezometric level 163 piezometric surface 163 , 225 pillar and stall workings 195 pinger acoustic source 210 piping 273 pitting 219 plagioclase 17–20 plane of symmetry 6 plastic limit 26 , Table 2.8 plasticity 26 plasticity index 26 plasticity of clays 26 platens 238 plates 145 plate tectonics 145 Pleistocene 88 , Table 4.2 plug hill 92 plumose structure 138 plump hole 197 plunge of fold 125 , 126 pluton 42, 142, 4.25 plutonic igneous rock 32 , 43 plutonic sheet intrusion 43 ' podzols 73 , 285, App. A podzolisation 73 point load test 238 polished stone value (PSV) 242 , 307 popping rock 279, 280
Index 325
www.angoothachaap.blogspot.com
www.angoothachaap.blogspot.com

pore permeability 172 pore pressure 150 , 225 pores 162 porosity 162, 167, 233– porosity test 233–6 porphyritic texture 33 porphyry 33, 230, Table 7.2 potassium feldspar 17–8 Precambrian 112, 155, Table 4.2 precipitation (rainfall) 69, 164 pre-splitting 254 pressure head (of water) 162 Principle of Superposition 107 Principle of Uniformitarianism 106 Priscoan 112 profile of equilibrium 83 Proterozoic 112 proton magnetometer 217, 298 PSV 243, 307 pyrite 28 pyroclastic rock 38 , 227 pyroxene 12 pyrrhotite 28
quartz 20–1, 25, 46, 66 quartzite 61, 227, 252
radioactive waste 185 radiocarbon dating 115 radiometric age 111–6 radiometric timescale 116, Table 4.3 raised beach 95, 209 rays 203, 301, App. E Rb-Sr (ages) 115 reaction with acid (mineral) 10 rebound number 237 red bole 39 reducing environment 69 reduction 68 reef limestone 56 , 227 reflectivity 210 regional metamorphism 58–61 regolith 65 relative tension 130 residual deposits 65, 70 , 74 residual soils 70–4 resistivity method 213–5
Index 326
www.angoothachaap.blogspot.com
www.angoothachaap.blogspot.com

reverse fault 134 , 271 Richter Magnitude Scale 149–50 rigidity, coefficient of 201 rippability 209,240 river borne deposits 77 river terrace 80, 3.7 roadstone 37, 242–3 roche moutonée 90 , 97, 208, 3.15 rock barrier 89 rock basin 89–90 rock blocks 257, 318 rock burst 154 , 280 rock classification 11, 45, 158, 227–
acid rocks 31 basic rocks 37 detrital 46 clastic 1, 46 engineering properties 231–9 genetic 227 igneous 13, 30 , 32 metamorphic 30, 58–61, 60 quality designation 220
rock competence 127 rock fall
major 263 minor 263
rock fill 154 rock-forming minerals 11–2 rock head 87, 197 rock index properties 230–9 rock mass 316 rock mechanics 1 rock properties related to drilling 249 Rock Quality Designation (RQD) 220 rock salt 29 rock texture 30–6, 46, 227, 242 rocks, the nature of 30, 39, 45, 103 room and pillar workings 195–7, 199 ropy lava 39 rose quartz 20 rotational failure 266 rotational slip 261 roundness of grains 47
sabkhas 30, 57 safe yield 179 salt
Index 327
www.angoothachaap.blogspot.com
www.angoothachaap.blogspot.com
dome 129 , 185 flat 30, 57 pillow 129 plug 129
sand dunes 77–8 sands 49 , 77 sandstone 47 , 227 saprolite 71 saturated apparent specific gravity determination 231 saturation moisture content 232 scarp 96 schist 59, 227 , 247, 252 Schmidt Concrete Test Hammer 237 scoriaceous lava 39 scree 261 seat earth 159 sebchas 30, 57 secondary blasting 250, 251 secondary minerals 23 section 104 section, vertical geological 103 sedentary deposits 65 sedimentary rocks 30, 45–6, 245–6
cyclic sedimentation 159 sedimentology 3, 65 seepage 175, 279 seismic methods 204–10
acoustic sources 209–11 applications 209–10 reflection 209–10 refraction 204–9
seismic risk 153–4 seismic velocity 203, 207–9, 237
apparent 207 log 209 low velocity layer 209 true 207
seismic waves 148, 201–4 body 201 longitudinal 201 rays 203 transverse 202 wave fronts 202
seismogram 205 seismograph 150, 205 seismology 148 seismometer 205
Index 328
www.angoothachaap.blogspot.com
www.angoothachaap.blogspot.com

self-potential method 215 sericite 21 series, stratigraphic 116 serpentine 22 seven crystal systems 5 shale 1, 23 , 227 shape of particle 304 shear fold 126 shear fracture 131, 4.26 shear strength 260 sheet jointing 140 sheet silicates 11, 17, 23–5 shelly limestone 55 , 227 shooting both ways 208–9 shot point 202 shrinkage 245 silcrete 73 silicate minerals 10–27 silicon-oxygen tetrahedron 11 sill 41, 42, Table 2.15 siltstone 227 similar fold 126 sinistral displacement 132 SI unit 213 size of grain 46 slate 59 , 227, 247 slake durability test 237 slickensides 131 , 138 slip 134 slope stabilisation methods 266 smectite clays 24 sodium sulphate soundness test 239 soil layers 74, App. A, Table 3.3 soil mechanics 1 soils 65–74, 168, 216, 285–
acidic 69, 73 activity 69 alkaline 73 azonal 74 calcimorphic 74 catena 75 classification 74 , App. A, Tables 3.2, 3.3, 3.4 clays 23–7 deposition of 65 description 71–4 duricrust 169 flow of 261
Index 329
www.angoothachaap.blogspot.com
www.angoothachaap.blogspot.com
halomorphic 73 , 77, Table 3.4 hard pan 169 head deposits 95 hydromorphic 74 , 77, Table 3.4 illuviated layer 72 intrazonal 74 , 77, Table 3.4 pedalfers 73 pedocals 73 podźols 73 , 76, Table 3.4 solum 72 terminal moraine 92 terminology 74 texture 49 well graded 48 zonal 74
solifluxion 95 solum 72 solution channel springs 177 spacing of wells 181 sparker acoustic source 210 specific discharge 163 specific gravity (SG) 9 specific gravity determinations 231–2
dry 231 saturated 232 solid mineral grain 231
sphericity 48 spit 86 spring 175 spring line 176 stabilization of slopes 260, 268 standard legend 104 static water level 163 stereogram 320 stereographic representation 319 Stevenson formula 80 stock 43 stoop and room working 195 , 298 storage, coefficient of 182 , 290 storm beach 87 strain 201 strata (singular stratum) 117 stratification 104 , 118 stratigraphic models 103 , 111 stratigraphy 3, 111 stratum contour 117 stratum spring 175
Index 330
www.angoothachaap.blogspot.com
www.angoothachaap.blogspot.com
streak (of a mineral) 5 stresses (in rocks) 260 strike 117 strike fault 134 strike line 117 strike slip 133–4 structural models 103 structure 2, 260 subcrop 142 subduction zone 148 subsidence 174 sulphates 168 sulphides 28 , Table 2.9 Superposition, Principle of 107 swallow hole 100 swelling coefficient 210, 237 swelling in shale 280 syenite 38 symmetry, elements of 6 syncline 122–6, 279, 5.5, 5.7
tabular rock blocks 318 taste 11 talus slide 261 tear fault 134 tenacity 10 ten per cent fines value 305 tension 130–2
absolute 131 relative 131
tension fracture 130 tension gash 130 terminal curvature 96 terminal drag 96, 134 terminal moraine 92 terrace 81, 3.7 terrigenous sedimentary rocks 45 tetrad 6 textures 5, 32–6, 47–54, 227
igneous rocks 31–7, 227 sedimentary rocks 46–55, 227
thermal aureole 44, 58 , 2.37 thermal metamorphism 44, 58 , 2.37 theoretical value of gravity 218 through valley 89 throw of fault 133–4 thrust fault 134
Index 331
www.angoothachaap.blogspot.com
www.angoothachaap.blogspot.com
till 65, 92 , 95, 227 timescale (geological) Table 4.2 topaz 45 Torridonian Sandstone 155–6, 158 tourmaline 45 toxic waste 153 toxic waste disposal 183–5 trachyte 38 transform fault 148 transgressive sill 41 translational failure 261, 263–6 transparency 10 transported deposits 65, 76–87 tranverse fractures 148 transverse waves 202 travertine 57 trenches 146–8 trenching 219–24 triad 6 Triassic Table 6 true dip 117 true velocity 207 truncated spur 89 tufa 56 tuff 39 , 51, 228 tunnelling 276–82 turbidites 51 , 157 turbidity currents 51 twinning 6
ultrabasic igneous rock 31 , 32, 37, Tables 2.12, 2.13 unconfined compressive strength 237–9, 238, 266, Tables 7.4, 8.1 unconformity 142–3 uniaxial compressive strength 237–9 Unified Classification System (UCS) 49 uniformitarianism 142 unsaturated zone 167 unstable isotope 115 , 116, Table 4.3 upthrown side (of fault) 134 U-shaped valley 89
vadose water 166 valley bulges 96 , 260 valley glacier 88 valley spring 174 varve 94 varved clay 94
Index 332
www.angoothachaap.blogspot.com
www.angoothachaap.blogspot.com
vegetation 69 veins, mineral 45 velocity log 209 vermiculite 24,26 vertical geological section 104 vesicles 33 , 40 vesicular texture 33 void ratio 162 voids 162 , 233
primary 162 secondary 162
volcanic cone 39 volcanic plug 39 volcanic vent 39 volcano 39
central vent type 38
wall (of fault) 133 water absorption test 232 , 310 water content of soil 162 , 260 water table 166 , 172
perched 172 water table well 172, 181
intake area 172 water yielding capacity 236 wave-cut platform 81–3 wave front 202 way-up criterion 53, 107 weathering 23–6, 65–9, 69, 71, 261
climate 70 processes 25, 65–8, 71
welded tuffs 39 well graded soil 48 well points, lines of 169 wells 166–7, 169, 180–1 Wenner Arrangement 213 whinstone 230 wrench fault 134
xenolith 43
zonal soils 73 , 76 , Table 3.4 zone of aeration 167 zone of saturation 167 zoning (of feldspars) 18
Index 333
www.angoothachaap.blogspot.com
www.angoothachaap.blogspot.com

www.angoothachaap.blogspot.com
www.angoothachaap.blogspot.com