Guinevere Nell - Spontaneous Order and the Collective Individual

GEOLOGY AND TECTONICS OF BETA REGIO,
GUINEVERE PLANITIA, SEDNA PLANITIA, AND
WESTERN EISTLA REGIO, VENUS:
RESULTS FROM ARECIBO IMAGE DATA
D. A. SENSKE’, D. B. CAMPBELL*, E. R. STOFAN3, P. C. FISHERi, J. W. HEADi, N. STACY2, J. C. AUBELEi, A. A. HINE4 and J. K. HARMON4
‘Department of Geological Sciences, Brown University, Providence, RI, U.S.A. ‘National Astronomy and Ionosphere Center, Cornell University Ithaca, NY, U.S.A. 3Jet Propulsion Laboratory, Pasadena, CA, U.S.A.
‘National Astronomy and Ionosphere Center, Arecibo Observatory, Arecibo, Puerto Rico, U.S.A.
(Received 14 June, 1991)
Abstract. New radar images (resolution 1.5-2.0 km) obtained from the Arecibo Observatory are used to assess the geology of a portion of the equatorial region of Venus (1” S to 45” N and from 270” eastward to 30”). Nine geologic units are mapped on the basis of their radar characteristics and their distribution and correspondences with topography are examined. Plains are the most abundant unit, make up 80% of the area imaged, and are divided into bright, dark, and mottled. Mottled plains contain abundant lava flows and domes suggesting that volcanism forming plains is a significant process in the equatorial region of Venus. Tesserae are found primarily on Beta Regio and its eastern flank and are interpreted to be locally stratigraphically older units, predating episodes of faulting and plains formation. Isolated regions of tesserae concentrated to the north of Western Eistla Regio are interpre- ted to predate the formation of plains in this area. The volcanoes Sif Mans, Gula Mans, Sappho, Theia Mans, and Rhea Mans, are found exclusively in highland regions and their deposits are interpreted as contributing only a small percentage to the overall volume of the regional topography. The northern 15” of the image data overlap with Venera 15/16 images making it possible to examine the characteristics of geologic units mapped under various illumination directions and incidence angles. Surface panoramas and geochemical data obtained from Venera landers provide ground truth for map units, evidence that plains are made up of basaltic lava flows, and that linear deformation zones contain abundant blocks and cobbles. On the basis of spatial and temporal relationships between geologic units, the highlands of Beta Regio and Western Eistla Regio are interpreted to have formed in association with areas of mantle upwelling which uplift plains, cause rifting, and in the case of Beta Regio, disrupt a large region of tessera. Zones of linear belt deformation in Beta Regio and Western Eistla Regio are interpreted to be extensional and indicate that at least limited extension has occurred in both regions. The images reveal for the first time that southern Devana Chasma is a region of overlapping rift valleys separated by a distance of 600 km. Linear deformation zones in Guinevere Planitia, separating Beta Regio and Eistla Regio, converge at a region of ovoids forming a discontinuous zone of disruption and completes an equatorial encompassing network of highlands and tectonic features. The similarity between ovoids and coronae suggests a mechanism of formation associated with hotspots or mantle plumes. Analysis of the distribution and density of impact craters suggests a surface age for this part of the planet similar to or slightly less than that determined for the northern high latitudes from Venera 15/16 data (0.3 to 1.5 by) and comparable to that calculated for the southern hemisphere.
Introduction
The broad geologic and morphologic characteristics of the Venus equatorial region were first assessed by Masursky et al. (1980) who showed this part of the planet
Earth, Moon, and Planets 5.5: 163-214, 1991. 0 1991 Kluwer Academic Publishers. Printed in the Netherlands.

164 D. A. SENSKE ETAL.
to be characterized by regions of lowland plains separating large highlands. Ad- ditional studies by Schaber (1982) identified zones of tectonic disruption while more recently, Senske (1990) and Arvidson et al. (1990) analyzed the broad regional characteristics of the equatorial region using Pioneer Venus (PV) and Goldstone radar data. On the basis of the mapping of the radar characteristics of different landforms from PV radar images, Senske (1990) identified seven physiographic subdivisions in the equatorial region. Radar images acquired from the Arecibo Observatory of a portion of the Venus equatorial region have allowed us to carry out a detailed geologic analysis of a number of these units. In this paper, we (1) produce geologic and tectonic maps of a section of the equatorial region extending from 1” S to 45” N and from 270” eastward to 30” (Figure l), (2) use these maps to examine the geologic characteristics and propose models for the origin of the highlands of Beta Regio and Western Eistla Regio, (3) assess the geology of the lowlands of Guinevere Planitia and Sedna Planitia, and (4) examine the characteristics, density, and distribution of impact craters in the equatorial region and discuss their implication for the surface age for this part of the planet. The results from this analysis will provide a regional geologic context from which higher resolution MAGELLAN data (Saunders et al., 1990) can be interpreted.
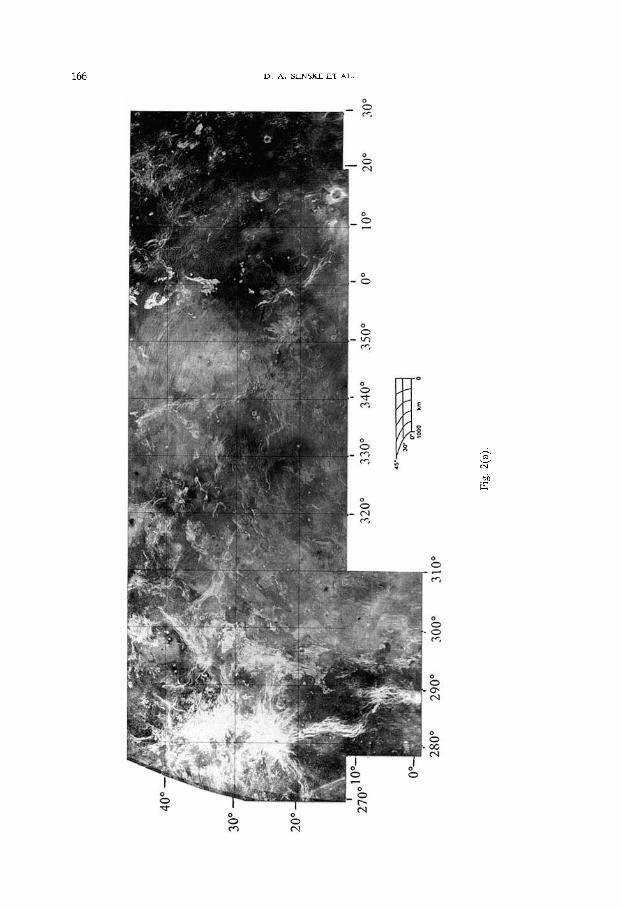
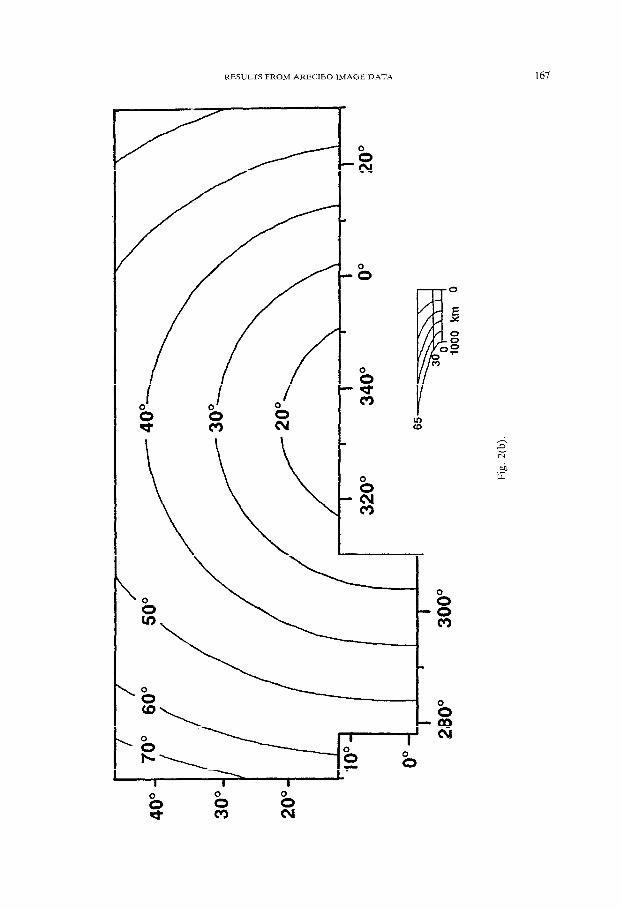
Arecibo Radar System. Radar imaging of the equatorial region of Venus was carried out during the inferior conjunction of 1988 using the 12.6 cm radar of the Arecibo Observatory (Campbell et al., 1989). These images, obtained at a reso- lution of 1.5-2.0 km, cover an estimated 9% (43 x lo6 km2) of the planet’s surface (Figures 1 and 2a) (Campbell et al., 1989). These data were collected using a circularly polarized transmitted signal with both senses of received circular polarization recorded. Analyses presented here are based on image data produced from the opposite sense received polarization (i.e. from a single reflection). In order to increase the ratio of signal to noise twenty-five individual ‘looks’, estimates of radar backscatter, were averaged from data collected over a three day period. The northern 15” degrees of image data overlaps with Venera 15/16 coverage (Barsukov et al., 1986), allowing a comparison to be made between features imaged by both radar systems. Unlike radar images obtained from Venera 15116, which were acquired at a near constant incidence angle near lo”, the incidence angle for the Arecibo image ranges from approximately 12” near the sub-radar point, to 70” at the edges of the image (Figure 2b). For incidence angles between 12” and 25”, the returned backscatter cross section (quasi-specular) is strongly dependent on incidence angle and is sensitive to changes in topographic slope; variations in brightness are thus primarily related to changes in surface topography. For incidence angles greater than 25” the backscatter cross-section is not so depen- dent on incidence angle and the returned backscatter is more likely to be modu- lated by wavelength-scale irregularities on the surface and in the subsurface (dif- fuse scattering). Variations in bright and dark within the image are therefore indicators of wavelength-scale surface roughness. The look direction for the image

165
166 D. A. SENSKE ETAL.
RESULTS FROM ARECIBO IMAGE DATA
168 D. A. SENSKEETAL.
RESULTS FROM ARECIBO 1MAGE DATA 169

280”
29
0”
300”
31
0°
H’
Rid
ge
belt-
like
zone
s
a Br
oad
linea
r ar
ches
a in
terb
raid
ed
iinea
men
ts
Dim
N
arro
w-s
pace
d pa
ralle
l iin
eam
ents
El
Para
llel
paire
d iin
eam
ents
Fig.
2(
e).

3”
Fig.
2(
f).
Fig.
2.
(a
) Ar
ecib
o ra
dar
imag
e of
th
e Ve
nus
equa
toria
l re
gion
. Th
e da
ta c
over
a
regi
on
exte
ndin
g ov
er
long
itude
s 27
0” t
o 30
” an
d la
titud
es
1” S
to
45”
N.
The
north
ern
15”
of t
he i
mag
e ov
erla
ps
with
Ve
nera
15
/16
imag
e co
vera
ge
of c
ompa
rabl
e re
solu
tion.
(b
) M
ap
show
ing
the
varia
tion
of i
ncid
ence
an
gle
acro
ss
the
Arec
ibo
rada
r im
age.
Th
e ra
dar
look
di
rect
ion
is p
erpe
ndic
ular
to
rin
gs o
f co
nsta
nt
inci
denc
e an
gle.
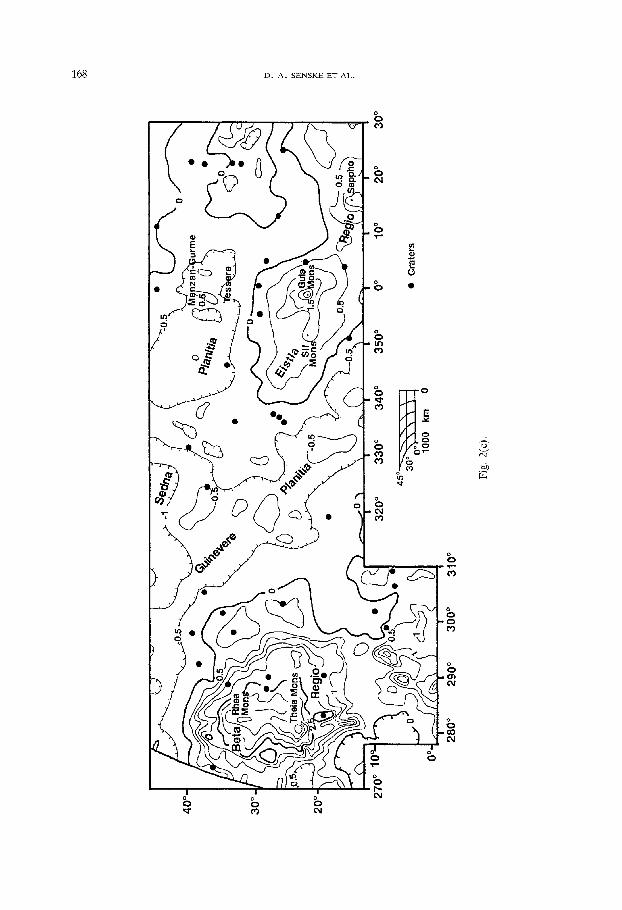
(c
) Pi
onee
r Ve
nus
topo
grap
hy
for
the
regi
on
cove
red
by t
he A
reci
bo
imag
e.
The
blac
k do
ts i
ndic
ate
the
loca
tion
of c
rate
rs
inte
rpre
ted
to b
e of
im
pact
or
igin
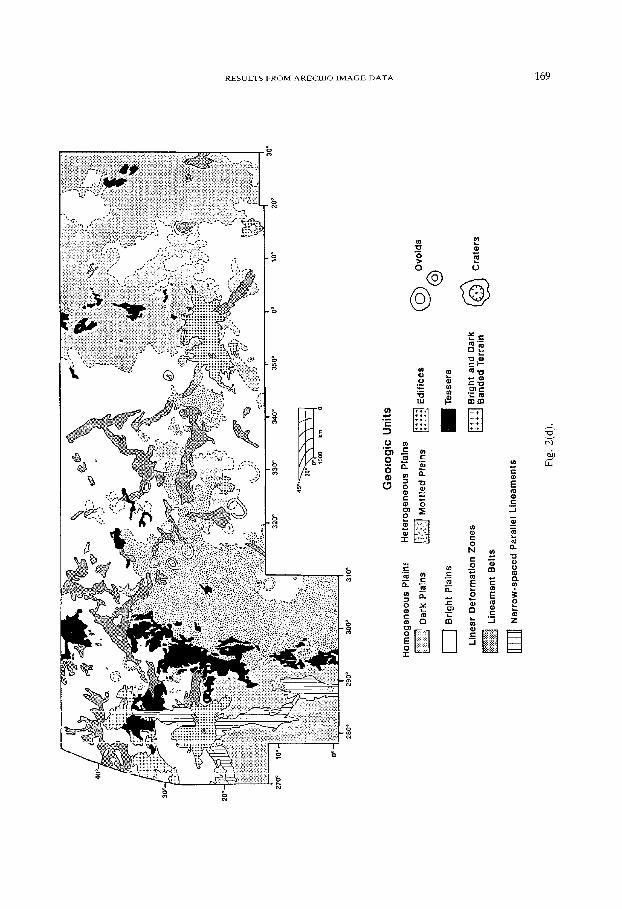
. (d
) G
eolo
gic
units
m
appe
d in
the
Ven
us
equa
toria
l re
gion
. D
ashe
d lin
es i
ndic
ate
whe
re
the
boun
dary
be
twee
n un
its
is g
rada
tiona
l. D
escr
iptio
ns
of t
he v
ario
us
units
ar
e pr
esen
ted
in T
able
I.
Uni
ts
map
ped
as
tess
era
are
foun
d pr
edom
inan
tly
in t
he v
icin
ity
of B
eta
Reg
io.
Line
amen
t be
lts f
orm
a
disc
ontin
uous
zo
ne o
f di
srup
tion
exte
ndin
g di
agon
ally
be
twee
n W
este
rn
Eist
la
Reg
io
and
the
north
ern
part
of B
eta
Reg
io.
(e)
Map
sh
owin
g di
ffere
nt
clas
ses
of l
inea
r de
form
atio
n zo
nes.
(f)
M
ap
show
ing
the
dist
ribut
ion
of s
truct
ural
el
emen
ts
in t
he V
enus
eq
uato
rial
regi
on.
Line
amen
ts
loca
ted
in B
eta
Reg
io
at D
evan
a C
hasm
a an
d at
Gul
a M
ons
in W
este
rn
Eist
la
Reg
io
are
inte
rpre
ted
to
be
faul
t sc
arps
w
hile
th
e or
igin
of
ot
her
linea
men
ts
is l
ess
clea
r. If
the
linea
men
ts
are
exte
nsio
nal,
then
th
ey
are
poss
ibly
fa
ult
scar
ps,
and
if th
ey
are
com
pres
sion
al,
then
th
ey
may
rep
rese
nt
antic
linal
st
ruct
ures
. Th
e lo
catio
n of
Ven
era
land
ers
9 an
d 10
are
ind
icat
ed
by t
he c
ross
es.
172 D. A. SENSKE ET AL.
is perpendicular to rings of constant incidence angle shown in Figure 2b. For the image of the equatorial region, the look direction is approximately to the northwest for the area to the west of the sub-radar point, while for the region to the east of the sub-radar point, the look direction is to the northeast. Since both the look angle and incidence angle varies across the image, the Arecibo data is complementary to both Venera 15/16, look direction from east to west, and MAGELLAN data collected during its nominal mission which has a west to east look direction (Saunders et al., 1990).
Regional Geographic Setting. The topographic characteristics of the Venus equatorial region as revealed by the Pioneer Venus altimetry data (Masursky et al. 1980; Pettengill et al., 1980) show this part of the planet to be made up of highlands extending for nearly 360” of longitude (Figure 1). Analyses of radar image, topography, and gravity data suggest that convective processes such as mantle plumes (Esposito et al., 1982; Morgan and Phillips, 1983; Phillips and Malin, 1983) or seafloor spreading type processes (Head and Crumpler, 1987) may be responsible for the formation of some of these regions. The Arecibo image data provide high resolution coverage of two of these highlands, Beta Regio and Western Eistla Regio along with the first detailed coverage of the lowlands of Guinevere Planitia, separating Beta Regio and Western Eistla Regio by approxi- mately 6500 km. These lowlands represent the only major break in a nearly con- tinuous system of equatorial highlands and tectonic zones (Figure 1 and 2~). In this analysis, we discuss the regional geologic character of the section of the equatorial region imaged by Arecibo, and examine the geologic characteristics of, Beta Regio, Western Eistla Regio, Devana Chasma and its extension south into Phoebe Regio, and the lowlands of Guinevere Planitia and Sedna Planitia.
Geology of the Beta-Guinevere-Eistla Region
Analyses of low resolution radar imaging (Pioneer Venus, Goldstone) have been used to describe the geology of the Venus equatorial region (Masursky et al., 1980; Schaber, 1982; Arvidson et al., 1990; Senske, 1990). Using Pioneer Venus radar data, Senske (1990) identified six physiographic provinces within the region imaged by Arecibo which are identified as tectonic junctions, upland plateaus, upland rises, inter-highland tectonic zones, plains, and dark halo plains. In order to better understand the geology of these provinces, the Arecibo imagery is used to map their detailed geology characteristics; providing the first high resolution synoptic view of this portion of the equatorial region. In this section, we examine the characteristics, abundances, and distribution of the equatorial map units and a comparison is made with similar units mapped in the southern latitudes and units in the northern high latitudes mapped from Venera 15/16 data (Senske et al., 1991a; Barsukov et al., 1986; Sukhanov et al., 1989).

RESULTS FROM ARECIBO IMAGE DATA 173
GEOLOGIC MAPPING: UNIT DESCRIPTION AND CHARACTERIZATION
Regional geologic mapping of the surface of Venus has been previously carried out using radar image data obtained under a wide range of viewing geometries and incidence angles (Sukhanov et al., 1989; Senske et al., 1991a) revealing the presence of a variety of volcanic and tectonic features. Geologic mapping of the Venus equatorial region from Arecibo images allows mapping of the northern high latitudes carried out from Venera 15/16 images (Sukhanov et al., 1989) to be extended southward into the low equatorial latitudes; providing a basis for compar- ing unit characteristics and distributions for different parts of the planet.
The analysis of Arecibo image data must take into account two principal factors: (1) variations in the look direction and incidence angle as a function of distance from the sub-radar point and (2) residual northern/southern hemisphere ambigui- ties resulting from the method by which the data were collected. In order to locate and correct for ambiguities analysis of additional image data, Arecibo and Pioneer Venus, with different viewing geometries were incorporated into this study. Nine geologic units have been mapped in the Venus equatorial region on the basis of their degree of homogeneity of radar backscatter, patterns in backscatter, and by subdividing groups of tectonic features (Figure 2d). The characteristics of the different units are summarized in Table I. In order to better understand the surface scattering behavior of the various map units, a quantitative assessment of this property has been carried out by Ford and Senske (1990) using Pioneer Venus data. This study found the units to fall into three distinct groupings: (1) dark plains, areas whose backscatter is less than the planetary average, (2) tessera, narrow-spaced parallel lineaments, bright and dark banded terrain, areas above the planetary average and (3) bright plains, mottled plains, ovoids, lineament belts, and edifices, areas whose scattering characteristics are typical of the plane- tary average.
The most abundant unit mapped in the equatorial region, plains, are areas of relatively low uniform topography, at or near the mean planetary radius (mpr = 6051.0 km), range from bright to dark (regions of relatively high radar backscatter cross section and areas of low backscatter), and are divided into two classes: (1) those having a uniform texture, homogeneous plains, made up of dark plains and bright plains, and (2) those in which the texture of the surface varies locally on scales of 10s to 100s of km, heterogeneous plains, and mapped as mottled plains. Dark plains, smooth at radar wavelengths, are located in the eastern part of Sedna Planitia and to the south of Beta Regio (Figure 2d), and on the basis of embayment relations with adjacent units are interpreted to be volcanic in origin. A number of isolated patches of dark plains in Guinevere Planitia (20” N to 30” N and 318” to 340”) are typically associated with impact craters, lying within areas identified previously as dark halo plains (Senske, 1990). The correspondence between the dark plains and craters suggests that some of the smoothness of the surface in these areas may be associated with the impact process. The most laterally extensive region of dark plains is located in the eastern part of Sedna Planitia, forms a distinct boundary with bright plains near 350”, and extends to the eastern edge of
174 D. A. SENSKE ET AL.
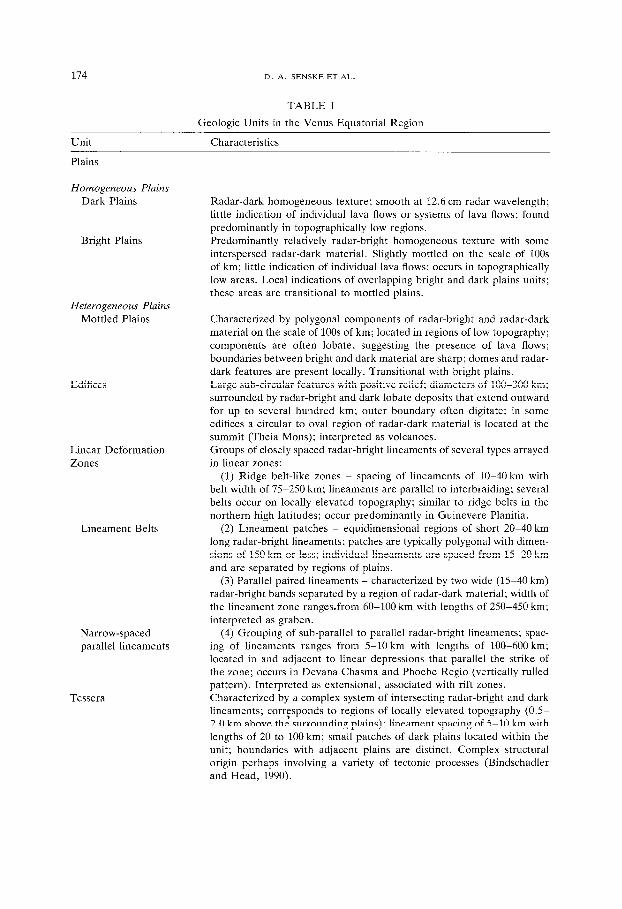
TABLE I
Unit
Geologic Units in the Venus Equatorial Region
Characteristics
Plains
Homogeneous Plains Dark Plains
Bright Plains
Heterogeneous Plains Mottled Plains
Edifices
Linear Deformation Zones
Lineament Belts
Narrow-spaced parallel lineaments
Tessera
Radar-dark homogeneous texture; smooth at 12.6 cm radar wavelength; little indication of individual lava flows or systems of lava flows; found predominantly in topographically low regions. Predominantly relatively radar-bright homogeneous texture with some interspersed radar-dark material. Slightly mottled on the scale of 100s of km; little indication of individual lava flows: occurs in topographically low areas. Local indications of overlapping bright and dark plains units; these areas are transitional to mottled plains.
Characterized by polygonal components of radar-bright and radar-dark material on the scale of 100s of km; located in regions of low topography; components are often lobate, suggesting the presence of lava flows; boundaries between bright and dark material are sharp; domes and radar- dark features are present locally. Transitional with bright plains. Large sub-circular features with positive relief: diameters of 100-300 km; surrounded by radar-bright and dark lobate deposits that extend outward for up to several hundred km: outer boundary often digitate; in some edifices a circular to oval region of radar-dark material is located at the summit (Theia Mons); interpreted as volcanoes. Groups of closely spaced radar-bright lineaments of several types arrayed in linear zones:
(1) Ridge belt-like zones - spacing of lineaments of lo-40 km with belt width of 75-250 km; lineaments are parallel to interbraiding; several belts occur on locally elevated topography; similar to ridge belts in the northern high latitudes; occur predominantly in Guinevere Planitia.
(2) Lineament patches - equidimensional regions of short 20-40 km long radar-bright lineaments; patches are typically polygonal with dimen- sions of 150 km or less; individual lineaments are spaced from 15520 km and are separated by regions of plains.
(3) Parallel paired lineaments - characterized by two wide (15-40 km) radar-bright bands separated by a region of radar-dark material; width of the lineament zone ranges.from 60-100 km with lengths of 250-450 km; interpreted as graben.
(4) Grouping of sub-parallel to parallel radar-bright lineaments; spac- ing of lineaments ranges from 5-10 km with lengths of 100-600 km; located in and adjacent to linear depressions that parallel the strike of the zone; occurs in Devana Chasma and Phoebe Regio (vertically rulled pattern). Interpreted as extensional, associated with rift zones. Characterized by a complex system of intersecting radar-bright and dark lineaments; corr$sponds to regions of locally elevated topography (0.5- 2.0 km above the surrounding plains); lineament spacing of 5-10 km with lengths of 20 to 100 km; small patches of dark plains located within the unit; boundaries with adjacent plains are distinct. Complex structural origin perhaps involving a variety of tectonic processes (Bindschadler and Head, 1990).

RESULTS FROM ARECIBO IMAGE DATA 175
TABLE I (Continued).
Unit Characteristics
Bright and Dark Banded Terrain
Circular Features Ovoids
Structures Craters
Characterized by wide radar-dark lineaments, widths of 10 km and lengths of 150-200 km, and radar-bright bands, widths of 15-20 km; found exclusively on Beta Regio adjacent to tessera. Quasi-circular to oval features with diameters typically greater than 100 km; characterized by one or commonly two narrrow radar-bright rings; bounding ring is often elevated and ranges in width from 15- 20 km; interior of the features contains plains and occasionally domes; ovoids are frequently associated with lineament zones; large features appear to be coronae; interpreted primarily as locations of mantle upwel- ling; ‘hot spots’. Circular features with distinct radar-bright rims; some have central peaks while others have interior rings; typically surrounded by a radar-bright annulus extending from 1 to 4 crater radii from the rim; exterior deposits are sometimes asymmetrical; locally some craters are found within dark- halo deposits. Interpreted to be craters of impact origin.
data coverage. On the basis of analysis of PV radar data this unit is interpreted to continue further to the east to approximately 150” (Senske, 1990; Ford and Senske, 1990), covering a major part of the equatorial region. Individual lava flows are typically unresolved in this unit suggesting that the volcanic deposits may be primarily emplaced by the large-scale outpouring of lavas. Bright plains are the most abundant of the plains units (34% of the area imaged) and are found on Beta Regio, the flanks of Western Eistla Regio, and in parts of Sedna and Guinev- ere Planitiae. Like the dark plains individual lava flows are not observed, suggest- ing similar mechanisms of emplacement for deposits making up these two units. Navka Planitia and the southern part of Guinevere Planitia (1” S to 35” N, 295” to 330”), mapped as mottled plains, contain abundant lava flows and domes (Campbell et al., 1989). Unlike the other plains units, it is possible to identify a number of source areas for deposits responsible for its mottled texture. Although this unit lies primarily in regions imaged at low incidence angles, less than 30”, examination of its characteristics from higher incidence angle PV image data indicates that it is distinct (Senske, 1990). Mapping of plains in the southern hemisphere indicates that the lateral extent of this unit is greater than observed here, and that it extends as far south as 40” S (Senske et al., 1991a).
Narrow, 50-200 km wide, linear zones of deformation made up of subparallel to interbraiding radar-bright lineaments forming belts are mapped as linear defor- mation zones (Figure 2d, e, f). Due to variations in incidence angle across the image, it is not always possible to determine if the lineaments are ridges, troughs, or scarps, making it difficult to establish their tectonic setting. The Arecibo data reveal for the first time that the major break in the equatorial highlands between Beta Regio and Western Eistla Regio is connected through the lowlands of Guinev- ere Planitia by a discontinuous zone of disruption made up of segments of linea- ment belts. On the basis of characteristic lengths and lineament patterns, we have identified a number of subclasses of lineament belts (Figure 2e). Collections of

176 D. A. SENSKE ET A!-.
lineaments classified as lineament belt patches are equidimensional regions made up of 20-40 km long radar-bright lineaments separated by 15-20 km wide regions of plains. They are typically isolated within and extensively embayed by plains and where they fall along linear trends may represent the surface expression of older preexisting structures that have been buried by volcanism (i.e patches northwest of Breksta Dorsa and west of Zorile Dorsa (Figure 2e)). Groups of lineaments mapped as ridge belt-like zones are typically concentrated in Guinevere Planitia between Zorile Dorsa and Breksta Dorsa. In contrast to similar features in Lavinia Planitia and ridge belts in Atalanta Planitia, these structures are not arrayed in a fan shaped pattern and their relation with local topography is not always clear. In some locations these lineaments form parallel patterns, are sepa- rated by plains, and are suggested to have formed by extension. Two belts are found to be locally elevated. Pioneer Venus altimetry data indicates that Zorile Dorsa is topographically distinct, rises to a maximum elevation of 600 m, and forms a well defined boundary with the adjacent plains to the east. A combined analysis of Arecibo and Venera 15/16 image data shows that the northern part of Zorile Dorsa is a single broad linear arch, resembling features mapped elsewhere interpreted to be compressional in origin (Frank and Head, 1990). Further to the south the morphologic character of this deformation zone is more similar to features mapped as ridge belt-like, made up of numerous bright lineaments. On the basis of its elevated topography and its broad arch-like morphology, Zorile Dorsa is interpreted to be compressional in origin. Like Zorile Dorsa, Breksta Dorsa, mapped as a region of interbraided lineaments, is locally elevated and rises to an elevation in excess of 400 m above the surrounding plains. On this basis and the presence of an interbraided network of lineaments, we suggest that this belt of deformation may also be compressional in origin. Groups of parallel paired lineaments are founded primarily near 40” N, 320” and are associated with a broad rise (1000 x 800 km) on which are located a large abundance of domes (Sukhanov et al., 1989). These zones of deformation are similar to lineament belts intersecting Hathor Mons in the southern hemisphere and are interpreted as extensional. Devana Chasma located in Beta Regio and its extensions to the south and south- west, mapped as narrow-spaced parallel lineaments, is made up of structures previously interpreted to be normal faults (Campbell et al., 1984; Stofan et al., 1989) associated with a 80-200 km wide zone of extension.
Large edifices, basal diameters between 100-300 km, interpreted as volcanoes associated with large-scale effusive volcanism, are all found within highland regions and include: Theia Mons, Rhea Mons, Sif Mons, Gula Mons, and Sappho. Theia Mons in Beta Regio is located at the convergence of rifts (Devana Chasma) (23.5” N, 275.3”) with deposits forming a butterfly shaped pattern extending radi- ally from the summit for distances of 550-700 km (Campbell et al., 1989; Senske et al., 1991b). This peak rises to an elevation of 6056.4 km and has a basal diameter of approximately 275 km. Radar-bright lineaments (fault scarps) cut across the summit of the peak providing evidence that this mountain is being split apart by

rifting (Campbell et al., 1989; Senske et al., 1991b). The summit contains a radar- dark oval structure interpreted to be a caldera. Rhea Mom located 1000 km to the north of Theia on the western edge of Devana Chasma (32.2” N, 272.8”) rises to an elevation of 6055.8 km and has a basal diameter of approximately 100 km. Deposits associated with Rhea extend for distances of 50-100 km from the summit of the peak and terminate against a region mapped as tessera. Further to the east, edifices in Eistla Regio include Sif and Gula Montes and Sappho. Sif Mons is located in the westernmost part of Western Eistla Regio (21.5”N, 352”) and rises to an elevation of 6053.2 km with a basal diameter of approximately 250 km. Lava flows that are typically radar-bright extend down slope for distances of hundreds of kilometers with a number of flows showing evidence of topographic control (Campbell et al., 1989). An oval structure located near the summit of the mountain is interpreted to be a caldera. Gula Mons (22.3” N, 359”), 750 km to the east of Sif Mans, rises to an elevation of 6055.2 km and has a basal diameter of approximately 300 km. Lava flows associated with this peak are typically radar-dark. The summit contains a 150 km long radar-bright deposit oriented in a southwest to northeast direction and has been identified as a region of high reflectivity (Campbell and Campbell, 1990). The summit is cut in a northwest/southeast direction by a series of radar-bright lineaments suggesting faulting and the presence of a rift zone cutting across the top of the edifice. Located on the southeastern flank of Gula is a lineament zone, Guor Linea, that extends toward Central Eistla Regio and Sappho. Sappho, located in the highlands of Central Eistla Regio (14” N, 15.5”) rises to an elevation of 6053.2 km and has a basal diameter of 150 km. Radar- bright flows are arrayed radially from the summit for distances of 50-100 km. Unlike the other edifices, the summit of the mountain contains a radar-dark lOO- 150 km diameter circular region which is interpreted to be a caldera and is one of the largest associated with large edifices.
Areas made up of complex systems of interconnecting ridges and valleys with at least two orientations of deformation, high values of RMS slope and low reflectivity as detected from the PV radar, and are highly diffusely scattering are mapped as tesserae. This unit contains characteristics of all the subtypes of tessera mapped from Venera 15/16 data (Bindschadler and Head, 1991) and is found primarily in two areas: (1) along the eastern flank of Beta Regio beginning at the northern edge of image coverage and extending to the south parallel to Devana Chasma, intersecting Phoebe Regio and (2) to the north of Gula Mans, corre- sponding to a region of tessera mapped from Venera 15/16 image data, Manzan- Gurme Tessera (Barsukov et al., 1986, Sukhanov et al., 1989). All occurrences of tessera in the equatorial region appear to be embayed by dark plains suggesting that they predate the most recent episodes of plains formation.
Located exclusively on Beta Regio is a unit identified as bright and dark banded terrain. This terrain is a boundary forming unit with a region of tessera which flanks Devana Chasma (Figure 2d). The banded structure is interpreted to be associated with a series of sub-parallel ridges or plateaus and valleys which in

178 D. A. SENSKE ET AL.
some places are filled by plains deposits. The boundary between this unit and adjacent regions of tessera is gradational and on the basis of this relation and the similarities in their radar scattering properties (Ford and Senske, 1990) the two units are suggested to be genetically linked.
Twelve ring to arcuate features made up of concentric 30-50-km wide radar- bright rings, mapped as avoids, are typically found in plains regions, are often locally elevated, and have diameters ranging from SO-240 km (Stofan et al., 1990a). Ovoids are similar to coronae mapped from Venera 15/16 images in their structure, morphology, and geologic associations (Pronin and Stofan, 1990), but due to the inability to clearly identify an annulus of concentric ridges have not been mapped as coronae. In a number of locations ovoids are found where lineament belts terminate or are concentrated at the point of convergence of lineament belts. For example, a collection of four ovoids is centered near 28” N, 315” at the intersection of lineament belts with three different orientations (Figure 2d). This grouping forms a relation similar to coronae in Mnemosyne Regio (Stofan and Head, 1990) and ovoids in Themis Regio (Stofan et al., 1990b; Senske et al., 1991a). Domes are often found adjacent to ovoids indicating a volcanic association. On the basis of their structural similarity to coronae and their association with volcanic features, ovoids are interpreted to form in areas of mantle upwelling or hotspots.
Craters with various structures and morphologies and interpreted to be impact in origin have been mapped (Figure 2c, d). Their distribution appears to be relatively uniform despite some apparent clustering on the highlands of Beta Regio and Western Eistla Regio and an apparent low concentration in the lowlands of Guinevere Planitia to the east of Beta Regio. This relation suggests that highlands in this part of the equatorial region may be retaining craters and thus preserving relatively older surfaces. However, due to the low number of identifiable craters on individual units, it is not appropriate to try to establish a stratigraphic chron- ology on the basis of the crater record.
Distribution of Units. The geologic units mapped in the Venus equatorial region like those in the southern hemisphere can be divided into those that are primarily volcanic and those that are tectonic (Senske et al., 1991a). Volcanic units which include dark plains, mottled plains, bright plains, ovoids, and edifices are found to make up 85% of the portion of the equatorial region imaged by Arecibo. The most abundant unit, plains (dark, mottled and bright plains), covers 80% of the area imaged, greater than the 71% of the northern high latitudes mapped from Venera 15/16 data (Barsukov et al., 1986; Sukhanov et al., 1989; Bindschadler and Head, 1989), and comparable to the 78% of the southern hemisphere imaged by Arecibo (Senske et al., 1991a), indicating that volcanism forming plains is a significant process in the equatorial region. Edifices, sites of local large-scale effusive activity, are found on 4% of the surface imaged by Arecibo, comparable to that for the southern hemisphere (3%). Ovoids are found to make up less than one percent (0.6%) of the surface imaged by Arecibo, similar to the 0.4% of the southern high latitudes and less than the 2.9% of the northern high latitudes.

RESULTS FROM ARECIBO IMAGE DATA 179
These are relatively minor features and due to their small abundance probably contribute only a small part to overall lithospheric heat transfer. However, their association with linear deformation zones indicates that they play a major role as junctions for regional zones of tectonism. The remaining 15% of the surface is made up of units that are interpreted to be tectonic in origin (tesserae, bright and dark banded terrain, linear deformations zones). Areas of tesserae make up 5% of the equatorial region (if the bright and dark banded terrain is also included, the percentage of tesserae is closer to 6%), greater than the 3% of the southern hemisphere and substantially less than the 14% of the northern high latitudes mapped from Venera 15/16. The distribution of tessera in the equatorial region is not uniform with the greatest abundance located at Beta Regio (Senske et al., 1991b) with additional occurrences found to the north of Western Eistla Regio. Like the southern hemisphere, it is suggested that the process forming tessera in this part of the equatorial region may be less significant than in the northern high latitudes. Linear deformation zones are found to make up 9% of the equatorial region, less than 12% of the southern hemisphere and slightly greater than the percentage of similar features identified in Venera 15/16 images (ridge belts and furrow belts (7.6%)). On the basis of geologic associations, correspondence with topography, and patterns of structures these zones are interpreted to be associated on a feature by feature basis to be sites of both compressional and extensional deformation.
Tectonic Elements. In addition to the geologic units, a map of structural features has been produced (Figure 2f). These linear features have been divided into three classes: (1) bright lineaments, (2) bright diffuse lineaments, and (3) dark lineaments. Radar-bright lineaments are the most abundant of the mapped struc- tural elements, form patterns ranging from sub-parallel to interbraiding, and are typically grouped together in belts (linear deformation zones). In most cases it is not possible to determine a specific tectonic setting for the structural elements (i.e. if they are fault scarps, folds, or troughs). The majority of lineament belts within the equatorial region are viewed at incidence angles greater than 20”, suggesting that they are characterized by a high degree of wavelength-scale rough- ness most likely due to the presence of blocks and cobbles, causing increased radar backscatter cross section. Dark lineaments are found mainly on Beta Regio and like similar features identified in the southern hemisphere (Senske et al., 1991a) are most likely depressions or fractures that have been filled with plains material. In several places the regional geologic setting can provide information as to the origin of the lineaments. For example, in areas where radar bright lineaments intersect ovoids (28” N, 315”), they are interpreted to be faults associ- ated with uplift and extension or are related to the emplacement of dikes while at Devana Chasma in Beta Regio, a region covered by multiple data sets (Venera 15/16, Arecibo, Pioneer Venus), they are interpreted to be fault scarps associated with rifting and normal faulting (Campbell et al., 1984; Stofan et al., 1989).
The distribution of tectonic elements is divided into two major regional trends:

180 D. A. SENSKE ET AL.
(1) a north-south trend in Beta Regio dominated by structures in Devana Chasma corresponding to a zone of faulting and rifting and (2) lineament belts in Guinevere Planitia which are arrayed in a two prong pattern radiating from the westernmost part of Eistla Regio. The first follows a N 20” W trend corresponding to Zorile Dorsa which terminates in the plains of Sedna and the second follows a N 70” W trend cutting across Guinevere Planitia from Western Eistla Regio to northern Beta Regio. This trend continues along a line to the southeast between Gula Mons and Sappho where it corresponds to Guor Linea. Additional smaller concentra- tions of lineaments within Sedna Planitia, to the east of Western Eistla Regio, fall along two trends: (1) N 20” W and generally parallel to the eastern edge of Western Eistla Regio and (2) N 80” W (between 35” N and 45” N and 5” to 30”) and corresponding to a region mapped from Venera 15/16 as arachnoids (Sukhanov et al., 1989). Within the cluster of arachnoids the lineaments may correspond to faulting or surface fracturing associated with dike emplacement.
Regional Analyses
On the basis of regional mapping of the portion of the Venus equatorial region imaged from Arecibo, we have identified four areas to analyze in detail; the highlands of Beta Regio and Western Eistla Regio, and the lowlands of Guinevere Planitia and Sedna Planitia. In this section, we examine the volcanic and tectonic characteristics of these regions, propose mechanisms for the origin of the two highlands, discuss different styles for the emplacement of lava deposits in Guinev- ere Planitia, and examine a part of Sedna Planitia in which the Arecibo data overlaps with Venera 15/16 images.
Beta Regio and Western Eistla Regio
Mechanisms proposed to explain the formation of highlands in the Venus equa- torial region include convective processes such as mantle upwelling which produces uplift of topography, lithospheric extension, rifting, and possible crustal spreading (Schaber et al., 1982; Campbell et al., 1984; Head and Crumpler, 1987; Senske, 1990). In comparison, mechanisms to explain the formation of highlands in the northern high latitudes (Ishtar Terra) are interpreted to be associated with crustal convergence forming erogenic belts and possible mantle downwelling (Crumpler et al., 1986; Vorder Bruegge et al., 1990; Head, 1990; Bindschadler et al., 1990). In order to understand better the processes forming highlands on Venus, we examine the geology of Beta Regio and Western Eistla Regio, propose models for their formation, compare their characteristics, and compare them to the north- ern high latitude highland of Ishtar Terra.
BETA REGIO
Beta Regio is located in the westernmost part of the image coverage (centered near 30” N, 282”) and has been imaged previously at low resolution by a variety

RESULTS FROM ARECIBO IMAGE DATA 181
of both earth-based (Arecibo and Goldstone) and spacecraft-based (Venera 15/16 and Pioneer Venus) radar systems. Analyses of these data have concentrated on the interaction between tectonism and volcanism in Devana Chasma (McGill et
al., 1981; Campbell et al., 1984; Stofan et al. 1989) and suggest that the high elevation and rifting is the result of uplift associated with either a mantle plume (Esposito et al., 1982) or a mantle plume and lithospheric extension (Stofan et al., 1989). The Arecibo image data provide the first high resolution coverage of the entire Beta highland (Campbell et al., 1984; Campbell et al., 1989) including the southern extension of Devana Chasma into Phoebe Regio. In order to determine its characteristics and better understand the relation between volcanism and tecton- ism at this part of the planet we, (1) examine the geology of Beta, (2) use surface landers to provide ground control for geologic units, (3) study rifting in the southern part of Devana Chasma, and (4) review a range of models for the formation and evolution of Beta.
Topographic and Geologic Characteristics. The upland of Beta Regio covers an area 2300 x 2000 km and rises to an elevation of 4.0 km above mean planetary radius (Figure 3). Two prominent volcanoes, Rhea Mons and Theia Mons are located on the crest of the highland and reach elevations of 5.0 km and 5.5 km respectively (Saunders and Malin, 1977; Campbell et al., 1984). Beta is bisected along its crest by a topographically distinct rift valley, Devana Chasma, which reaches a depth of 1.0 km (Campbell et al., 1984; Stofan et al., 1989). At Theia Mons the valley splits into two arms, one extending to the south toward Phoebe Regio and the other to the west toward Asteria Regio which characterizes it as a tectonic junction (Senske, 1990). A second topographic rise, forming an upland plateau, is located on the eastern flank of Beta and is mapped as a region of tessera (Senske et al., 1991b) (Figure 3).
Beta Regio contains four distinct geologic units: (1) plains, (2) linear deforma- tion zones, (3) tessera (including bright and dark banded terrain), and (4) edifices (Figure 2d). Plains possess radar characteristics ranging from bright to dark; those on the highest part of Beta are typically radar-bright having a homogeneous texture, while those on the southern part of the highland are radar-dark. Like plains in other parts of the equatorial region those on Beta embay surrounding units and are interpreted to be volcanic. The eastern margin of Beta forms a sharp contact with mottled plains which extend to the east into the lowlands of Guinevere Planitia. Linear zones of deformation are found on both the crest and flanks of Beta. The primary zone of disruption corresponds to Devana Chasma, a zone SO- 200 km wide made up of narrow-spaced parallel lineaments (Figure 2d) (lineament spacing of 5-60 km with lengths of 100-300 km), interpreted to be scarps associ- ated with normal faulting (Campbell et al., 1984). Additional lineament belts correspond: (1) to the westward extension of Breksta Dorsa which intersects the highland of Beta at a 45” angle, (2) a collection of lineaments flanking the northern boundary of Beta, and (3) a zone of lineaments 100-200 km wide located within topographic depressions on the eastern flank of Beta forming a pattern orthogonal to Devana and made up of lineaments 100-600 km in length and separated by

182 D. A. SENSKEETAL.
km 280” 290” 300” :
0
Vexg 200
1000 2000 3000 4000
Distance (km)
Fig. 3. Pioneer Venus topography of Beta Regio. Contour intervals are spaced every 500m and referenced to a planetary radius of 6051.0 km. Regions mapped as tessera are indicated by different degrees of shading. Units adjacent to Devana Chasma are similar to trough and ridge tessera (Bind- schadIer and Head, 1991) while units on the eastern flank, shaded area, show characteristics of disrupted terrain and parallel ridge tessera and form a plateau. The tessera is indicated by the diagonal pattern in the cross section. The arrows indicate the location of a valley separating the eastern unit of
tessera into northern and southern regions.

RESULTS FROM ARECIBO lMAGE DATA 183
distances of 20-50 km. Units mapped as tessera are found along the eastern margin of Beta and along its crest, adjacent to Devana Chasma (Figure 3). The northernmost region of tessera, Lachesis Tessera (Barsukov et al., 1986; Sukhanov et al., 1989)) is made up of structural elements with a N 35” E orientation, parallel to Breksta Dorsa, is extensively embayed by surrounding plains material suggesting that it predates plains formation, and unlike other regions of tessera is not topo- graphically distinct at the resolution of the PV altimeter. The largest area of tessera corresponds to the east flanking upland plateau, is divided into northern and southern blocks by a 500 km deep valley (Figure 3), and contains structural elements oriented primarily in a north-south direction, parallel to Devana Chasma. The contact between the tessera and surrounding plains along with plains in the valley separating the northern and southern regions of tessera form embayment relations suggesting that the tessera predates plains flooding (Senske et al., 1991b). A number of lineaments from the east-west trending lineament belt located at 25” N, 290” (Figure 2d) extend into the region of tessera forming a cross-cutting relation suggesting that some of the lineaments are faults. On the basis of cross- cutting and embayment relations the east flanking tessera is interpreted to predate episodes of plains flooding and faulting (Senske, et al., 1991a). The third region of tessera flanks Devana Chasma in the vicinity of Rhea Mons and is morpho- logically similar to trough and ridge tessera (Bindschadler and Head, 1991) (Figure
3). Geologic Characteristics of Theia and Rhea Montes. The relationship between
volcanism and tectonism at this part of Venus can be assessed by examining the volcanoes Theia and Rhea Montes and their relationships to Devana Chasma. The detailed geologic characteristics of these edifices show them to be very different from each other. Theia Mons (Figure 4) is a large 275 km diameter shield structure with slopes between 0.5” and 0.7”. The deposits making up Theia are divided into three distinct zones: (1) radar-dark summit deposits, interpreted as smooth lava flows within a caldera; (2) Very bright annular deposits surrounding the summit which extend radially in all directions for distances of up to 150 km (Campbell et al., 1989); and (3) Bright deposits located on the distal flanks and arrayed to the northwest and southeast for maximum distances of 550-700 km from the summit. The dark deposits at the summit form an oval shaped region 100 X 40 km, elon- gated in a N 20” E direction and located within a zone of radar-bright lineaments interpreted to be scarps, indicating that extension and faulting has occurred (Campbell et al., 1989; Senske et al., 1991b). The lack of large-scale (100s of km) lateral displacement of the volcano along Devana suggests that extension along this part of the rift is limited. The western edge of the dark summit deposits corresponds to the westernmost limit of faulting and the elliptical shape of this area may be related to the formation of a caldera in a zone of NW/SE oriented extension. Just to the east and intersecting the darkest deposits is a second oval structure 50 x 30 km, interpreted to be a second caldera, indicating that multiple episodes of collapse have occurred. The very-bright annular deposits surrounding

184 D. A. SENSKE ET AL.
Fig. 4. Radar image and sketch map of units mapped on Theia Mom. The radar-dark region at the summit is interpreted to be a caldera. Its elongation in a northeast direction suggests that its shape is controlled by faulting. A radar-bright annulus of deposits surrounding the summit is indicated by the dotted pattern. Radar-bright lineaments are indicated by the solid lines while bright diffuse lineaments
are indicated by the dotted lines.

RESULTS FROM ARECIBO IMAGE DATA 185
the summit caldera correspond to the central part of the edifice but no individual flows are resolved. The presence of areas of high reflectivity in this region (Head et al., 1985) suggests that some of the brightness is due to high dielectric material. These deposits, interpreted as systems of primarily rough lava flows, appear super- posed on an extensive system of bright lobate flows. In contrast to Theia, Rhea Mons is only locally distinct as a volcanic structure (Figure 5). Rhea lies on the west flank of Devana Chasma and is abruptly truncated along its eastern edge by a major scarp. Located at its summit is a 50 x 20 km radar-dark region which is interpreted to be a caldera. Several bright lineaments cut into this region indicating that deformation has occurred subsequent to its formation. Like Theia, it is not possible to identify individual lava flows on the flanks of Rhea, but it does possess an annulus of very bright deposits extending from 50-100 km from the summit region. Units adjacent to Rhea are mapped as tessera, deformed in multiple directions, indicating that Rhea and the surrounding region have been extremely modified by tectonism. These observations indicate that the abundance and lateral extent of deposits associated with Rhea are less than previously suggested (Senske et al., 1991b). At the point where Devana Chasma intersects Rhea and the tessera, it narrows sharply from a width of 200 km to SO-100 km and scarp spacing de- creases from lo-60 km to a relatively uniform spacing of lo-15 km, similar to the wavelength of deformation in the tessera. This relation suggests that the tessera terrain may be acting to control deformation along the rift (i.e. possible deforma- tion along preexisting structure).
Venera lander sites. The units identified on Beta are defined on the basis of their radar characteristics; the use of surface landers equipped with gamma-ray spectrometers and optical imaging systems provide ground truth of geochemistry, to determine rock types, and surface characteristics to assess the primary source of radar backscatter for these units. Within the portion of the equatorial region imaged by Arecibo are two Venera landers that provided both panoramic imaging and geochemical analysis of the Venus surface (Florensky et al., 1977). The northernmost lander, Venera 9 is located to the west of Devana Chasma (31.7” N, 298.8”, with an uncertainty of approximately ?l” in both latitude and longitude) within an area mapped as a linear deformation zone on the eastern flank of Beta (Figure 6a). The panoramic image of the surface indicates the presence of a large abundance of blocks and cobbles with sizes ranging from less than the resolution limit of the imaging system to up to 70 cm, with no apparent bedrock exposure (Figure 6b) (Florensky et al., 1977; Garvin et al., 1984). Although there is a relatively large uncertainty on the location of the lander, it is possible on the basis of its correspondence to units mapped from radar images to suggest a geologic setting to account for the observed surface features. The large incidence angle, 50”, and the presence of radar-bright lineaments in the lander region indicates that the radar backscatter is due to the presence of wavelength-scale irregularities on the surface and is consistent with the variety of boulders observed at this site. On the basis of examining the correspondence of surface optical images with

186 0. A. SENSKE ET A!-.
Fig. 5. Radar image and sketch map of units mapped in the vicinity of Rhea Mom. Units flanking Devana Chasma are mapped as tessera. The rift narrows from a width of 200 km to 80 km as it crosses the unit of tessera. Radar-bright lineaments (solid lines) interpreted to be fault scarps in Devana Chasma splay to the north. Bright diffuse lineaments are indicated by the dotted lines and dark
lineaments are indicated by the dashed lines. A multi-ring structure is located at 33.7”N, 288.6”.

RESULTS FROM ARECIBO IMAGE DATA 187
Fig. 6. (a) Radar image and sketch map of the Venera 9 lander site. The uncertainty in the location of the lander (-Cl” in both latitude and longitude) is indicated by the size of the cross. The lander is located within a lineament belt. (b) Panoramic image of the Venera 9 lander site. The presence of a large abundance of blocks and cobbles suggests that talus debris from deformation within the lineament
belt is responsible for the relatively high degree of backscatter in the radar image.

188 D. A. SENSKEETAL.
regional radar imaging, and the location of the lander on a slope (Florensky et al., 1977) we interpreted the large number of blocks and boulders at the Venera 9 site to be associated with deformation in the lineament belt forming talus deposits. Geochemical analysis of rocks by Venera 9 show them to have potassium, thorium, and uranium concentrations that are similar to terrestrial basalts with tholeiitic compositions (Florensky et al., 1977), suggesting that this may be a region of deformed volcanic plains.
Located approximately 1700 km to the south of Venera 9 is the Venera 10 lander (16.0” N, 291.0”, with an uncertainty of approximately * 1” in both latitude and longitude). The characteristics of the surface in this region are much different than those at the Venera 9 site, with the region made up of two units mapped from radar data, plains and tessera (Figure 7a). The uncertainty on the lander location suggests that it may lie either in the plains or the tessera. The panoramic image shows that this area contains abundant bed rock exposure, is typically flat with a pronounced absence of rock fragments, and contains irregular patches of fine material (Figure 7b) (Florensky, et al., 1977; Garvin et al., 1984). The rela- tively smooth to gently undulating topography and the lack of boulders and cobbles suggests that this surface should appear dark (smooth) in the radar images (inci- dence angle of 45”). In contrast, the region mapped as tessera is radar-bright, indicating a relatively large abundance of wavelength-scale scatters and shows evidence of being highly deformed. On the basis of this comparison, we interpret the lander to be located in the plains rather than the tessera. Like the area sampled by the Venera 9 lander, geochemical analysis indicates that rocks at Venera 10 have compositions similar to basalts providing evidence that the plains are made up of lava flows.
Southern Devana Chasrna. The continuation of Devana Chasma south from Theia Mans, made up of a braided system of radar-bright lineaments or scarps is shown in Figure 8. At 9” N, 285” the valley is offset 600 km in a left lateral sense with lineaments in the easternmost section of the valley forming a generally parallel pattern. Located within the zone separating the two sections of the rift is a radar- dark linear structure striking N 55” W. At the southern end of this lineament is a radar-bright Iobate deposit. Its lobate structure and its apparent control by the lineament suggests that the bright materials are lava deposits that have flowed along a depression, interpreted to be a zone of faulting. At the northern end of the eastern part of the rift is a double ringed circular structure, resembling both ovoids identified in the southern hemisphere and multi-ring impact structures. The interior ring is approximately 60 km in diameter and the outer ring is 110 km in diameter. This feature is surrounded by a diffuse radar-bright deposit that extends to the northeast. Lineaments at the southern edge of the ring structure terminate abruptly against it and appear to be covered by the diffuse bright deposits, indicat- ing that the ring structure and its deposits postdate the lineaments. Parallel to the eastern arm of the rift valley at a distance of 300-350 km are locally elevated areas of radar-bright material made up of complex systems of ridges and valleys and

RESULTS FROM ARECIBO IMAGE DATA 189
Fig. 7. (a) Radar image and sketch map of the Venera 10 lander site. The uncertainty in the location of the lander (21’ in both latitude and longitude) is indicated by the size of the cross. Venera 10 is located within a unit of plains adjacent to a region of tessera. (b) The Venera 10 panoramic image indicates that the surface at this site is smooth at the wavelength of the radar and is consistent with a
location within the plains rather than the tessera.

190 0. A. SENSKE ET AL.
Fig. 8. Radar image and sketch map of the southern part of Devana Chasma. The two arms of the rift are separated by approximately 600 km. A radar-dark lineament (indicated by arrows on the image) strikes to the northwest. The southern part of this feature terminates at a radar-bright lobate deposit interpreted to be a lava flow and suggests that material is being channelled along a depression. Units parallel to the eastern arm of the rift are mapped as tessera. The orientation of hneaments forms a pattern similar to that produced by the interaction of crack tips undergoing extension and is shown
schematically.
RESULTS FROM ARECIBO IMAGE DATA 191
MANTLE PLUME/ PASSIVE CRUST
MANTLE PLUME/ MANTLE PLUME/ ACTIVE CRUST CRUSTAL SPREADING
(b) (cl
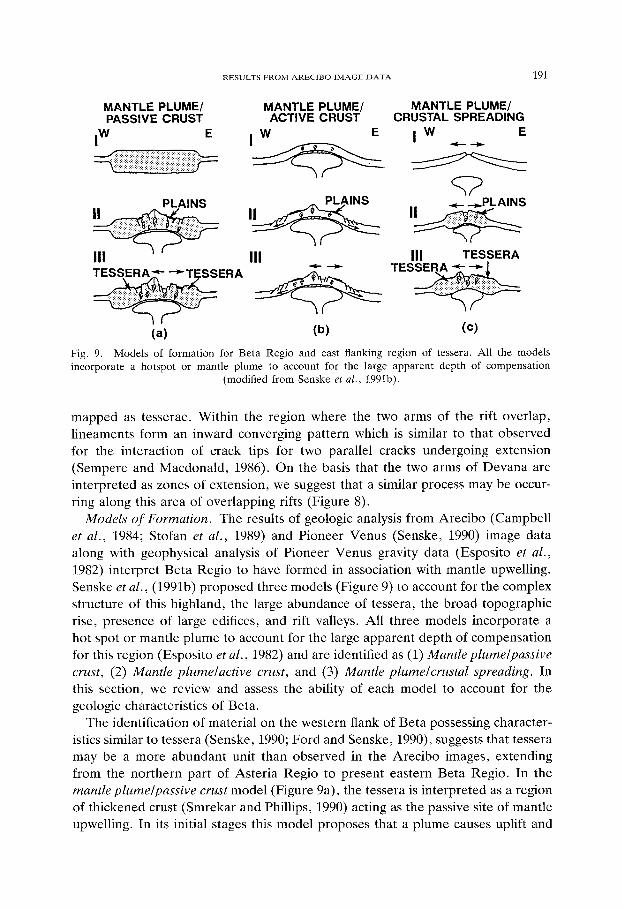
Fig. 9. Models of formation for Beta Regio and east flanking region of tessera. All the models incorporate a hotspot or mantle plume to account for the large apparent depth of compensation
(modified from Senske et al., 1991b).
mapped as tesserae. Within the region where the two arms of the rift overlap, lineaments form an inward converging pattern which is similar to that observed for the interaction of crack tips for two parallel cracks undergoing extension (Sempere and Macdonald, 1986). On the basis that the two arms of Devana are interpreted as zones of extension, we suggest that a similar process may be occur- ring along this area of overlapping rifts (Figure 8).
Models of Formation. The results of geologic analysis from Arecibo (Campbell et al., 1984; Stofan et al., 1989) and Pioneer Venus (Senske, 1990) image data along with geophysical analysis of Pioneer Venus gravity data (Esposito et al., 1982) interpret Beta Regio to have formed in association with mantle upwelling. Senske et al., (1991b) proposed three models (Figure 9) to account for the complex structure of this highland, the large abundance of tessera, the broad topographic rise, presence of large edifices, and rift valleys. All three models incorporate a hot spot or mantle plume to account for the large apparent depth of compensation for this region (Esposito et al., 1982) and are identified as (1) Mantle plume/passive crust, (2) Mantle plumelactive crust, and (3) Mantle plumelcrustal spreading. In this section, we review and assess the ability of each model to account for the geologic characteristics of Beta.
The identification of material on the western flank of Beta possessing character- istics similar to tessera (Senske, 1990; Ford and Senske, 1990), suggests that tessera may be a more abundant unit than observed in the Arecibo images, extending from the northern part of Asteria Regio to present eastern Beta Regio. In the mantle plumelpassive crust model (Figure 9a), the tessera is interpreted as a region of thickened crust (Smrekar and Phillips, 1990) acting as the passive site of mantle upwelling. In its initial stages this model proposes that a plume causes uplift and
192 D. A. SENSKE ET AL.
volcanism, disrupting the tessera, flooding its margins and building the large edifices. Later, the large edifices are faulted due to limited extension associated with the formation of Devana Chasma. This model explains the general age relations between the different units, the broad regional topographic rise and abundant volcanism; isolated regions of tessera are interpreted to be remnants of the larger preexisting structure, but does not provide a mechanism for the initial formation of the region of tessera.
The second model, mantle plumelactive crust (Figure 9b) suggests that a rising mantle plume initially causes underplating and uplift to produce the high topogra- phy at Beta Regio. Volcanism later produces the widespread regions of plains and the localized large edifices. The tessera is interpreted to form by gravity sliding around the edge of the upland and is not necessarily associated with large crustal thickness variations as suggested by the mantle plumelpassive crust model. Like the previous model rifting is a later event and extension is limited. This model accounts for the age relation between the different units, but does not adequately explain the high standing plateau nature of the east flanking region of tessera (see cross section in Figure 3), suggesting that gravity sliding may be a modificational process causing some of the complex deformation within the tessera, but is not the primary mechanism of its formation.
The final model, mantle plumelcrustal spreading, (Figure SC) proposes that the region is initially characterized by crustal spreading. The later superposition of a mantle plume on the spreading axis acts to increase upper mantle temperatures and enhances crustal thickness. The flanking tessera is interpreted to represent analogs to abyssal hills and their plateau-like topography is related to regions of thicker crust. A simple model of symmetric spreading suggests that a region of tessera should be present on the western flank of Beta (near the edge and outside the Arecibo coverage) whose presence is suggested form lower resolution data (Senske, 1990). Due to the low resolution of this data, the dominant trends in its structure have not been identified. A simple spreading model also predicts that the topography should be relatively symmetric about Devana Chasma; analysis from PV altimetry data shows the topography to be asymmetric (Figure 3), suggest- ing that if spreading is occurring, it is complex. The presence of faults cutting across the summit of Theia Mons (Campbell et al., 1989), and the lack of large- scale split and separated structures along the length of Devana Chasma suggests that extension at Beta is limited and restricted to the SO-200 km wide zone of Devana Chasma.
The broad geologic characteristics of Beta can be explained by all three models. The mantle plumelcrustal spreading model suggests that if spreading is occurring, it is complex. The morphology of the east flanking region of tessera suggests that it did not form completely by gravity sliding as suggested by the mantle plumelpass- ive crust model. On the basis of the interpretation of the east flanking region of tessera as a relatively old feature, predating episodes of plains flooding and fault- ing, and the evidence for limited extension at Devana Chasma we prefer the model

RESULTS FROM ARECIBO lMAGE DATA 193
of uplift and disruption of a preexisting region of tessera, mantle plurnelpassive crust model, to account for the complex nature of Beta Regio, although it does not offer a mechanism for the initial formation of the tessera (Senske et al., 1991b).
WESTERN EISTLA REGIO
Located 6500 km to the east of Beta Regio is the highland of Western Eistla Regio. This region is the westernmost of a chain of equatorial upland rises extending from Pavlova in the east to Sif Mons in the west (Senske, 1990). This part of the equatorial region is made up of broad radar-dark domal topographic rises, individ- ual peaks, and extensive volcanism forming large edifices (Senske and Head, 1989; Campbell et al., 1989; Senske, 1990; Campbell and Campbell, 1990). Western Eistla, centered at 20” N, 355” between Sedna and Guinevere Planitiae, is charac- terized by: (1) an elongated domal topographic rise approximately 3200 km long and 2400 km wide striking N 60” W which rises 1.5 km above the surrounding plains (Figure 10) and (2) two peaks, Sif Mons and Gula Mons, located on the crest of the topographic rise and whose elevations reach 1.2 and 3.2 km above a datum of 6052 km with regional slopes of 0.2” to 1.0”. The highland is flanked to the north and south by the broad lowlands of Guinevere and Sedna Planitiae; each at an elevation of - 0.5 km, with the east flank of the highland paralleled by a prong low topography extending south from Sedna Planitia.
Three principal units are mapped on Western Eistla Regio: (1) Plains, including both bright and dark plains, (2) lineament belts, and (3) edifices (Figure Id). This highland differs from Beta Regio in that tessera is not a major unit. Plains are the most abundant unit with those mapped on the topographic rise possessing characteristics similar to those in the surrounding lowlands of Sedna Planitia. On the basis of embayment relations, these pervasive dark plains are interpreted to be volcanic in origin. Lineament belts having a variety of orientations are mapped on this highland. Three lineament belts intersect the northwest end of the highland forming a small tectonic junction (Figure 2d and 10): (1) the southern end of Zorile Dorsa which has an orientation of N 40” W; (2) A belt with an E-W orientation; and (3) A zone of deformation with a N 50” W orientation which lies along the crest of the highland and intersects the northwestern part of Sif Mons. A fourth lineament belt, Guor Linea, with a northwest/southeast orientation intersects the southeastern flank of Gula Mons.
Geologic Characteristics of Sif and Gula Montes. Deposits on Sif and Gula Montes range from dark (low backscatter cross section) to bright (high backscatter cross section) (Figure 11). Although these two volcanoes are adjacent to each other, deposits intersect in the lowlying area between them, they possess different radar characteristics. Sif Mons is a broad shield made up of three primary units: (1) dark flows, (2) bright flows, and (3) mottled bright flows (Figure 11). The central part of the edifice and its summit are made up of localized dark (smooth) and bright (rough) deposits. The bright flows are digitate, concentrated along the
D. A. SENSKE ETAL. 194
40’
30”
20”
l-
1
v._
. .._
.::::
)
i.
/
A5
-9 I
3
./
3
#B’
1000 km 0
(a> Fig. 10(a).
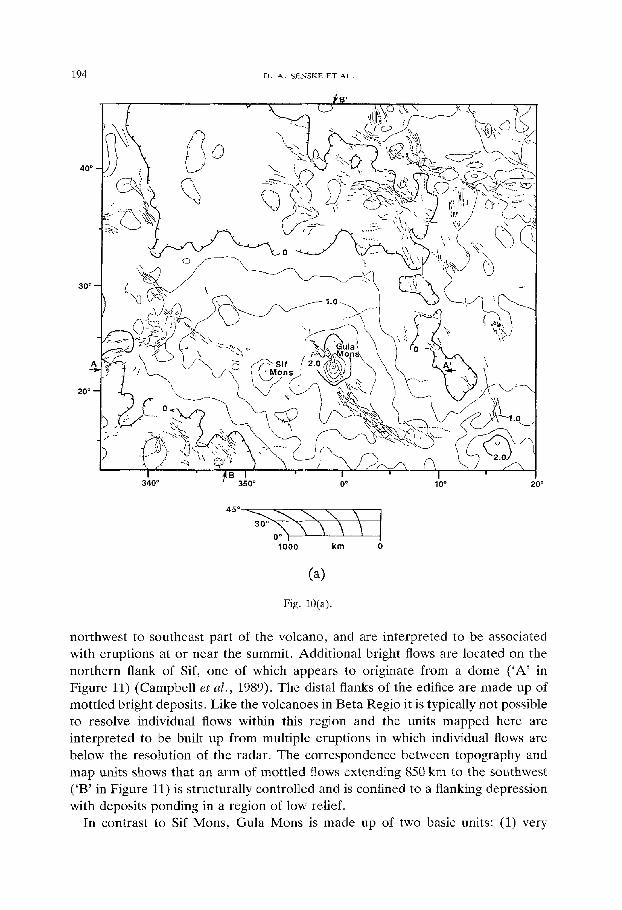
northwest to southeast part of the volcano, and are interpreted to be associated with eruptions at or near the summit. Additional bright flows are located on the northern flank of Sif, one of which appears to originate from a dome (‘A’ in Figure 11) (Campbell et a!., 1989). The distal flanks of the edifice are made up of mottled bright deposits. Like the volcanoes in Beta Regio it is typically not possible to resolve individual flows within this region and the units mapped here are interpreted to be built up from multiple eruptions in which individual flows are below the resolution of the radar. The correspondence between topography and map units shows that an arm of mottled flows extending 850 km to the southwest (‘B’ in Figure 11) is structurally controlled and is confined to a flanking depression with deposits ponding in a region of low relief.
In contrast to Sif Mons, Gula Mons is made up of two basic units: (1) very

195
z O 1000 2000 3000
V
s P)
z
~~F-~
1 I 0 1000 2000 3000 4000
Vexg 200 Distance (km)
(cl Fig. 10. (a) Map of tectonic structures overlaid on a topographic map of Western Eistla Regio. The contours are spaced every 500 m and are referenced to a planetary radius of 6051.0 km. The edifices Sif Mom and Gula Mom are located along the crest of the topographic rise. Solid lines indicate bright lineament, dotted lines bright diffuse lineaments, and dashed lines dark lineaments. Lineaments cutting across the summit of Gula Mons are interpreted as extensional and those in the lowlands paralleling the eastern flank of Western Eistla are interpreted as scarps formed in association with regional doming. The location of topographic cross sections are indicated by the arrows A-A’ and B-B’. (b) The altimetry data show the region is a broad topographic rise on which are superposed the peaks Sif Mom and Gula Mons. (c) Transect B-B’ cuts across a portion of Manzan-Gurme Tessera, an elevated structure embayed by plains. The dotted patterns on the cross sections indicate the extent of lava
deposits associated with Sif and Gula Montes.
bright deposits, corresponding to the summit of the volcano and (2) mottled dark flanking flows (Figure 11). The very bright deposits are confined to a 50 km wide, 150 km long NE/SW trending linear zone. A bright flow to the north of Gula forms a relation similar to those located to the north of Sif, indicating that flank eruptions have occurred (‘C’ in Figure 11). Mottled dark deposits extend for distances of 200-700 km from the summit of the volcano. Their distribution is not uniform, with those of greatest lateral extent found on the northern flank of the edifice. Shorter flows along the southern part of the volcano intersect Guor Linea. Lineaments along the trend Guor cut across the summit and are found on the northern flank of the volcano, and are interpreted to be faults and fractures. The lava flows in the zone intersecting Guor Linea form a butterfly pattern similar to those at Theia Mons in Beta Regio where lava deposits are disrupted by rifting

196 0. A. SENSKE ET AL.
Fig. 11. Geologic sketch map of Sif and Gula Montes. The flow feature labelled ‘A’ appears to originate from a flanking source. The 850 km long flow labeled ‘B’ is confined in a topographic depression on the flank of the Western Eistla high and ponds in a topographically low area. Radar- bright deposits located to the north of Gula Mom, labelled ‘c’ possess characteristics similar to lava complexes mapped in the southern hemisphere (Senske ef al., 1991a). The arrows indicate the primary directions in which lava has flowed. The dashed lines indicate places where the boundaries between
units are gradational.

RESULTS FROM AREClBO lMAGE DATA 197
at Devana Chasma. On the basis of this similarity, it is suggested that Gula Mons is being rifted in a NE/SW direction along Guor Linea. Within a zone 300 km long centered near 22”N, 354.5” the mottled dark flows intersect the mottled bright flows originating from Sif. This contact is gradational and it is not possible with current data to ascertain an age relation between flows by overlapping re- lations.
On the basis of mapping it is seen that volcanism forming edifices and their associated deposits have a maximum extent of 600-850 km, and are interpreted as a thin veneer, contributing a small part relative to the overall volume of the broad rise (Figure lOb,c). The image data also show that the edifices are both located at the endpoint of lineament belts, forming a relation similar to that observed with some of the ovoids (Stofan et al., 1990a). The intersection of this highland with linear deformation zones shows that Western Eistla is part of a regionally extensive system of tectonic zones.
Located adjacent to and parallel to the eastern boundary of the Western Eistla are a series of subparallel to parallel radar-bright lineaments. These features, first identified and mapped as ridges and scarps from Venera 15/16 images (Barsukov et al., 1986; Senske and Head, 1989) show a uniform spacing of 20 km and parallel the NNW trend of high topography suggesting that they are structurally controlled (Figure 10). Between latitudes of 35” N and 40” N and longitudes 0” to lo” the lineament pattern becomes chaotic and corresponds closely to the point where the trend of topography changes from a predominantly northeast direction to a east- west orientation. The lineaments closest to the flanks of the topographic rise do not have apparent radar ‘shadows’ (bright/dark pairs), suggesting that they are scarps, possibly associated with normal faulting. Further to the east, radar shadows are present and may be the result of ridge formation due to the rotation of blocks along low angle normal faults (Senske and Head, 1989).
Formational Models. Two mechanisms are proposed to explain the high topogra- phy and geology of Western Eistla Regio: (1) construction and crustal thickening due to volcanic loading and (2) uplift and doming due to a thermal anomaly with secondary volcanism forming Sif Mons and Gula Mons. The presence of Sif and Gula Montes on the crest of a topographic rise could be consistent with formation by construction and crustal thickening. However, the flows radiating from both volcanoes are of limited extent and appear superposed on the domal rise, suggest- ing that they represent a thin deposit of material and that constructional volcanism is limited. Mapping shows that the broad topographic rise exhibits properties similar to material forming the surrounding plains, consistent with formation by uplifting of plains rather than construction. The relation between Guor Linea and Gula Mons is similar to that of Devana Chasma at Theia Mons, and is interpreted as a zone of faulting and rifting. Ridges in the lowlands along the eastern flanks are interpreted to be associated with normal faulting and form a pattern consistent with models of updoming under regional extension (Withjack and Scheiner, 1982). The interpretation that the ridges formed in association with normal faulting
198 D. A. SBNSKE ET AL.
related to doming, the presence of plains material similar to adjacent regions on the domal rise, the interpretation of Guor Linea as a rift zone, and the interpretation of volcanic deposits being a thin veneer all support a model of formation related to doming over a mantle plume. Within the framework of this model and on the basis of superposition and crosscutting relations of radar units, a three stage history is proposed for Western Eistla Regio: (1) formation of radar-dark volcanic plains through the widespread extrusion of lava: (2) uplift of plains in association with a thermal anomaly producing a broad dome, and (3) formation of Sif and Gula Montes by volcanic construction.
Summary. Arecibo radar images provide a synoptic view of the highlands of Beta Regio and Western Eistla Regio. These two areas are similar in their broad domal topography, the presence of extensive areas of plains on the high topogra- phy, the presence of large edifices on the crest of each topographic rise, interpreted to making up only a small percentage of the volume of the regional topography, and an association with linear zones of deformation interpreted to be extensional. They differ in that unlike Beta Regio, tessera is not a major unit on Western Eistla Regio. On the basis of these characteristics and the large apparent depth of compensation at Beta Regio (Esposito et al., 1982), we interpret these highlands to have formed over areas of mantle upwelling rather than solely by volcanic construction. Beta is interpreted as the site in which a preexisting region of tessera has been disrupted by a mantle plume and extension. In comparison to highlands in the Venus northern high latitudes, Roberts and Head (1990) suggest that Western Ishtar Terra is the site where a preexisting region of tessera has acted as a point for convergence, underthrusting, mountain building, along with melting and plateau uplift. Similarly, on the basis of analytical modelling, Bindschadler et al. (1990) interpret Western Ishtar to have formed by compression and crustal thickening in association with mantle downwelling; although mantle upwelling models have also been proposed (Grimm and Phillips, 1991). Studies of the eastern part of Ishtar, Fortuna Tessera, suggest that the complex deformation in this part of the highland is associated with the collision of crustal blocks resulting in underthrusting and crustal thickening (Vorder Bruegge and Head, 1990). This comparison between highlands suggests that the northern high latitudes and the portion of the equatorial region imaged by Arecibo are characterized by different and distinct tectonic styles, with the Ishtar Terra forming primarily by convergence resulting in thickening of the crust and Beta Regio and Western Eistla Regio forming in association with uplift and extension.
Guinevere Planitia and Sedna Planitia
The lowlands of Guinevere and Sedna Planitiae, located to the east and adjacent to Beta Regio, contain a number of volcanic and tectonic features. In this part of our analysis, we (1) discuss the characteristics and mechanisms of formation for features between Beta Regio and Western Eistla Regio, (2) describe a number of
volcanic source areas within the mottled plains unit, and (3) examine the part of Sedna Planitia where Arecibo and Venera 15/16 image data overlap.
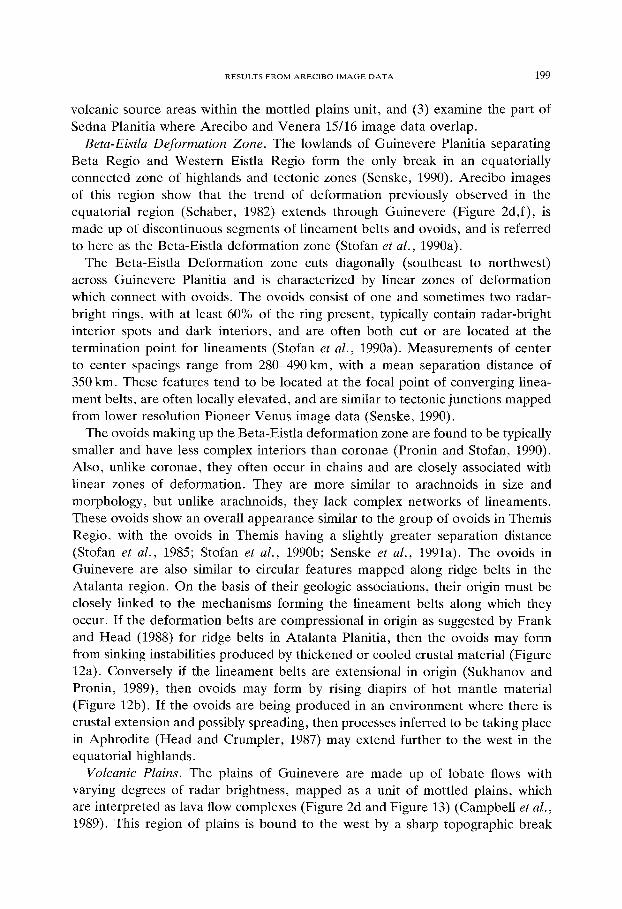
Beta-Eistla Deformation Zone. The lowlands of Guinevere Planitia separating Beta Regio and Western Eistla Regio form the only break in an equatorially connected zone of highlands and tectonic zones (Senske, 1990). Arecibo images of this region show that the trend of deformation previously observed in the equatorial region (Schaber, 1982) extends through Guinevere (Figure 2d,f), is made up of discontinuous segments of lineament belts and ovoids, and is referred to here as the Beta-Eistla deformation zone (Stofan et al., 1990a).
The Beta-Eistla Deformation zone cuts diagonally (southeast to northwest) across Guinevere Planitia and is characterized by linear zones of deformation which connect with ovoids. The ovoids consist of one and sometimes two radar- bright rings, with at least 60% of the ring present, typically contain radar-bright interior spots and dark interiors, and are often both cut or are located at the termination point for lineaments (Stofan et al., 1990a). Measurements of center to center spacings range from 280-490 km, with a mean separation distance of 350 km. These features tend to be located at the focal point of converging linea- ment belts, are often locally elevated, and are similar to tectonic junctions mapped from lower resolution Pioneer Venus image data (Senske, 1990).
The ovoids making up the Beta-Eistla deformation zone are found to be typically smaller and have less complex interiors than coronae (Pronin and Stofan, 1990). Also, unlike coronae, they often occur in chains and are closely associated with linear zones of deformation. They are more similar to arachnoids in size and morphology, but unlike arachnoids, they lack complex networks of lineaments. These ovoids show an overall appearance similar to the group of ovoids in Themis Regio, with the ovoids in Themis having a slightly greater separation distance (Stofan et al., 1985; Stofan et al., 1990b; Senske et al., 1991a). The ovoids in Guinevere are also similar to circular features mapped along ridge belts in the Atalanta region. On the basis of their geologic associations, their origin must be closely linked to the mechanisms forming the lineament belts along which they occur. If the deformation belts are compressional in origin as suggested by Frank and Head (1988) for ridge belts in Atalanta Planitia, then the ovoids may form from sinking instabilities produced by thickened or cooled crustal material (Figure 12a). Conversely if the lineament belts are extensional in origin (Sukhanov and Pronin, 1989), then ovoids may form by rising diapirs of hot mantle material (Figure 12b). If the ovoids are being produced in an environment where there is crustal extension and possibly spreading, then processes inferred to be taking place in Aphrodite (Head and Crumpler, 1987) may extend further to the west in the equatorial highlands.
Volcanic Plains. The plains of Guinevere are made up of lobate flows with varying degrees of radar brightness, mapped as a unit of mottled plains, which are interpreted as lava flow complexes (Figure 2d and Figure 13) (Campbell et al., 1989). This region of plains is bound to the west by a sharp topographic break
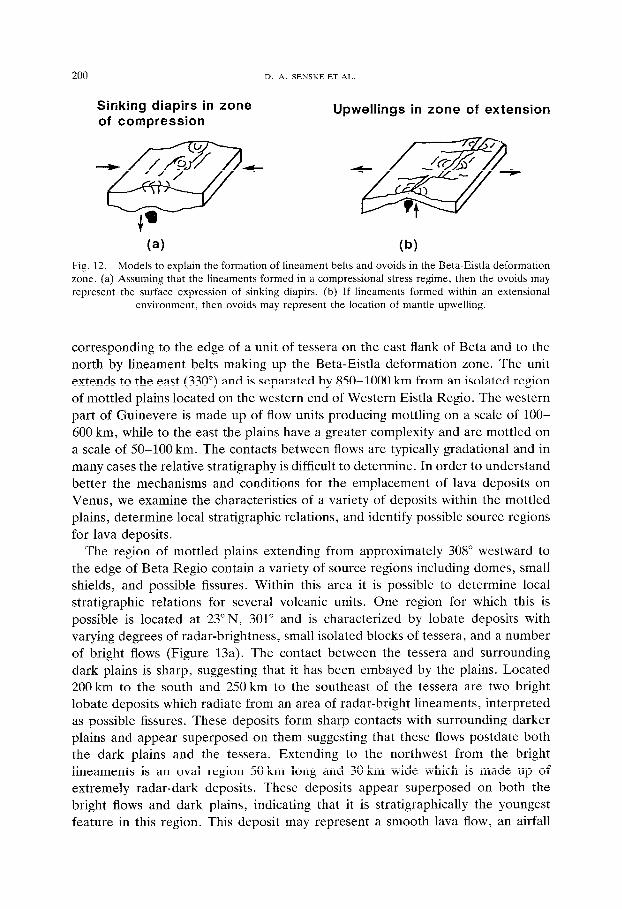
Sinking diapirs in zone of compression
(a) (b) Fig. 12. Models to explain the formation of lineament belts and ovoids in the Beta-Eistla deformation zone. (a) Assuming that the lineaments formed in a compressional stress regime, then the ovoids may represent the surface expression of sinking diapirs. (b) If lineaments formed within an extensional
environment, then ovoids may represent the location of mantle upwelling.
corresponding to the edge of a unit of tessera on the east flank of Beta and to the north by lineament belts making up the Beta-Eistla deformation zone. The unit extends to the east (330”) and is separated by 850-1000 km from an isolated region of mottled plains located on the western end of Western Eistla Regio. The western part of Guinevere is made up of flow units producing mottling on a scale of 100- 600 km, while to the east the plains have a greater complexity and are mottled on a scale of 50-100 km. The contacts between flows are typically gradational and in many cases the relative stratigraphy is difficult to determine. In order to understand better the mechanisms and conditions for the emplacement of lava deposits on Venus, we examine the characteristics of a variety of deposits within the mottled plains, determine local stratigraphic relations, and identify possible source regions for lava deposits.
The region of mottled plains extending from approximately 308” westward to the edge of Beta Regio contain a variety of source regions including domes, small shields, and possible fissures. Within this area it is possible to determine local stratigraphic relations for several volcanic units. One region for which this is possible is located at 23” N, 301” and is characterized by lobate deposits with varying degrees of radar-brightness, small isolated blocks of tessera, and a number of bright flows (Figure 13a). The contact between the tessera and surrounding dark plains is sharp, suggesting that it has been embayed by the plains. Located 200 km to the south and 250 km to the southeast of the tessera are two bright lobate deposits which radiate from an area of radar-bright lineaments, interpreted as possible fissures. These deposits form sharp contacts with surrounding darker plains and appear superposed on them suggesting that these flows postdate both the dark plains and the tessera. Extending to the northwest from the bright lineaments is an oval region 50 km long and 30 km wide which is made up of extremely radar-dark deposits. These deposits appear superposed on both the bright flows and dark plains, indicating that it is stratigraphically the youngest feature in this region. This deposit may represent a smooth lava flow, an airfall

201
Fig. 13(a).

202 D. A. SENSKE ET AL
Fig. 13(b).
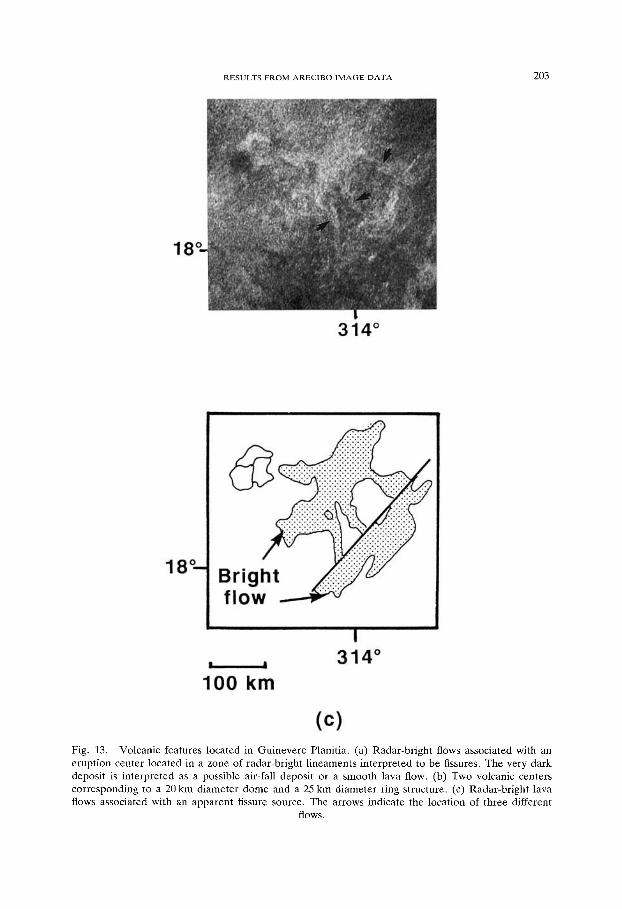
RESULTS FROM ARECIBO IMAGE DATA 203
Fig. 13. Volcanic features located in Guinevere Planitia. (a) Radar-bright flows associated with an eruption center located in a zone of radar-bright lineaments interpreted to be fissures. The very dark deposit is interpreted as a possible air-fall deposit or a smooth lava flow. (b) Two volcanic centers corresponding to a 20 km diameter dome and a 25 km diameter ring structure. (c) Radar-bright lava flows associated with an apparent fissure source. The arrows indicate the location of three different
flows.

204 D. A. SENSKE ET AL.
deposit, or some other unconsolidated mantling deposit. If this feature is an airfall deposit produced by pyroclastic activity, then on the basis of theoretical considerations it is suggested that the volatile content of the source magma would need to be in excess of 4 weight percent (Head and Wilson, 1986).
In a region located near 18” N, 303” it is possible to identify source regions for two distinct flow deposits (Figure 13b). This material corresponds to flanking deposits associated with, a shield or dome (-20 km in diameter) and a ring structure (25 km in diameter). Deposits associated with the dome are radar-bright forming an asymmetric pattern around the peak; extending to a maximum distance of 100 to the northwest of the summit and 30 km to the southeast. The contact between bright deposits to the northwest and adjacent darker deposits is grad- ational, while those to the southeast are sharp, forming a relation that suggests that the bright deposits have been embayed by darker flows. A similar relation is observed between deposits associated with the ring structure located 100 km to the southeast of the dome. Within this region, radar-bright deposits are distributed to the southeast, northeast, and southwest of the ring but are noticeably absent to the northwest. The contact between the northwest part of the ring and surround- ing dark deposits is sharp suggesting that the dark deposits have flowed all the way up to the rim of the ring. Within this part of the mottled plains, the relations between flows indicates that the dark flows are stratigraphically the most recent units.
Mottled plains located in the eastern part of southern Guinevere Planitia, cen- tered near 19”N, 314” contain radar-bright linear zones interpreted as possible fissures. These features are parallel to each other and fall along a strike of N 35” E. The northernmost of these zones is 300 km long and is characterized by three distinct radar-bright flows which emanate perpendicular to its strike (flow direction to the northwest) (Figure 13~). These flows brighten distally from the source region indicating that for the 20” incidence angle these correspond to rough surfaces. At a distance of 70-90 km the flows all intersect a radar-bright region 250 x 70 km, suggesting that the lava is ponding in a local topographic low. The flows radiating from the fissure darken and are interpreted to be smoother close to the source region. The variation of brightness along the length of the flow may be related to relatively higher effusion temperatures at the vent producing smoother, lower viscosity, deposits as compared to deposits further from the vent. To the southeast of the fissure is a radar-bright deposit 200 x 60 km which is localized near the fissure suggesting that the topography in this area is relatively uniform allowing flows to pond near their source.
A wide and diverse range of volcanic flows and source morphologies are appar- ent in the Arecibo images and are interpreted to represent several styles of volcanic activity. The western part of southern Guinevere contains units associated with lava flooding and volcanism forming domes or shields. In contrast, the eastern part of Guinevere is distinguished by apparent fissure zones and prominent flows.
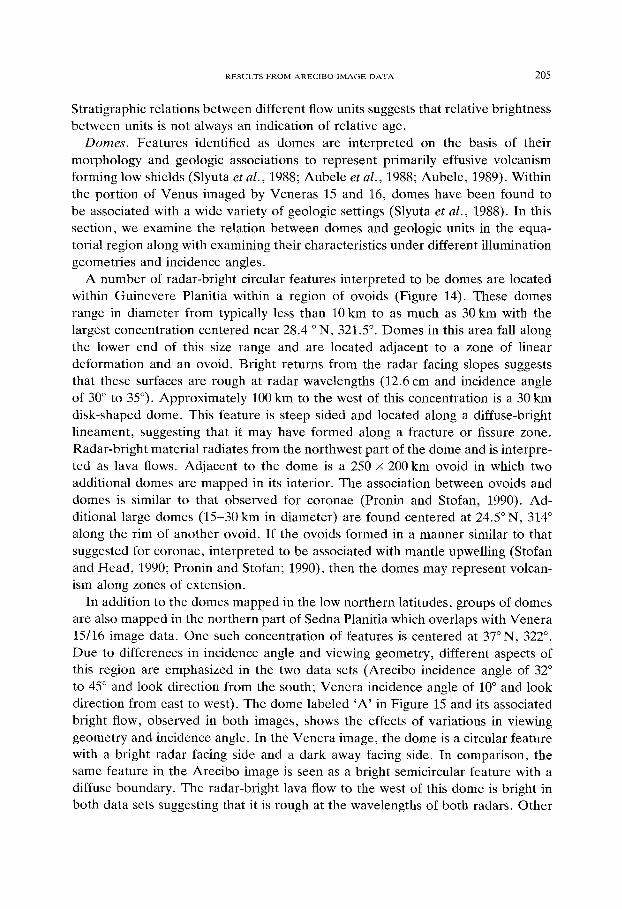
RESULTS FROM ARECIBO lMAGE DATA 205
Stratigraphic relations between different flow units suggests that relative brightness between units is not always an indication of relative age.
Domes. Features identified as domes are interpreted on the basis of their morphology and geologic associations to represent primarily effusive volcanism forming low shields (Slyuta et al., 1988; Aubele et al., 1988; Aubele, 1989). Within the portion of Venus imaged by Veneras 15 and 16, domes have been found to be associated with a wide variety of geologic settings (Slyuta et al., 1988). In this section, we examine the relation between domes and geologic units in the equa- torial region along with examining their characteristics under different illumination geometries and incidence angles.
A number of radar-bright circular features interpreted to be domes are located within Guinevere Planitia within a region of ovoids (Figure 14). These domes range in diameter from typically less than 10 km to as much as 30 km with the largest concentration centered near 28.4 ON, 321.5”. Domes in this area fall along the lower end of this size range and are located adjacent to a zone of linear deformation and an ovoid. Bright returns from the radar facing slopes suggests that these surfaces are rough at radar wavelengths (12.6 cm and incidence angle of 30” to 35”). Approximately 100 km to the west of this concentration is a 30 km disk-shaped dome. This feature is steep sided and located along a diffuse-bright lineament, suggesting that it may have formed along a fracture or fissure zone. Radar-bright material radiates from the northwest part of the dome and is interpre- ted as lava flows. Adjacent to the dome is a 250 X 200 km ovoid in which two additional domes are mapped in its interior. The association between ovoids and domes is similar to that observed for coronae (Pronin and Stofan, 1990). Ad- ditional large domes (15-30 km in diameter) are found centered at 24.5” N, 314 along the rim of another ovoid. If the ovoids formed in a manner similar to that suggested for coronae, interpreted to be associated with mantle upwelling (Stofan and Head, 1990; Pronin and Stofan; 1990), then the domes may represent volcan- ism along zones of extension.
In addition to the domes mapped in the low northern latitudes, groups of domes are also mapped in the northern part of Sedna Planitia which overlaps with Venera 15116 image data. One such concentration of features is centered at 37” N, 322”. Due to differences in incidence angle and viewing geometry, different aspects of this region are emphasized in the two data sets (Arecibo incidence angle of 32” to 45” and look direction from the south; Venera incidence angle of lo” and look direction from east to west). The dome labeled ‘A’ in Figure 15 and its associated bright flow, observed in both images, shows the effects of variations in viewing geometry and incidence angle. In the Venera image, the dome is a circular feature with a bright radar facing side and a dark away facing side. In comparison, the same feature in the Arecibo image is seen as a bright semicircular feature with a diffuse boundary. The radar-bright lava flow to the west of this dome is bright in both data sets suggesting that it is rough at the wavelengths of both radars. Other
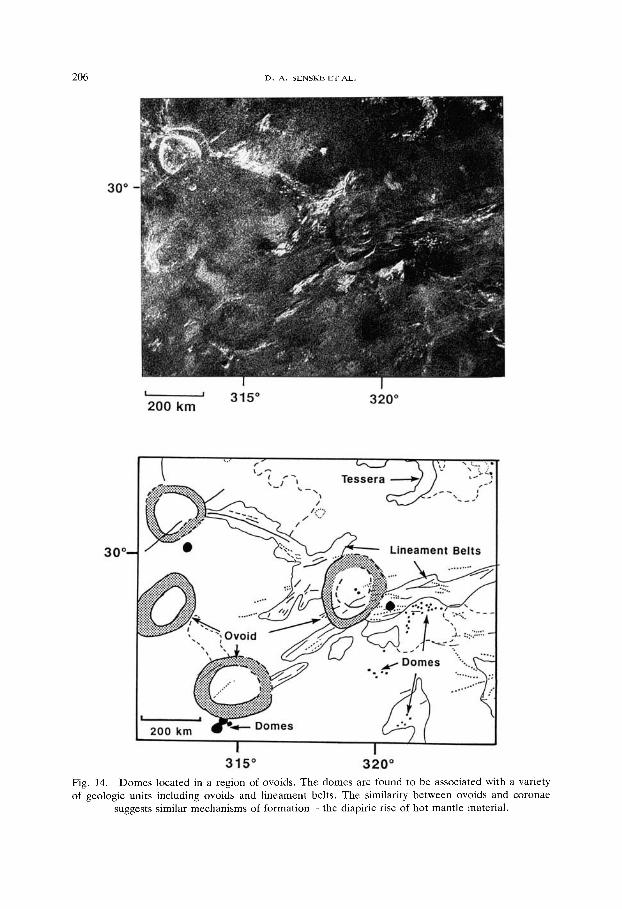
206 D. A. SENSKE ET AL.
Fig. 14. Domes located in a region of ovoids. The domes are found to be associated with a variety of geologic units including ovoids and lineament belts. The similarity between ovoids and coronae
suggests similar mechanisms of formation - the diapiric rise of hot mantle material.
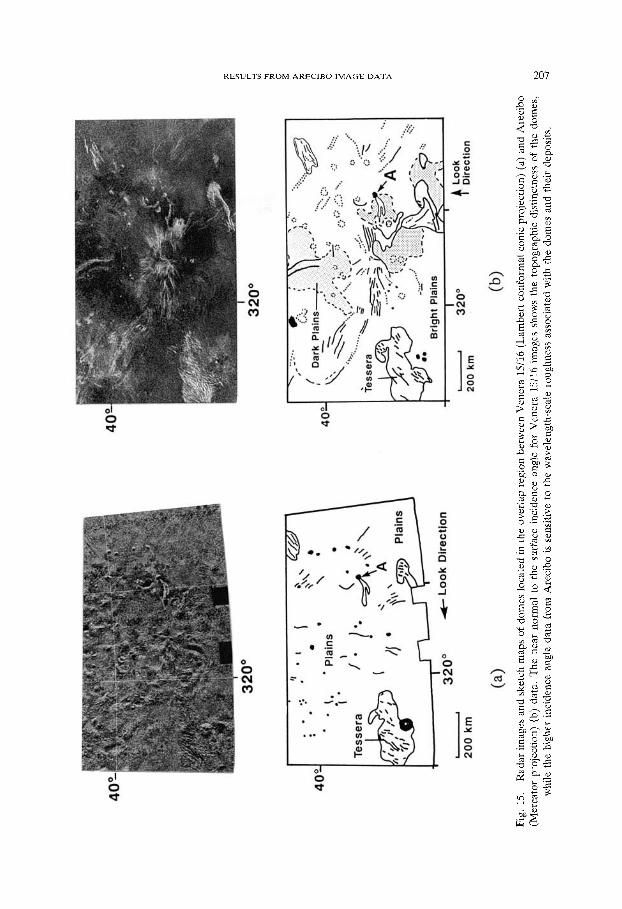
RESULTS FROM ARECIBO IMAGE DATA 207
208 D. A. SENSKE ET AL.
domes in the Arecibo image are characterized as circular to quasi-circular bright features suggesting that they contain rough deposits (outlined by the dotted lines in Figure 15). The two image data sets are complementary in that the low incidence angle of the Venera data establishes the topographic character of the domes while the Arecibo data gives an indication of roughness variations associated with the domes and their deposits. An additional effect due to variations in viewing geome- try is demonstrated by the system of parallel ridges observed in the Arecibo image which are located approximately 150 km to the west of the dome labeled ‘A’. These structures are emphasized in the Arecibo image because they are oblique to the look direction, while in the Venera image they are parallel to the look direction and are not observed. The effect of different incidence angles on geologic mapping is also demonstrated in that plains units mapped from the Arecibo image range from bright to dark while those in the Venera image are generally uniform in brightness with the high incidence angle Arecibo data revealing textural differ- ences (due mainly to roughness) not observed in the Venera 15/16 images.
Impact Craters
Thirty eight craters interpreted to be of impact origin have been identified in the equatorial region of Venus and their locations, diameters, and morphologic characteristics are summarized in Table II. Features identified as impact craters include all circular structures with a sharp well defined rim which are typically surrounded by a radar-bright deposit. The largest crater identified in this part of the equatorial region has a diameter of 93 km and the smallest has a diameter of 11 km. The morphologic characteristics of each crater’s interior and exterior de- posits have been classified in a manner identical to those in the southern hemi- sphere (Senske et al., 1991a). Of the 38 craters identified, eight (21%) have been classified as simple bowl shaped craters (diameters between 11 and 21 km), a percentage similar to that observed in the southern latitudes. Like the southern hemisphere, the greatest abundance of craters have central peaks (50%) or central peak rings and fall in the diameter range of 17 to 52 km with the transition between simple craters and the more complex central peak craters occurring at diameters less than 17 km. In addition to the features identified as impact craters, two large multi-ring structures of either impact or volcanic origin have been identified. Due to the presence of deposits possessing characteristics similar to lava flows, it is not clear if these features are of impact or volcanic origin. The northernmost feature (33.7”N, 288.6”), located on the western flank of Beta Regio (see Figure 5), has a 80 km outer ring and a 60 km inner ring arc. Both the floor of the area bound by the inner ring and the region between the inner and outer rings are covered by plains material, suggesting that lava flooding has occurred. Radar-bright material extends 50 km to the NE of the outer rim and may be either rough lava flows or ejecta deposits. The larger of the two multi-ring structures (110 km in diameter) is located at the end of the eastern segment of Devana Chasma (9.8”N, 288.8”)

RESULTS FROM ARECIBO IMAGE DATA 209
TABLE II
Craters of the Venus Equatorial Region
Latitude Longitude Diameter (km)
44.00” 43 95” 40.05” 39.50” 39.42” 38.65” 37.65” 37.45” 37.34” 33.51” 32.16” 29.49” 28.24” 36.58” 34.97” 34.47” 34.33” 33.53” 32.82” 29.49” 28.62” 28.10” 27.40” 26.67” 26.34” 26.03” 25.54” 25.51” 21.99” 19.28 19.04 18.39” 15.20” 14.45” 10.18” 8.51” 7.13” 6.89”
11.45” 22 0.00” 22
331.55” 22 297.90” 23
23.03” 17 292.25” 20 305.60 13
22.89” 11 324.31” 26
22.70” 20 22.78” 27
0.55” 27 4.97” 23
273.95” 24 301.62 46 288.70 17 346.51” 15 298.38” 15 336.16” 20 355.35” 38 287.84” 50 289.99” 24 337.50” 60 336.72” 42
12.98” 24 303.01” 33 336.05” 16
25.21” 93 4.72” 27
283.17” 26 290.42” 27 318.95” 28
4.03” 25 350.93” 54 301.62 21 298.85” 45 309.44” 52 306.34” 20
Morphology
CP,DF,BE-A(NW) CP,DF,BE-A(SE) CP,DF,BE-A(SE,W) BE-A(S) S,DE CP,BE-A(E) &DE S,DE DE CP,DE CP,DF,BE-A(SW) CP,DF,BE-A(NW) CP,DF,DE-A(NW) CP,DE CP,DF,BE-A(N) CP,BE S S CP,DF,BE-A(SW) CPR,DF DF,BE-A(S) CP,DF,BE CPR,DF,DE-A(SW) CP,DF,BE-A(N) CP,DE-A(N) DF S CPR,DF,DE CP,BE CP,DE CP,DF,BE DF,BE-A(N) DF,BE DF,BE-A(NW) S,DE CP,DF,DE CP,DF S,DF
Crater Morphologic Classification: S - Simple Crater. Crater Interior: CP - Central Peak, CPR - Central Peak Ring, DF - Dark Floor. Crater Exterior: BE - Bright Ejecta, DE - Diffuse Ejecta, BE-A - Asymmetric Bright Ejecta (direction of offset), DE-A - Asymmetric Diffuse Ejecta (direction of offset).
and is surrounded by bright deposits that range from diffuse to lobate, and like the other multi-ring structure suggests the presence of either rough ejecta or lava deposits (see Figure 8).
An analysis of the distribution and abundances of impact craters in the equatorial region has been carried out by Campbell et al. (1990). The density of craters for the region south of 45” N is found to be 0.89 per million square kilometers. This
210 D. A. SENSKE ET AL.
value is nearly half the 1.56 craters per square kilometer calculated from Venera 15/16 data for the northern high latitudes (Basilevsky et al., 1987) and similar to the 0.94 craters per lo6 km’ calculated for the southern latitudes. Assuming a crater production rate at Venus similar to that of the Moon, Basilevsky et al. (1987) suggest a surface age for the northern high latitudes of Venus, north of 30” N, of 0.5 to 1.0 billion years. If a crater production rate similar to that on earth during the Phanerozoic is assumed, then the surface age of Venus is suggested to be closer to 200m.y. (Schaber et al. 1987). On the basis of the crater density calculated for the equatorial region compared to the region imaged by Venera 15/16, the surface age for the low equatorial latitudes is concluded to be similar to or slightly less than the 0.2 to 1 b.y. determined for the northern high latitudes.
Summary and Conclusions
Arecibo radar imaging of the Venus equatorial region has revealed the broad geologic character of this part of the planet, providing a basis to propose mechan- isms of formation for a number of features. Geologic mapping indicates that the most abundant unit on this part of the planet is plains, making up 80% of the area imaged. In areas where plains have been sampled by Venera landers, they are found to have basaltic compositions, indicating that volcanism forming plains is a significant process in the equatorial region. Localized volcanic centers forming domes and large edifices are found in a number of geologic settings including plains, in association with ovoids, and on highlands. Stratigraphic relations be- tween volcanic deposits on the large topographic rises containing the edifices Sif Mans, Gula Mans, Theia Mans, and Rhea Mons and the surrounding units suggest that the lava flows are of limited extent and are interpreted to represent only a thin deposit of material. On the basis of this relation, morphology, broad domal topography, and the presence of rift zones, these areas are interpreted to have formed over regions of large-scale mantle upwelling. Features mapped as ovoids are concentrated primarily within lowlying areas of Guinevere Planitia and are characterized by geologic associations similar to those found at coronae. On the basis of their similarity to coronae, ovoids are interpreted to have formed by hotspots or mantle diapirs. From the analysis presented here, we conclude that the portion of the equatorial region imaged by Arecibo is associated with regions of mantle upwelling on two scales: (1) large-scale plumes causing uplift and extension producing the highlands of Beta Regio and Western Eistla Regio, and (2) small- scale mantle instabilities producing ovoids.
Areally extensive regions of tessera are concentrated mainly in the vicinity of Beta Regio, along its eastern flank and adjacent to Devana Chasma and represent a percentage of the surface less than the 14% mapped in the northern high latitudes, and similar to that in the southern hemisphere imaged by Arecibo (Senske et al., 1991a). On the basis of embayment and cross-cutting relations these regions of tessera are interpreted to have been disrupted by the process forming
RESULTS FROM ARECIBO IMAGE DATA 211
the Beta rise and are interpreted as stratigraphically older units. Like the southern hemisphere (Senske et al., 1991a), it is concluded that the mechanism forming tessera may be less dominant in this part of the equatorial region compared to the northern high latitudes. Linear zones of deformation, lineament belts, are restricted to bands 200-250 km wide, are made up of collections of radar-bright lineaments forming patterns ranging from parallel to interbraiding forming an interconnected network of highlands and ovoid structures. These zones form a discontinuous diagonal pattern between Beta Regio and Western Eistla Regio and complete an equatorially encompassing zone of disruption. Within this part of the equatorial region there is no indication of lineament belts forming fan shaped patterns like those observed in Lavinia Planitia (Senske et al., 1991a) or Atalanta Planitia (Barsukov et al., 1986; Sukhanov et al., 1989). Instead, they are arrayed in patterns similar to deformation zones in the southern hemisphere which extend southward from Hathor Mons and those parallel the northern edge of Lada Terra which are interpreted as extensional.
Geologic analysis of Arecibo radar images provides a regional framework from which higher resolution Magellan images can be interpreted; we conclude by proposing several problems that can be addressed from this data. Features ident- ified as ovoids possess many characteristics similar to coronae, the Magellan data will facilitate in determining the detailed topographic and morphologic character- istics of ovoids, helping to establish their relationship to coronae. In many cases it is not possible to unequivocally determine tectonic settings for linear zones of deformation (faults, scarps or ridges); additional data will aid in identifying fold belts, rift zones, and zones of fracturing and faulting. The overlapping rift valleys in southern part of Devana Chasma form a relation observed nowhere else on the planet, additional high resolution images will help to establish the characteristics of the radar-dark lineament and provide a basis to better quantify the amount of extension along the rift. Large edifices are interpreted to represent only a small percentage of the total volume of the highlands of Beta Regio and Western Eistla Regio, the high resolution image data will aid in quantifying the amount of volcanics associated with the volcanoes along with providing a basis to better determine stratigraphic relations and the sequence of events in their formation.
Acknowledgements
The research presented in this report was supported by NASA grants from the Planetary Astronomy and Geology and Geophysics programs of NASA’s Office of Space Science and Applications (DBC), NAGW - 2185 (JWH), and a National Academy of Sciences-National Research Council Associateship (ERS). Portions of this analysis were carried out when one of the authors (DAS) was a graduate student research fellow at Goddard Spaceflight Center (NTG - 50147). Helpful discussions with A. decharon, K. Roberts, S. Keddie, S. Frank, L. Crumpler, B. Campbell, R. Fletcher, A. Basilevsky, M. Ivanov, G. A. Burba, and E. N. Slyuta

212 D. A. SENSKE ET AL.
are gratefully acknowledged. The Arecibo Observatory is part of the National Astronomy Ionosphere Center which is operated by Cornell University under a cooperative agreement with the National Science Foundation and with support from NASA.
References
Arvidson, R. E., Plaut, J. J., Jurgens, R. F., Saunders, R. S. and Slade, M. A.: 1990, ‘Geology of Southern Guinevere Planitia, Venus, Based on Analyses of Goldstone Radar Data’, in Proc. LPSC XX, pp. 557-572, LPI, Houston.
Aubele, J. C., Head, J. W., Slyuta, E. N. and Basilevsky, A. T.: 1988, ‘Characteristics of Domes on Venus and a Comparison with Terrestrial Cinder Cones and Oceanic Volcanic Edifices’, LPSC XIX, 21-22.
Aubele, J. C.: 1989, ‘Characteristics and Geologic/Terrain Associations of Small Dome-like Hills on Venus’, LPSC XX, 28-29.
Barsukov, V. L., Basilevsky, A.T., Burba, G. A., Bobina, N. N., Kryuchkov, V. P., Kuzmin, R. O., Nikolaeva, 0. V., Pronin, A. A., Ronca, L. B., Chernaya, I. M., Shashkina, V. P., Garanin, A. V., Kushky, E. R., Markov, M. S., Sukhanov, A. L., Kotelnikov, V. A., Rzhiga, 0. N., Petrov, G. M., Alexandrov, Y. N., Sidorenko, A. I., Bogomolov, A. F., Skrypnik, G. I., Bergman, M. Y., Kudrin, L. V., Bokshtein, I. M., Kronrod, M. A., Chochia, P. A., Tyuflin, Y. S., Kadnichansky, S. A. and Akim, E. L.: 1986, ‘The Geology and Geomorphology of the Venus Surface as revealed by the Radar Images Obtained by Veneras 15 and 16’, J. Geophys. Res. 91, D378-D398.
Basilevsky, A. T., Ivanov, B. A., Burba, G. A., Chernaya, I. M., Kryuchkov, V. P., Nikolaeva, 0. V., Campbell, D. B. and Ronca, L. B.: 1987; ‘Impact Craters of Venus: A Continuation of the Analysis of Data From the Venera 15 and 16 Spacecraft’, J. Geophys. Res. 92, 12,869-12,901.
Bindschadler, D. L. and Head, J. W.: 1989, ‘Characterization of Venera 15/16 Geologic Units from Pioneer Venus Reflectivity and Roughness Data’, Icarus 77, 3-20.
Bindschadler, D. L. and Head, J. W.: 1991, ‘Tessera Terrain, Venus: Characterization and Models for Origin and Evolution’, J. Geophys. Res. 96, 5889-5907.
Bindschadler, D. L., Schubert, G. and Kaula, W. M.: 1990, ‘Mantle Flow Tectonics and the Origin of Ishtar Terra, Venus’, Geophys. Res. Lett. 17, 1345-1348.
Campbell, B. A. and Campbell, D. B.: 1990, ‘Western Eistla Regio, Venus: Radar Properties of Volcanic Deposits’, Geophys. Res. Lett. 17, 1353-1356.
Campbell, D. B., Head, J. W., Harmon, J. K. and Hine, A. A.: 1984, ‘Venus: Volcanism and Rift Formation in Beta Regio’, Science 226, 167-170.
Campbell, D. B., Head, J. W.; Hine, A. A., Harmon, J. K., Senske, D. A and Fisher, P. C.: 1989, ‘Styles of Volcanism on Venus: New Arecibo High Resolution Radar Data’, Science 246, 373-377.
Campbell, D. B., Stacy, N. J. S. and Hine, A. A.: 1990, ‘Venus: Crater Distributions at Low Northern Latitudes and in the Southern Hemisphere From New Arecibo Observations’, Geophys. Res. Lett. 17, 1389-1392.
Crumpler, L. S., Head, J. W. and Campbell, D. B.: 1986, ‘Orogenic Belts on Venus’, Geology 14, 1031-1034.
Esposito, P.B., Sjogren, W. L., Mottinger, N. A., Bills, B. G. and Abbott, E.: 1982, ‘Venus Gravity: Analysis of Beta Regio’, Icarus 51, 448-459.
Florensky, C. P., Ronca, L. B., Basilevsky, A. T., Burba, G. A., Nikolaeva, 0. V., Pronin, A. A., Trakhtman. A. M., Volkov, V. P. and Zazetsky, V. V.: 1977, ‘The Surface of Venus as revealed by Soviet Venera 9 and lo’, GSA Bull. 88, 1537-1545.
Frank, S. L. and Head, J. W.: 1988, ‘Ridge Belts on Venus: Evidence for Compressional Origin’, Lunar Planet. Sci. Conf. XIX, 350-351.
Frank, S. L. and Head, J. W.: 1990, ‘Ridge Belts on Venus: Morphology and Origin’, Earth, Moon and Planets 50/51, 421-470.
Ford, P. G. and Senske, D. A.: 1990, ‘The Radar Scattering Characteristics of Venus Landforms’, Geophys. Res. Lett. 17, 1361-1364.
RESULTS FROM ARECIBO IMAGE DATA 213
Garvin. J. B., Head, J. W., Zuber, M. T. and Helfenstein, P.: 1984, ‘Venus: The Nature of the Surface from Venera Panoramas’, J. Geophys. Res. 89, 3381-3399.
Grimm, R. E. and Phillips, R. J.: 1991, ‘Gravity Anomalies, Compensation Mechanisms, and the Geodynamics of Western Ishtar Terra, Venus’, J. Geophys. Res. 96, 8305-8324.
Head, J. W.: 1990, ‘Formation of Mountain Belts on Venus: Evidence for Large-Scale Convergence, Underthrusting, and Imbrication in Freyja Montes, Ishtar Terra’, Geology 18: 99-102.
Head, J. W. and Crumpler, L. S.: 1987, ‘Evidence for Divergent Plate-Boundary Characteristics and Crustal Spreading on Venus’, Science 238, 1380-1385.
Head, J. W. and Wilson, L.: 1986, ‘Volcanic Processes and Landforms on Venus: Theory, Prediction, and Observations’, J. Geophys. Res. 91: 9407-9446.
Head, J. W., Peterfreund, A. R., Garvin, J. B. and Zisk, S. H.: 1985, ‘Surface Characteristics of Venus Derived From Pioneer Venus Altimetry, Roughness, and Reflectivity Measurements’, J. Geophys. Res. 90, 6873-6885.
Masursky, H., Eliason, E., Ford, P. G., McGill, G. E., Pettengill, G. H., Schaber, G. G. and Schubert, G.: 1980, ‘Pioneer Venus Radar Results: Geology From Images and Altimetry’, J. Geophys. Res. 85, 8232-8260.
McGill, G. E., Steenstrup, S. J., Barton, C. and Ford, P. G.: 1981, ‘Continental Rifting and the Origin of Beta Regio, Venus’, Geophys. Res. Lett. 8, 737-740.
Morgan, P. and Phillips, R. J.: 1983, ‘Hot Spot Heat Transfer: Its Application to Venus and Impli- cations to Venus and Earth’, J. Geophys. Res. 88, 5305-8317.
Pettengill, G. H., Eliason, E.) Ford, P. G., Loriot, G. B., Masursky, H. and McGill, G. E.: 1980, ‘Pioneer Venus Radar Results: Altimetry and Surface Properties’, J. Geophys. Res. 8.5, 8261-8270.
Phillips, R. J. and Malin, M. C.: 1983, ‘The Interior of Venus and Tectonic Implications’, in D. M. Hunten, L. Colin, T. M. Donahue, and V. I. Moroz, (eds.) Venus, University of Arizona Press, Tucson, Arizona.
Pronin, A. A. and Stofan, E. R.: 1990, ‘Coronae on Venus: Morphology, Classification, and Distribu- tion’, Icarus 87, 452-474.
Roberts, K. M., and Head, J. W.: 1990, ‘Western Ishtar Terra and Lakshmi Planum, Venus: Models of Formation and Evolution’, Geophys. Res. Lett 17, 1341-1344.
Saunders, R. S. and Malin, M. C.: 1977, ‘Geologic Interpretation of New Observations of the Surface of Venus’, Geophys. Res. Lett. 4, 547-550.
Saunders. R. S., Pettengill, G. H., Arvidson, R. E., Sjogren, W. L., Johnson, W. T. K. and Pieri, L.: 1990, ‘The Magellan Venus Radar Mapping Mission’, J. Geophys. Res. 95, 8339-8355.
Schaber, G. G.: 1982, ‘Venus: Limited Extension and Volcanism Along Zones of Lithospheric Weak- ness’, Geophys. Res. Lett. 9, 499-502.
Schaber, G. G., Shoemaker, E. M. and Kozak, R. C.: 1987, ‘The Surface of Venus: Use of the Terrestrial Cratering Record’, Astron. Vestnik 21, 144.
Sempere, J-C. and Macdonald, K. C.: 1986, ‘Overlapping Spreading Centers: Implications From Crack Growth Simulation By The Displacement Discontinuity Method’. Tectonics 5, 151-163.
Senske, D. A.: 1990, ‘Geology of the Venus Equatorial Region From Pioneer Venus Radar Imaging’, Earth, Moon and Planets 50151, 305-327.
Senske, D. A. and Head, J. W.: 1989, ‘Western Eistla Regio, Venus: Geology and Origin of an Equatorial Highland’, 28th IGC, 3-80-3-81.
Senske, D., Campbell, D., Head, J. W., Fisher, P., Hine, A., decharon, A., Frank, S., Keddie, S., Roberts, K., Stofan, E., Aubele, J.: Crumpler, L. and Stacy, N.: 1991a, ‘Geology and Tectonics of the Themis Regio-Lavinia Planitia-Alpha Regio Area, Venus: Results from Arecibo Image Data’, this issue, Earth, Moon and Planets 55, 97-161.
Senske, D. A., Head, J. W., Stofan, E. R. and Campbell, D. B.: 1991b, ‘Geology and Structure of Beta Regio, Venus: Results From Arecibo Radar Imaging’, Geophys. Res. Left. 18, 1159-1162.
Slyuta, E. N., Nikolaeva, 0. V. and Kreslavsky, M. A.: 1988, ‘Distribution of Small Domes on Venus: Venera 15116 Radar Data’, Solar System Res. 22, 180-186.
Smrekar, S. E. and Phillips, R. J.: 1990, ‘Geoid to Topography Ratios for 14 Venusian Features: Implications for Compensation Mechanisms’, Lunar Planet. Sci. Conf. XXI, 1176-1177.
Stofan, E. R., Head, J. W. and Campbell, D. B.: 1985, ‘MultipIe Ring Features in Themis Regio: Evidence for Endogenic Origin’, Lunar Planet. Sci. Conf. XVI, 825-826.
Stofan, E. R., Head, J. W.: Campbell, D. B., Zisk, S. H., Bogomolov, A. F., Rzhiga, 0. N.,
214 0. A. SENSKE ET AL.
Basilevsky, A. T. and Armand, N.: 1989, ‘Venus Rift Zones: Geology of Beta Regio and Devana Chasma, GSA Bulletin 101, 143-156.
Stofan, E. R. and Head, J. W.: 1990, ‘Coronae of Mnemosyne Regio: Morphology and Origin’, Icarus 83,216-243.
Stofan, E. R., Head, J. W. and Campbell, D. B.: 1990a, ‘Beta-Eistla Deformation Zone: Analysis From Recent Arecibo Images’, Lunar Planet. Sci. Conf. XXI, 1208-1209.
Stofan, E. R., Head, J. W. and Campbell, D. B.: 1990b, ‘Themis Regio, Venus: Analysis From High Resolution Arecibo Images’, Lunar Planet. Sci. Conf. XXI, 1210-1211.
Sukhanov, A. L. and Pronin, A. A.: 1989, ‘Ridged Belts on Venus as Extensional Features’, Proc. 19th Lunar Planet. Sci. Conf. pp. 335-348, LPI, Houston.
Sukhanov, A. L., Pronin, A. A., Burba, G. A., Nikishin, A. M., Kryuchkov, V. P., Basilevsky, A. T., Markov, M. S., Kuzmin, R. O., Bobina, N. N., Shashkina, V. P., Slyuta, E. N. and Chemaya, I. M.: 1989, ‘Geomorphic/ Geologic Map of Part of the Northern Hemisphere of Venus’, U.S.G.S. Misc. Inv. Map I-2059.
Vorder Bruegge, R. W., Head, J. W. and Campbell, D. B.: 1990, ‘Orogeny and Large-Scale Strike-Slip Faulting on Venus: Tectonic Evolution of Maxwell Montes’, J. Geophys. Res. 95, 8357-8381.
Vorder Bruegge, R. W. and Head, J. W.: 1990, ‘Tectonic Evolution of Eastern Ishtar Terra, Venus’, Earth, Moon, and Planets 50/S, 251-304.
Withjack, M. D. and Scheiner, C.: 1982, ‘Fault Patterns Associated with Domes - An Experimental and Analytical Study’, AAPG Bulletin 66,302-316.