GEOLOGY AND GROUND-WATER RESOURCES … AND GROUND-WATER RESOURCES OF OGDEN VALLEY, ... falls as rain...
67
UNITED STATES DEPARTMENT OF THE INTERIOR Harold L. Ickes, Secretary GEOLOGICAL SURVEY W. G. Mendenhall, Director Water-Supply Paper 796-D GEOLOGY AND GROUND-WATER RESOURCES OF OGDEN VALLEY, UTAH BY R. M. LEGGETTE AND G. H. TAYLOR Prepared in cooperation with the CITY OF OGDEN Contributions to the hydrology of the United States, 1937 (Pages 99-161) UNITED STATES GOVERNMENT PRINTING OFFICE WASHINGTON : 1937 For sale by the Superintendent of Documents, Washington, D.C. ------ Price 10 cents
Transcript of GEOLOGY AND GROUND-WATER RESOURCES … AND GROUND-WATER RESOURCES OF OGDEN VALLEY, ... falls as rain...

UNITED STATES DEPARTMENT OF THE INTERIOR Harold L. Ickes, Secretary
GEOLOGICAL SURVEY W. G. Mendenhall, Director
Water-Supply Paper 796-D
GEOLOGY AND GROUND-WATER
RESOURCES OF
OGDEN VALLEY, UTAH
BY
R. M. LEGGETTE AND G. H. TAYLOR
Prepared in cooperation with the
CITY OF OGDEN
Contributions to the hydrology of the United States, 1937
(Pages 99-161)
UNITED STATES
GOVERNMENT PRINTING OFFICE
WASHINGTON : 1937
For sale by the Superintendent of Documents, Washington, D.C. ------ Price 10 cents


CONTENTS
Abstract........................................................... 99Introduction........................................................ 100
Purpose and acope of inveatigation............................ 100Location and general features of area......................... 101History of the use of water................................... 103Previous investigations....................................... 103Acknowledgments..................................^............ 104
Climate............................................................ 105Relief and drainage................................................ 106Geology............................................................ 107Surface water...................................................... Ill
South Pork of Ogden River..................................... IllHuntsville area.......................................... IllArtesian Park near head of Ogden Canyon.................. Ill
Middle Fork of Ogden River and Huntsville Spring Creek........ 112Artesian Park............................................ 112Vicinity of electric-railroad bridge..................... 112Area north of Hunt sville................................. 112
North Fork of Ogden River at Artesian Park.................... 114Ogden River................................................... 114
Head of Ogden Canyon..................................... 114Gain in flow through Ogden Canyon........................ 114Total surface inflow and outflow of Ogden Valley......... 116
Ground water....................................................... 119Occurrence.................................................... 119Source........................................................ 120Movement...................................................... 121Fluctuations of water level................................... 122
Test wells and continuous records........................ 122Periodic measurements.................................... 123Annual cycles................. ........................... 123Water levels during 1925, 1926, and 1928................. 126Changes in atmospheric pressure, transpiration by plants,
and evaporation........................................ 126Fluctuations caused by earthquakes....................... 128Comparisons of ground-water levels during 1933, 1934,
and 1935............................................... 129Summary.................................................. 131
Recharge...................................................... 131Seepage from streams..................................... 132Penetration of precipitation and irrigation water........ 133Quantitative estimate.................................... 134Water spreading.......................................... 135
Discharge..................................................... 136Shallow water body above artesian confining bed.......... 136Recharge area............................................ 137Artesian reservoir....................................... 137Quantitative estimate.................................... 141
Quality....................................................... 142The Pine View Dam and reservoir.................................... 142
General features.............................................. 142Probable effects upon the artesian reservoir.................. 143
Relation of artesian discharge to stream flow...................... 144Well records....................................................... 146
ILLUSTRATIONS
Plate 35. Annual cumulative departure from normal precipitation at Ogden, Utah, and annual precipitation at Ogden, and Huntsvilie, Utah............................. In pocket
36. Map of part of Ogden Valley, Weber County, Utah.... In pocket37. Graphs of flow of South Fork of Ogden River, precipi
tation at Ogden, withdrawal of ground water at Artesian Park, and water levels in five observation wells in Ogden Valley, 1932-35................... In pocket
III

IV ILLUSTRATIONS
Plate 38. Hydrographs of observation wells in Ogden Valley andflow of South Pork of Ogden River................ In pocket
39. Stream flow in Ogden Valley, 1933-34............... In pocket40. Well logs, Ogden Valley, Utah...................... In pocket
Figure 17. Map of Utah and part of Idaho shewing areas coveredby ground-water investigations....................... 102
18. Average monthly precipitation at Huntsville, Utah...... 10519. Stream'flow in Ogden Valley, 1925-26................... 11320. Total surface-water outflow from Ogden Valley, Utah,
1894, 1921, 1925, 1928, 1932, 1933, and 1934......... 11521. Diagrammatic sketch of an ideal east-west section
through Ogden Valley, Utah, showing ground-water con ditions .............................................. 119
22. Profiles between Artesian Park and well 74, Ogden Valley, Utah, showing land surface and levels at which water stood in wells on May 31, 1933, and Octo ber 10, 1934......................................... 121
23. Discharge from wells at Artesian Park and water levelsin three wells in Ogden Valley....................... 125
24. Hydrographs of streams and wells in Ogden Valley, Utah, showing effects of plant transpiration on water levels............................................... 127
25. Hydrograph of well 81 and graph of fluctuation of at mospheric pressure in Ogden Valley, Utah, showing barometric type of water-level fluctuation........... 128
26. Hydrographs of five wells in Ogden Valley, Utah, show ing fluctuations of water levels in wells caused by earthquakes on March 12, 1934........................ 129
27. Graph from recording pressure gage operating on a 133- foot artesian well in Ogden Valley, Utah, showing ef fect of earthquake of March 12, 1934................. 130

GEOLOGY AMD GROUND-WATER RESOURCES OF OGDEN VALLEY. UTAH
By R. M. Leggette and G. H. Taylor
ABSTRACT
Ogden Valley is a fault trough bounded on both the east and west by faults that dip toward the middle of the valley. This fault trough con tains unconsolidated deposits of clay, sand, and gravel, whose thickness is more than 600 feet. These materials are stream and lake deposits and in places are well sorted and stratified. The lake sediments were laid down in a small lake that occupied Ogden Valley and that was connected with glacial Lake Bonneville at its high stage by an arm of water that occupied Ogden Canyon. During this stage of Lake Bonneville the Ogden Valley was completely filled with lake sediments up to an altitude of about 4,900 feet. These sediments include about 70 feet of clay, sand, and gravel in alternating layers, below which is a bed of varved clay whose maximum thickness is about 70 feet. This clay is continuous under the lower parts of the valley and is the confining bed that produces the artesian conditions. Below the varved clay is a deposit of silt, 3and, and gravel of unknown thickness, most of which is believed to be pre- Bonneville alluvium.
In most summers the streams entering Ogden Valley are diverted for irrigation, and the upper parts of their channels are generally dry dur ing the irrigation season. Lower down in the valley seepage water ap pears in the channels, and below these points there is continuous flow. The 'flow of the Ogden River increases as it passes through Ogden Canyon. This gain in flow is believed to be derived chiefly from ground-water seepage from the canyon walls, although there is probably some ground- water underflow from Ogden Valley at the head of Ogden Canyon. Some of the gain is also due to leakage from pipe lines in the canyon.
Of the 146 wells whose records are given in this report, 70 are flowing wells.
Ground water in Ogden Valley occurs in the pore spaces of the gravel, sand, and clay, of the valley fill. Wells drilled through the clay confining bed encounter water that is under artesian pressure. Shallow wells that do not pass through the clay, or wells in the higher parts of the valley, where the clay is absent, encounter water-table conditions in which the water is not confined under pressure. The ground water in the valley moves approximately parallel to the general slope of the land surface. The ground water in the recharge area that is, the higher parts of the valley, where the clay confining bed is ab sent moves down gradient toward the upper edge of the clay confining bed, where it either enters the artesian reservoir or becomes a part of the shallow ground-water body above the confining bed.
The records of measurements of ground-water levels show that the water levels fluctuate in annual cycles, the amplitudes of which range from 2 feet to 30 feet or more. The highest water levels occur during April, May, or June of each year, and the lowest water levels usually occur in the later part of the winter. The withdrawal of water at Artesian Park probably affects artesian pressures in the entire artesian reservoir and, possibly, to some extent the water table in the recharge area. Miscellaneous measurements of artesian pressure at Artesian Park in 1925, 1926, and 1928 compared with measurements made in 1933 seem to indicate that although the pressure was greater in 1933, the difference was probably not large. Instrumental records show that water levels in Ogden Valley fluctuate in response to changes in atmospheric pressure- transpiration by plants, evaporation, and earthquakes. The ground- water levels before the period of spring recharge were about the same in 1935 as in 1933, notwithstanding the drought and the heavy with drawals in 1934.
99

100 CONTRIBUTIONS TO HYDROLOGY, 1937
Ground-water recharge takes place by penetration of water that falls as rain or snow on the valley, by seepage of excess Irrigation water, and by seepage of water from stream channels and irrigation canals. .The water that sinks to the water table in the area above the clay confining bed does not reach the artesian reservoir because the clay of the confining bed is essentially impervious, as shown by labo ratory tests. Seepage from streams is probably the major source of ground-water recharge. It is estimated that during the recharge period from November 1932 to June 1933 the ground-water recharge amounted to about 23,000 acre-feet. Ground-water recharge can probably be increased by applying stream flood waters to the recharge area and thus placing in ground storage water that otherwise may be wasted.
Natural discharge of ground water from the valley occurs chiefly as flow from springs, return flow to streams, transpiration by plants, and evaporation from soil. Artificial discharge occurs by the withdrawal of water from flowing and nonflowing wells. The greater part of the arti ficial discharge of water from the artesian reservoir occurs in Artesian Park, where there are 48 wells connected to the municipal water system of the city of Ogden. During 1933 and 1934 the discharge from these wells ranged from about 12.9 to 20.5 second-feet. It is estimated that during the year ending September 30, 1934, the total ground-water dis charge from Ogden Valley was about 27,700 acre-feet.
The waters of Ogden Valley are satisfactory for domestic use and most industrial uses, but some of them are harder than is desirable foo? certain purposes. The fluoride content of samples of water from seven wells was determined, and it was found that these waters are not likely to be objectionable on account of their fluoride content.
The Pine View Dam, which is now under construction by the United States Bureau of Reclamation, will impound about 30 to 40 feet of wat«r over a part of the artesian reservoir. Although the additional load of surface water above the artesian confining bed will tend to increase artesian pressures and the discharge from artesian wells, it is belle-wed that the change will not be of great practical importance.
The utilization of the artesian reservoir has inevitably resulted in a somewhat greater seasonal lowering of water levels than would otherwise have occurred. The stream flow derived from seepage has therefore also been diminished. During the winter and spring of any year ground-water recharge has been increased over what it would other wise have been, partly because of lower water levels at the beginning of the recharge period and partly because of the withdrawal of water from artesian wells during the period. During wet years, in spite of the artesian development, water levels at the end of the recharge period are probably nearly as high as they would have been had there been no arte sian development, but in dry years the difference has doubtless been greater. In the future, unless there should be heavy pumping from wells in the recharge area the artesian water supply will be perennially ade quate for at least the present rate of withdrawal. Moreover, somewhat greater utilization of the artesian reservoir would be possible' by in creasing the draft at times when the water is most needed, thus inducing greater ground-water recharge at times of surplus water.
INTRODUCTION
Purpose and scope of investigation
On June 15, 1932, the city of Ogden and the United States Geologi
cal Survey entered into an agreement for the purpose of investigating
ground-water conditions in Ogden Valley and their relation to the stream
flow in the valley. The city of Ogden obtains all but a small part of
its municipal water supply from a group of artesian wells in Ogden
Valley, and these withdrawals constitute the greater part of the water
withdrawn from wells in the valley0 Most of the surface water, except

GEOLOGY AND GROUND-WATER RESOURCES OF OGDEK VALLEY, UTAH 101
the heavy spring run-off, is diverted for irrigation, and the summer
flow is generally inadequate to supply all demands. The city of Ogden
contributed $8,000 and the Federal Government contributed $4,000 toward
the investigation.
Field work was carried on during the summer and fall of 1932 by
R. M. Leggette and L. K. Wenzel, during the summer and fall of 1933 by
R. M. Leggette, and during the fall of 1934 by G. H. Taylor, all under
the supervision of 0. E. Meinzer, geologist in charge of the division
of ground water, United States Geological Survey. In September 1932
several automatic water-level recorders were installed on observation
wells, and when Messrs. Leggette and Wenzel were not in the field these
were read weekly by G. H. Taylor, who was assisted by H. E. Northrup
during the first half of 1933. After November 1934 C. L. Coray, Ogden
city engineer, and Thomas Curtis, of the United States Bureau of
Reclamation, were in charge of five of these recorders.
Location and general features of area
Ogden Valley is in Weber County, Utah, on the east side of the
most westerly range of the Wasatch Mountains, about 12 miles east of
the city of Ogden (fig. 17) and lies within the Great Basin. During a
part of the glacial epoch the valley was occupied by a lake that was
connected with the main Lake Bonneville by an arm of water occupying
the Ogden Canyon. The valley has an area of about 23 square miles and
is completely surrounded by mountains, some of which rise to altitudes
of about 10,000 feet. The only outlet for the water in the valley is
through Ogden Canyon, a narrow gorge cut through the Wasatch Mountains
to the west of the valley. For the purpose of this report Ogden
Valley is considered to be the flatter part of the valley, which lies
below the foot of the surrounding mountains at altitudes of 4,800 to
5,000 feet or more.
The main occupation of the inhabitants of the valley is stock
raising and farming. The water for irrigation is diverted from the
three main tributaries of the Ogden River and from numerous smaller
spring-fed streams entering the valley from the surrounding mountains.
Nearly all of the surface water entering the valley during the summer
is diverted for irrigation. Most of the water that appears in the
tributary streams as return flow from the valley and the water that is
gained by the Ogden River as it passes through the Ogden Canyon is used

102 CONTRIBUTIONS TO HYDROLOGY, 1937
Water-Supply Paper 157 Water-Supply Paper 199 Water-Supply Paper 217 Water=Supp|y Paper 277 1906 19O7 1908 I9H
Water-Supply Paper 333 Water-Supply Paper 659-A Jordan Valley This report 19)3 1932 inprognees
Figure 17. Map of Utah and part of Idaho showing areas covered by ground-water investigations.

GEOLOGY AND GROUND-WATER RESOURCES OP OGDEN VALLEY, UTAH 103
for Irrigation In the area west of the Wasatch Mountains in the vicinity
of Ogden. The population of Ogden Valley in 1930 was 1,367, of whom 520
lived in the town of Huntsville.
History of the use of water
Ogden Valley was settled a few years after the first pioneers ar
rived in Utah in 1847. Before the valley was settled, however, the in
habitants in the vicinity of the city of Ogden began to irrigate with
water from the Ogden River below the mouth of the canyon, and the group
of people who use water from this source are at present known as the
lower-valley water users. Later the settlers in Ogden Valley claimed
water rights on the three branches of the Ogden River in Ogden Valley,
and this group is known as the upper-valley water users. During 1914
the city of Ogden began developing artesian water near the junction of
the three branches of the river in Ogden Valley, and the drilling of
wells by the city continued at irregular intervals until 1933. During
the summer and fall of most years the flow of the Ogden River consists
partly of ground water returned to its tributaries from the sediments
in Ogden Valley and partly of water that seeps into its channel as the
river passes through Ogden Canyon. Conflicts among the three groups
interested in the water resources of Ogden Valley arose, and in July
1929 an agreement was made which provided that during a 7-year period
all litigation would be suspended and the conditions and use of water
would remain undisturbed pending investigation of the source, disposal,
and relation of the waters of the valley.
Previous investigations
Prior to the investigation described in this report, very few
data regarding the ground-water conditions in Ogden Valley had been
obtained. In 1894 Samuel Fortier, of the experiment station of the
Agricultural College of Utah, made an investigation of the seepage
water and underflow of rivers in parts of the State, and this included
a detailed study in Ogden Valley. No measurements of ground-water
levels were made, but an intimate relation between the ground water
and the surface waters was recognized.
I/ Fortier, Samuel, Preliminary report on seepage water and the underTlow of rivers: Utah Agr. Coll. Exper. Sta. Bull. 38, February- 1895; Seepage water of northern Utah: U. S. Geol. Survey Water-Supply Paper 7, 1897.

104 CONTRIBUTIONS TO HYDROLOGY, 1937
In 1921 J. J. Sanford, of the office of the State engineer, made
another hydrologic study of Ogden Valley, during which only the flow of
the streams in the valley was considered.
The controversies over the water rights in the valley resulted in
an investigation of the stream flow and precipitation and related fac-2/
tors by the office of the State engineer in 1925. This investigation
was continued in 1926 and included the determination of the artesian-
pressure in a few of the flowing wells owned by the city of Ogden.
Artesian pressures in the same wells were again measured by the office
of the State engineer in 1928.
In 1930 test holes were put down near the head of Ogden Canyon by
the United States Bureau of Reclamation to investigate the site of the
Pine View Dam, and the results of these borings were of considerable
aid in the geologic interpretations given in this report.
Acknowledgment s
Grateful acknowledgment is made to Ora Bundy and Harman W. Peery,
mayors of the city of Ogden, to Fred Williams, city commissioner of
water supply, and to J. C. Brown and C. L. Coray, city engineers, dur
ing whose terms of office the investigation was made, for their helpful
cooperation; to Harry Irwin, city superintendent of waterworks, for
helpful cooperation in field work; to E. 0. Larson, J. R. lakisch, and
Thomas Curtis, of the United States Bureau of Reclamation, for coopera
tion in making available data collected by them and for continuing ob
servations of the ground-water levels in the valley. George Bacon,
State engineer, made available the data gathered by his office in
Ogden Valley. H. M. Ritter, L. K. Peterson, and W. H. Burrows, resi
dents of Ogden Valley, cooperated in the use of their lands for test-
well sites, and all the residents of the valley aided by supplying in
formation and giving permission to prosecute the investigation on their
lands. Acknowledgment is also due to J. C. Alter, of the United States/
Weather Bureau, for the loan of cllmatologic instruments; to A. B.
Purton, of the United States Geological Survey, for cooperation in ob
taining stream-flow data and for other assistance; and to Half R.
Woolley, of the United States Geological Survey, for his personal in
terest and valuable help.
2/ Browning, H. W., Report on a hydrographic survey of the Ogden River system during the irrigation se'ason of 1925 (unpublished; avail able in manuscript form at the office of the State Engineer).

GEOLOGY AND GROUND-WATER RESOURCES OF OGDEN VALLEY, UTAH 105
CLIMATE
The climate of Ogden Valley is typical of the semiarld West at
similar altitudes. The summers are relatively short, and temperatures
are moderate. Unofficial temperatures of about 45° below zero were re
ported during December 1932, and temperatures of 200-30° below zero are
rather common. Normally the valley floor la covered with 2 to 4 feet of
snow at some time during the winter, but during the winter of 1933-34
very little snow fell in the valley. The annual precipitation during
the years 1933 and 1934 was not excessively below normal at Ogden, but a
serious shortage of water existed during the summer of 1934 because of
the light snowfall at higher altitudes during the preceding winter.
Figure 18. Average monthly precipitation at Huntsville, Utah.
Complete records of precipitation in Ogden Valley have not regularly
been kept, but there are available complete records of annual precipita
tion at Huntsville for 20 different years between 1895 and 1927. The
annual precipitation during these 20 years ranged from 14.73 inches in
1919 to 36.25 inches in 1909, and the average was 20.86 inches.
106 COHTRIBTJTIOHS TO HYDROLOGY, 1937
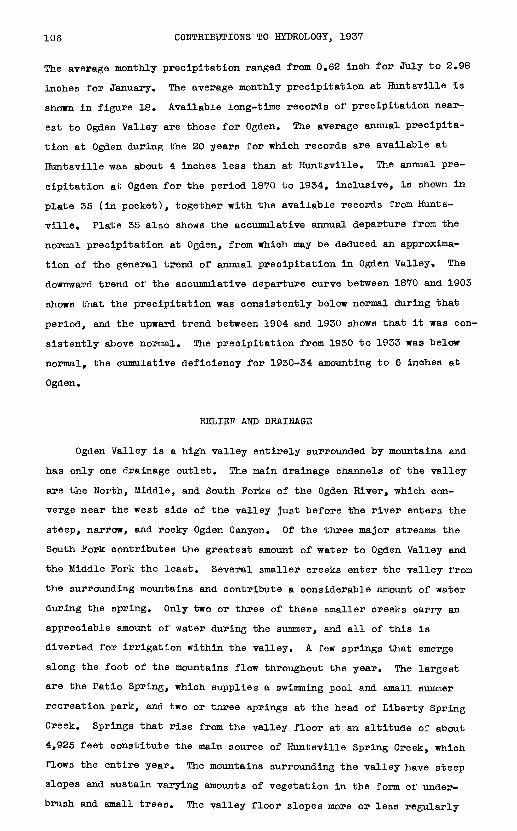
The average monthly precipitation ranged from 0.62 inch for July to 2.98
inches for January- The average monthly precipitation at Huntsville is
shown in figure 18. Available long-time records of precipitation near
est to Ogden Valley are those for Ogden. The average annual precipita
tion at Ogden during the 20 years for which records are available at
Huntsville was about 4 inches less than at Huntsville. The annual pre
cipitation at Ogden for the period 1870 to 1934, inclusive, is shown in
plate 35 (in pocket), together with the available records from Hunts
ville. Plate 35 also shows the accumulative annual departure from the
normal precipitation at Ogden, from which may be deduced an approxima
tion of the general trend of annual precipitation in Ogden Valley. The
downward trend of the accumulative departure curve between 1870 and 1903
shows that the precipitation was consistently below normal during that
period, and the upward trend between 1904 and 1930 shows that it was con
sistently above normal. The precipitation from 1930 to 1933 was below
normal, the cumulative deficiency for 1930-34 amounting to 6 inches at
Ogden.
RELIEF AND DRAINAGE
Ogden Valley is a high valley entirely surrounded by mountains and
has only one drainage outlet. The main drainage channels of the valley
are the Horth, Middle, and South Forks of the Ogden River, which con
verge near the west side of the valley just before the river enters the
steep, narrow, and rocky Ogden Canyon. Of the three major streams the
South Fork contributes the greatest amount of water to Ogden Valley and
the Middle Fork the least. Several smaller creeks enter the valley from
the surrounding mountains and contribute a considerable amount of water
during the spring. Only two or three of these smaller creeks carry an
appreciable amount of water during the summer, and all of this is
diverted for irrigation within the valley. A few springs that emerge
along the foot of the mountains flow throughout the year. The largest
are the Patio Spring, which supplies a swimming pool and small summer
recreation park, and two or three springs at the head of Liberty Spring
Creek. Springs that rise from the valley floor at an altitude of about
4,925 feet constitute the main source of Huntsville Spring Creek, which
flows the entire year. The mountains surrounding the valley have steep
slopes and sustain varying amounts of vegetation in the form of under
brush and small trees. The valley floor slopes more or less regularly

GEOLOGY AND GROUND-WATER RESOURCES OF OGDEN VALLEY, UTAH 107
from the north, northeast, and east toward the head of Ogden Canyon.
The valley floor has the form of a bench into which the three main tribu
taries of the Ogden River have cut their small valleys. Near the head
of Ogden Canyon the channels of the three tributaries lie about 80 feet
below the general benchlike floor of the valley, but farther upstream
this distance becomes less and less until in the upper parts of the
valley the channels are only a few feet below the valley floor. Just
north of Huntsville a hill composed mainly of gravel and cobbles rises
about 70 feet above the valley floor.
GEOLOGY
Certain features of the geology of Ogden Valley have been des-3/ */
cribed by Gilbert and by Blackwelder. They considered mainly the
physiographic history of the valley and the structure and nature of the
bedrock surrounding the valley. These phases of the geology have direct
bearing on the present ground-water investigation, but they are less im
portant than the geology of the unconsolidated sediments that underlie
the valley floor. For this reason these sediments were studied in con
siderable detail during the present investigation.
Ogden Valley is a fault trough bounded on the east and west by
faults that dip toward the center of the valley. (See fig. 21.) The
fault trough was formed long before the glacial epoch, which, as pointed
out below, profoundly affected the geologic conditions that in great
measure determine the occurrence of ground water in the valley. In this
fault trough was deposited a great thickness of clay, silt, sand, and
gravel. The total thickness of this material is not known, but one well
(no. 46) near the head of Ogden Canyon penetrated 600 feet without en
countering bedrock. These sediments are chiefly stream and lake de
posits. Their deposition covered a long period and was more rapid at
certain times than at others. The events that resulted in the filling
of the lower part of the fault trough are not known in detail, but it is
probable that there were dry periods when alluvium was deposited by
streams entering the valley during occasional storms. Other periods
were more humid, and at sueh times the valley probably contained a small
lake in which sediments were deposited.
3/ Gilbert, G. K,, Studies of Basin Range structure: U. S. Geol. Survey Prof. Paper 153, pp. 57-59, 61-62* 1928.
4/ Blackwelder, Eliot, New lights on the geology of the Wasateh Mountains, Utah: Geol. Soc. America Bull., vol. 21, pp. 520-526, 533-536, 1910. '

108 CONTRIBUTIONS TO HYDROLOGY, 1937
The top 100 feet or so of the valley filling was deposited in an
ancient lake that at its highest stage stood about 400 feet higher than
the lowest part of the present valley. This lake was connected with the
large ancient Lake Bonneville by an arm of water occupying Ogden Canyon.
Lake Bonneville occupied the area lying west of the Wasatch Mountains.5/ .
According to Gilbert its history is briefly as follows:
In the early part of the glacial epoch a lake was formed in the
Bonneville Basin. This lake rose within about 90 feet of an overflow
point at Red Rock Pass, at the north end of Cache Valley, in southern
Idaho. The lake then receded until its area was probably less than that
of the present Great Salt Lake. The lake again began to rise, and this
time it reached the level of the divide at Red Rock Pass and overflowed.
This highest stage of the lake is known as the Bonneville stage, and its
level was about 1,000 feet above the present Great Salt Lake. The divide
at Red Rock Pass consisted of about 400 feet of alluvium resting on bed
rock. The alluvial divide was rapidly cut down, and for a long time the
lake overflowed the bedrock divide. This stage of the lake is known as
the Prove stage, and its level was about 600 feet above the level of the
present Great Salt Lake. Later the lake began to recede and its over
flow ceased. The present Great Salt Lake is but a low stage of the
glacial Lake Bonneville. The rise and fall of the level of Lake Bonne
ville was no doubt oscillatory, any one major rise being the net result
of numerous fluctuations of stage.
During the Bonneville stage of the glacial lake Ogden Valley was
completely filled with lake sediments as high as about 4,900 feet above
sea level. This level is only approximate, for the surface of this
filling slopes toward the head' of Ogden Canyon. It is referred to in
this report as the 4,900-foot bench merely for convenience. The Provo
level of Lake Bonneville was about 4,800 feet above sea level, and these
lake sediments therefore could not have been deposited during the Provo
stage. In many places these sediments contain oscillation ripple marks,
typical lake clays, and other features which clearly show that they were
deposited in a lake. The following section is typical of these lake
sediments:
5/ Gilbert, G. K., Lake Bonneville: TJ. S. Geol. Survey Mon. 1, 1890.
GEOLOGY AND GROUND-WATER RESOURCES OP OGDEN VALLEY, UTAH 109
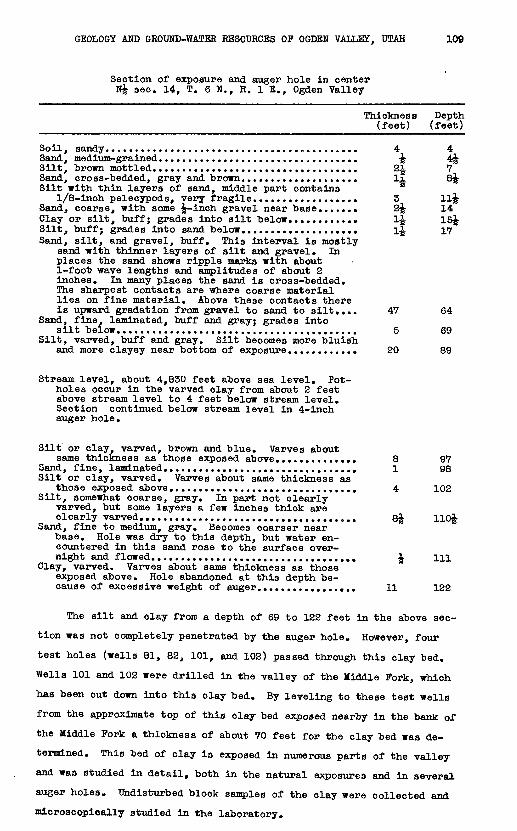
Section of exposure and auger hole in center Nj sec. 14, T. 6 N., R. IE., Ogden Valley
Thickness Depth __________________________________________(feet) (feet)
Soil, sandy........................................... 4 4Sand, medium-grained.................................. J- 4|Silt, brown mottled................................... 2.JL 7Sand, cross-bedded, gray and brown.................... li 8^Silt with thin layers of sand, middle part contains
1/8-inch pelecypods, very fragile.................. 3 lljSand, coarse, with some J-inch gravel near base....... 2% 14Clay or silt, buff; grades into silt below............ 1£ is|Silt, buff; grades into sand below.................... 1-J 17Sand, silt, and gravel, buff. This interval ia mostly
sand with thinner layers of silt and gravel. Inplaces the sand shows ripple marks with aboutl-foot> wave lengths and amplitudes of about 2inches. In many places the aand is cross-bedded.The sharpest contacts are where coarse materiallies on fine material. Above these contacts thereis upward gradation from gravel to sand to silt.... 47 64
Sand, fine, laminated, buff and gray; grades intosilt below......................................... 5 69
Silt, varved, buff and gray. Silt becomes more bluishand more clayey near bottom of exposure............ 20 89
Stream level, about 4,830 feet above sea level. Pot holes occur in the varved clay from about 2 feet above stream level to 4 feet below stream level. Section continued below stream level in 4-inch auger hole.
Silt or clay, varved, brown and blue. Varves aboutsame thickness as those exposed above.............. 8 97
Sand, fine, laminated................................. 1 98Silt or clay, varved. Varves about same thickness as
those exposed above................................ 4 102Silt, somewhat coarse, gray. In part not clearly
varved, but some layers a few inches thick are clearly varved..................................... Q% no£
Sand, fine to medium, gray. Becomes coarser near base. Hole was dry to this depth, but water en countered in this sand rose to the surface over night and flowed................................... ^ 111
Clay, varved. Varves about same thickness as those exposed above. Hole abandoned at this depth be cause of excessive weight of auger................. 11 122
The silt and clay from a depth of 69 to 122 feet in the above sec
tion was not completely penetrated by the auger hole. However, four
test holes (wells 81, 82, 101, and 102) passed through this clay bed.
Wella 101 and 102 were drilled in the valley of the Middle Pork, which
has been cut down into this clay bed. By leveling to these test wells
from the approximate top of this clay bed exposed nearby in the bank of
the Middle Pork a thickness of about 70 feet for the clay bed was de
termined. This bed of clay is exposed in numerous parts of the valley
and was studied in detail, both in the natural exposures and in several
auger holes. Undisturbed block samples of the clay were collected and
microscopically studied in the laboratory.

110 CONTRIBUTIONS TO HYDROLOGY, 1937
The clay consists of alternating thin layers of dense, sticky,
puttylike clay and silt, usually grayish blue and brown. The uniform
thickness and continuity of the individual layers in any one exposure is
very striking. The clay is believed to be a varved clay that was de
posited in the quiet waters of the lake that occupied Ogden Valley dur
ing the highest stage of Lake Bonneville. Each pair of layers consti
tutes a varve and represents the summer and winter deposition of one
year. An approximate count of the varves indicates that about 25,000
years is represented by the total thickness of the clay bed.
The nature of the clay, its mode of deposition, and its known areal
distribution all point to the fact that it underlies continuously the
area represented in plate 36 (in pocket) to the southwest of the dashed
line, which shows the approximate upper edge of the clay bed. This clay
bed is of great importance in connection with the ground water in Ogden
Valley, because it is the confining bed that produces the artesian
conditions.
The general nature of the sediments overlying the clay bed is shown
in the section given above. There are no major breaks of deposition
other than numerous nongradational contacts where the coarser material
lies on the finer material. In numerous exposures of the sediments that
overlie the clay bed, oscillation ripple marks were observed only a
short distance below the top of the 4,900-foot bench. The gravel, sand,
and clay that overlie the clay bed are believed to have been deposited
in the lake that occupied Ogden Valley during the later part of the
Bonneville stage of Lake Bonneville.
The nature of the sediments that underlie the clay bed is shown in
a general way by the well logs in plate 40. The wells were drilled over
a period of years by different well drillers, and the terms used by them
in describing the materials penetrated are probably not uniform. A cor
relation of the well logs was therefore not feasible. It is believed
that most of the material underlying the clay bed is irregular and len
ticular. The sand and gravel immediately below the clay bed was proba
bly deposited during the early part of the Bonneville stage, before the
lake had risen to its highest level. The material of greater depths is
probably mostly pre-Bonneville alluvium.

GEOLOGY AND GROUND-WATER RESOURCES OF OGDEN VALLEY, UTAH 111
SURFACE WATER
South Fork of Ogden River
Huntsville area. Continuous records of stream flow of the South
Fork of the Ogden River have "been obtained "by the United States Geologi
cal Survey since 1921 at a point a short distance above the mouth of
South Fork Canyon and above all irrigation diversions. (See pi. 36.)
The stream flow at this station for the period October 1932 to September
1934 is shown graphically in plates 37 and 38 (in pocket). The maximum
daily flow during this period was 816 second-feet, and the minimum was
22 second-feet. The maximum daily flow during the year ending September
30, 1934, was 89 second-feet, and this was about one-fifth to one-tenth
the amount normally expected during the annual spring run-off, the re
sult of scant precipitation at higher altitudes during the winter of
1933-34. At no time during 1934 was there a continuous flow through the
entire channel of the South Fork of the Ogden River in Ogden Valley.
During part of the winter there was practically no diversion of water
from the South Fork where it enters Ogden Valley, and thus there was
channel-seepage loss of the entire flow of the stream, amounting to
about 35 or 40 second-feet.
Artesian Park near head of Ogden Canyon. During part of 1925 and
1926 a stream-gaging station was maintained on the South Fork of the
Ogden River near Artesian Park, a short distance above the junction of§/
the three forks of the Ogden River. (See pi. 36.) This station was
again operated for a short period in 1933 and for a longer period in
1934. The flow of the South Fork during these periods is shown
graphically in figure 19 and plate 39 (in pocket). It is probable that
during the summers of 1925 and 1926 the flow past this station was
mostly ground-water run-off, or seepage into the stream channel, for no
doubt most of the flow of the South Fork was either diverted before it
entered the valley or seeped from the channel soon after it entered the
valley. All the flow past the station measured during 1933 and 1934
was ground-water run-off, because at no time during this period was the
flow in the channel of the South Fork continuous through the valley.
6/ Grover, N. C., and others, Surface water supply of the United States, 1926, pt. 10, The Great Basin: U. S. Geol. Survey Water-Supply Paper 630, pp. 41-42, 1930.
146824 O 37 3

112 CONTRIBUTIONS TO HYDROLOGY, 1937
Middle Pork of Ogden River and Huntsville Spring Creek
Artesian Park. No continuous measurements of the flow of the Mid
dle Fork of the Ogden River are available except for short periods.
Records are available for the period June 22, 1925, to October 20, 1926,
but they include the flow of both Huntsville Spring Creek and the Middle
Pork of the Ogden River. These records are shown graphically in figure
19. Although there was probably some inflow of surplus irrigation
water, the amount was probably small, and the discharge during the
summer was no doubt nearly all ground-water run-off. During the summer
a small irrigation ditch diverted as much as about 4.4 second-feet above
the point of measurement. However, the average diversion by this ditch
was about 3.6 and 0.6 second-feet for a part of June and September 1928,
respectively, and 1.5 and 1.2 second-feet during July and August 1925,§/
respectively.
Vicinity of electric-railroad bridge. The flow of the Middle Pork
of the Ogden River measured just above its junction with Huntsville
Spring Creek at the bridge on the electric railroad for the period
August 11, 1933, to November 16, 1934, is shown in plate 39. With the
exception of the period from about March 5 to about May 15, 1934, when
there was continuous flow throughout the channel, the flow was mostly
ground-water run-off, although it is probable that in the early part of
the irrigation season a small amount was surplus irrigation water.
Area north of Huntsville. The flow of Huntsville Spring Creek at
a point just north of Huntsville from August 11, 1933, to November 16,
1934, is also shown in plate 39. During 1933 and 1934 the irrigation
ditch mentioned above was diverting water just below the point of
measurement on Huntsville Spring Creek. The amount of this diversion
was probably about the same or less than during 1925. The flow of
Huntsville Spring Creek during 1933-34 was nearly all ground-water run-t
off, probably only a small amount being surplus irrigation water and
local surface run-off.
7/ Grover, N. C., and others, op. cit., pp. 43-44. 8/ Unpublished data from the Utah State engineer's report on Ogden
Valley, 1925 and 1928.

GEOLOGY AND GROUND-WATER RESOURCES OP OGDEN VALLEY, UTAH 113
QN003S H3d 133J
Figure 19. Stream flow in Ogden Valley, 1925-26.

114 CONTRIBUTIONS TO HYDROLOGY, 1937
North Pork of Ogden River at Artesian Park
The flow of the North Pork of the Ogden River at Artesian Park for2/
the period June 17, 1925, to October 15, 1925, is shown by figure 19.
After about July 5, 1925, the flow of this stream was probably all
ground-water run-off, although a very small part may have been surplus
irrigation water. The flow of the North Pork for the period August 11,
1933, to November 16, 1934, measured at weekly intervals, is shown in
plate 39. Except in the period from about March 5 to April 15, 1934,
the flow is ground-water run-off from areas within Ogden Valley. It is
not probable that any of the flow was surplus irrigation water, because
of the shortage of water during 1934, although there may have been a
small amount of local surface run-off during the spring.
Ogden River
Head of Ogden Canyon. Continuous records of the total stream flow
from Ogden Valley are available, but for the purpose of this report only
the flow during the summer and early fall are significant in relation to
ground-water discharge. Plate 39 shows the total flow of the Ogden
River at the Pioneer Dam, near the head of Ogden Canyon, for the period
August 1, 1932, to September 30, 1934. This station is about 1^- miles
below the junction of the three forks of the Ogden River. The total
flow of the three forks, as measured above their junction at intervals
of about one week, is shown for the same period. The difference between
the two curves is probably due to inflow or evaporation and transpira
tion between the points of measurement. The total flow from August to
November, 1933, and from July to October, 1934, was practically all
ground-water run-off, with only a very small amount, if any, of surplus
irrigation water. Records of the total stream flow from Ogden Valley
are available for the months of July, August, and September in each of
the six years 1894, 1925, 1928, 1932, 1933, and 1934. These, together
with measurements in August and September, 1921, are shown graphically
in figure 20.
Gain in flow through Ogden Canyon. The Ogden River gains in flow
between its entrance into Ogden Canyon and the mouth of the canyon,
near the city of Ogden. During certain seasons of the year part of
9/ Unpublished data from the Utah State engineer's report on Ogden Valley, 1925.

GEOLOGY AND GROUND-WATER RESOURCES OP OGDEN VALLEY, UTAH 115
this gain is surface water discharged "by several small streams tribu
tary to the canyon, but in the summer these small streams carry no
water except during local storms. Thus, the summer gain consists essen
tially of flow from springs or seepage in and near the channel of the
river, although some of the seepage, or return flow, probably results
from leakage in the pipe lines of the Utah Power £ Light Co. and of the
city of Ogden. The average gain in flow between the Pioneer Dam and the
mouth of the canyon was measured in 1925 and 1928 by the State engineer.
July August September
Figure 20. Total surface-water outflow from Ogden Valley, Utah, 1894, 1921, 1925, 1928, 1932, 1933, and 1936.
The average gain during July and August, 1925, was 20 and 16 second-
feet, respectively. During the first 22 days of September 1925 the
average gain was 21 second-feet. During July, August, September, and
October, 1928, the gain in flow was 18, 19, 18, and 17 second-feet,
respectively. The records of flow during 1925 were continuous over the
period covered. During 1928 between 8 and 11 measurements a month were
made at more or less regular intervals. On August 12, 1933, a flow of
28.5 second-feet was measured at the mouth of Ogden Canyon. On the
same day the flow just below Pioneer Dam was only 0.3 second-foot.

116 CONTRIBUTIONS TO HYDROLOGY, 1937
Thua there was & gain in flow of about 28 aecond-feet in the Ogden River
between the head and the mouth of the canyon. Reaulta of measurementa
of the flow of the Ogden River made at aix points in Ogden Canyon on
September 20, 1934, are ahown in the following table.
Results of meaaurements of stream flow made in Ogden Canyon September 20, 1934
Distance Gain per mile of downstream Plow channel between
Location from (aeeond- succesaive pointa Pioneer Dam feet) of measurement
(milea) (aecond-feet)
0 0.3
700 feet eaat of west line of sec. 16, T. 6 N., R. 1 E. 0.3 0
2,600 feet eaat of west line of aee. 17, T. 6 N., R. 1 E. .9 3.8
1,000 feet west of eaat line of aec. 18, T. 6 N., R. 1 E. 1.8 5.8
2,000 feet west of east line of aec. 24, T. 6 N., R. 1 E. 3.1 10.9
Mouth of Ogden Canyon 5.1 14.3
Loaa
6.3
2.2
3.9
1.7
The average gain in flow of the river aa it paased through the
Ogden Canyon waa about 2.8 aecond-feet per mile of channel. Although
the gain waa greatest in the first mile below Pioneer Dam, the gain
farther downstream indicates that a considerable part of the total gain
ia derived from ground water diacharging from the bedrock canyon walla
and that the underflow of ground water from Ogden Valley is relatively
small*
Total aurface inflow and outflow of Ogden Valley. Meaaurementa of
the total surface inflow and outflow of Ogden Valley have been made by
various persons or organizations at several times during the past.
During the first two weeks in September 1934 the inflow and outflow of
the entire valley were again meaaured. A aummary of the available data
ia given in the following table:

GEOLOGY AND GROUND-WATER RESOURCES OP OGDEN VALLEY, UTAH 117
Total surface inflow and outflow, in second-feet, ofOgden Valley, Utah, on approximately corresponding dates of
different years
Inflow above irrigated land
Inflow below irrigated land
Irrigation diversions
July 7-11
160
143
Outflow at 159 head of Ogden Canyon
1894Aug. 16-18
80
71
101
1921Sept. 10
79
27(?)
119
Aug. 23-26
79
37
110
79
Sept. 19-20
73
40
78
60
1925Aug. 25
59
34
91
46
Sept. 15
63
42
88
57
1928 1934Sept. Sept. 14 15
54 30
2
28
25 9.5
The table above is of special interest because the periods for
which the data are available are comparable for the five different years
and represent that time of year (September) when the inflow and outflow
are probably not materially affected by seasonal run-off or excess irri
gation water. The outflow from the valley during September can be as
sumed, with reasonable accuracy, to be all or nearly all ground-water
run-off. This was the actual condition during the measurements made in
September 1934, for there was no continuous flow through the channels of
the streams in Ogden Valley, and irrigation water was so much in demand
that none was being wasted.
The inflow into the valley during the years 1921, 1925, and 1934
includes the inflow both above and below the highest irrigated land.
The inflow below the irrigated land consists mainly of return flow from
ground waters, although a small amount of inflow may have been caused by
direct irrigation run-off, particularly during the years 1921 and 1925.
The inflow below the irrigated lands during August and September, 1921
and 1925, was comparable in amount and indicates no great difference in
the ground-water level during those two years. The inflow below the ir
rigated land on September 15, 1934, was only 2 second-feet. The reduc
tion of this inflow of 1934 below that of 1921 and 1925 was probably
caused in the main by the excessive lowering of the ground-water level
during 1934. However, a small amount of the decrease was probably due
to the lack of irrigation water and consequently leas direct run-off or
wastage of irrigation water.
118 CONTRIBUTIONS TO HYKROLOGY, 1937
The inflow into the valley above the irrigated land was progres
sively less during September of the years 1894, 1921, 1925, 1928, and
1934 a. fact which would in itself indicate a similar decrease in the
amount of outflow from the valley. However, the outflow from the valley
decreased at a more rapid rate than the inflow above the irrigated land.
This was probably due both to more economy in the use of irrigation
water, which decreased the direct inflow and seepage from irrigation
water, and to a progressive decline in the level of the ground water.
A decline in ground-water levels is caused by a decrease in the
amount of ground-water recharge or by increased withdrawals from the
ground water. The precipitation between 1904 and 1930 was consistently
above normal. A lowering of the ground-water levels between these dates
would have been partly due to a decrease in the recharging of the ground
water caused by more economy in the use of irrigation water. As a major
part of the ground-water development in the valley was made about 1914,
a part of the lowering of the ground-water levels between 1904 and 1930
would have been caused by these ground-water withdrawals.
Between 1921 and 1928 the rate at which the outflow decreased was
greater than the rate at which the inflow above the irrigated land de
creased. During the same period the precipitation was consistently
above normal (see pi. 35), which indicates a more or less constant
amount of recharge from precipitation. The development of ground water
during that period was relatively small. Thus, the increase in the rate
of decline of the outflow over the inflow to the valley during this
period was probably due to a more economical use of irrigation water,
which decreased the recharge to the ground water and lowered the ground-
water levels. The exceptional decrease in the stream flow in the valley
during 1934 was, without question, due to a lack of precipitation, which
resulted in lowered ground-water levels and reduced seepage from the
ground-water body. The direct inflow of waste irrigation water was also
reduced to practically zero during 1934.

GEOLOGY AND GROUND-WATER RESOURCES OP OGDEN VALLEY, UTAH 119
GROUND WATER
Occurrence
Ground water in Ogden Valley occurs in the pore spaces of the gravel,
sand, and clay of the valley fill. Although clay may be as porous as
sand and gravel, the pore spaces are so minute that little or no water
will drain or can be recovered from saturated clay.
Two distinct types of conditions are encountered by wells in Ogden
Valley. Wells that pass through the clay confining bed encounter water
that is under artesian pressure, which in the lower parts of the valley
(below an altitude of about 4,860 feet) is sufficient to produce flows
at the surface. Drilled wells are used where artesian conditions will
be encountered. Wells that encounter water-table conditions in Ogden
Valley (ground water not confined under pressure) are usually dug. In
the part of the valley that is underlain by the clay confining bed, dug
wells penetrate only the surficial water-bearing material that lies
above the clay bed. Water-table conditions are also encountered in the
part of the valley lying north, northeast, and east of the upper edge of
the clay confining bed. (See pi. 36.) Most of the wells in this area
are dug. Figure 21 shows the ground-water conditions in various parts
Water-table conditions above day bed
valley fill probebjy consistin F irregular lenticular beds of clay, sand,and gravel
chan
Figure 21. Diagrammatic sketch of an ideal east-west section through Ogden Valley, Utah, showing ground-water conditions.
of the valley. The illustration is diagrammatic and is not drawn to
scale. As indicated in the figure, the area underlain by the continuous
clay bed is the artesian area. This Is the area to the southwest of the
dashed line in plate 36. The artesian reservoir Is the ground-water
146824 O 37 4

120 CONTRIBUTIONS TO HYDROLOGY, 1937
reservoir that lies below the continuous clay confining bed. The area
to the north, northeast, and east of the dashed line in plate 36 consti
tutes the recharge area of the artesian reservoir.
Source
The source of all or nearly all of the ground water in Ogden
Valley is the rain and snow that fall upon the valley and upon the
drainage areas of the streams entering the valley. A part of the preci
pitation that falls upon the land surface is carried off through stream
channels, a part evaporates, and the remainder percolates directly into
the ground. Some of the percolating water eventually reaches the ground-
water body. Some of the stream water also percolates through the beds
of the streams and eventually reaches the ground-water body. A part of
the stream flow is diverted from the natural channels and is used for
irrigation. Some of this diverted water reaches the ground-water body
after seeping from irrigation canals, and some of it percolates down
ward after being applied to the land.
None of the water that falls on or is applied to lands in the arte
sian area that is, the area underlain by the confining olay bed-
reaches the artesian reservoir. Tests of permeability were made in the
hydrologic laboratory of the United States Geological Survey on samples
of both disturbed and undisturbed clay of the confining bed, and these
tests all gave coefficients of permeability of less than 0.10, showing
that the clay is essentially impervious. (The coefficient of permea
bility of a material is the rate of flow, in gallons a day, through a
square foot of its cross section, under a hydraulic gradient of 100 per
cent, at a temperature of 60° F.) There exists a considerable artesian
pressure beneath the clay bed, which is greater than the pressure of the
shallow water body above the clay bed, thus precluding any movement of
water downward through the bed. Consequently, the water that penetrates
to the water table in this area becomes a part of the shallow ground-
water body that is separated from the artesian water by the confining
clay bed, whereas the water that penetrates to the water table in the
recharge area (see fig. 21) becomes a part of a ground-water body that
is continuous with the artesian water and recharges the artesian
reservoir.
There has been extensive faulting in the Ogden Valley region, and
it is probable that some deep-seated water is contributed to the

GEOLOGY AHD GROUND-WATER RESOURCES OP OGDEN VALLEY, UTAH 121
ground-water bodies in the valley through cracks and fissures in the
bedrock. However, the quantity of such water is probably small.
Movement
The direction of movement of ground water in Ogden Valley is ap
proximately parallel to the general slope of the land surface in the
valley, which is from the north, northeast, east, and southeast toward
the head of Ogden Canyon. The ground water in the recharge area moves
down gradient toward the upper edge of the clay confining bed. If the
artesian reservoir has been partly depleted, some or all of the water
moving from the recharge area will enter the artesian reservoir, thus
becoming artesian water. If the artesian reservoir is full and in
capable of receiving more water, water from the recharge area will pass
over the upper edge of the clay confining bed and become a part of the
shallow ground-water body above the artesian reservoir.
4960
i!Jli4940 _J
104920Z
^4900
LU
§4880 <h-
hj4860
Z
LU4840 QD
F4820 _l <
4300
ARTESIAN AREA, ARTESIAN CONDITIONS
WellNal WellNal02 Well Na94 WellNa82
Head of ground water October 10, 1934^
^
Head
, :r-~-
^
of ground water May3l.l933 \
^^
v^::<
Approximate of clay conf
RECHARGE AREAWATER-TABLE CONDITIONS
Well No.74
upper edge / ling bed / .
//,>
/ / /
/ / '5 ~ound surface/ / ' /
// / // /'/
0123 DISTANCE IN MILES FROM WELL No.l, ARTESIAN PARK
i,
Figure 22. Profiles between Artesian Park and well 74, Ogden Valley, Utah, showing land surface and levels at which water stood in wells on May 31, 1933, and October 10, 1934.
The available information was not sufficient to construct a map of
the piezometric surface (pressure-indicating surface) in the artesian
area, but figure 22 shows profiles of the piezometric surface, water
table, and land surface between Artesian Park.and well 74 on May 31, 1933,

122 CONTRIBUTIONS TO HYDROLOGY, 1957
and October 10, 1934. The profile on May 31, 1933, shows the conditions
when ground-water levels were at about their highest stage during the in
vestigation. This was before the city of Ogden artesian wells were
pumped with air during the summer of 1933. The profile on October 10,
1934, shows the conditions when ground-water levels were at about their
lowest stage during the investigation. This was shortly after the heavy
summer withdrawals at Artesian Park. Figure 22 shows that the gradient
of the water table in the recharge area, about 84 feet to the mile, was
steeper than the gradient of the piezometric surface in the artesian
area, which was about 17 feet to the mile.
Fluctuations of water level
Ground-water levels and artesian pressures are in an almost con
stant state of fluctuation. These fluctuations are produced by differ
ent causes. Of great significance are the declining water levels or
pressures that indicate discharge from the ground-water body and, con
versely, rising water levels or pressures that indicate recharge of the
ground-water body. Periodic or continuous records of water levels or
pressures, if rightly interpreted, indicate whether the ground-water
body is being built up or depleted, whether it stands at a higher or
lower level than previously, whether a larger or smaller amount of water
can safely be withdrawn, and whether existing developments of ground
water are being damaged by overdraft. For these and other reasons it is
desirable to obtain more or less continuous records of the ground-water
levels in an area, so that the ground-water problems and conditions can
be more clearly understood. Much can be learned from records covering
a period of 1 or 2 years, but it is more desirable to obtain uninter
rupted records over long periods,
Test wells and continuous records. At the beginning of this in
vestigation it was found that no wells existed in which the necessary
records of fluctuations of water level could be obtained. For this
reason, and to obtain accurate records of the nature of the valley fill,
six test wells were drilled in the valley during August and September
1932, at the locations shown in plate 36. At two of these well sites
an additional well was dug to a depth of about 4 feet. Two wells, 68
and 90 feet deep (wells 101 and 102, respectively), were drilled in ad
dition to the dug well at the first site, the three spaced about 50 feet
apart in the form of an equilateral triangle. At the second site, two

GEOLOGY AND GROUND-WATER RESOURCES OP OGDEN VALLEY, UTAH 123
wells, 40 and 108 feet deep (wells 81 and 82, respectively), were
drilled in addition to the dug well, the drilled wells spaced about 50
feet apart and the dug well about 75 feet from the two drilled wells.
At the third site two wells (73 and 74) were drilled 14 and 100 feet
deep and about 50 feet apart. The logs of the six drilled wells are
shown in plate 40. All eight wells were equipped with float-type auto
matic water-level recorders that gave continuous records of the fluctu
ations of the water levels. The casings of the flowing artesian wells
101 and 102 were extended above the surface until the wells ceased to
flow, and the water-level recorders were installed so as to record the
fluctuations of water level representing the piezometric surface.
Recorders were operated on the two dug wells for 16 months and on the
14-foot well at the upper site for 19 months. The records from wells
74, 82, 101, and 102 cover a continuous period of about 33 months
previous to July 1, 1935. The fluctuations of the water level in wells
101 and 102 were generally very similar, differing only in magnitude and
in time of occurrence. This was also true of wells 81 and 82 and of
wells 73 and 74. The hydrograph of only the deepest well at each site
is therefore reproduced in plate 37. These hydrographs are based on the
water level at noon each day, as taken from the continuous instrument
record. In addition to the continuous records obtained from the test
wells, a recording pressure gage was operated on well 50 and a water-
level recorder on well 1 for different periods. The hydrographs ob
tained from these two wells are also shown in plate 37. In conjunction
with the hydrographs of the wells, plate 37 also shows withdrawal of
water at Artesian Park, the precipitation at Ogden, the surface-water
inflow to the valley through the South Pork of the Ogden River, and the
times of major changes in the operation of the wells at Artesian Park.
Periodic measurements. In addition to the wells on which auto
matic recording devices were used, hand measurements of water level
were also made at approximately weekly intervals in 21 other wells dis
tributed throughout the valley. The hydrographs derived from these
measurements are shown in plate 38, in which the flow into the valley
of the South Pork of the Ogden River is also shown for comparison.
Several other miscellaneous measurements were made on other wells, and
these are given in the table at the end of the report.
Annual cycles. The magnitude of the annual cycle depends upon the
amount of recharge and discharge of ground water. Annual cycles of the

124 CONTRIBUTIONS TO HYDROLOGY, 1937
fluctuations of the water table are shown by the hydrograph of well 74
(plate 37) and by some of the hydrographs in plate 38. Similar cycles
of the fluctuations of pressure in artesian wells are shown in plate 37.
During the period of observation the "water level in well 74 had an an
nual cycle of 8 to 9 feet. The records of other water-table wells
showed cycles of about 2 to 30 feet or more. The annual high point of
the water table and artesian pressure occurs during April, May, or June,
depending upon the lateness of the spring thaw and run-off. The hydro-
graph of well 74 (pi. 37) shows two peaks during the spring of 1933.
Comparison of this hydrograph with that of the South Pork of the Ogden
River for the same period shows a marked similarity. The first peak in
the hydrograph of well 74 waa caused by the early apring thaw in Ogden
Valley and in areas of slightly higher altitude adjacent to the valley.
The local run-off resulting from this thaw replenished the ground water
in the recharge area. The second peak was due to the general spring
thaw that occurred later at higher altitudes. As the surface run-off
resulting from this thaw passed over the recharge area the ground water
was replenished. The high peak in the hydrograph of well 74 during
April 1934 was apparently due only to the spring thaw in the valley, be
cause the hydrograph of the South Pork of the Ogden River shows very
little spring run-off as a result of the spring thaw at higher altitudes.
A large amount of water is diverted for irrigation during the
period of the spring run-off, and the application of this water to lands
in the recharge area is in part the cause of the rise of the water table
in the spring. The effect of fall irrigation and fall rains on the
ground-water levels is shown by peaks in the hydrograph of well 74 dur
ing September 1933 and October 1934. (See pi. 37.)
The hydrograph of well 82 appears to have two peaks each year. The
first occurs in April, May, or June and the second in November or De
cember. The causes of the second peak are both artificial and natural.
As shown in figure 23, the withdrawals at Artesian Park noticeably af
fect the water level in well 82. When the rate of withdrawal at Arte
sian Park is increased, the water level in well 82 declines. Converse
ly, a decrease in rate of withdrawals at Artesian Park produces a rise
in water level in well 82. Heavy withdrawals at Artesian Park cease at
about the same time each year that recharge due to fall irrigation and
fall rains occurs, and the individual effects of the two factors on the
ground-water levels cannot therefore be separated. Prom a comparison of

GEOLOGY AND GROUND-WATER RESOURCES OP OGDEN VALLEY, UTAH 125
the discharge at Artesiah Park and tlie hydrograph of well 74 (pi. 37) it
is not apparent whether the withdrawals at Artesian Park affect the
water table in the recharge area. However, prolonged periods of heavy
draft at Artesiai Park would tend to lower that water table.
1933September October
13 14 15 16 17 18 19 20 21 22 23 24 25 26 27 28 29 30 I 2 3456
rf TT TTT T TArrows indicate major changes in discharge of wells
LJ ' It! s^ 9Hf 10
£ "0 12 z n
-^ /
J
/ \\
Wat sr Ic
"N
v<e! i
-
1 Wt II Nc .102
_/"
-fI
/ V
__ *S - /X
-N
^~~ Wat^N
erle
--
3vel
*-
n \A ell r
_^
to a^
?_-- """ ^^ -^
- - _^- "- -w__ -__
siderable limitation near wfell No.74
Figure 23. Discharge from wells at Artesian Park and water levels in three wells in Ogden Valley.
The hydrograph of well 102 (pi. 37) shows the annual cycle broken
by the withdrawal at Artesian Park. It is apparent from the hydrograph
that during the period of record the water level in well 102 never
reached its highest possible point in the spring, because increased sum
mer withdrawals at Artesian Park began while the water level was still
rising. The artesian pressure in well 102 responds very rapidly and
very markedly to any change in rate of withdrawal at Artesian Park.
This is clearly shown in plate 37 and figure 23. The yield of a flowing
well is dependent in part on the artesian pressure in the well, and if
this is reduced as a result of other withdrawals in the vicinity, the
yield of the well will diminish. The hydrographs of wells 1 and 50
(pi. 37) show the pressure on the artesian reservoir at Artesian Park,
the general pressure head under which the withdrawals from nearby wells

126 CONTRIBUTIONS TO HYDROLOGY, 1937
were being made, and the rapid changes in pressure due to changes in
rate of withdrawal.
Water levels during 1925. 1926. and 1928. A few measurements of
the water levels in the wells at Artesian Park were made in 1925, 1926,
and 1928 under the direction of the State engineer. These are shown in
the table of well measurements. The available data concerning the con
ditions governing the withdrawals at Artesian Park at the time of these
measurements are insufficient to allow an accurate comparison with the
measurements made during the present investigation. However, the best
interpretation of the data indicates that the artesian pressures in 1933
may have been slightly greater than those in 1925, 1926, or 1928 but
that the difference was probably not large. It is apparent from the
table of well measurements that the pressure in a well at Artesian Park
is considerably changed when other wells in the field are opened or
closed, or when the air compressors are operated or shut down. This
change is also shown by the hydrographs of wells 1 and 50 in plate 37.
Changes in atmospheric pressure, transpiration by plants, and
evaporation. Daily fluctuations of water level in wells occur in most
localities. During the growing season in Ogden Valley the water level
in shallow wells and the stage of streams fluctuate daily owing to
transpiration by plants and to evaporation. Figure 24 shows fluctua
tions of this type. The water level in well 80, as shown by the hydro-
graph in figure 24, begins to decline in the morning, when the sedges
growing around the well begin drawing qn the ground water. This decline
continues until late afternoon, when plant growth essentially ceases.
The water level then rises until the following morning, when the fall is
again repeated. The hydrographs of the streams given in figure 24 show
similar fluctuations except that there is a lag in time of occurrence.
This lag is presumably a function of the distance of the gaging stations
below the area of transpiration and evaporation.
The water levels and pressures in artesian wells commonly fluctuate
with changes of atmospheric pressure. In some wells such fluctuations
are small, but in others the wells function as perfect water barometers.
Figure 25 shows fluctuations of this type together with the record of
atmospheric pressure at Artesian Park, where a recording barometer was
maintained. The curve showing atmospheric pressure has been inverted
to make the comparison more clear.

FE
ET
O
F W
AT
ER
FE
ET
O
F W
AT
ER
33)
&<§
* CD
CO
"
<*$
CD
PI
CD O
S O
4
ct
p
3
OPS
cnct
P.
CD
CD4
3
H <

128 CONTRIBUTIONS TO HYDROLOGY, 1937
Water-level fluctuations due to transpiration and to changes in
barometric pressure are distinctly different with respect to time of oc
currence. During the midday period the trend is downward on the tran
spiration curve, whereas it is generally upward on the barometric curve.
19 20 22 23 24 25 26 27 28
1932November December
29 30 I 2
0.2
£0.1
I
05
Water level in well
Atmosc neric p ~essun s, invert 3d
Figure 25. Hydrograph of well 81 and graph of fluctuation of atmospheric pressure in Ogden Valley, Utah, showing baro metric type of waters-level fluctuation.
Fluctuations caused by earthquakes.-Another type of fluctuation of
ground-water level that is 4ot frequently observed is that due to earth
quakes. Instrumental record^ of earthquakes in Utah were first obtained
in observation wells during this investigation and a similar investiga
tion by the United States Geological Survey near Salt Lake City. Auto
matic water-level recorders in several wells in Ogden and Salt Lake
Valleys registered water-level fluctuations produced by the earthquake
of December 30, 1932, which centered in western Nevada. On March 12,
1934, an earthquake occurred in Utah with its epicenter about 65 miles
northwest of Ogden Valley, near the north end of Great Salt Lake. This
earthquake consisted of several shocks, and it disturbed ground-water
levels to a considerable extent, although no appreciable permanent
change in the ground-water levels of wells in Ogden Valley was detected
except that in well 74, which was raised and remained about 0.75 foot
higher than before the shocks. Figures 26 and 27 are examples of fluc
tuations of water level produced by earthquakes. This subject is dis-w
cussed in more detail in another paper.
IP/ Leggette, R. M., and Taylor, G. H., Earthquakes instrumentally recorded in artesian wellsi Seismol. Soc. America Bull., vol. 25, pp. 169-175, 1935.

GEOLOGY AND GROUND-WATER RESOURCES OP OGDEN VALLEY, UTAH 129
Comparisons of ground-water levels during 1955. 1954. and 1955.-The
effects of the drought of 1933-34 are shown in the hydrographs of all
wells that were measured. The lowest water levels during the period of
Investigation occurred in September or October, 1934. The quantity of
water available for ground-water recharge in the spring was very small;
9 10 16
Figure 26. Hydrographs of five wells in Ogden Valley, Utah, showing fluctuations of water levels in wells caused by earthquakes on March 12, 1934.
consequently there was but little recharge, and the period during which
it occurred was short.. This, together with heavier withdrawals, pro
duced a greater and more rapid decline of ground-water level than usual
during the summer of 1934. However, a comparison of the water levels
during February or March (the period just before recharge occurs in the
spring) of 1933, 1934, and 1935 shows that the ground-water levels were
about the same each year or slightly higher in 1935. The water level in
well 74, in the recharge area, in February 1935 was about 2.25 feet
higher than in February 1934 and about 3 feet higher than in

130 CONTRIBUTIONS TO HYDROLOGY, 1937
February 1933. In February 1935 the water level in well 82, near the
upper edge of the artesian area, was about the same as In February 1934
and about 1.5 feet higher than in February 1933. The water level in
well 102, near Artesian Park, in February 1935 was about 2 feet lower
than in February 1934 and about 2-| feet lower than in February 1933.
Figure 27.--Graph from recording pressure gage operating on a 133-foot artesian well in Ogden Valley, Utah, showing effect of earthquake of March 12, 1934.
The water level in this well is directly affected by the withdrawals at
Artesian Park, and, as these withdrawals were greater in 1933 than in
1932 and still greater in 1934, it was to be expected that the water
levels in wells near the park would reflect the amount of withdrawal in
the preceding period. Thus, notwithstanding the drought and heavier
withdrawals during 1934, the ground-water levels before the 1935 spring
recharge stood at about the same level as during the same periods in
1934 and 1933, except in the vicinity of the heavy withdrawals. More
over, the water table in the recharge area stood higher in February of

GEOLOGY AND GROUND-WATER RESOURCES OP OGDEN VALLEY, UTAH 131
each succeeding year from 1933 to 1935. These records are indicative of
the reliability of the ground-water supplies in general and show that
the ground water in Ogden Valley was not exceptionally depleted nor
dangerously lowered during 1934. With normal recharge during the spring
of 1935, the ground-water supply in Ogden Valley should have been as
plentiful or more plentiful than at any time during the period of this
investigation.
Summary. The following conclusions have been reached from a study
of the available hydrographs showing the fluctuations of water level in
wells in Ogden Valley: (1) The annual fluctuations range from a few
feet to more than 30 feet, according to location, recharge, and dis
charge. (2) The period of high ground-water levels occurs during April,
May, or June of each year, the time of the highest levels varying some
what from year to year with the time of spring recharge. (3) The annual
period of low ground-water levels occurs in the later part of the winter
unless unusual conditions prevail. (4) Ground-water levels rise as a
result of recharge from irrigation as well as from precipitation and
seepage from streams. (5) The withdrawals at Artesian Park probably af
fect artesian pressures in the entire artesian reservoir and also to
some extent the level of the water table. (6) Because of the heavy sum
mer withdrawals at Artesian Park, the maximum artesian pressures that
would naturally.result from spring recharge are never attained in the
vicinity of the park. (7) The ground-water levels before the spring
recharge were about the same in 1935 as in 1934 and 1933, notwithstand
ing the drought and the heavier withdrawals in 1934. The water table in
the recharge area was higher in February 1935 than in February of either
1933 or 1934.
Recharge
The ground-water reservoirs of Ogden Valley are recharged in part
by water that falls as rain or snow on the valley and excess irrigation
water and in part by water that seeps from the channels of surface
streams and irrigation canals. The water that sinks to the water table
above the impervious clay bed that covers the artesian reservoir becomes
a part of the shallow ground-water body but does not reach the artesian
reservoir. The water that sinks to the water table in the recharge area
becomes a part of the ground-water body in this area with water-table
conditions. This body of water is continuous in its upper part with the

132 CONTRIBOTIONS TO HYDROLOGY, 1937
shallow water body lying above the confining bed and in its lower part
with the artesian reservoir. (See fig. 21.) This water is In part dis
charged by evaporation and transpiration, in part by seepage into the
streams, and In part by percolation into the artesian reservoir or into
the shallow water body above the confining bed.
Seepage from streams. Seepage from streams is probably the chief
source of ground-water recharge. This type of recharge was well shown
by a test made on the South Pork of the Ogden River during the summer of
1925 by H. W. Browning, of the office of the State engineer. On July 20,
all the water In the South Pork was being diverted at the mouth of South
Pork Canyon for Irrigation, and the channel of the stream was dry for a
distance of more than 2 miles below the diversion. Water began to flow
in the channel again at a point about half a mile southeast of Hunts-
ville. On that day about 34 second-feet of the flow at the mouth of the
canyon was turned back Into the dry creek channel. Two days later the
water had reached a point only about a mile below the place of diver
sion, and more than a mile of the channel still remained dry. On July
23, 1925, 43 second-feet was flowing In the stream channel just below
the point of diversion at the mouth of the canyon, but the flow at a
point approximately 1 mile farther down the channel was only about 25
second-feet, showing a loss of about 18 second-feet In 1 mile of chan
nel. The water in the stream also still lacked about 3,000 feet of
reaching the point of return flow in the channel. On July 31, when the
conditions of flow and seepage were still about the same as on July 23,
the entire flow of the South Fork, about 49 second-feet, was turned into
its channel, all diversions being stopped. On August 1 it was found
that only 10 second-feet finally reached the point of return flow. Thus
there was a loss of about 39 second-feet through the 2-mile section of
channel. This loss was a contribution to the water table in the re
charge area.
At no time during the winter of 1933-34 was the flow continuous in
the channel of the South Pork in Ogden Valley that is, there were dry
stretches of stream channel. The diversions during the winter were not
measured but did not generally exceed 8 second-feet and during some
parts of the season were less than 5 second-feet. During November and
December, 1933, and January, February, and a part of March, 1934, the
flow of the South Pork at the United States Geological Survey gaging
station Just above the mouth of the canyon ranged from about 35 to 45

GEOLOGY AND GROUND-WATER RESOURCES OP OGDEN VALLEY, UTAH 133
second-feet. (See plates 37 and 38, in pocket.) The recharge to the
ground-water body from the channel seepage of the South Pork was there
fore about 30 to 35 second-feet during the winter of 1933-34. When the
entire flow of the South Pork at the mouth of its canyon is not diverted
for irrigation there is ground-water recharge from channel seepage proba
bly amounting to a maximum of about 40 second-feet.
Similar conditions exist in the channels of the Middle and North
Porks of the Ogden River, although the amount of ground-water recharge
from each of these streams is probably less than that from the South
Pork. Several smaller streams that flow into Ogden Valley contribute
smaller amounts of ground-water recharge in a like manner, especially
during the spring run-off,
Penetration of precipitation and irrigation water. The surface
materials in Ogden Valley, especially those in the recharge area, are
sandy and permeable in most places. Thus the conditions are very
favorable for the rapid penetration of rain or melting snow. Some of
the slopes of the mountains that surround the valley drain directly
onto the valley floor and not into the adjoining streams. The rain
falling on these slopes and the water from melting snow on them produce
many small streams for short periods, and these streams rapidly flow
onto the valley fill, into which the water sinks. A major part of this
water becomes ground water. The permeable surface material also per
mits the rapid penetration of excess irrigation water as well as seepage
from the irrigation ditches and canals. When the irrigation water is
sparingly applied the ground-water recharge from this source is small.
However, during the early part of most irrigation seasons there is a
copious supply of water, and most irrlgators therefore overirrigate
rather than underirrigate, with the consequent penetration of relatively
large quantities of water beyond the reach of evaporation and transpira
tion. The water thus lost from overirrigation becomes a part of the
ground-water body. It is well known by the farmers in the valley that
the discharge of low-lying springs increases soon after the lands above
the springs have been heavily irrigated and that the water levels in
wells rise rapidly soon after the lands in the vicinity have been irri
gated. This rise of ground-water level is evident from the hydrographs
of the observation wells shown in plate 38 and the hydrograph of well
74 shown in plate 37. A more detailed example of ground-water recharge
from irrigation is shown by the hydrograph of well 74 in figure 23.

134 CONTRIBUTIONS TO HYDROLOGY, 1937
Quantitative estimate. The water levels in several wells in the
valley were measured at weekly intervals for a period of about a year,
beginning in October 1932. Eight of these wells are in the recharge
area that is, in the area which is not underlain by the confining bed.
The recharge period of the year ending September 30, 1933, may be re
garded as extending from November 1932 to June 1933, but the principal
rise in the water levels occurred in the spring, as is shown in plate
38. The following table gives the pertinent data relating to the rise
of water levels.
Rise of water levels in observation wells in the recharge area of Ogden Valley during the recharge period from
November 1932 to June 1933.
Drainage area and well
South Pork:
Middle Pork
136
139
146
65
71
75
Rise of Average rise water level of water level
(feet) (feet)
10
21 . 14
12
3
4 5
8
Approximate area (acres)
3,500
1,800
Lower North Fork:
59
Upper North Pork:
56
Weighted average
Total
30 30
13.5
1,700
1,600
8,600
A study of the well records and other data led to the conclusion
that the average specific yield of the valley fill in the b/elt of water-
table fluctuation in the recharge area is probably about 20 percent, or,
more specifically, that a rise in the water table of 5 feet represents a
storage of about 1 foot of water. On this basis the weighted average
rise of 13.5 feet represents an increase in storage equal to a layer of
water 2.7 feet thick covering the entire recharge area of about 8,600
acres, or about 23,000 acre-feet. The total recharge in the valley dur
ing the year included not only this increase in storage but also the dis
charge during the period of rise, the recharge during the period of
declining water table, and the recharge of the shallow valley fill

GEOLOGY AND GROUND-WATER RESOURCES OF OGDEN VALLEY, UTAH 135
overlying the confining "bed "by precipitation and irrigation on that fill.
This method appears to give a larger ground-water supply than the dis
charge method described later in this report, suggesting that the esti
mate of specific yield may be somewhat too high. It is, however, of
great value in giving independent evidence of large annual recharge and
a large perennial supply of ground water.
Water spreading. The fact that water applied to the surface of the
land in the recharge area penetrates the soil so readily that ground-
water recharge takes places suggests a practical method of artificially
recharging the artesian reservoir. Successful recharging of the ground
waters of southern California has "been accomplished in recent years "by all/
method termed "water spreading". This method consists of diverting
the water from streams during flood stages, or at other times when the
water is not "being used, and applying it to the surface of the land in
the recharge areas of the ground-water bodies. Several variations in
the details of the application of the water have been used, some more
successful than others. It is probable that the water-spreading method
could be used to good advantage in Ogden Valley.
In addition to the benefits derived from naturally or artificially
recharging a depleted ground-water reservoir, surplus water is placed in
ground storage, and this results in a greater stream flow later in the12/
season when water is most needed. Fortier called attention to the
fact that the surface outflow from Ogden Valley was greater than the in
flow (the difference increased during the summer of 1894) and that this
was no doubt the result of the diversion and penetration of large quan
tities of water in the early part of the season, when water was abundant.
Large amounts of water were used for irrigation on the higher lands in
the early part of the season, and this excessive irrigation resulted in
the storage of large amounts of water in the ground, which later seeped
out and returned to the stream channels.
Surplus water in the spring can still be placed in ground storage
by heavy early irrigation or by the more modern methods of water spread
ing. The benefits to be derived from water spreading in Ogden Valley
are as follows: Spring flood water that otherwise may be wasted will be
ll/ Lane, D. A., Increasing storage by water spreading: Am. Water WorksTssoc. Jour. vol. 26, no. 4, pp. 421-429, 1934; Surface spread ing operations by the basin-method and tests on underground spreading by means of wells: Am. Geophys. Union Trans.. 15th Ann. Meeting, pt. 2 pp. 523-527, 1934.
12/ Fortier, Samuel, Preliminary report on seepage water and the underflow of rivers: Utah Agr. Coll. Exper. Sta. Bull. 38, p. 21, February 1895.

136 CONTRIBUTIONS TO H1CDROLOGY, 1937
conserved; the water table in the recharge area of the artesian reser
voir will be maintained at a higher level, and pressures in the artesian
reservoir will therefore be greaterj and the stream flow from the valley
will be increased during the summer, when the water is most needed for
irrigation, because excess water will have been put into ground storage.
Discharge
Both natural and artificial discharge of ground water take place in
Ogden Valley. Natural discharge occurs as flow from springs, return
flow to streams, evaporation from soil, and transpiration by plants.
Artificial discharge occurs by the withdrawal of water from flowing and
nonflowing wells.
Shallow water body above artesian confining bed. In the lower
parts of Ogden Valley the stream channels lie about 80 feet below the
4,900-foot bench. The stream valleys have been cut into about the top
25 feet of the clay confining bed. Along the sides of the stream val
leys spring seepage occurs at many places at the contact of the clay bed
and the overlying sand and gravel. This seepage is discharge from the
shallow ground-water body above the artesian confining bed. In the
lower areas the ground water lies at relatively shallow depths, and a
large amount of water is dissipated by plant transpiration. This is
very noticeable at many places along the contact of the clay bed and
the overlying sand and gravel, where vigorous growths of cattails and
associated plants occur, even on the steep slopes flanking the stream
valleys. In the lowest areas of the stream valleys the shallow ground-
water body lies very close to the surface, and the water table probably
fluctuates with the level of the water in the streams. In these areas
there is a large discharge of ground water by transpiration, the areas
supporting many willows, cattails, and associated plants, and considera
ble ground water is also lost by evaporation from the soil.
On the 4,900-foot bench, between the stream valleys, in the area
underlain by the artesian confining bed, ground water occurs at rela
tively shallow depths and supplies the seepage that takes place along
the contact of the clay bed and the overlying sand and gravel along the
flanks of the stream valleys. Only small amounts of water are evapo
rated directly from the soil in this area, but somewhat larger amounts
are transpired by trees and by other deep-rooted plants. Water for
domestic supplies is withdrawn from several shallow dug wells in this

GEOLOGY AND GROUND-WATER RESOURCES OP OGDEN VALLEY, UTAH 157
area, but the total withdrawal Is small. Much of the increase In flow
of the streams in the area underlain by the clay confining b«d is
derived from the shallow ground water above the confining bed.
Recharge area. The water table in the recharge area lies at vary
ing depths below the ground surface, the depths increasing toward the
foot of the mountains. In some parts of this area transpiration by
trees and other plants occurs, but in general the losses by transpira
tion and evaporation are relatively small. Most of the ground-water
discharge occurs by percolation into the artesian reservoir, percola
tion into the shallow ground-water body above the artesian confining
bed, and seepage into the streams. The springs at the head of Hunts-
ville Spring Creek are regarded as discharge from this water body.
The amount of artificial discharge from the recharge area is very
small, because only a few shallow dug wells are used for domestic sup
plies. During the summer of 1954 five large pits were dug in the re
charge area by power shovel to provide irrigation water for the relief
of drought conditions, but although water was obtained at relatively
shallow depths, the total amount of water pumped from the pits was
rather small. The Wangsgard sump, in the m% sec. 21, T. 6 N., R. 2 E.,
had been dug and used in previous years, but it was enlarged in 1934.
The water level in this sump stood about 20.5 feet below the surface on
September 10, 1934. The water level in a second sump, dug in the
MW^SWi sec. 21, T. 6 N., R. 2 E., stood about 10.5 feet below the sur
face on September 15, 1934. According to reports, about 1.25 second-
feet was pumped from this sump during a period of about 3 weeks in late
June and early July, 1934. The water level in a third sump, dug in the
SEiSEj sec. 31, T. 7 N., R. 2 E., stood about 12.5 feet below the sur
face on September 15, 1934. A fourth sump, in the SW-jNE^ sec. 14,
T. 6 N., R. 2 E., was about 20 feet deep, but it was dry on September
13, 1934.
Artesian reservoir,- The amount of water lost from the artesian
reservoir by upward movement through the clay confining bed is small.
Laboratory determinations of the permeability of the clay bed showed
that its coefficient of permeability was less than 0.10, and the bed is
considered to be essentially impervious.
Some water may percolate from the artesian reservoir into the head
of Ogden Canyon. The altitude of the bottom of the clay confining bed
in wells 101 and 102 is about 4,777 feet above sea level. The altitude
of the bedrock at its lowest point at the Pine View dam site, about a
mile downstream from the head of Ogden Canyon, is about 4,680 feet above

138 CONTRIBUTIONS TO HYDROLOGY, 1937
confining bed lies at least 50 feet above the bedrock channel at the
head of the canyon. This condition apparently allows the escape of some
water from the artesian reservoir through a relatively narrow section at
the head of the canyon, over the bedrock and under the clay confining
bed. It could not be determined whether the Pioneer Dam has a cut-off
wall that extends to bedrock. If such Is the qase, there would be no
underflow beneath the dam. That such underflow, If any exists, Is small
Is Indicated by a series of stream-flow measurements made on the Ogden
River through Ogden Canyon on September 20, 1934. (See pp. 114-116.)
The entire flow of the Ogden River at the mouth of Its canyon, amounting
to 14.3 second-feet, was return flow below the Pioneer Dam, which Is
just below the Pine View dam site. Of this flow, only about 3.8 second-
feet was return flow within about 1 mile below the Pioneer Dam. The re
maining 4 miles of channel showed a more or less consistent gain through
its entire length. The gain In flow of the Ogden River as It passes
through the canyon Is chiefly the result of ground-water seepage from
the bedrock canyon walls, or perhaps in part from pipe-line leakage.
A certain amount of variation in rate of gain is to be expected, because
the canyon walls consist of different kinds of rock.
It is not definitely known whether the clay confining bed at the
west and south margins of the artesian reservoir Is In close contact
with the bedrock of the adjacent mountains. However, near the head of
the canyon there are exposures of the clay only a short distance from
the bedrock of the mountains, and therefore the escape of water from
the artesian reservoir along this contact Is probably not large.
If there is little underflow beneath the Pioneer Dam, water that
is discharged from the artesian reservoir in the narrow section beneath
the bottom of the clay bed and In the bedrock channel at the head of
the canyon must nearly all come to the surface in the lower parts of the
valley or the upper part of the canyon above the Pioneer Dam. This Is
also true of the water that is discharged along the contact of the clay
bed and the bedrock of the mountains at the west and south margins of
the artesian reservoir. This discharge from the artesian reservoir be
comes a part of the shallow ground-water body in the lower part of the
valley and eventually seeps into streams, evaporates, or is transpired
by plants.
As shown by the hydrographs in plate 39 (in pocket), the total
stream flow from the valley was greater during the period August to

GEOLOGY AND GRODKD-WATER RESOURCES OF OGDEN VALLEY, UTAH 139
November, 1933, than the sum of the flow of the North, Middle, and South
Forks and Huntsville Spring Creek above Artesian Park for the same
period. However, during the period June to September, 1934, the reverse
was true. At times the transpiration and evaporation losses in the
lower part of the valley are large, and this might account for the total
surface-water outflow from the valley being less than the combined flow
of the tributary streams as measured above Artesian Park. However,
there is considerable return flow to streams in the lower part of the
valley, and at auch times it is to be expected that the surface-water
outflow from the valley would be greater than the combined flow of the
tributary streams as measured above Artesian Park. It seems safe to
conclude that except during flood periods the difference in flow at the
head of the canyon and the combined flow of the tributary streams as
measured above Artesian Park is generally small and can be accounted for
by transpiration and evaporation or by return flow by seepage from the
shallow ground-water body above the clay confining bed. The stream-flow
data as analyzed above seem to indicate that the natural discharge from
the artesian reservoir by seepage beneath the clay confining bed or
along its western and southern edges is not large.
The presence of high-level springs that issue from the mountains at
the west side of the valley shows that the ground water in the bedrock
of the mountains stands at considerably higher altitudes than the ground
water in the valley fill. Ground water in the bedrock of the mountains
is therefore moving toward the valley, and this precludes any leakage of
ground water from the valley through the mountains.
After consideration of all the factors bearing on the natural dis
charge from the artesian reservoir it is believed that such discharge is
not in excess of about 5 second-feet.
Artificial discharge from the artesian reservoir occurs chiefly by
the flow from artesian wells. Very little if any discharge occurs
through pumped artesian wells, except the wells that are pumped with air
at Artesian Park. Several small-diameter flowing wells are used for do
mestic supplies at a few farm homes, but as these wells are few and of
small yield, the total amount so discharged is relatively small. It may
be assumed to be 1 second-foot (about 700 acre-feet a year). Next to
that of the municipal wells of Ogden at Artesian Park, the largest with
drawal by wells is made by the J. G. Read & Bros. Co. Pish Hatchery
(wells 86 to 95). The total flow from these wells was 688 gallons a
140 CONTRIBUTIONS TO HYDROLOGY, 1937
minute (1.53 second-feet) on June 13, 1934. (See table of well records.)
This discharge of course varies with the artesian pressure in the wells.
The artesian pressure at the time of the measurement on June 13, was
about an average of the pressures in these wells during the summer of
1933. (See pi. 38.) During September 1934 the pressure had decreased
so that the flow of the wells was reduced by one-half or two-thirds.
The withdrawal from the artesian reservoir by the wells at Artesian
Park constitutes the largest artificial discharge from the artesian
reservoir. Of the 51 wells at Artesian Park, all but 3 are connected to
a collecting system that supplies the city of Ogden with its municipal
water. During a part of each year some additional municipal water is ob
tained from Wheeler Creek, which enters the Ogden River just below Pine
View Dam, and two smaller creeks that enter the river farther down the
canyon. However, the flow from these creeks is very small during the
summer, and the artesian wells therefore constitute the main water sup
ply for Ogden, a city with a population of about 40,000. The rate of
withdrawal from the wells at Artesian Park can be regulated by control
ling works at the wells. About 19 of the wells are individually
equipped with valves by which they can be closed or opened. Twenty-five
wells are equipped with concrete catch basins around the well casings
and can be made to flow into the catch basins over the tops of the cas
ings, 4 or 5 feet above the surface. The catch basins drain by gravity
into the collecting system. Wells flowing in this condition have, in
local parlance, been "turned over." By means of valves, 22 of these 25
wells can be turned into the system at about 1 foot above the land sur
face, thereby increasing the natural flow. Wells flowing in this condi
tion have, in local parlance, been "turned under." The 25 wells
equipped with concrete catch basins and 3 other wells not so equipped
can be pumped with compressed air furnished by five air compressors.
The rate of withdrawal by the wells at Artesian Park ranged from about
13.3 to 20.5 second-feet during 1933 and from about 12.9 to 20.0 second-
feet during 1934. (See pi. 37.) The total discharge, as measured through
a venturimeter, was about 11,500 acre-feet during the calendar year 1933
and about 11,800 acre-feet during the calendar year 1934. This is
equivalent to an average yearly rate of withdrawal of 15.9 second-feet
during 1933 and 16.3 second-feet during 1934. During July, August, and
September, 1933, the withdrawal was 3,300 acre-feet, and during the cor
responding period in 1934 the withdrawal was 3,420 acre-feet.

GEOLOGY AND GROUND-WATER RESOURCES OP OGDEN VALLEY, UTAH 141
Quantitative estimate. The discharge from the wells at Artesian
Park during the year ending September 30, 1934, was about 11,750 acre-
feet, and the total withdrawal from other wells in the valley has been
estimated at about 1,700 acre-feet. During that year the total quantity
of surface water discharged from the valley was about 27,400 acre-feet.
The only continuous flow through the stream channels in the valley dur
ing that year occurred through the North and Middle Porks from about
March 5 to May 15. It is estimated from the hydrographs in plate 39
that of the total flow of these streams in this period about 16,800
acre-feet was direct surface run-off, the rest being derived from
ground water that seeped into the streams in the lower part of the
valley. Therefore, the total discharge of ground water from the valley
during that year, exclusive of that lost by transpiration, evaporation,
and underflow at the Pioneer Dam, amounted to about 24,000 acre-feet.
Plate 5 of a manuscript report on the Ogden Valley reclamation
project, by E. 0, Larson, of the Bureau of Reclamation, dated August
1932, is a map of Ogden Valley on which the different types of land are
shown. One of the types is designated "pasture and water-logged.'1 The
areas so mapped are the lower parts of the valley, in which transpira
tion and evaporation are active during the growing season. These areas
comprise about 2.5 square miles. If the yearly transpiration and
evaporation is assumed to be 12 inches (a reasonable assumption) the
annual loss by this means amounts to about 1,600 acre-feet (2.2 second-
feet) .
The natural discharge from the artesian reservoir by seepage be
neath the clay confining bed and by seepage along its western and
southern edges is believed not to exceed 5 second-feet. However, some
of this water is returned to the streams in the lower parts of the val
ley, and this amount has already been taken into account in the esti
mates of stream flow made above. Therefore, there remains only the part
that percolates under the Pioneer Dam as underflow. From the stream
measurements made in Ogden Canyon on September 20, 1934, it is believed
that this underflow does not exceed about 3 second-feet (about 2,100
acre-feet a year).
Prom the measurements and estimates given above the total ground-
water discharge during the year ending September 30, 1934, is computed
to be about 27,700 acre-feet.

142 CONTRIBUTIONS TO HYDROLOGY, 1937
Quality
The amount and character of dissolved mineral matter in the ground
water of Ogden Valley are shown in a general way by some of the analyses
made by E. W. Lohr, of the United States Geological Survey, which are
given in the table at the end of the report. Eight samples of stream
water were examined for comparison with the ground waters.
The analyses give no indication of the sanitary condition of the
waters but indicate that the waters would be generally satisfactory for
domestic use and for most industrial uses, so far as such uses are af
fected by the dissolved mineral matter. Some of the waters are harder
than is desirable for certain purposes.
The fluoride content of samples from seven wells was determined by
Margaret D. Poster, of the United States Geological Survey. The pres
ence of fluoride in drinking water has been correlated with the occur-13/
rence of mottled enamel of the teeth of young children. Although no14/
exact limit can be set, it has been reported by Smith that occurrences
of mottled enamel have not been associated with the use of waters con
taining less than 1.0 part per million of fluoride. The range from 0.4
to 1.1 parts per million in the five samples of water from Ogden Valley
in which fluoride was present suggests that these waters are not likely
to be objectionable on account of their fluoride content.
PINE VIEW DAM AND RESERVOIR
General features
At the time of writing (1935) the United States Bureau of Reclama
tion is constructing an earth-fill dam on the Ogden River above the
mouth of Wheeler Creek, a short distance below the head of Ogden Canyon.
(See pi. 36, in pocket.) The water impounded above this dam (41,000
acre-feet) will be used for power and irrigation and possibly for other
purposes. The water level in the reservoir when it is full will be
4,871 feet above mean sea level, United States Geological Survey datum.
The shore line of the reservoir at its high stage is shown in plate 36
by a faint dotted line. The wells at Artesian Park are in the reservoir
13/ Dean, H. T., Distribution of mottled teeth in the United States: U. S. Dept. Public Health Rept., vol. 40, no. 25, pp. 703-734, June 1933.
14/ Smith, H. V., The determination of fluoride in drinking water: Ind. and Eng. Chemistry, vol. 7, p. 33, 1935.

GEOLOGY AND GROUND-WATER RESOURCES OP OGDEN VALLEY, UTAH 143
site and will be covered with 30 to 40 feet of water when the reservoir
is full. Provisions have been made whereby the flow from the wells will
be piped through the reservoir and dam and into the conduit leading to
Ogden. The wells at Artesian Park will be equipped with an air-vent
system to prevent air locking. Because the compresaed-air pumps cannot
be used after the reservoir is filled, the overflow points of the wells
will be lowered about 4 or 5 feet, so as to increase the drawdown on the
wells and thus to increase their potential discharge. Although the
point of discharge below the dam will be lower than the overflow points
of the wells, there will be no siphon action, because of the air-venting
system.
Probable effects upon the artesian reservoir
The filling of the Pine View Reservoir will create a unique situa
tion in that a large additional load, equal to the weight of water in
the surface reservoir, will be superimposed on top of the clay confining
bed. As the clay bed is essentially impervious, the amount of water
that moves upward through it and thereby escapes from the artesian
reservoir is, under existing conditions, practically negligible. When
the Pine View Reservoir is filled the additional head of water will re
verse the direction in which the water will tend to move through the
confining bed, but even if the surface reservoir should remain full at
all times, the amount of water entering the artesian reservoir, by seep
ing through the clay confining bed, would be very small. Actually the
surface reservoir will be alternately filled and emptied, and its head
of water will be greater than that of the artesian water only a part of
the time. This alternation will normally occur once each year. The
clay confining bed is believed to underlie the entire area indicated in
plate 36 with no openings other than the pores between the clay parti
cles through which water can move. The areal extent of the clay bed is
greater than that of the surface reservoir. Consequently, if adequate
precautions are taken to prevent leakage of the surface-reservoir water
around the existing well casings, and if all abandoned wells are ade
quately plugged, there will be no appreciable leakage of surface water
into the artesian reservoir.
When the surface reservoir is filled the additional load on the
confining bed will cause the artesian water-bearing beds to be slightly
compressed, thereby increasing the artesian pressure and the discharge

144 CONTRIBUTIONS TO HYDROLOGY, 1937
from the artesian wells. Conversely, when the surface reservoir is
emptied the artesian water-bearing beds will expand slightly, and the
artesian pressure and discharge from the artesian wells will be de
creased. If the surface reservoir were rapidly filled or emptied the
resulting change in rate of discharge of the artesian wells might be
rather noticeable. However, the period during which the reservoir is
filled or emptied will generally extend over a week or more, and it is
doubtful whether a change in rate of discharge from the artesian wells
will be apparent. Moreover, the filling of the surface reservoir will
generally occur during the period of spring run-off, and this will be
at about the same time that ground-water recharge is taking place and
the artesian pressure is increasing. Conversely, the artesian pressure
will be decreasing at the same time that the surface reservoir is being
emptied. Thus the tendency will be to increase the annual fluctuation
of artesian pressure, but it will probably be difficult to differentiate
between the two causes of the increased or decreased artesian pressure.
It is theoretically probable that the compression of the artesian water
bearing beds resulting from the filling, of the surface reservoir will to
some extent decrease the permeability of the water-bearing sand and
gravel and thus proportionately decrease the discharge from the artesian
wells. It is believed, however, that the net change of rate of artesian
discharge produced by the operation of the surface reservoir will not be
of great practical importance.
RELATION OF ARTESIAN DISCHARGE TO STREAM PLOW
During a considerable part of each year, chiefly in the spring, the
stream water that enters Ogden Valley seeps into the stream channels.
This water constitutes a large part of the ground-water recharge. Far
ther downstream water appears in the dry'^stream channels and continues
to flow for the remainder of the stream courses. This water is ground-
water run-off, or discharge from the ground-water body, either directly
from the recharge area or from the shallow fill above the confining clay
bed. "During periods of the year when there is continuous flow through
the streams- that is, when there are no dry stretches of stream channel-
the ground-water run-off is probably as great as during periods when
parts of the stream channels are dry, if not greater.
From figure 21 it may be seen that if the water table were to de
cline below the upper edge of the clay confining bed, none of the water

GEOLOGY AND GROUND-WATER RESOURCES OF OGDEN VALLEZ, UTAH 145
seeping from the recharge area would reach the shallow water body above
the clay bed. Under these conditions the artesian reservoir would be
unwatered near its upper edge and this unwatered space would receive all
the percolation from the recharge area until it became filled. There
after the shallow water body .above the clay bed would again receive
water from the recharge area. During the period from July 1933 to Sep
tember 1934 frequent determination was made of the location of the
points at which seepage began to appear in the channels of the three
tributaries of the Ogden River. These points move upstream when ground-
water levels rise and downstream when ground-water levels decline.
During 1933 the lowest points at which seepage began on the Middle and
South Forks were somewhat upstream from the edge of the clay confining
bed, as shown by the dashed line in plate 36, but on the North Fork the
lowest point was about half a mile downstream from the edge of the con
fining bed, as shown in plate 36. During 1934 the lowest points were
about half a mile downstream from the indicated edge of the clay bed on
the Middle and South Forks and about a mile downstream on the North
Fork. As previously stated, the upper edge of the clay confining bed
is not absolutely definite, and its position is shown only approxi
mately in plate 36. However, the points at which seepage began indi
cate that at the low stage in 1934 there was little or no discharge
from the recharge area directly into the streams and probably not much
into the shallow water body overlying the confining bed. The bottom
of the clay confining bed in wells 81 and 82 is about 4,840 feet above
sea level, whereas the water level in well 82 at its lowest stage dur
ing 1934 (Oct. 5, see pi. 37) was about 4,866 feet above sea level, or
about 26 feet above the bottom of the clay bed. The available evidence
indicates that if there was any unwatering of the artesian reservoir
during 1934 it was slight.
Before any artesian wells were drilled by the city of Ogden the
water table throughout the valley doubtless rose as a result of re
charge each spring and declined later in the season when the rate of
discharge by seepage into the streams and by evaporation and transpira
tion exceeded the rate of recharge, but the water in the artesian part
of the underground reservoir the part confined under the clay bed was
essentially in dead storage. When the artesian wells were put into
use the artesian part of the underground reservoir became functional.

146 CONTRIBUTIONS TO HYDROLOGY, 1937
Thus the drilling of the artesian wells is to some extent analogous to
the building of a surface reservoir.
The utilization of the artesian reservoir has inevitably resulted
in a somewhat greater seasonal lowering of the water table than would
otherwise have occurred. Therefore, it has also resulted in a diminu
tion of the stream flow derived by seepage, the difference being least
at the high stage of the water table, in late spring or early summer,
and greatest at the low stage, in late fall and early winter. The re
charge during the winter and spring of any year has been increased over
what it would otherwise have been, partly because of the lower level of
the water table at the beginning of the recharge period and partly be
cause of the withdrawal of water through the artesian wells during the
period. In wet years the water table has probably been restored by the
end of the recharge period nearly to the level it would have attained
if there had been no artesian development, but in dry years the differ
ence has doubtless been greater. During the summer and fall of each
year the decline of the water level has been expedited by the with
drawal through artesian wells, but with considerable lag caused by the
elasticity of the water-bearing material in the artesian reservoir.
There is at present an essential balance between average annual
discharge and average annual recharge, as there doubtless was before any
artesian wells were drilled, the withdrawal through artesian wells being
compensated chiefly by increased recharge and decreased ground-water
run-off. The increase in recharge occurs chiefly during the period of
rising water levels in winter and spring; the decrease in ground-water
run-off chiefly during the period of low water levels in fall and winter.
Unless there should in the future be heavy pumping from wells in
the recharge area, the artesian water supply will be perennially ade
quate for at least the present rate of consumption. Moreover, somewhat
greater utilization of the artesian reservoir would be possible by mak
ing heavier withdrawals at times when the water is needed and inducing
greater recharge at times of surplus water.
WELL RECORDS
Records of 146 wells in Ogden Valley are given in the table below.
This table includes nearly all the wells in the valley at the time of
this investigation. The locations of the wells are shown in plate 36
(in pocket). Of the 146 wells 70 are flowing artesian wells, 51 of

GEOLOGY AND GROTJND-WATER RESOURCES OF OGDEN VALLEY, UTAH 147
which, are located at Artesian Park and furnish the municipal water sup
ply for the city of Ogden, With the exception of the artesian wells,
most of the wells shown in plate 36 are shallow dug wells. The average
depth of 63 dug wells is about 21 feet, and their diameter ranges from
about 3 to 5 feet. The depth of the flowing wells at Artesian Park
ranges from 85 to 600 feet, and that of the 3 deepest wells is 475, 500,
and 600 feet. The average depth of the other 48 wells is about 140
feet. The diameter of the wells at Artesian Park ranges from 2 to 12
inches, but moat of them are 4 to 6 inches. Most of these artesian
wells are cased throughout their depth, only a few of them having about
the bottom 20-foot section perforated.
The only well logs available for Ogden Valley are those kept by the
city of Ogden for the wells at Artesian Park and the carefully prepared
logs of the 5 test wells put down during this investigation (wells 74,
81, 82, 101, and 102). All the available well logs are shown in plate
40 (in pocket).

148 CONTRIBUTIONS TO HYDROLOGY, 1957
Records of wells in Ogden
No.
1
23456789
10111213141&161718192021222324252627 28 29303132 3334353637383940414243444546474849 5051 52535455 56 57 58 5960
616263
64
Location
SWi sec. 11, T. 6 N., R. 1 E.
....do.......................
....do.......................
....do.......................
....do.......................
....do.......................
....do.......................
....do.......................
....do.......................
....do.......................
....do.......................
....do.......................
....do.......................
....do.......................
....do.......................
....do.......................
. . . .do. ......................
....do.......................NWi sec. 14, T. 6 N., R. 1 E.SW£ sec. 11, T. 6 N., R. 1 E.....do...........................do........................ . . .do. ..........................do...........................do...........................do...........................do....................... ....do....................... ....do...........................do...........................do...........................do....................... ....do...........................do...........................do........................ . . .do. ..........................do...........................do...........................do...........................do...........................do...........................do...........................do...........................do...........................do.......................NWi sec. 14, T. 6 N., R. 1 E.SWi Sec. 11, T. 6 H., R. 1 E.
NWi sec. 14, T. 6 N., R. 1 E. SW| sec. 11, T. 6 N., R. 1 E.
SWi sec. 6, T. 7 N. R. 1 E.SE| sec. 18, T. 7 N. R. 1 E.NEj sec. 19, T. 7 N. R. 1 E.SEi aec . 19 ^ T> 7 N> Rf i Ef NEf sec. 20, T. 7 N. R. 1 E. NWi sec. 29, T. 7 N. R. 1 E. NEi sec. 34, T. 7 N. R. 1 E. SWisec. 35, T. 7 N. R. 1 E.....do.............. ........
....do.......................
....do.......................SE| sec. 2, T. 6 N., R. 1 E.
NEi sec. 2, T. 6 N., R. 1 E.
Owner
Ogden CityCorporation
....do.......
....do.......
....do.......
....do.......
....do.......
....do.......
....do.......
....do.......
....do.......
....do.......
....do.......
....do.......
....do.......
....do.......
....do.......
....do.......
....do.......
... .do. ......
... .do. ......
....do.......
....do.......
....do.......
....do.......
....do.......
....do.......
....do.......
....do.......
....do.......
....do.......
....do.......
....do.......
....do.......
....do.......
....do.......
....do.......
....do.......
....do.......
....do.......
....do.......
....do.......
....do.......
....do.......
....do.......
....do.......
... .do. ......
... .do. ......
....do.......
.... do
.... do .......
....do....... J. R. SouthwickRose E, BaileyW. A. ChadwickA. A. Clark.. John Ward.... Elmer Gardner H. S. Carver.
VirgilStallings..
Chloe Puller.
H. B.Stallings..
M. Fuller
Altitude of surface (feet abovesea level'
d/4,828
4,8294,8294,8294,8294,8294,8294,8294,8294,8294,8294,8294,8294,829
d/4,8324,8304,8304,830
d/4,826d/4,833
4,829d/4,833
4,8284,8284,828
d/4,827d/4,831
4,828 4,8284,8274,8274,827
d/4,8284,8334,833
d/4,8354,8334,8334,8334,8334,8334,8334,8334,8294,829
d/4,8264,8304,830
d/4,826 d/4,829d/4,828
5,4105,2305,1675,167 5,109 5,115 4,966 4,949
4,9444,9394,935
4,9264,926
Depth j (feet)
2/
128
117115116121115110114115112115123115140150
f/145140157100204153200217181188185
f/218 f/173
216107
f/106f/132
246146112
91112
8596
146147143?143?122143600124122500 133475
f / Q Q
I/ 40.7f/ 20.8f/ 10.3, f/ 59.5 T/ 19.0 t/ 37.9 f/ 20.1
f/ 33.4f/ 26.4f/ 19.7
f/ 17.2f/ 15.2

GEOLOGY AND GROUND-WATER RESOURCES OP OGDEN VALLEY, UTAH 149
Valley, Weber County,
Water level(feet above Date of
Diameter or below measure- Remarks No.(Inches) surface) ment
2 +6.7 Dec. 15, 1955 ............................ 1
4 .... ............. ............................ 24 .... ............. ............................ 34 .... ............. ............................ 44 .... ............. ............................ 54 .... ............. ............................ 64 .... ............. ............................ 74 .... ............. ............................ 84 +6.5 Oct. 9, 1953 ............................ 94 .... ............. ............................ 104 .... ............. ............................ 114 .... ............. ............................ 124 .... ............. ............................ 154 +5.5 Oct. 9, 1955 ............................ 146 e/+5.0 Nov. 11, 1925 ............................ 156 .... ............. ............................ 166 .... ............. ...........................4 176 .... ............. ............................ 186 +4.8 Dec. 15, 1953 ............................ 196 e/+6.7 Nov. 11, 1925 ............................ 206 .... ............. ............................ 216 6/+6.9 Nov. 11, 1925 ............................ 226 +2.2 'July 26, 1955 ............................ 256 .... ............. ................*.....,...... 246 +6.5 Oct. 9, 1933 ......................I.!I.. 256 +7.9 Dec. 15, 1933 ............................ 266 e/+7.9 Nov. 11, 1925 ............................ 276 .... ............. ............................ 286 .... ............. ............................ 296 .... ............. ............................ 306 .... ............. ............................ 516 .... ............. .............. . 326 6/+11.2 Nov. 11, 1925 ............................ 33
Dug -25.9 Aug. 18, 1952Dug -18.2 Aug. 18, 1952Dug -12.5 Aug. 18, 1932
Dug -15.5 Aug. 18, 1952Dug -9.0 Aug. 18, 1952
3455
8 +6.6 Dec. 15, 1955 ............................ 356 .... ............. ............................ 37o .... ............. ............................ 386 +2.8 Apr. 12, 1955 Practically no flow. ........ 596 .... ............. ............................ 406 .... ............. ............................ 416 .... ............. ............................ 426 .... ............. ............................ 43e '.'.'.'. :::*.:::""** 44
12 +Ii*9 Dec*. 'is'/ 1953 ""!*!!*! I '.'.'.'. '. !!!""!!**!!"*" ||6 .... ............. ............................ 47| ..-. ............. ............................ 48
x .... ............. ............................ 496 +7.5 Dec. 15, 1953 ............................ 50
12 +10.0 Dee. 15* 1955 ............................ 51Dug -5.6 Aug. 18, 1932 ............................ jjo ' ~38 ' 4 AuS« 18 » 1932 ............................ 53Dug -17.6 Aug. 18, 1932 ............................ 54^e -6.2 Aug. 18, 1952 ............................ §5Dug -54.8 Oct. 12, 1932 ............................ 55Dug -17.1 Aug. 18, 1952 ............................ 57Dug -35.4 Aug. 18, 1952 ............................ «Dug -16.3 Aug. 18, 1932 ............................ §|

150 CONTRIBUTIONS TO HYDROLOGY, 1937
Records of wells in Ogden
No.
656667686970 717273
74757677787980
818283
848586
87
88899091929394959697
9899100
101102103
104105106107108109110111 112113114115116117118119120121122
SWi sec.....do..NWi sec.....do..NEi sec.SEi s ec .NE^sec.SEi sec.....do..
....do..
....do..
....do..SWi sec.....do..NWi sec.NEi sec.
....do..
....do..SWi sec.
....do..
NWi sec.
....do..
NEi sec.
....do..
....do..
....do..
....do..SWi sec.
....do..,
SEi sec.
....do..,
....do..,
....do..,
....do..,
....do..,
....do..,SEi sec.....do..,NWi sec.NEi sec . NW isec.NEi sec .....do..,....do.......do..,....do..,NWi sec.....do.......do...NEi sec.....do...
Location
36, T. 7 N., R. 1 E.
1, T. 6 N., R. 1 E..
1, T. 6 N., R. 1 E..1, T. 6 N., R. 1 E.. 6, T. 6 N., R. 2 E..6, T. 6 N., R. 2 E..
5, T. 6 N., R. 2 E..
8, T. 6 N., R. 2 E..12, T. 6 N., R. 1 E.
7, T. 6 N., R. 2 E..
12, T. 6 N., R. 1 E.12, T. 6 N., R. 1 E.
12, T. 6 N., R. 1 E.
11, T. 6 N., R. 1 E.
11, T. 6 N., R. 1 E.
14, T. 6 N., R. 1 E.
13, T. 6 N., R. 1 E.13, T. 6 N., R. 1 E. 13, T. 6 N., R. 1 E.13, T. 6 N., R. 1 E.
18, T. 6 N., R» 2 E.
18, T. 6 N., R. 2 E.
Owner
Louis Jones ....R. 0. Graham...J. S. Egglegton
Ogden CityCorporation. .
....do.........W. H. Burrows......do.........Geo. H. Hirikle.W. H. Burrows......do.........Ogden City
Corporation......do.............do.........L. K. Peterson.
....do.........
J. G. Read &
....do.........
....do.........
....do.........
....do.........
....do.........
....do.........
....do.........
....do.........
....do.........W. McDonald....W. J. Wilson...
F. 0. Wilson...P. W. Burrows..Ogden City
Corporation. .....do.............do.........H. M. Ritter...
....do.........
....do. ........
Herman Larsen..Simon Jensen.......do.........Robert Spencer.P. G. Jensen... Herman Larsen.................Rhoda Burrows..Oscar Stromberg
J. L. Peterson......>.........John Anderson..Clarence 01 son.Thomas McKay. . .Otis Fuller... .
Altitudeof surface (feet abovesea level)
S/
4,9264,9204,9224,9204,9354,916 5,0084,964
d/4,950d/4,951
4,9564,9584,9904,9704,954
d/4,879d/4,880d/4,880
4,883
4,8844,921
4,8524,852
4,8564,8564,8564,8574,8574,8574,8574,8574,8484,840
4,8354,839
d/4,832d/4,833d/4,832
4,849
4,8354,8404,8354,8844,8534,9184,8964,921 4>9204,9224,9204,9174,9224,8724,9254,9274,9254,9314,934
Depth (feet)S/
f/11.4f/13.8f/45.8f/18.0f/27.2f/19 f/24.9f/37
14100
f/16.4f/10.4S/48
....
....
440
108f/ 9.9
f/10.61/22.2
....
....
f/43.5............
J/52.5f/49h/24g/125-g/65-100-105
«...g/80
46890
g/200
....fi/100
....f/ 15.9S/ 75g/132f/12.6f/24.3 f/29.9f/22.5f/19. 7f/21. 2f/20.1f>/73,£/19f/21f/17.8f/19. 6f/21. 8

GEOLOGY AND GROUND-WATER RESOURCES OF OGDEN VALLEY, UTAH 151
Valley, Weber County, Utah continued
Water level Diameter (feet above mte ol (inches) or below measure-
surface)
DugDug3
DugDug12
Dug24
88-5-
2424. .
20 »x 10' pitDug
188-5-
30*
30Dug...
...
2
22 (?)
1-2
18
fnl
-4
4
2li2
Dug66
Dugdodododododo6
Dugdo12
Dugdo
-9.9-12.1-22.8-13.4-21.2-13.0-7.2
-35.2
-5.2-10.0-13.3-6.3....-8+....
-.1-10.9-7.0(-8.0(-5.0-9.1-13.7+1.2
+1.4
+2.6....+2.9........+2.1+2.9 +2.7-10.2
....
....
....
.0+12.8+14.2(-.4(-.5........+3.0-9.8....
-38.6-10.2-18.1-22.7-14.6-14.3-13.5-15.6....
-13.4-17.2-13.1-14.3-16.6
meni;
Aug. 18,....do......do... . ..do. .....do..Aug. 16,Aug. 18,Aug. 16,
Oct. 15,....do..Aug. 16,....do......do......do......do..
Oct. 15,....do......do..
(Aug. 16,(Aug. 24,Aug. 16,Aug. 17,June 13,
....do..
... .do. .
....do..
....do..
....do..
....do..
....do..
....do..
....do..Aug. 18,
....do..
....do..
....do..
Oct. 15,....do......do..
(Aug. 16,(Aug. 24,Aug. 16,....do..Sept. 21,Aug. 18,.. . .do. .....do......do......do......do..Aug. 17,....do......do......do......do......do......do......do......do......do..
1932
.....
193219321932
1932
1932
1932
19321932193219321934
.....
.....
. . . . .
. . . . .
. . . . .'.'.'.'.'.}
1932
.....
. . . . .
.....
1932
193219321932
. . . . .19341932
. . . . .
1932
. . . . .
Remarks
Test well .......................do......................
....do......................
....do......................
5.5 feet above ground; flow,
5.0 feet above ground; flow,
(Wells 88 and 89 together flow
Flow, 64 gallons a minute...Flow, 52 gallons a minute...Flow, 31 gallons a minute...Flow, 91 gallons a minute...Flow, 197 gallons a minute..
Several other wells on farm.
3 flowing wells.............
....do......................
....do......................
7 wells on farm. ............Flow, 10 + gallons a minute.Flow, 5 + gallons a minute..Piped from well under highway
Flowing well ................
No.
6566676869707172
73747576777879
808182
838485
86
8788899091929394 9596
979899
100101102
103104105106107108109110111112113114115116117118118120121122

152 CONTRIBUTIONS TO HYDROLOGY, 1937
Records of wells In Ogden
No.
123
124 125 126 127 128 129 130 131 132 133 134 135 136 137 138 139 140 141 142 143 144 145 146
Location
NW-J sec.
NEj sec. ....do... . . .do. .SEj sec. . do....do......do..NW-i sec. SWi sec. ....do..NW-f sec. NEi sec.SE "3 3 ©C
....do..NW-J sec. ....do..NEj- sec. SW^ sec. SE -Jsec. ....do...NW^ sec. NEi sec. SWi sec.
18,
18,
18,
19, IV,
IV,'
IV,
16,
16, 16, 16,
15, 21, 21,
T.
T.
T.
T.T.
T. T. T.
T.
T. T. T.
T. T. T.
6 N.,
6 N.,
6 N.,
6 N., 6 N.,
6 N., 6 N., 6 N.,
6 N.,
6 N., 6 N., 6 N.,
6 N., 6 N., 6 N.,
R.
R.
R.
R. R.
R. R. R.
R.
R. R. R.
R. R. R.
2
2
2
2 2
2 2 2
2
2 22
2 2 2
E.
E.
E.
E. E.
E. E. E.
E.
E. E. E.
E. E. E.
Altitude of surface
Owner (feet above sea level)
Mrs. Leo
Earl Pelt ......Charles Pelt... L. P. Neilsen.. Lorenza Brunker M. Christensen.
Mary Daniel son. P. A. Peterson. Bert Burton.... John H. Smith.. P. M. Grow..... S. B. Shupe.... L. Alien.......August Llnde ... Walter Bingham. Golden Bingham.
Ed Melle.......W. H. Atkins on.
J. H. Michelson G. H. Puller... C. D. Shupe....
4,
t: 1:4,
1:4, 4,
1:4, 4, 4, 5, 4, 5, 5, 5,
I:
931 935 933 928 934 930 936 936 908 940 946 928 957 972 977 974 990 010 992 002 027 060 005 983
Depth (feet)
f/21. 3 f/21 1/16.3 f/ V.6 f/19.7 f/21. 3 f/14.7 f/12.4 f/10.1 f/14.2 f/11 f/ 9.6 f/ 8.7 f/14.4 f/18.3 f/15.9 f/31.2 f/40.1 f/22.6
f/27
f/19l9 f/19.3
a/ According to the best information, all the wells owned by Ogden City Corporation were drilled with a solid-tool percussion drilling machine and the first drilling by the city of Ogden was during Octo ber 1914. Private wells were drilled either by a solid tool or a hy draulic drilling machine. Nearly all nonflowing, shallow wells were dug. The water-bearing materials in most wells are sand and gravel. (See pi. 40 for available well logs.)
b/ Altitudes were interpolated to the nearest foot from a topographic map having a 5-foot contour interval, except where noted.
c/ According to the best information, most drilled wells were cased their entire depth. The depths of the wells of the Ogden City Cor poration were obtained from the city engineer's records except where noted.

GEOLOGY AND GROUND-WATER RESOURCES OP OGDEN VALLEY, UTAH 153
Valley, Weber County, Utah continued
Diameter ( inches )
Duedodododododododododododododododo30
Dugdododododo
Water level (feet above or belowsurface)
-16.6-16.5-16.0-4.0
-16.9-18.3-11.0-10.8-6.8-12.5
-5.8-3.5
-11.7-16.1-12.6-23.4-33.8-21.6
Dry
-18.0-14.4
Date of measure- Remarks
ment
Aug. 17, 1932 ........................ . . .do. ...... ........................ . . .do. ...... ........................ . . .do. ...... ........................ . . .do. ...... ........................ . . .do. ...... ........................ . . .do. ...... ........................ . . .do. ...... ........................ . . .do. ...... ........................ . . .do. ...... ........................ . . .do. ...... ...........................do....... ........................ . . .do. ...... ........................ . . .do. ...... .......................Aug. 16, 1932 .......................Aug. 17, 1932 ........................'...do....... .......................Aug. 16, 1932 ........................ . . .do. ...... ........................ . . .do. . ..... ........................ . . .do. ...... ........................ . . .do. ...... ........................ . . .do. ...... ........................ . . .do. ...... .......................
No.
..... 123T. 94.
..... 125
..... 126
..... 127
..... 128
..... 129
..... 130
..... 131
..... 132
..... 133
..... 134
..... 135
..... 136
..... 137
..... 138
..... 139
..... 140
..... 141
..... 142
..... 143
..... 144
..... 145
..... 146
d/ By instrumental levels.e/ Measurements and altitudes obtained from the Utah State engineer's
report of a hydrographic survey of the Ogden River system during the irrigation season of 1925 and from other data furnished by the State engineer.
f/ Measured.g/ Reported»h/ Partially filled with soft sediment.

154 CONTRIBUTIONS TO HYDROLOGY, 1937
Records of water levels in wells in , Ogden Valley, Weber County, Utah §/
Date
Well
1933July
Aug.
Sept.
Oct.
Water level above or , /
Hour below Remarks-2/ measuring point
(feet)
9. Measuring point, top of well casing, about 4.5 feet above land surface.
262831123
333479
1116171919
1919
212125
252929
13
1516
2077777779999
1212
121212121213
6:48 p.m.9:12 a.m.9:50 a.m.9:55 a.m.9:45 a.m.9:35 a.m.
9:37 a.m.9:50 a.m.1:10 p.m.9:35 a.m.10:25 a.m.9:50 a.m.1:30 p.m.9:20 a.m.3:45 p.m.
10:10 a.m.10:15 a.m.
10:30 a.m.11:00 a.m.
11:10 a.m.11:18 a.m.10:13 a.m.
10:18 a.m.11:52 a.m.3:53 p.m.
5:00 p.m.
12:00 m.2:25 p.m.
10:05 a.m.12:10 p.m.3:10 p.m.3:50 p.m.4:32 p.m.4:53 p.m.5:14 p.m.5:32 p.m.8:29 a.m.8:59 a.m.9:18 a.m.9:33 a.m.1:45 p.m.2:04 p.m.
2:43 p.m.3:34 p.m.4:18 p.m.4:42 p.m.5:00 p.m.9:33 a.m.
-3.02-3.28-3.38-3.45-3.50-3.16
-3.14-3.10-3.54-3.39-3.52-3.51-3.48-3.72-3.63+ .92+ .46
- .17- .20
+2.17+2.17+ .30
+ .30+ .26+ .41
-3.23
-3.30-2.36
-2.54+2.08+1.86+1.85+1.85+2.01+2.06+2.07+1.78+1.88+1.91+1.91+ .17+ .18
+ .19+ .20+ .21+ .28+ .31+ .40
Well closed at 6:45 p.m.Well closed at 9:30 a.m. July 27.
All air off for about 1 minuteat 9:30 a.m.
See wells 15, 27, and 33.Air turned off all wells at 9:0021 wells turned under, /a.m.
beginning at 10:10 a.m.
21 wells turned over, beginningat 3:15 p.m.
Well closed at 10:08 a.m.Numerous other well changesmade between Aug. 21 andAug. 25.
Well closed at 11:48 a.m.Wells 14 and 20 closed about
3:10 p.m.Air turned on 13 wells Aug. 30
and on 7 additional wellsSept. 7.
Air turned off 6 wells at 9:40a.m. and 4 of the wellsturned under.
Well closed at 11:45 a.m.
Well 45 closed at 4:48 p.m.
Well 44 closed at 8:55 a.m.
Well closed at 12:58 p.m.Wells 14 and 20 closed at 1:00
p.m.
Well 51 closed at 4:31 p.m.
See footnotes at end of table, on p. 159.

GEOLOGY AND. GROUND-WATER RESOURCES OF OGDEN VALLEY, UTAH 155
Records of water levels in wells in Ogden Valley, Weber County, Utah Continued
Date
Well 14.
1955Aug. 29
29Oct. 7
7
777779999
1212121212121213
Well 15.
1925July 18
28Aug. 6NOT. 111926Jan. 17Apr. 221928Sept. 20Oat. 41933Aug. 17
171717171717
Well 19.
1933July 25Aug. 1
23456789
10
Water level above or
Hour below Remarks measuring point
(feet)
Measuring point, top of well casing, about 4.5 feet abovesurface .
3 1 22 p.m. 4-0.25 Well closed at 3:14 p.m.3i57 p.m. + .30
12t43 p.m. 4-1.26 Well closed at 12:18 p.m.
land
3:12 p.m. + .98 Wells 20 and 25 closed and wells30, 31, and 32 turned underbetween 1:10 and 2:25 p.m.
3:56 p.m. + .974:35 p.m. + .974:56 p.m. +1.18 Well 45 closed at 4:48 p.m.5:17 p.m. +1.215:35 p.m. +1.228:35 a.m. + .919:03 a.m. +1.02 Well 44 closed at 8:55 a.m.9:20 a.m. +1.049:35 a.m. +1.05 Well 44 opened at 9:47 a.m.1:48 p.m. - .702:07 p.m. - .692:44 p.m. - .673:36 p.m. - .664:19 p.m. - .664:44 p.m. - .57 Well 51 closed at 4:31 p.m.5:02 p.m. - .559:35 a.m. - .45
c/Measuring point, top of bell, altitude 4,837.26 feet, about5 feet above land surface.
12:20 p.m. C/-5.17 Air on all wells.4:00 p.m. C/-4.85 DO.5:50 p.m. C/-5.81 Do.
12:00 m. C/+0.05 No air on wells.
2:00 p.m. C/+0.65 Do.12:45 p.m. C/+3.10 DO.
4:10 p.m. C/-6.48 Air on all wells.4:15 p.m. c/- .15 No air on wells.
2:02 p.m. -4.64 Well closed at 2:00 p.m.2:05 p.m. -4.622:10 p.m. -4.602:15 p.m. -4.592:20 p.m. -4.582:25 p.m. -4.572:30 p.m. -4.56
Measuring point, top of casing sleeve, about 0.25 foot aboveland surface, altitude 4,826.13 feet.
12:50 p.m. +2.05 By water-stage recorder.12:00 m. +2.3 Do.12:00 m. +2.4 Do.12:00 m. +2.3 Do.12:00 m. +2.2 Do.12:00 m. +2.2 Do.12:00 m. +2.2 Do.12:00 m. +2.2 Do.12:00 m. +2.2 Do.12:00 m. +2.2 Do.12:00 m. +2.2 Do.

156 CONTRIBUTIONS TO HYDROLOGY, 1937
Records of water levels in veils in Ogden Valley, Weber County, Utah Continued
Date
Well 19,
1955-ContAug. 11
12IS141516171819202122232425262728293031
Dec* 15
Well 20.
1925July 18
28Aug. 6Nov. 111926Jan. 17Apr. 221928Sept. 20Oct. 41933Aug. 17
171717171717252525252929
Oct. 77
7777799
. Water level above or
Hour below Remarks measuring point
(feet)
Measuring point, top of casing sleeve, about 0*25 foot above land surface, altitude 4,826.13 feet. Continued.
*
12tOO m.12tOO m.12x00 m.12tOO m.12:00 m.12:00 m.12x00 m.12tOO m.12 1 00 m.12tOO m.12t 00 m.12s 00 m.12x00 m.12:00 m.12:00 m.12x00 m.12:00 m.12:00 m.12x00 m.12:00 m.12:00 m.11:55 a.m.
+2.2+2.2+2.1+2.1+2.1+2.1+2.1+2.1+2.7+4.1+4.2+4.2+4,2+3,7+3.5+3.5+3.5+3.5+3.5+3.5+2.4+3.75
By water-stage recorder.Do.Do.Do.Do.Do.Do.Do.Do.Do.Do.Do.Do.Do.Do.Do.Do.Do.Do.Do.Do.
c/Measuring point, top of bell, altitude 4,837*63 feetj about5 feet above
2x00 p.m.3:27 p.m.6:20 p.m.
11:20 a.m.
3:05 p.m.12x00 m.
3:30 p.m.3:50 p.m.
3l48 p.m.3x51 p.m.3x56 p.m.4xpl p.m.4x06 p.m.4tll p.m.4:16 p.m.3x03 p.m.3:08 p.m.3:18 p.m.3x28 p.m.3x03 p.m.4:03 p.m.1x18 p.m.3:16 p.m.
4x01 p.m.4t40 p.m.5:00 p.m.5x20 p.m.5x41 p.m.8x40 a.m.9x08 a.m.
land surface.
C/-3.04C/-2.98C/-5.76C/+1.74
C/+2.61C/+4.51
C/+1.60 (?)C/+1.61
-3.34-3.29-3.26-3.25-3.24-3.23-3.23+ .99+1.01+1.03+1,03+ .94+1.06+2.18+2.09
+2.08+2.07+2.16+2.19+2.19+1.99+2,03
Air on all wells.Do.Do.
No air on veils.
Do.Do.
Air on all wells.No air on wells.
Well closed at 3:46 p.m.
Well closed at 2x58 p.m.
Well closed at 3x00 p.m.
Well closed at 1x10 p.m.Wells 30, 31, and 32 turned
between 1x33 and 2:15 p.m.25 closed at 2:25 p.m.
Well 45 closed at 4s 48 p.m.
Well 45 opened at 5:51 p.m.
Well 44 closed at 8x55 a.m.
underWell

GEOLOGY AND GROUND-WATER RESOURCES OF OGDEN VALLEY, UTAH 157
Records of water levels in veils in Ogden Valley, Weber County, Utah Continued
Date
Well 20.
Water level above or
Hour below Remarks measuring point
(feet)c/
Measuring point, top of bell, altitude 4,837.65 feetj about 5 feet above land surface. Continued.
1955 Cont.Oct. 9
912121212IS1212IS
Well 22.
9s 26 a.m +2,059 1 40 a.m +2.061:53 p.m + .652:11 p.m + .662:48 p.m + .685:40 p.m + .,694:25 p.m + .694:47 p.m + .,785i05 p.m, + .809 1 40 a.m. + ,92
Measuring point, top of
Well 44 opened at 9:47 a.m.Well closed at 1:02 p.m.
Well 51 closed at 4:31 p.m.
S/bell, altitude, 4,837.73 feet, about
5 feet above land surface.1986July 18
28Aug. 6HOT. 111926fan. 17Apr. 22TQOQXVcFOSept. 20Oct. 419353ug7 17
1717171717252525
Well 23.
1955July 25
26
Well 25.
1 Q«tJ-VO'O
Aug. 29
Dot. 7777777999912
iJlO p.m. _c/-3»542:45 p.m, C/-2.956:05 p.m. C/-3.82
11 I 40 a.m. C/+1.89
2:20 p.m. C/+2.3312:20 p.m, C/+8.94
3:00 p.m. C/-4.663|50 p.m, C/+1.60
4s26 p.m -3.324:30 p.m -3*304:35 p.m -5,294:40 p.m -5.284:45 P.M -3,284:50 p.m -3.284:59 p.m, +1.165:09 p.m. +1.175:19 p.». +1.17
Measuring point, top ofsurface.
1:15 p.m* -2.179 {45 a.m. -2.29
Measuring point, top ofsurface.
3:48 p.m. -0,02
2:57 p.m. +1.083:24 p.m. +1.064:0? p.m, +1.054:45 p.m. +1.045:07 p.m. +1.165:26 p.m. +1,175:46 p.m. +1.188:45 a.m. * .979:15 a.m. +1.059:29 a.m. +1.049:43 a.m. +1.0512:52 p.m, - .46
Air on all. wells.Do.Do.
No air on wells.
Do.Do.
Air on all well A »Ho air on wells*
Well closed at 4:20 p.m.
Well closed at 4:49 p.m.
Leaking a small amount.
well casing, about 4.5 feet above land
Well closed at 9:52 a.m.
bell, about 5.6 feet above land
Wells 9, 20, and 14 closed between11:48 a.m. and 3:14 p.m.
Well closed at 2:25 p.m.
Well 45 closed at 4:48 p.m.
Well 45 opened at 5:51 p.m.
Well 44 closed at 8:55 a.m.
Well 44 opened at 9; 4V a.m.Wells 9, 14, and 20* closed between
12 1:68 p.m. - .2812:68 and 1:02 p.m*
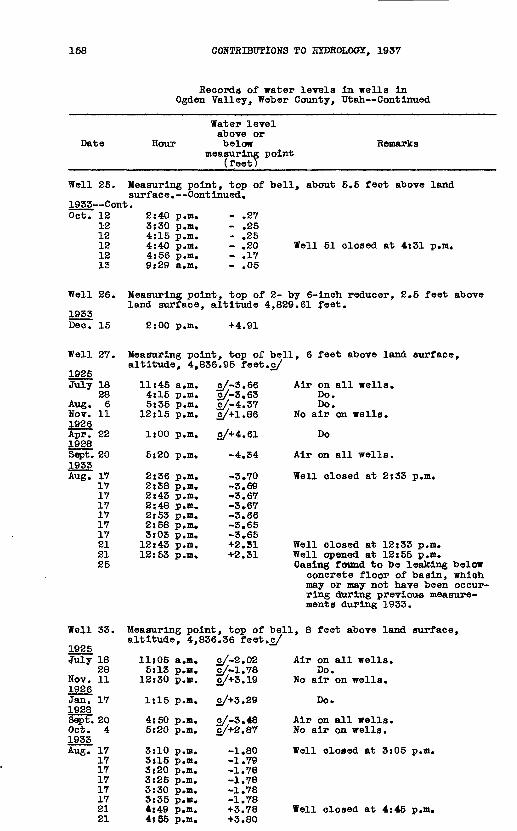
158 CONTRIBUTIONS TO HYDROLOGY, 1937
Records of water levels In wells In Ogden Valley, Weber County, Utah Continued
Date
Well 25.
1933 ContOct. 12
1212121213
Well 26.
1955Dec. 15
Well 27.
1925July 18
28Aug. 6Nov. 111926Apr. 221928Sept. 201953Aug. 17
171717171717212125
Water level above or
Hour below Remarks measuring point
( feet)
Measuring point, top of bell, about 5.5 feet above landsurf ac e . Cont inued ..
2i40 p.m. - .275:50 p.m. - .254(15 p.m. - .254:40 p.m. - .20 Well 51 closed at 4:31 p.m.4:56 p.m. - .179:29 a.m. - .05
Measuring point, top of 2- by 6- inch reducer, 2.5 feet aboveland surface, altitude 4,829.61 feet.
2:00 p.m. +4.91
Measuring point, top of bell, 6 feet above land surface,altitude, 4,856.95 feet.o/
11:45 a.m. C/-5.66 Air on all wells.4:15 p.m. C/-3.65 Do.5:55 p.m. jc/-4.37 Do.
12:15 p.m. jc/+1.86 No air on wells.
1:00 p.m. 0/+4.61 Do
5:20 p.m. -4*54 Air on all wells.
2:56 p.m. -5.70 Well closed at 2:55 p.m.2:58 p.m. -3.692:43 p.nu -3.672;48 p.m. -3.672:55 p.m. -5.662:58 p.m, -5.655:05 p.m. -3.6512:43 p.m. +2.31 Well closed at 12:33 p.m.12:53 p.m. +2.31 Well opened at 12:55 p.m.
Casing found to be leaking belowconcrete floor of basin, which may or may not have been occur ring during previous measure ments during 1953.
Well 55. Measuring point, top of bell, 8 feet above land surface, altitude, 4,856.56 feet.c/
Air on all wells.Do.
No air on wells.
Do.
Air on all wells. No air on wells.
Well closed at 3:05 p.m.
Well closed at 4:45 p.m.
1925July 18
28Nov. 111926Jan. 171928Sept. 20Oct. 41955Aug. 17
17171717172121
11:05 a.m.5:15 p.m.
12:30 p.m.
1:15 p.m.
4:50 p.m.5:20 p.m.
3:10 p.m.5:15 p.m.5:20 p.m.5:25 p.m.3:30 p.m.3:35 p.m.4:49 p.m.4:65 p.m.
C/-2.02C/-1.78C/+3.19
C/+5.29
0/-3.48C/+2.87
-1.80-1.79-1.78-1.78-1.78-1.78+5.78+5.80
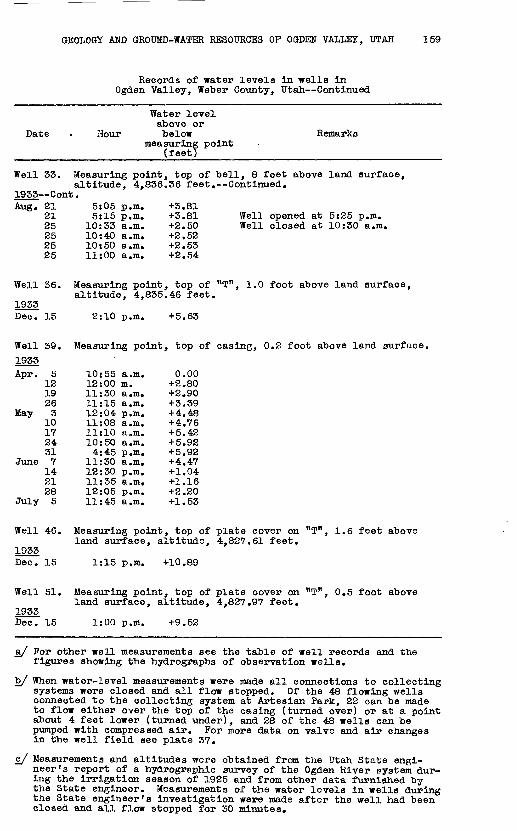
GEOLOGY AND GROUND-WATER RESOURCES OF OGDEN VALLEY, UTAH 159
Records of water levels in wells in Ogden Valley, Weber County, Utah Continued
Water levelabove or
Date . Hour belowmeasuring point
(feet)
Remarks
Well 55. Measuring point, top of bell, 8 feet above land surface,altitude, 4,856.36 feet. Continued.
1955 Cont.+3.81Aug. 21
21 25 25 25 25
5:05 p.m.5:15 p.m.
10:33 a.m. 10:40 a.m. 10:50 a.m. 11:00 a.m.
+3.81 +2.50 +2.52 +2.53 +2.54
Well opened at 5:25 p.m. Well closed at 10:30 a.m.
Well 36. Measuring point, top of "T n , 1.0 foot above land surface,altitude, 4,835.46 feet.
1955 Dec. 15 2:10 p.m. +5.63
Well 39. Measuring point, top of casing, 0.2 foot above land surface. 1955Apr. 5
12 19 26
May 3 10 17 24 31
June 7 14 21 28
July 5
10:55 12:00 11:30 11:15 12:04 11:08 11:10 10:50 4:45
11:30 12:30 11:35 12:05 11:45
a.m.m.a.m.a.m.p.m.a.m.a.m.a.m.p.m.a.m.p.m.a.m.p.m.a.m.
0.00 +2.80 +2.90 +3.39 +4.48 +4.76 +5.42 +5.92 +5.92 +4.47 +1.04 +1.16 +2.20 +1.53
Well 46.
1955 Dec. 15
Measuring point, top of plate cover on "T", 1.6 feet above land surface, altitude, 4,827.61 feet.
1:15 p.m. +10.89
Well 51.
1955 Dec. 15
Measuring point, top of plate cover on "T", 0.5 foot above land surface, altitude, 4,827.97 feet.
1:00 p.m. +9.52
a/ For other well measurements see the table of well records and the figures showing the hydrographs of observation wells.
b/ When water-level measurements were made all connections to collecting systems were closed and all flow stopped. Of the 48 flowing wells connected to the collecting system at Artesian Park, 22 can be made to flow either over the top of the casing (turned over) or at a point about 4 feet lower (turned under), and 28 of the 48 wells can be pumped with compressed air. For more data on valve and air changes in the well field see plate 57.
c/ Measurements and altitudes were obtained from the Utah State engi neer's report of a hydrographic survey of the Ogden River system dur ing the irrigation season of 1925 and from other data furnished by the State engineer. Measurements of the water levels in wells during the State engineer's investigation were made after the well had been closed and all flow stopped for 50 minutes.

160 CONTRIBUTIONS TO HYDROLOGY, 1937
Analyses of water
(Parts per mllliaia.
No.
1
25
456
7
69
10
11
121314
15
16
17
18
19
2021
2223
24
Source
Dug well 59, 20 feet deep....
Veil 75, 14 feet deep, gravelWell T4, 100 feet deep.
ell 80, 4 feet deep, gravel.Veil 81, 40 feet deep, gravelWell 82, 1O8 feet deep,
Drilled veil 88, 44 feet deep
Drilled well 93, 53 feet deepWell 100, 4 sfset deep, sand
and gravel .................Well 101, 85 feet deep, black
Well 102, 90 Test deep, sand
Dug well 113, SS feet deep...Dug well 136, 17 feet deep...Composite of abotrt SO veils
at Artealan Faxk.. .........Patio Springs, saaple taken
1,000 feet below spring
Spring Creek, at bridge north
South Fork of Ogden River atU. S. Qeologlcal Survey
South Fork of Ogden River at
Kiddle Fork of Ogden River...Middle Fork of Ogden River at
Uortfc Fork of Ogden River....North Fork of Ogden River at
bridge .....................Ogden Hirer near mouth of
LocationDate of Temper- collec- ature tlon <°F.)
Total , dissolved ,iHf? sollda l siuB'
West quarter corner ofet
SEJ
NE^
CentR.
SEJ
NE^SE£Sff^
iSV^SortE.
»
s»JMfiSKI
SW£
SBi
>c. 3!
do..,sec.do..,
do..,;er a<1 E,
do..,
sec.
sec.sec.
sec.
s»c.to eei2 E,
see.
see.
see.see.
see.
sec.
5, T. 7 H,, I
12, T. 6 N.,
>c. 12,' T. 6
11, T. 6 »,,
15, T. 6 N.,17, T. 6 ».,
11, T. 6 N.,
22, T. 7 ».,iter sec. 7,
7, T. 6 N.,
12, T. 6 N.
13, *. S S.,32, T. 7 M.,
11, T. 6 B.,6, I. 7 N.,
10, T. 6 N.,
!. 1
R.
N. ,
E.
R..R.
R.
R.T.
R.
H.
R.R.
R.R.
E.
. E...2 E..
1 E.
1 E.
1 E.2 E.
1 E.
1 E.6 N.,
2 E..
2 E.
1 E.2 E.
1 E.1 E..
1 E.
Oct. 16,Oct. 13,
Hov. 23,Oct. 12,Oct. 13,
Oct. 12,
Oct. 16,....do..
Oct. 12,
Sept. 24,
Sept. 17,Oct. 16,....do..
....do..
....do..
....do..
....do..
....do..
....do..
....do..
....do..
....do..
....do..
....do..
19331932
193219321932
1932
1933
1932
1932
19321953.....
.....
.....
.....
.....
.....
.....
52..
..
..,.
5051
..
..
..5356
. .
68
56
50
47
4847
4648
43
45
...186
19927298
210
...
...
299
198
142...
1/230
191
*
1/362
* *
1/254
*
...
* *S.4
4.2IS2.0
4.6
...
...
27
18
14......
17
* *
.
...
**
...
I/ Sum of constituents reported.
2/ Less than 5 parts per million of sodium and potassium together.

GEOLOGY AND GROUND-WATER RESOURCES OP OGDEN VALLEY, UTAH 161
Valley, Weber County, Utah
E. W. Lohr, analyst)
Iron (Pe)
0:62
.46
.05
.03
.01
...
.02
.04
.02
.01
...
...
...
:::.!!......
Calcium (Ca)
42
41 68 22
13
,.
73
47
30
64
43
..
..
72
..
72
..
..
Magnesium (Kg)
is12 20 6.8
9.5
..
17
10
7.3
is11
..
..20
..
19
;;..
Sodium (Na)
sis20 6.5 6.0
47
...
7.2
14
11
9.8
...
...
...
...
...
...
...
Potassium (K)
z'.o
1.7 3.2 2.6
4.3
...
6.0
2.0
2.3
1.5
...
...
§/
...
ZJ ...
...
...
...
Bicar bonate (HC03)
111 178
194 302 96
64
116 164
286
197
131 398 259
173
73
224
286
242
289 166
187 71
175
229
Sulphate {304)
15 14
16 12 10
32
8 10
17
2.5
8.7 12 9
12
8
9
12
10
8 6
10 20
13
20
Chloride
12 8.0
17 8.8 5.5
61
10 16
12
22
10 10 7.0
JLO
10
5.0
11
6.0
8.0 8.0
6.0 3.0
5.0
14
Fluorlde (P)
o"
.4 6"
.4
...
.8
1.1
.6
...
...
...
...
...
:::.........
Hltrate(HOjs)
29 9.8
0 0 2.4
0
5.2 13
6.0
0
1.3 26 4.1
6.2
.25
15
3.9
.65
1.3.0
2.2 .20
2.1
.53
Total hardness as OaOOg
135 156
1S2 252 83
71
102 153
252
15S
105 368234
153
58
204
262
192
258 135
159 78
156
219
Ho.
1 2
5 4 &
6
7 8
9
10
11 1213
14
15
16
17
18
19 20
21 22
23
24
o