Geological Insights from Malaysia Airlines Flight MH370 ... · Geological Insights from Malaysia...
10
Geological Insights from Malaysia Airlines Flight MH370 Search A rich trove of marine geophysical data acquired in the search for missing flight MH370 is yielding knowledge of ocean floor processes at a level of detail rare in the deep ocean. One by-product of the search for the missing Malaysian Airlines flight MH370 is a view with an unprecedented level of detail of the landscape deep in the Indian Ocean. This 3-D image shows the Diamantina Escarpment, looking northwest (upslope). The largest seamount in this area, about 1.5 kilometers high, appears in the foreground. In the middle and background, the escarpment and trough mark the northern margin of the rift. Vertical exaggeration is 3 times. Credit: Kim Picard and Jonah Sullivan. By Kim Picard , Brendan Brooke, and Millard F. Coffin ! 6 March 2017 The tragic disappearance of Malaysia Airlines flight MH370 ( http://onlinelibrary.wiley.com 1 of 10
Transcript of Geological Insights from Malaysia Airlines Flight MH370 ... · Geological Insights from Malaysia...
Geological Insights from Malaysia Airlines FlightMH370 Search
A rich trove of marine geophysical data acquired in the search for
missing flight MH370 is yielding knowledge of ocean floor processes
at a level of detail rare in the deep ocean.
One by-product of the search for the missing Malaysian Airlines flight MH370 is a view
with an unprecedented level of detail of the landscape deep in the Indian Ocean. This 3-D
image shows the Diamantina Escarpment, looking northwest (upslope). The largest
seamount in this area, about 1.5 kilometers high, appears in the foreground. In the middle
and background, the escarpment and trough mark the northern margin of the rift. Vertical
exaggeration is 3 times. Credit: Kim Picard and Jonah Sullivan.
By Kim Picard, Brendan Brooke, and Millard F. Coffin! 6 March 2017
The tragic disappearance of Malaysia Airlines flight MH370 (http://onlinelibrary.wiley.com
1 of 10
/doi/10.1002/2014EO210001/abstract) on 8 March 2014 led to a deep-ocean search effort of
unprecedented scale and detail. Between June 2014 and June 2016, geophysical survey
teams aboard ships used echo sounding techniques to create state-of-the-art maps of the
seafloor topography and profiles of the sediments below the ocean floor in a zone spanning
about 279,000 square kilometers of the southeastern Indian Ocean.
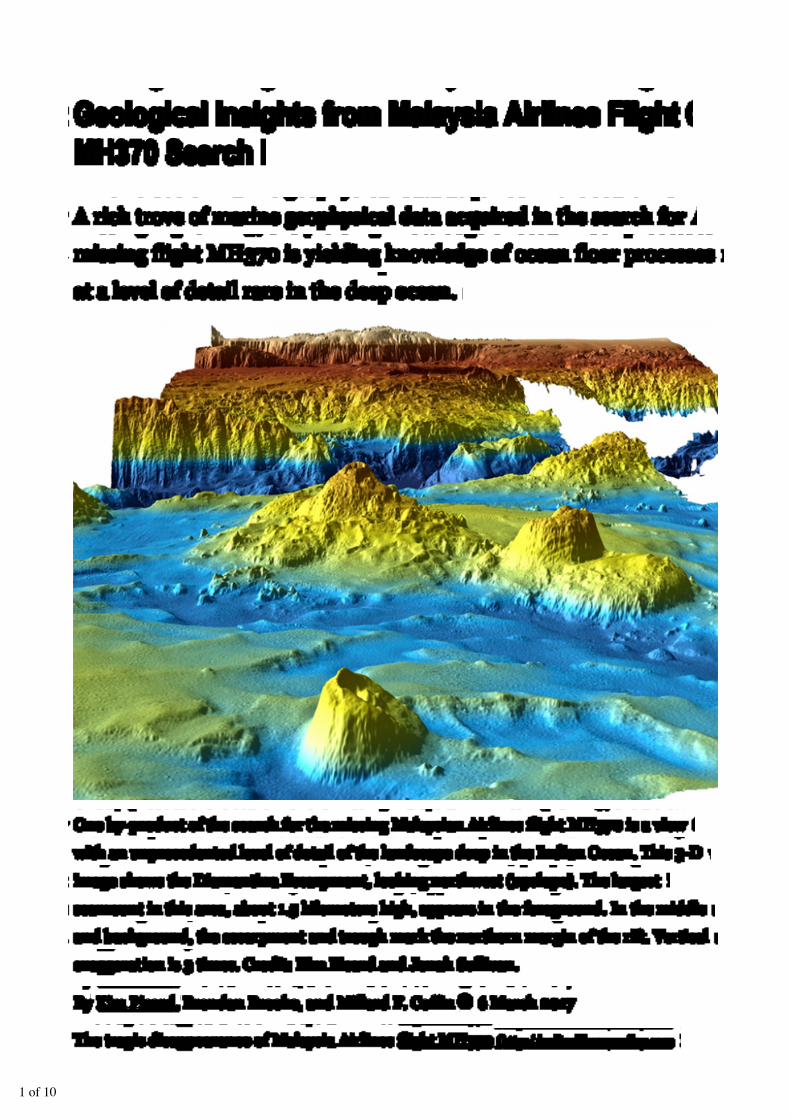
(https://eos.org/?attachment_id=69033)
Fig. 1. Satellite-derived gravity field (gray) [Sandwell et
al., 2014] and multibeam echo sounder (color) data
were used to produce these maps of the MH370 search
area in the southeast Indian Ocean. The relief models
are shown in Sun-illuminated (shaded relief) mode.
The inset map shows the MH370 search area that was
mapped with multibeam echo sounding (shown in
red). This map highlights the Southeast Indian Ridge
(SEIR) and the Kerguelen Plateau, and it includes
estimated spreading rates of the SEIR [Argus et al.,
2011], lines delineating regions of approximately equal
age (isochrons [Müller et al., 2008]), and
2 of 10
interpretations of SEIR segments (I–VII [Small et al.,
1999]). Other abbreviations are AAD, Australian-
Antarctic Discordance; CIR, Central Indian Ridge;
RTJ, Rodriguez Triple Junction; SWIR, Southwest
Indian Ridge; WA, Western Australia. The larger map
shows details of the ocean depth mapping effort using
multibeam echo sounder bathymetry data. Locations
of Deep Sea Drilling Project (Leg 26) and Ocean
Drilling Program (Legs 121 and 183) Sites 255, 752 to
755, 1141, and 1142 are also indicated, as are the
locations of Figures 2, 3, and 4. Click image for larger
version.
The curved search swath is 75 to 160 kilometers wide, and it sweeps from northeast to
southwest. It centers on Broken Ridge and extends roughly 2500 kilometers from the
eastern flank of Batavia Seamount to the Geelvinck Fracture Zone (Figure 1). Aircraft debris
found along the shores of the western Indian Ocean is consistent with drift modeling that
indicates the aircraft entered the sea in the search area (https://www.atsb.gov.au/mh370/).
The data set that emerged from this search effort constitutes the largest high-resolution
multibeam echo sounder (http://www.ga.gov.au/about/projects/marine/mh370-bathymetric-survey
/mh370-multibeam-sonar) (a type of sonar) mapping effort for the Indian Ocean, covering an
area about the size of New Zealand. Previous ocean floor maps in this region had an
average spatial resolution (pixel size) of more than 5 square kilometers, but the new maps
resolve features smaller than 0.01 square kilometer (an area slightly larger than a soccer
field). Crucially, the new data provided the geospatial framework for the last phase of the
search (http://www.ga.gov.au/about/projects/marine/mh370-bathymetric-survey), in which search teams
deployed deepwater, high-resolution acoustic and optical imaging instruments with the
ability to identify aircraft wreckage.
A Sharper Focus on the Ocean FloorThe global ocean covers 71% of Earth’s surface, yet the ocean floor remains poorly studied
compared to the land surface. In particular, knowledge of ocean floor topography is sparse
because light cannot penetrate the deep ocean and acoustic mapping techniques are
relatively inefficient in mapping its floor. Most of the ocean floor (85%–90%) has been
mapped indirectly using satellite-derived gravity data, which yield a spatial resolution of
about 5 kilometers [Weatherall et al., 2015]. By comparison, topographic maps of even the
3 of 10
most remote land areas on Earth resolve features approximately 50 meters across, and
topographic maps of the Moon, Mars (https://eos.org/research-spotlights/how-mars-got-its-layered-
north-polar-cap), and Venus resolve 100-meter features [Copley, 2014].
The high-resolution multibeam echo sounder data set that emerged from this search effort
covered an area about the size of New Zealand.
Ship-mounted multibeam echo sounders that use sound waves that echo off the ocean floor
provide much finer and more accurate topographic data (https://eos.org/project-updates
/new-insights-from-seafloor-mapping-of-a-hawaiian-marine-monument) for the deep ocean floor with a
spatial resolution (as distinct from a vertical resolution) of at least 100 m in 5000-meter
water depths. However, only 10%–15% of the ocean basins have been mapped using
multibeam echo sounders [Weatherall et al., 2015].
This technique also records acoustic backscatter from the ocean floor, which can be used to
distinguish between hard rock and soft sediment. Such fundamental spatial information is
essential for characterizing the physical features of the ocean floor, for making inferences
on geological and oceanographic processes, and for identifying the habitats of species that
live on the ocean floor.
A Complex RegionBeyond the continental margins, toward the open sea, the floor of the Indian Ocean is a
complex mosaic of normal oceanic crust (not associated with hot spots and other
anomalies), submarine plateaus and ridges, seamounts (https://eos.org/project-updates/a-name-
directory-for-the-ocean-floor), sea knolls, and microcontinents. Various processes, including
seafloor spreading (including ridge jumps (http://www.nongnu.org/magellan
/magellan_ridgejump.html)), flood and hot spot magmatism, and tectonism, produce a variety of
features.
Only 10%–15% of the ocean basins have been mapped using multibeam echo sounders.
The MH370 search area includes all of the major elements of the mosaic, and it lies in
water depths between 635 and 6300 meters (Figure 1). The search teams mapped most of
the area with a 30-kilohertz multibeam echo sounder system (Kongsberg EM302, M/V
Fugro Equator), and they mapped much smaller areas with 12-kilohertz systems, which
can reach the deeper ocean floor (Kongsberg EM122, M/V Fugro Supporter; Reson SeaBat
8150, Chinese PLA Navy ship Zhu Kezhen).
Here we highlight three examples from this shipboard multibeam echo sounder data set
that are helping to illuminate the geologic development of this portion of the Indian Ocean.
4 of 10
Submarine Plateau Rifting and BreakupBroken Ridge and the Kerguelen Plateau formed mostly as a contiguous large igneous
province (http://www.largeigneousprovinces.org/) in Cretaceous time (http://www.ucmp.berkeley.edu
/mesozoic/cretaceous/cretaceous.php) [Coffin et al., 2000]. They subsequently experienced rifting
and were eventually separated by seafloor spreading along the Southeast Indian Ridge
(SEIR) 43 million years ago [Mutter and Cande, 1983].
The southern flank of Broken Ridge, known as the Diamantina Escarpment, documents the
rifting, plunging more than 5100 meters from its crest (638 meters of water depth) into a
deep trough (5800 meters of water depth). This rifted flank includes escarpments
(http://www.nationalgeographic.org/encyclopedia/escarpment/)rising more than 1000 m above the
ocean floor, slopes as steep as 67°, and fault blocks about 12 by 25 kilometers in size and
rising more than 1200 meters above their base (Figure 2).
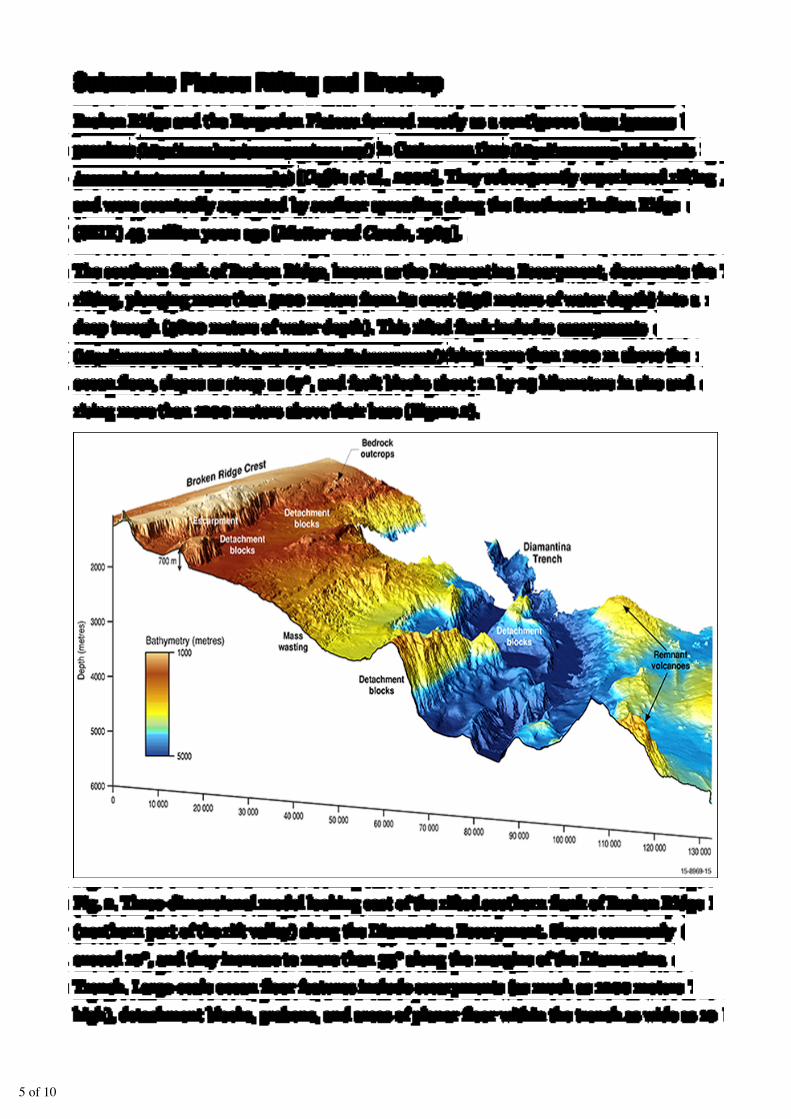
Fig. 2. Three-dimensional model looking east of the rifted southern flank of Broken Ridge
(northern part of the rift valley) along the Diamantina Escarpment. Slopes commonly
exceed 10°, and they increase to more than 35° along the margins of the Diamantina
Trench. Large-scale ocean floor features include escarpments (as much as 1200 meters
high), detachment blocks, grabens, and areas of planar floor within the trench as wide as 10
5 of 10
kilometers. High backscatter intensity and angular morphology indicate that bedrock is
exposed in a few places at and near the top of the ridge and on the flank down to depths of
about 1350 meters. Parallel WSW–ENE lineations on some scarps, extending to water
depths of about 2400 meters, most likely represent exposed steeply dipping bedding
planes. Mass wasting, a downslope movement of loose rocks and sediment during and after
the rifting process, has incised the escarpment, and significant sediment has accumulated
in the grabens and at the bottom of the Diamantina Trench (see Figure 1 for location).
The new multibeam echo sounder data, integrated with preexisting seismic reflection and
drilling data, illuminate exposed igneous basement rock, prerift sedimentary sections, and
overlying sediment that accumulated on the ocean floor during (hemipelagic sediment) and
after (pelagic sediment) rifting.
The morphology and seismic stratigraphy of the Diamantina Escarpment indicate that the
mode of rifting resembled an orthogonal rift model, in which faults develop parallel to the
axis of spreading. Between the faults, a series of elongated blocks of crustal material,
grabens, steps down into a deep trough and abuts the spreading ridge volcanics [Karner
and Driscoll, 1993].
Seafloor ErosionNorth of its rifted southern flank, Broken Ridge generally has subtle relief, with igneous
basement rocks overlain by sedimentary rock and pelagic sediment [e.g., Coffin et al.,
2000]. In places, slides and debris flows have reworked sediment downslope.
6 of 10
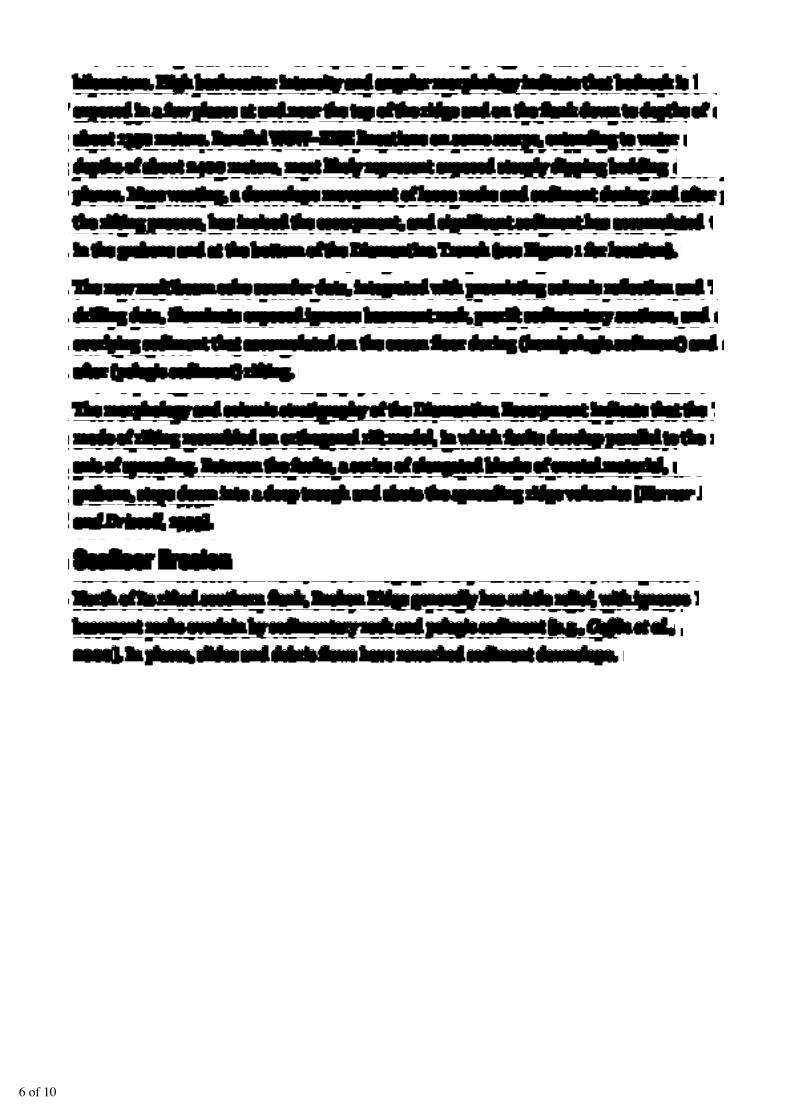
Fig. 3. The differences in resolution between multibeam
and satellite-derived bathymetry data for the northern
flank of Broken Ridge are apparent here. Numerous
mass wasting features are evident, including slides and
debris flows (delineated by their head scarps) that
crosscut and run out as debris fans into the large
semicircular depression (see Figure 1 for location).
A large depression, about 90 kilometers in diameter and with about 500 meters of relief,
lies some 70 kilometers northeast of the crest of Broken Ridge (Figure 3). Numerous
crosscutting retrogressive slides (where the collapsing area extends progressively higher up
the slope) and debris flows dissect the flanks of the depression, recording episodes of
sediment flow, with slide scarps as much as 180 meters high and 10 kilometers wide and
debris fans more than 150 kilometers long.
Tectonic Spreading FabricSouth of Broken Ridge, normal oceanic crust of the Australian-Antarctic Basin has formed
along the SEIR at intermediate spreading rates of 59–75 millimeters per year [Small et al.,
1999; Müller et al., 2008]. The shipboard multibeam echo sounder data swath traverses a
region of crust north of the SEIR that is some 10 to 40 million years old, obliquely cutting
across tectonic seafloor spreading fabric consisting of elongated abyssal ridges and fracture
7 of 10
zones (Figure 1).
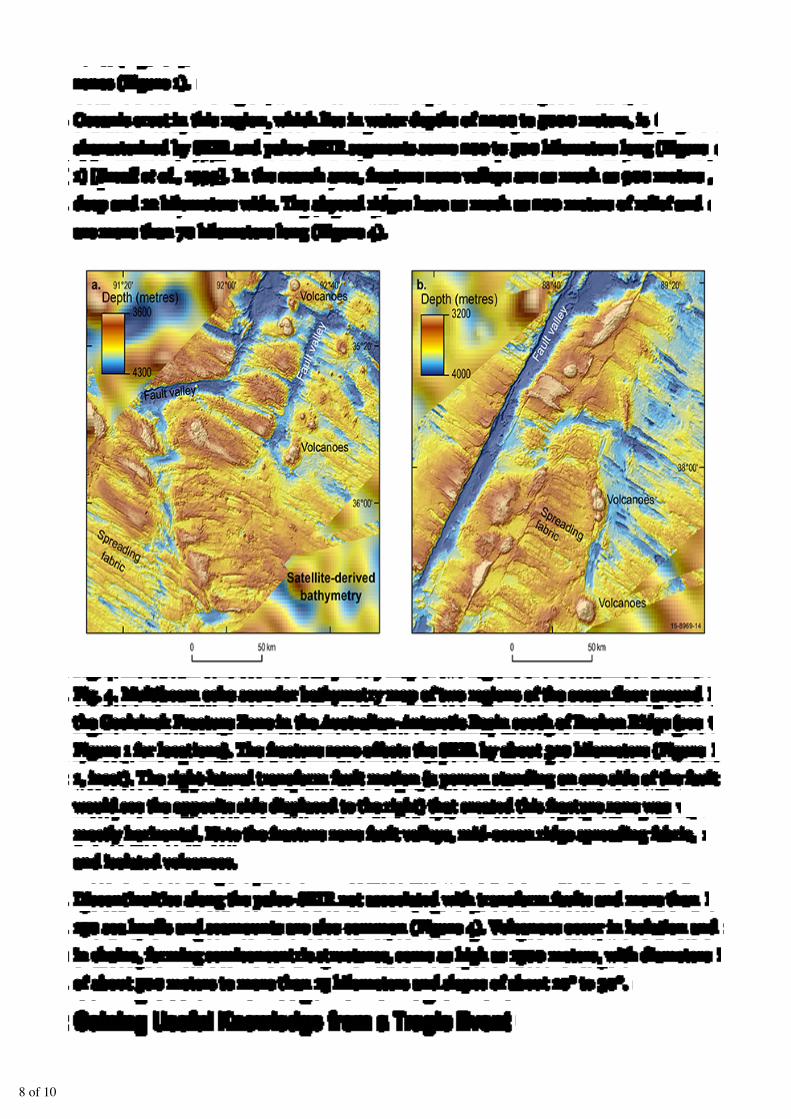
Oceanic crust in this region, which lies in water depths of 2200 to 5000 meters, is
characterized by SEIR and paleo-SEIR segments some 200 to 500 kilometers long (Figure
1) [Small et al., 1999]. In the search area, fracture zone valleys are as much as 900 meters
deep and 12 kilometers wide. The abyssal ridges have as much as 200 meters of relief and
are more than 70 kilometers long (Figure 4).
Fig. 4. Multibeam echo sounder bathymetry map of two regions of the ocean floor around
the Geelvinck Fracture Zone in the Australian-Antarctic Basin south of Broken Ridge (see
Figure 1 for locations). The fracture zone offsets the SEIR by about 310 kilometers (Figure
1, inset). The right-lateral transform fault motion (a person standing on one side of the fault
would see the opposite side displaced to the right) that created this fracture zone was
mostly horizontal. Note the fracture zone fault valleys, mid-ocean ridge spreading fabric,
and isolated volcanoes.
Discontinuities along the paleo-SEIR not associated with transform faults and more than
150 sea knolls and seamounts are also common (Figure 4). Volcanoes occur in isolation and
in chains, forming semiconcentric structures, some as high as 1500 meters, with diameters
of about 500 meters to more than 15 kilometers and slopes of about 10° to 30°.
Gaining Useful Knowledge from a Tragic Event
8 of 10
The new data highlight the topographic complexity of the ocean floor and provided a
framework for deploying deepwater instruments in the search for MH370 wreckage.
The new multibeam echo sounder data highlight the topographic complexity of the ocean
floor and provided a framework for deploying deepwater instruments in the search for
MH370 wreckage. The data also revealed details of the tectonic, sedimentary, and volcanic
processes that formed this region of the ocean. This effort demonstrates the breadth and
depth of knowledge that will be gained as the remaining 85% to 90% of the global ocean is
mapped at similar resolution.
AcknowledgmentsWe thank the Geoscience Australia team, especially Tanya Whiteway and Maggie Tran, for
project management; Maggie Tran, Justy Siwabessy, Michele Spinoccia, Jonah Sullivan,
and Jonathan Weales for data processing and mapping; and Silvio Mezzomo and David
Arnold for the figures. We are thankful for insightful reviews by Scott Nichol and Ron
Hackney of Geoscience Austrialia and two anonymous reviewers. The search for MH370
was managed by the Australian Transport Safety Bureau and the Joint Agency
Coordination Centre for the Malaysian government. We thank the Fugro Survey Pty. Ltd.
team from Perth, Australia, and the masters and crews of M/V Fugro Equator, M/V Fugro
Supporter, and Zhu Kezhen for shipboard multibeam echo sounder data acquisition.
References
Argus, D. F., R. G. Gordon, and C. DeMets (2011), Geologically current motion of 56 plates relative
to the no net rotation reference frame, GGeeoocchheemm.. GGeeoopphhyyss.. GGeeoossyysstt., 1122, Q11001, https://doi.org
/10.1029/2011GC003751 (https://doi.org/10.1029/2011GC003751).
Coffin, M. F., F. A. Frey, and P. J. Wallace (2000), PPrroocceeeeddiinnggss ooff tthhee OOcceeaann DDrriilllliinngg PPrrooggrraamm,,
IInniittiiaall RReeppoorrttss,, vol. 183, 101 pp., Ocean Drill. Program, College Station, Texas.
Copley, J. T. (2014), Just how little do we know about the ocean floor?, CCoonnvveerrssaattiioonn,, 9 Oct. 2014,
http://theconversation.com/just-how-little-do-we-know-about-the-ocean-floor-32751
(http://theconversation.com/just-how-little-do-we-know-about-the-ocean-floor-32751).
Karner, G. D., and N. W. Driscoll (1993), Rift flank topography and extensional basin architecture:
Formation of Broken Ridge, southeast Indian Ocean, AAnn.. AAccaadd.. BBrraass.. CCiieenncc..,, 6655, suppl. 2,
263–294.
Müller, R. D., M. Sdrolias, C. Gaina, and W. R. Roest (2008), Age, spreading rates, and spreading
9 of 10
asymmetry of the world’s ocean crust, GGeeoocchheemm.. GGeeoopphhyyss.. GGeeoossyysstt..,, 99,, Q04006, https://doi.org
/10.1029/2007GC001743 (https://doi.org/10.1029/2007GC001743).
Mutter, J. C., and S. C. Cande (1983), The early opening between Broken Ridge and the Kerguelen
Plateau, EEaarrtthh PPllaanneett.. SSccii.. LLeetttt..,, 6655,, 369–376, https://doi.org/10.1016/0012-821X(83)90174-7
(https://doi.org/10.1016/0012-821X(83)90174-7).
Sandwell, D. T., R. D. Müller, and W. H. F. Smith (2014), New global marine gravity model from
Cryo-Sat-2 and Jason-1 reveals buried tectonic structure, SScciieennccee,, 334466,, 65–67, https://doi.org
/10.1126/science.1258213 (https://doi.org/10.1126/science.1258213).
Small, C., J. R. Cochran, J.-C. Sempéré, and D. Christie (1999), The structure and segmentation of
the Southeast Indian Ridge, MMaarr.. GGeeooll..,, 116611,, 1–12, https://doi.org/10.1016/S0025-3227(99)00051-1
(https://doi.org/10.1016/S0025-3227(99)00051-1).
Weatherall, P., K. M. Marks, and M. Jakobsson (2015), A new digital bathymetric model of the
world’s oceans, EEaarrtthh SSppaaccee SSccii.., 22, 331–345, https://doi.org/10.1002/2015EA000107 (https://doi.org
/10.1002/2015EA000107).
Author InformationKim Picard (email: [email protected]) and Brendan Brooke, Geoscience Australia, Canberra,
ACT; and Millard F. Coffin, Institute for Marine and Antarctic Studies, University of Tasmania,
Hobart, Australia; and Woods Hole Oceanographic Institution, Woods Hole, Mass.
EEddiittoorr’’ss nnoottee:: FFoorr mmoorree oonn hhooww mmuucchh ooff tthhee sseeaafflloooorr uunnddeerr ccoommmmeerrcciiaall fflliigghhtt ppaatthhss rreemmaaiinnss
uunnmmaappppeedd,, rreeaadd tthhiiss ooppiinniioonn ppiieeccee ((hhttttppss::////eeooss..oorrgg//ooppiinniioonnss//aaiirrlliinnee--fflliigghhtt--ppaatthhss--oovveerr--tthhee--uunnmmaappppeedd--
oocceeaann)) oonn EEooss..oorrgg..
Citation: Picard, K., B. Brooke, and M. F. Coffin (2017), Geological insights from Malaysia Airlines flight MH370
search, Eos, 98, https://doi.org/10.1029/2017EO069015. Published on 06 March 2017.
© 2017. The authors. CC BY 3.0
10 of 10