Geologic Time Scale Historical Geology. Geologic Time Scale.
1
Geological Hazards Labs Lab 2: Geologic Maps - Mapping the Hazards Introduction
Geologic maps depict the composition, structure and history of geologic materials found in a portion of the Earth. The region depicted may lie at the Earth's surface or some depth below that surface. Geologic maps are constructed on a variety of scales ranging in size from a small mining district to an entire continent to the whole Earth surface.
This lab introduces geologic maps and the tools you will need to read them. Geologic maps are critical in locating, evaluating and producing nearly all kinds of Earth and mineral resources. Have completing this lab you will have developed the skills necessary to read and understand the various geologic maps we will use to investigate Earth and mineral resources.
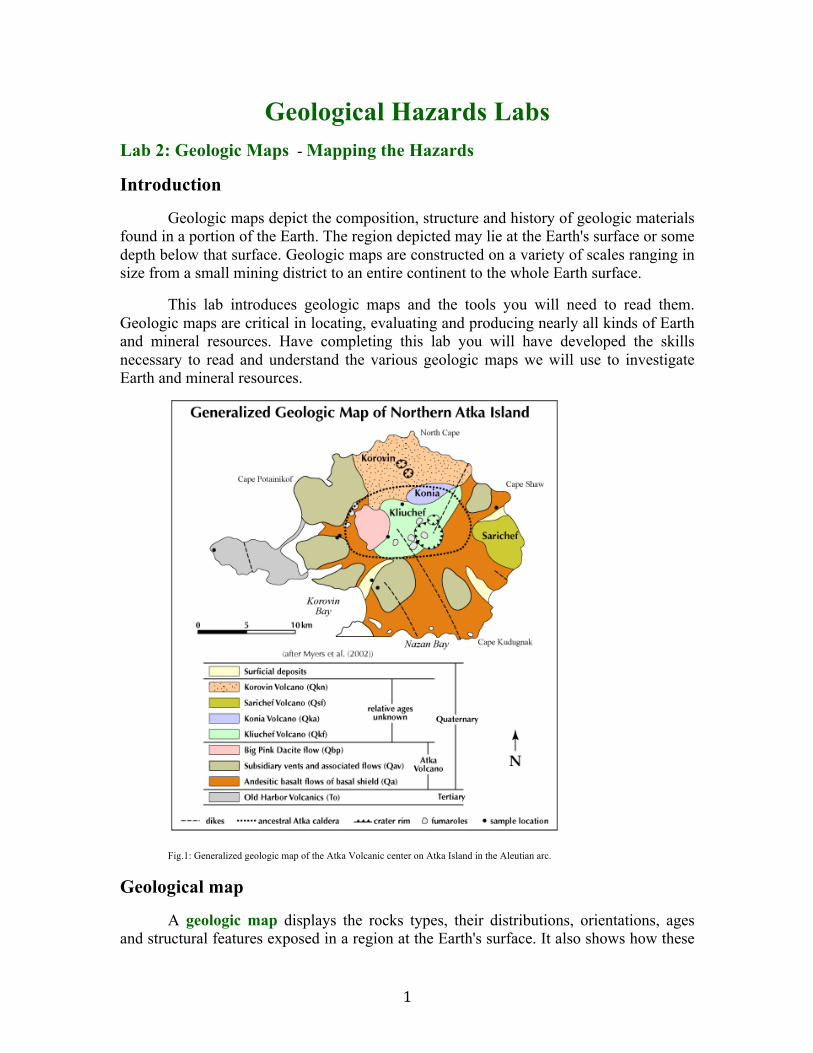
Fig.1: Generalized geologic map of the Atka Volcanic center on Atka Island in the Aleutian arc.
Geological map
A geologic map displays the rocks types, their distributions, orientations, ages and structural features exposed in a region at the Earth's surface. It also shows how these
2
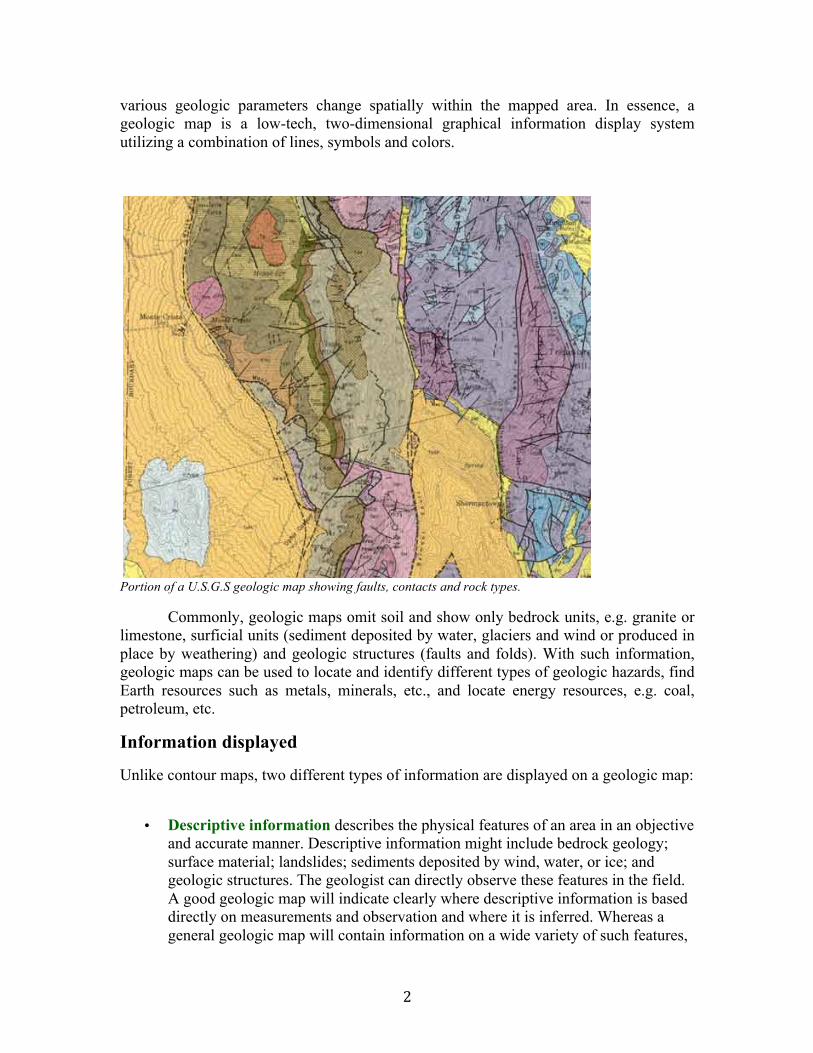
various geologic parameters change spatially within the mapped area. In essence, a geologic map is a low-tech, two-dimensional graphical information display system utilizing a combination of lines, symbols and colors.
Portion of a U.S.G.S geologic map showing faults, contacts and rock types.
Commonly, geologic maps omit soil and show only bedrock units, e.g. granite or limestone, surficial units (sediment deposited by water, glaciers and wind or produced in place by weathering) and geologic structures (faults and folds). With such information, geologic maps can be used to locate and identify different types of geologic hazards, find Earth resources such as metals, minerals, etc., and locate energy resources, e.g. coal, petroleum, etc.
Information displayed
Unlike contour maps, two different types of information are displayed on a geologic map:
• Descriptive information describes the physical features of an area in an objective and accurate manner. Descriptive information might include bedrock geology; surface material; landslides; sediments deposited by wind, water, or ice; and geologic structures. The geologist can directly observe these features in the field. A good geologic map will indicate clearly where descriptive information is based directly on measurements and observation and where it is inferred. Whereas a general geologic map will contain information on a wide variety of such features,
3
specialized geologic maps focus on one or two types of information. For example, a volcanic-hazards map will show recent volcanic rocks and their outcrop patterns. A map constructed to identify materials for road and railway construction will show only outcrops of unconsolidated surface materials.
• Interpretative information explains how the geologic materials and structures of a region are related in time and space. These relationships are not actually observed but are inferred from the descriptive information and the geologist’s understanding of how geologic processes work. For example, the existence of an unconformity, i.e. a gap in the rock record, is actually inferred from observations. It cannot be observed, measured, or otherwise directly quantified. Clearly, the quality of the interpretative information is only as good as the descriptive data on which it is built.
Good geologic maps clearly and explicitly identify what is descriptive information from interpretative information.
Map scale
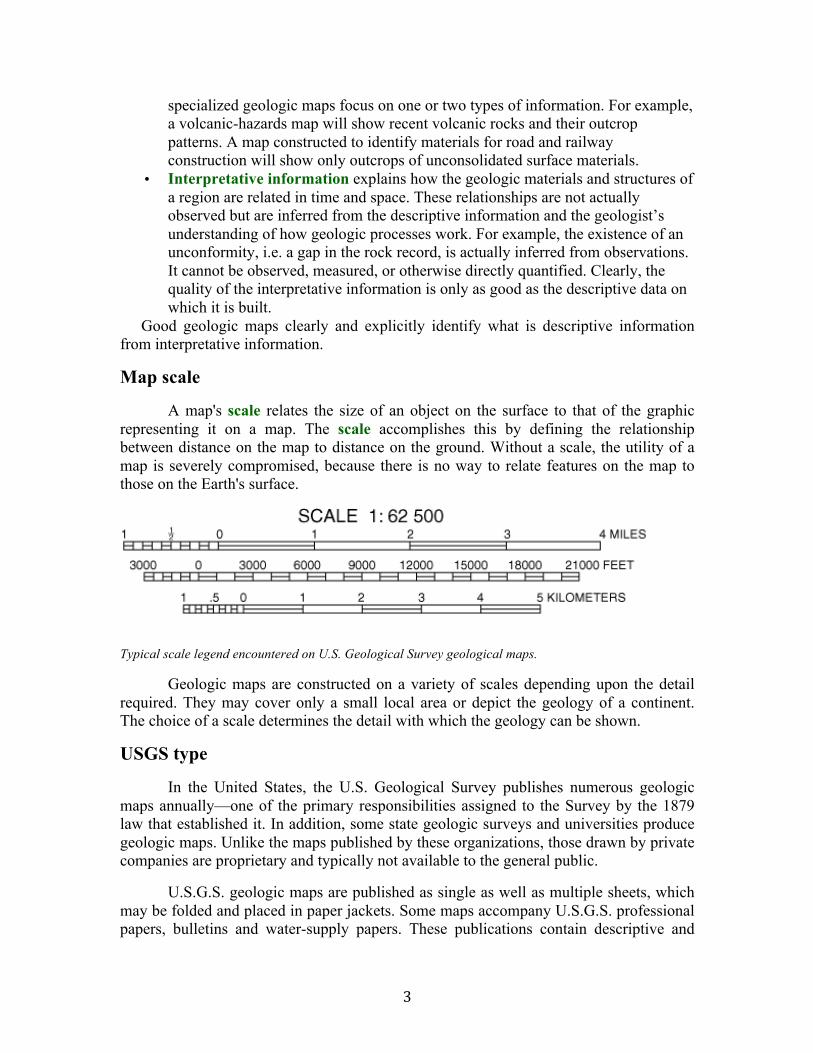
A map's scale relates the size of an object on the surface to that of the graphic representing it on a map. The scale accomplishes this by defining the relationship between distance on the map to distance on the ground. Without a scale, the utility of a map is severely compromised, because there is no way to relate features on the map to those on the Earth's surface.
Typical scale legend encountered on U.S. Geological Survey geological maps.
Geologic maps are constructed on a variety of scales depending upon the detail required. They may cover only a small local area or depict the geology of a continent. The choice of a scale determines the detail with which the geology can be shown.
USGS type
In the United States, the U.S. Geological Survey publishes numerous geologic maps annually—one of the primary responsibilities assigned to the Survey by the 1879 law that established it. In addition, some state geologic surveys and universities produce geologic maps. Unlike the maps published by these organizations, those drawn by private companies are proprietary and typically not available to the general public.
U.S.G.S. geologic maps are published as single as well as multiple sheets, which may be folded and placed in paper jackets. Some maps accompany U.S.G.S. professional papers, bulletins and water-supply papers. These publications contain descriptive and
4
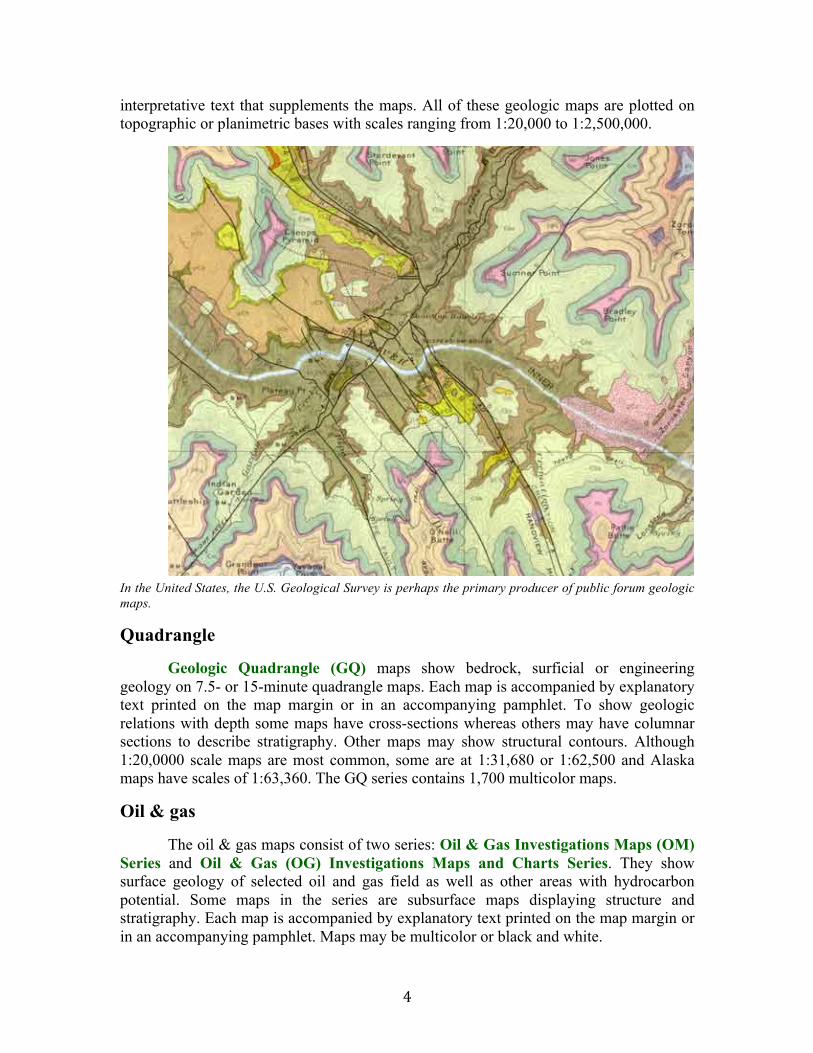
interpretative text that supplements the maps. All of these geologic maps are plotted on topographic or planimetric bases with scales ranging from 1:20,000 to 1:2,500,000.
In the United States, the U.S. Geological Survey is perhaps the primary producer of public forum geologic maps.
Quadrangle
Geologic Quadrangle (GQ) maps show bedrock, surficial or engineering geology on 7.5- or 15-minute quadrangle maps. Each map is accompanied by explanatory text printed on the map margin or in an accompanying pamphlet. To show geologic relations with depth some maps have cross-sections whereas others may have columnar sections to describe stratigraphy. Other maps may show structural contours. Although 1:20,0000 scale maps are most common, some are at 1:31,680 or 1:62,500 and Alaska maps have scales of 1:63,360. The GQ series contains 1,700 multicolor maps.
Oil & gas
The oil & gas maps consist of two series: Oil & Gas Investigations Maps (OM) Series and Oil & Gas (OG) Investigations Maps and Charts Series. They show surface geology of selected oil and gas field as well as other areas with hydrocarbon potential. Some maps in the series are subsurface maps displaying structure and stratigraphy. Each map is accompanied by explanatory text printed on the map margin or in an accompanying pamphlet. Maps may be multicolor or black and white.
5
The Maps and Charts series is characterized by different types of information normally displayed on a geologic map:
• maps are plotted on topographic or planimetric base and typically accompanied by cross-sections, columnar sections, correlation diagrams and well logs.
• charts consist of well logs, correlation diagrams, graphs and tables. They may or may not contain seismic data or maps.
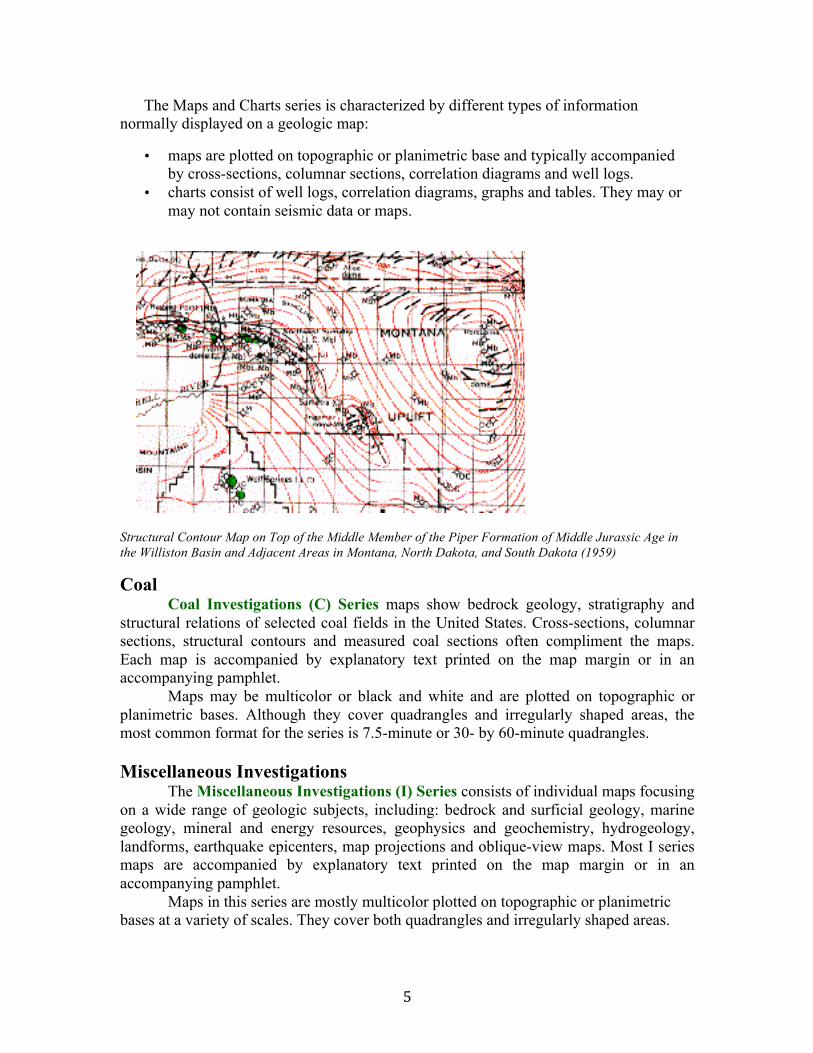
Structural Contour Map on Top of the Middle Member of the Piper Formation of Middle Jurassic Age in the Williston Basin and Adjacent Areas in Montana, North Dakota, and South Dakota (1959)
Coal Coal Investigations (C) Series maps show bedrock geology, stratigraphy and
structural relations of selected coal fields in the United States. Cross-sections, columnar sections, structural contours and measured coal sections often compliment the maps. Each map is accompanied by explanatory text printed on the map margin or in an accompanying pamphlet.
Maps may be multicolor or black and white and are plotted on topographic or planimetric bases. Although they cover quadrangles and irregularly shaped areas, the most common format for the series is 7.5-minute or 30- by 60-minute quadrangles. Miscellaneous Investigations
The Miscellaneous Investigations (I) Series consists of individual maps focusing on a wide range of geologic subjects, including: bedrock and surficial geology, marine geology, mineral and energy resources, geophysics and geochemistry, hydrogeology, landforms, earthquake epicenters, map projections and oblique-view maps. Most I series maps are accompanied by explanatory text printed on the map margin or in an accompanying pamphlet.
Maps in this series are mostly multicolor plotted on topographic or planimetric bases at a variety of scales. They cover both quadrangles and irregularly shaped areas.
6
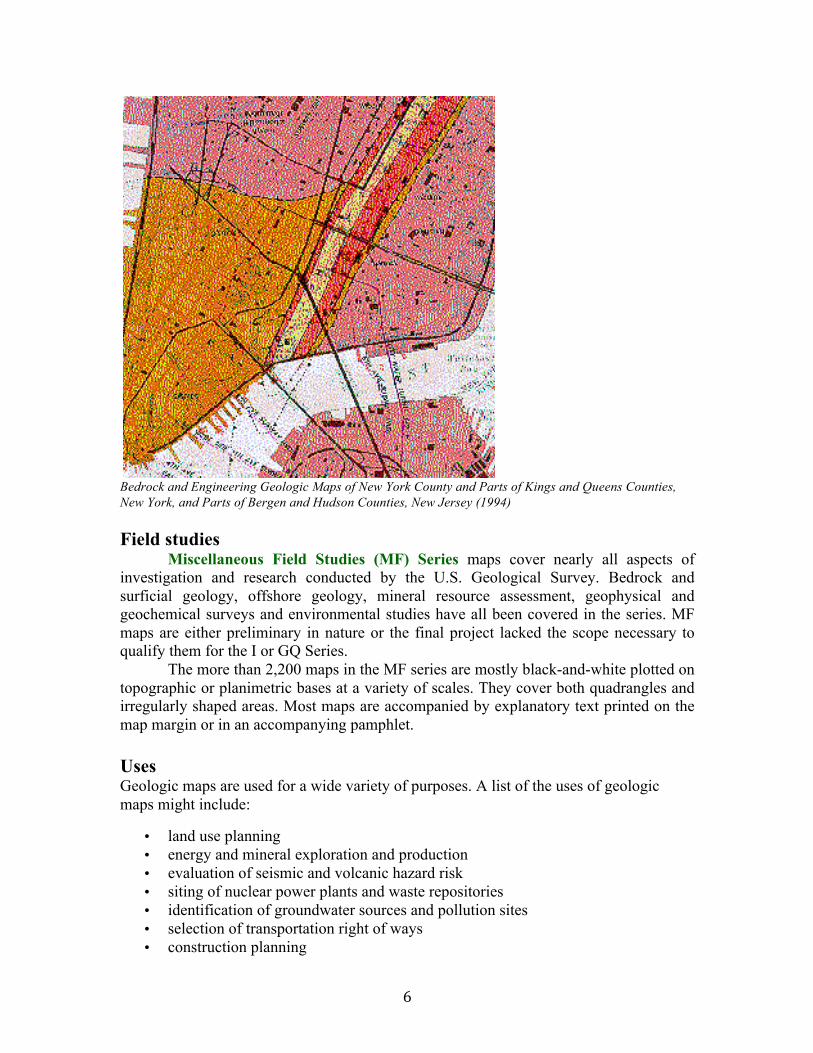
Bedrock and Engineering Geologic Maps of New York County and Parts of Kings and Queens Counties, New York, and Parts of Bergen and Hudson Counties, New Jersey (1994) Field studies
Miscellaneous Field Studies (MF) Series maps cover nearly all aspects of investigation and research conducted by the U.S. Geological Survey. Bedrock and surficial geology, offshore geology, mineral resource assessment, geophysical and geochemical surveys and environmental studies have all been covered in the series. MF maps are either preliminary in nature or the final project lacked the scope necessary to qualify them for the I or GQ Series.
The more than 2,200 maps in the MF series are mostly black-and-white plotted on topographic or planimetric bases at a variety of scales. They cover both quadrangles and irregularly shaped areas. Most maps are accompanied by explanatory text printed on the map margin or in an accompanying pamphlet. Uses Geologic maps are used for a wide variety of purposes. A list of the uses of geologic maps might include:
• land use planning • energy and mineral exploration and production • evaluation of seismic and volcanic hazard risk • siting of nuclear power plants and waste repositories • identification of groundwater sources and pollution sites • selection of transportation right of ways • construction planning

7
• laying out of infrastructure, i.e. roads, power lines, sewers, pipelines, etc. A wide variety of federal agencies, including the Departments of Energy, Defense, and Transportation, the National Forest and Park Services, and the Federal Emergency Management Agency, use geologic maps regularly. In addition, most energy, mineral, mining, hydrologic and environmental firms routinely use geologic maps.

8
Strike & Dip As anyone who has observed rocks in the field knows, geology is a three-dimensional science. However, to convey geologic information we use geologic maps displayed on paper or computer screens, i.e. two-dimensional surfaces. Thus, we need a simple shorthand map notation that specifies an object's three-dimensional orientation on these two dimensional media. For tabular structures, strike and dip fix the object spatially and are one of a geologist's most commonly used tool.
Strike and dip are used to specify the 3-D orientation of tabular bodies like the vertical igneous dike running through the center foreground of this photo. Tabular bodies Strike and dip are most commonly used to describe the orientation of tabular geologic units or structures. A tabular geologic unit or body is one whose length and width are similar in magnitude but which greatly exceed its thickness. Consequently, their geometric shape is similar to a pizza box. Tabular units can be composed of igneous or sedimentary rocks. Typically, tabular igneous units are dikes (cross-cut their surrounding rocks) or sills (parallel to their host rocks). Nearly all type of sedimentary rocks are found as tabular strata.
Tabular bodies can be oriented in any direction in space. They can be vertical, horizontal or dip at any angle in between. In addition, the direction they dip can be in any compass bearing. Because of their geometric form, the orientation of a tabular unit is particularly easy to define by strike and dip.

9
Tabular bodies, such as this hypothetical sandstone bed, have lengths and widths much greater than their thicknesses. Definition
Strike is a line formed by the intersection a tabular body and a horizontal reference plane. It represents the location of those points on the unit that occur at the same elevation. The bearing of the line is the orientation of this line with respect to compass direction. Dip is the angle the layer makes with the horizontal reference plane. It is always measured perpendicular to the strike. Measuring the dip at angle to the strike of less than 90o will produce a lower dip than the true dip.
Strike and dip of a tabular geologic unit.
Strike and dip can be visualized by considering a tilted layer of rock exposed along a lake shore. When the lake is calm, the horizontal line along the rock layer defined by the water's surface is its strike. If it were to start raining, the rainwater would run down the surface of the rock in the dip direction. Map symbols
On a map, strike and dip are represented by a T-shaped symbol (Fig. 1). The long bar of the T is parallel to the strike and the short bar of the T indicates the dip direction. Since dip is always measured at right angles to strike, the strike and dip components are always perpendicular to each other. The dip angle is indicated by placing the angle (in degrees) next to the strike and dip symbol. In contrast, the strike orientation is not explicitly recorded by the strike and dip symbol.
To determine the strike of a feature on a geologic map, use a straight edge to lightly draw in pencil a line parallel the map's north direction that intersects the strike line

10
of the strike and dip symbol then xtend the strike line. The strike of the feature is the angle between these two lines and can be measured with a protractor.
Fig. 1: Strike and dip symbol on a map. Special symbols
In addition to the standard strike and dip symbol, there are three unique orientations of tabular bodies that require special strike and dip symbols. These include bodies that are vertical, horizontal and overturned. The appropriate symbols for these bodies are shown in Fig. 1.
Fig. 1: The various strike and dip symbols.
11
Measuring
There are two ways to express strike by:
• quadrant, e.g. S45oE • azimuth, e.g. 135o
Quadrant
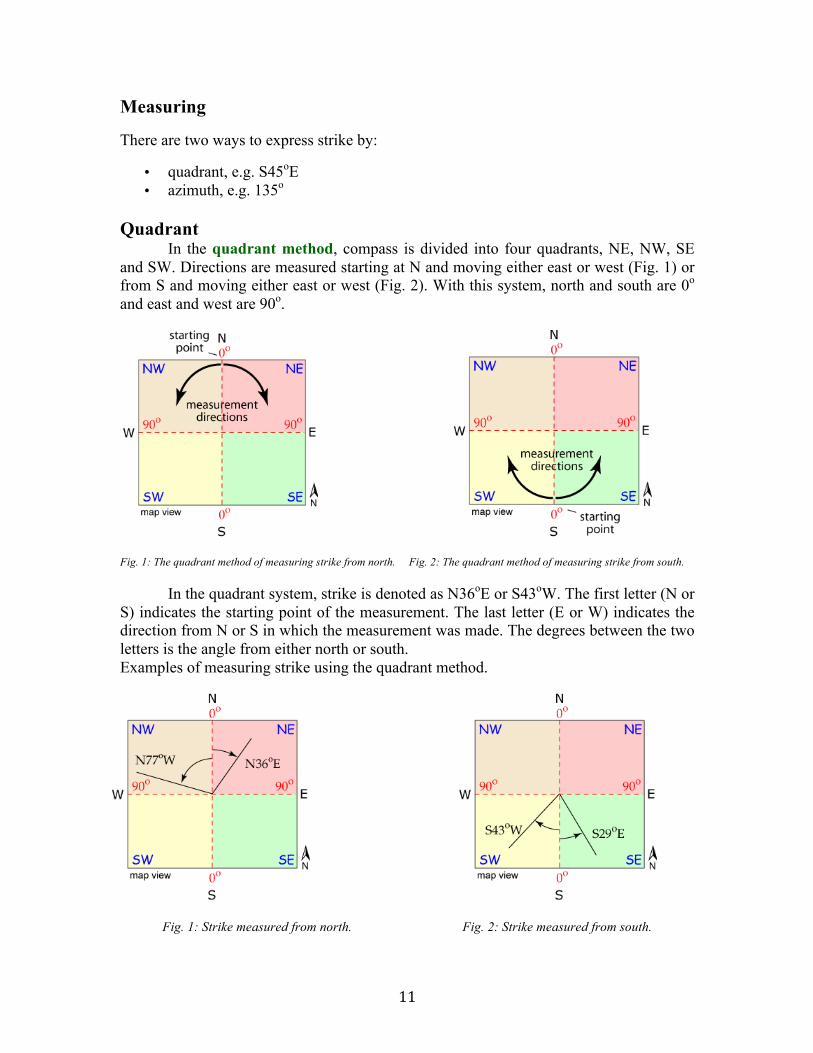
In the quadrant method, compass is divided into four quadrants, NE, NW, SE and SW. Directions are measured starting at N and moving either east or west (Fig. 1) or from S and moving either east or west (Fig. 2). With this system, north and south are 0o and east and west are 90o.
Fig. 1: The quadrant method of measuring strike from north. Fig. 2: The quadrant method of measuring strike from south.
In the quadrant system, strike is denoted as N36oE or S43oW. The first letter (N or S) indicates the starting point of the measurement. The last letter (E or W) indicates the direction from N or S in which the measurement was made. The degrees between the two letters is the angle from either north or south. Examples of measuring strike using the quadrant method.
Fig. 1: Strike measured from north. Fig. 2: Strike measured from south.
12
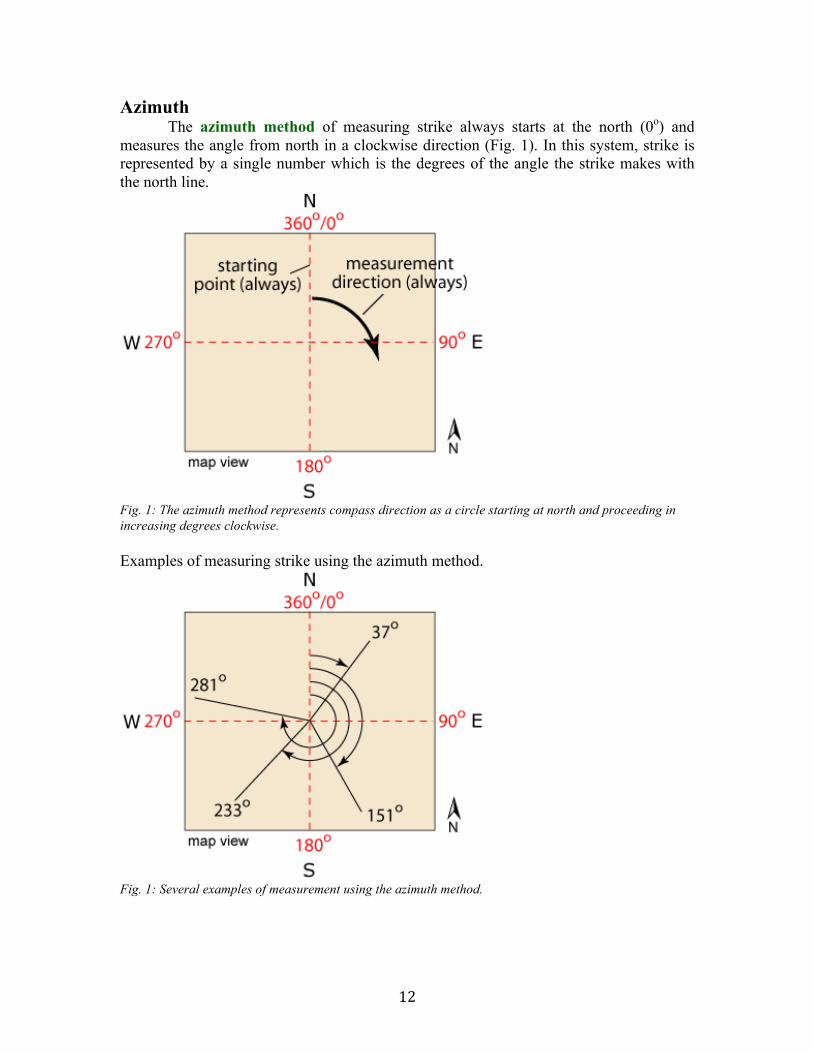
Azimuth The azimuth method of measuring strike always starts at the north (0o) and
measures the angle from north in a clockwise direction (Fig. 1). In this system, strike is represented by a single number which is the degrees of the angle the strike makes with the north line.
Fig. 1: The azimuth method represents compass direction as a circle starting at north and proceeding in increasing degrees clockwise. Examples of measuring strike using the azimuth method.
Fig. 1: Several examples of measurement using the azimuth method.

13
Reading Map outcrop patterns The width of a rock’s outcrop pattern on a map is a function of the actual unit
thickness, its dip, and the dip of the land surface. Clearly, a map’s outcrop pattern will be most complex when a large number of units outcrop in the area and the difference between the dips of the bed and surface slope is large. In addition, the shape of the rock unit plays an important role in determining outcrop pattern. The simplest and easiest-to-interpret patterns are those produced by tabular sedimentary strata, dikes, sills, or lava flows. When such units have been warped by deformation, the resultant outcrop patterns can become very complex and difficult to interpret solely from map information. Some clues for interpreting three-dimensional orientation can be gleaned by considering tabular bodies and the ways they can interact with the land’s surface. In addition, the outcrop patterns of individual rock units combined with topographic information can be used to determine strike and dip direction. Crude estimates of the magnitude of dip can also be made although these predictions are not as accurate. Flat strata Flat-lying strata of uniform thickness (Fig. 1) produce a very distinctive map outcrop pattern.
Fig. 1: Wax model terrain showing a horizontal strata of uniform thickness (side view).
In top view (Fig. 2), flat-lying strata produce outcrop bands that follow topographic contours.
Fig. 2: Top (map) view of wax model showing the constant, uniform outcrop pattern produced by flat-lying strata (top = map view).
14
Map view
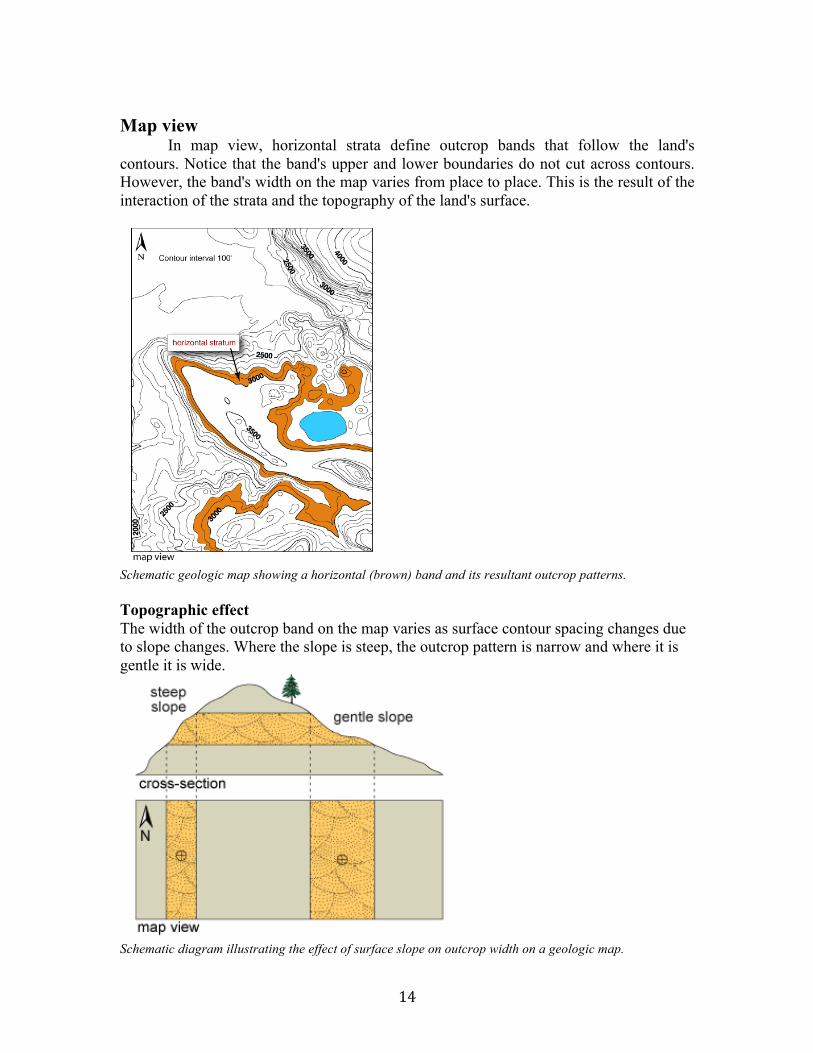
In map view, horizontal strata define outcrop bands that follow the land's contours. Notice that the band's upper and lower boundaries do not cut across contours. However, the band's width on the map varies from place to place. This is the result of the interaction of the strata and the topography of the land's surface.
Schematic geologic map showing a horizontal (brown) band and its resultant outcrop patterns. Topographic effect The width of the outcrop band on the map varies as surface contour spacing changes due to slope changes. Where the slope is steep, the outcrop pattern is narrow and where it is gentle it is wide.
Schematic diagram illustrating the effect of surface slope on outcrop width on a geologic map.
15
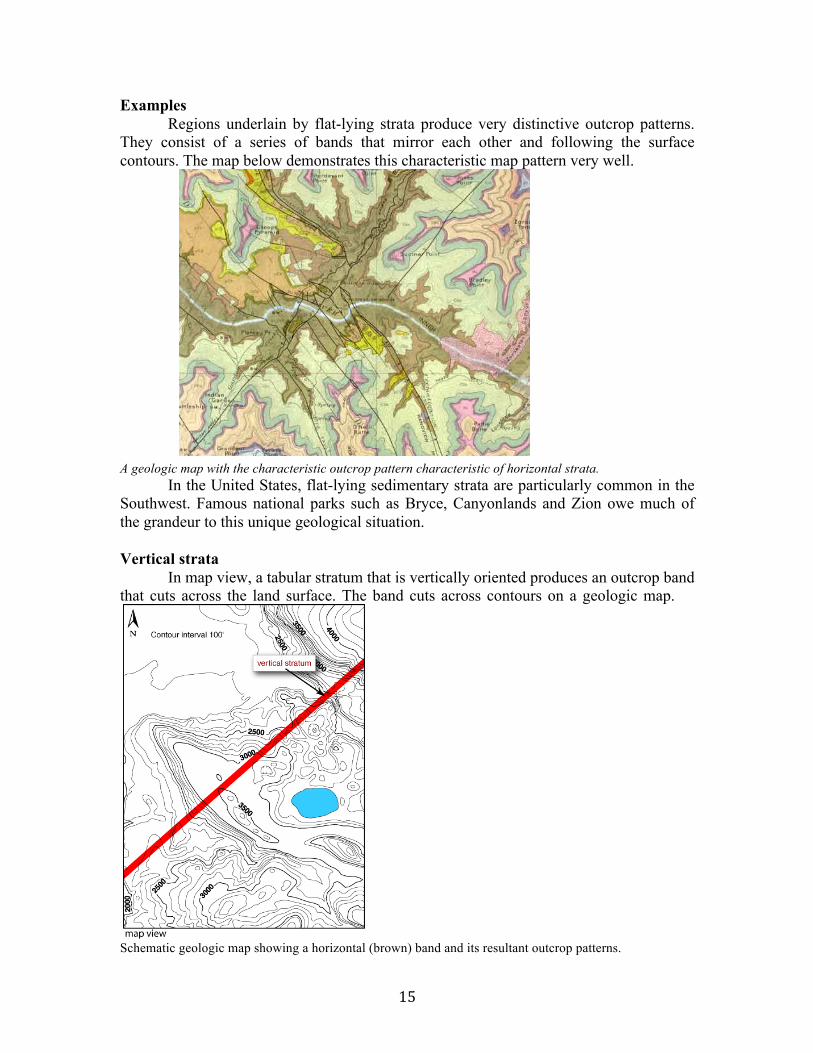
Examples Regions underlain by flat-lying strata produce very distinctive outcrop patterns.
They consist of a series of bands that mirror each other and following the surface contours. The map below demonstrates this characteristic map pattern very well.
A geologic map with the characteristic outcrop pattern characteristic of horizontal strata. In the United States, flat-lying sedimentary strata are particularly common in the
Southwest. Famous national parks such as Bryce, Canyonlands and Zion owe much of the grandeur to this unique geological situation. Vertical strata
In map view, a tabular stratum that is vertically oriented produces an outcrop band that cuts across the land surface. The band cuts across contours on a geologic map.
Schematic geologic map showing a horizontal (brown) band and its resultant outcrop patterns.

16
Topological effect Unlike for flat stratum, the outcrop band for vertical units cuts straight across
existing topography. The slope of the land's surface has no effect on outcrop width. If the band varies in width, the unit itself must vary in width.
Topographic slope does not vary the outcrop thickness of vertical strata on geologic maps. Example
The volcanic dikes in the center foreground of this photograph are vertically oriented. On a geologic map, they will define a straight band running across the region. In this case, the width of the unit on the geologic map reflects the true width of the dike. Along the strike of the dike, the width of the unit's pattern will vary only if the width of the dike varies.
Vertical volcanic dikes in SE Colorado.
17
Dipping Strata
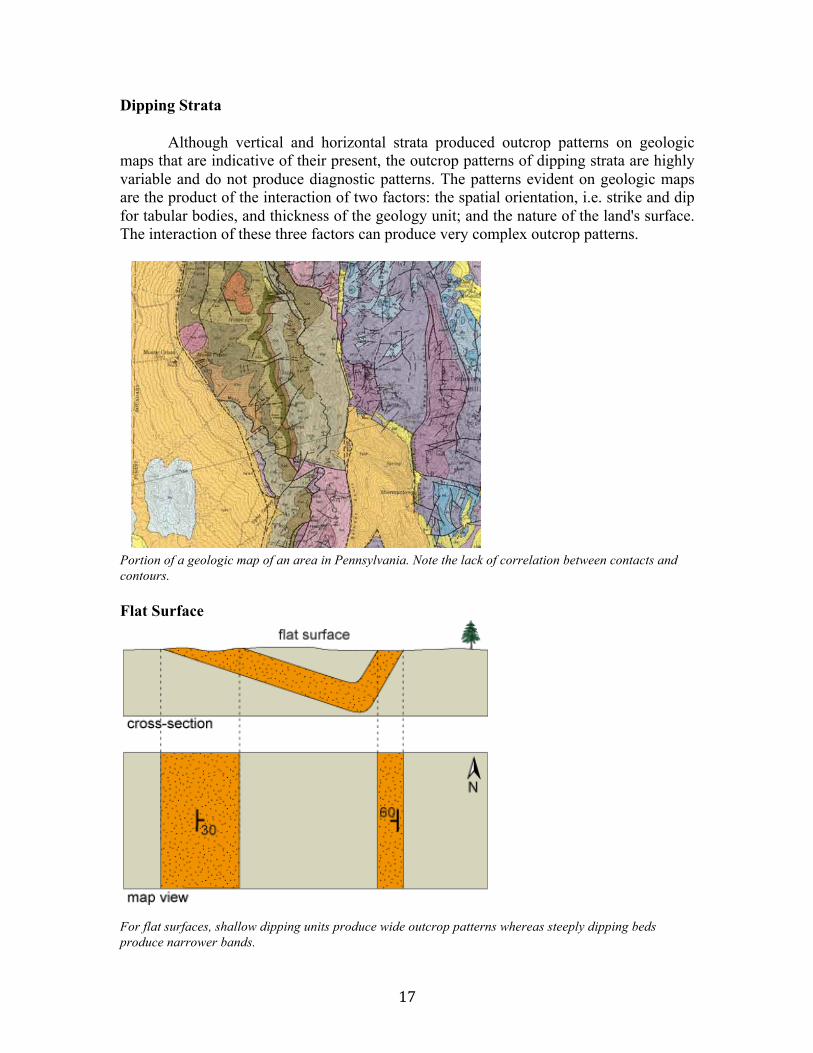
Although vertical and horizontal strata produced outcrop patterns on geologic maps that are indicative of their present, the outcrop patterns of dipping strata are highly variable and do not produce diagnostic patterns. The patterns evident on geologic maps are the product of the interaction of two factors: the spatial orientation, i.e. strike and dip for tabular bodies, and thickness of the geology unit; and the nature of the land's surface. The interaction of these three factors can produce very complex outcrop patterns.
Portion of a geologic map of an area in Pennsylvania. Note the lack of correlation between contacts and contours. Flat Surface
For flat surfaces, shallow dipping units produce wide outcrop patterns whereas steeply dipping beds produce narrower bands.
18
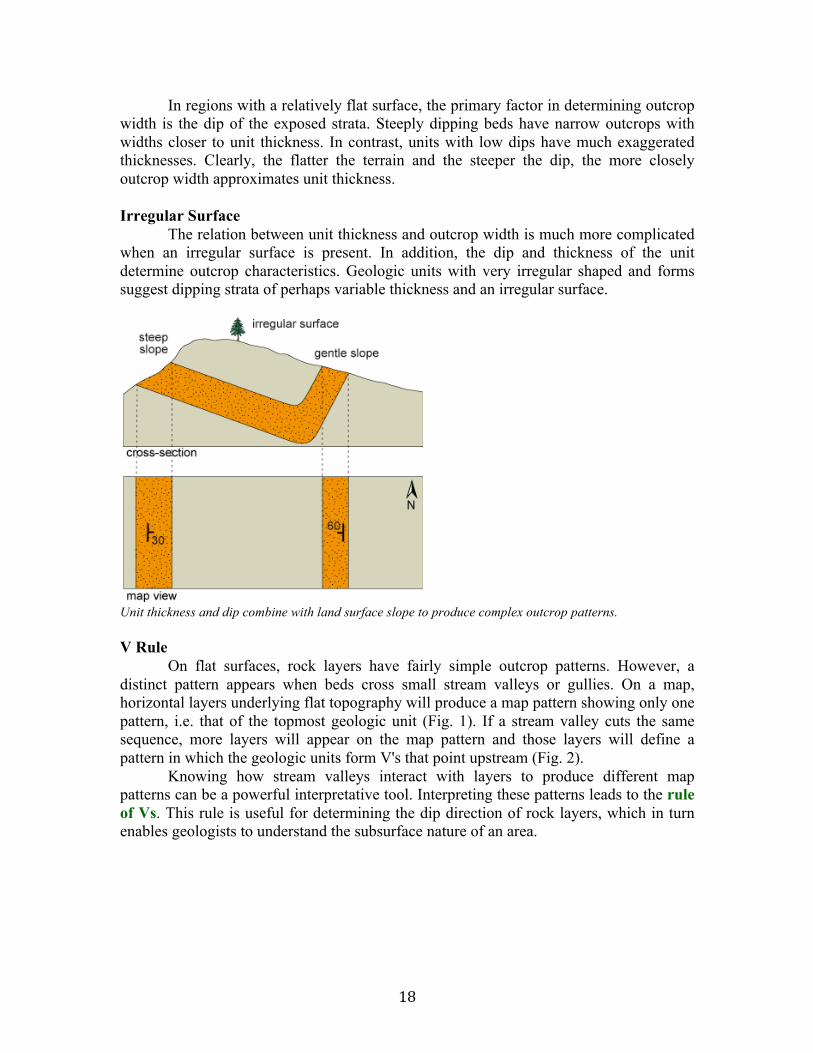
In regions with a relatively flat surface, the primary factor in determining outcrop width is the dip of the exposed strata. Steeply dipping beds have narrow outcrops with widths closer to unit thickness. In contrast, units with low dips have much exaggerated thicknesses. Clearly, the flatter the terrain and the steeper the dip, the more closely outcrop width approximates unit thickness. Irregular Surface
The relation between unit thickness and outcrop width is much more complicated when an irregular surface is present. In addition, the dip and thickness of the unit determine outcrop characteristics. Geologic units with very irregular shaped and forms suggest dipping strata of perhaps variable thickness and an irregular surface.
Unit thickness and dip combine with land surface slope to produce complex outcrop patterns. V Rule
On flat surfaces, rock layers have fairly simple outcrop patterns. However, a distinct pattern appears when beds cross small stream valleys or gullies. On a map, horizontal layers underlying flat topography will produce a map pattern showing only one pattern, i.e. that of the topmost geologic unit (Fig. 1). If a stream valley cuts the same sequence, more layers will appear on the map pattern and those layers will define a pattern in which the geologic units form V's that point upstream (Fig. 2).
Knowing how stream valleys interact with layers to produce different map patterns can be a powerful interpretative tool. Interpreting these patterns leads to the rule of Vs. This rule is useful for determining the dip direction of rock layers, which in turn enables geologists to understand the subsurface nature of an area.

19
Determining Dip The strike of a tabular body can be determined by finding two points on its
outcrop pattern that are at the same elevation (see figure). Since a line connecting these two points is horizontal, it parallels the unit’s strike. Such lines drawn at several elevations should parallel one another if the body is tabular. The direction of the dip can be determined by simply noting the direction in which the elevation of a series of these lines decreases (see figure).
Determining strike and dip direction for a tabular body from map patterns.
Fig. 1: Map pattern (top) produced by flat terrain and horizontal strata (bottom).
Fig. 2: Map pattern (top) produced by valleys cutting horizontal strata (bottom).

20
Map symbols Geologists use geologic maps to convey the 3-D complexity of geologic
structures to other geologists, policy makers and citizens. Because maps are printed on paper which has only two dimensions, symbols must be used to convey information about the third direction not directly depicted on the map, i.e. depth. Thus, geologists have a large number of specialized map symbols that quickly and efficiently convey a wide range of three dimensional information. The ability to read accurately a geologic map requires mastering this symbol set. Stratum
A stratum is a tabular or sheet-like body or layer of sedimentary rock that is visually distinguishable from the layers above and below it. The difference between the units may be due to changes in rock type (e.g. sandstone to limestone), color, grain size, sedimentary structures or other physical features. The plural of stratum is strata.
A package of sedimentary strata. Bedding
Bedding is the arrangement of sedimentary rocks into layers (beds) of varying thickness and character (Fig. 1). It also refers to the general physical and structural character or pattern of the beds and their contacts within a rock mass. Although mostly commonly applied to sedimentary rocks, the term bedding can also be used to describe the layered arrangement and structure of tabular igneous or metamorphic rock masses. The term is collective and denotes the existence of beds.
The spatial orientation of beds is denoted on a geologic map using the strike and dip symbol (Fig. 2). These denote the spatial arrangement of the beds as well as the degree of confidence in the data.
21
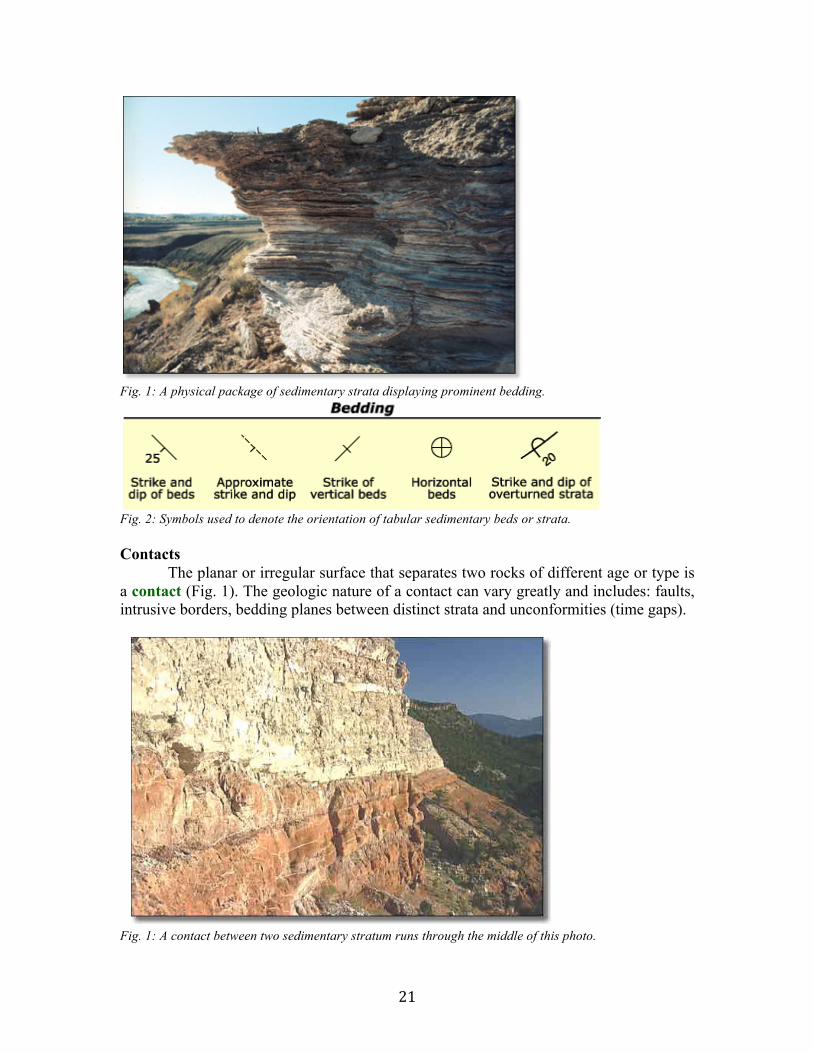
Fig. 1: A physical package of sedimentary strata displaying prominent bedding.
Fig. 2: Symbols used to denote the orientation of tabular sedimentary beds or strata. Contacts
The planar or irregular surface that separates two rocks of different age or type is a contact (Fig. 1). The geologic nature of a contact can vary greatly and includes: faults, intrusive borders, bedding planes between distinct strata and unconformities (time gaps).
Fig. 1: A contact between two sedimentary stratum runs through the middle of this photo.
22
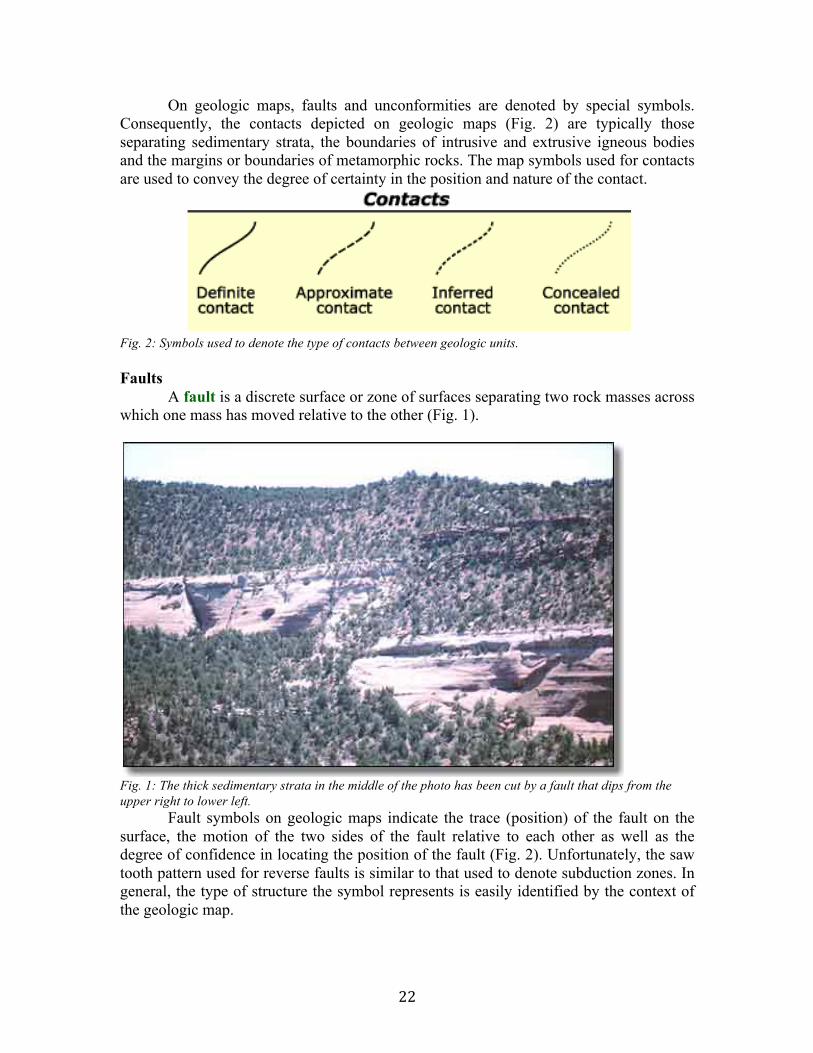
On geologic maps, faults and unconformities are denoted by special symbols. Consequently, the contacts depicted on geologic maps (Fig. 2) are typically those separating sedimentary strata, the boundaries of intrusive and extrusive igneous bodies and the margins or boundaries of metamorphic rocks. The map symbols used for contacts are used to convey the degree of certainty in the position and nature of the contact.
Fig. 2: Symbols used to denote the type of contacts between geologic units. Faults
A fault is a discrete surface or zone of surfaces separating two rock masses across which one mass has moved relative to the other (Fig. 1).
Fig. 1: The thick sedimentary strata in the middle of the photo has been cut by a fault that dips from the upper right to lower left.
Fault symbols on geologic maps indicate the trace (position) of the fault on the surface, the motion of the two sides of the fault relative to each other as well as the degree of confidence in locating the position of the fault (Fig. 2). Unfortunately, the saw tooth pattern used for reverse faults is similar to that used to denote subduction zones. In general, the type of structure the symbol represents is easily identified by the context of the geologic map.
23
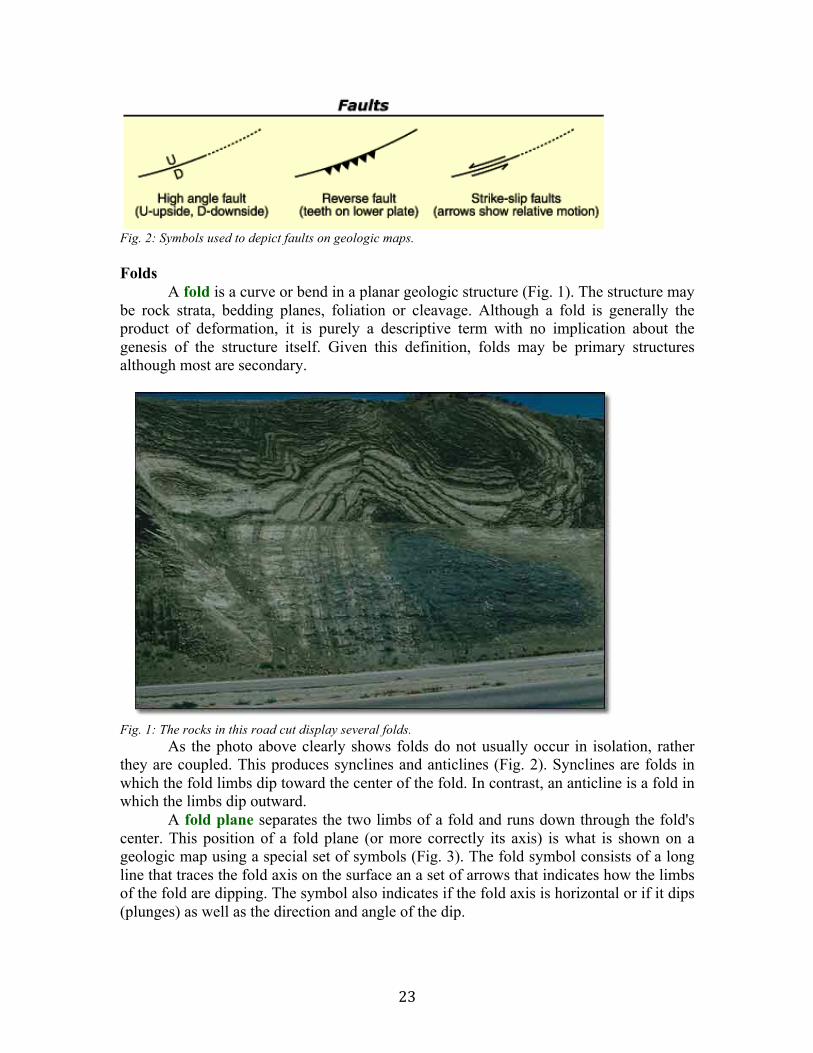
Fig. 2: Symbols used to depict faults on geologic maps. Folds
A fold is a curve or bend in a planar geologic structure (Fig. 1). The structure may be rock strata, bedding planes, foliation or cleavage. Although a fold is generally the product of deformation, it is purely a descriptive term with no implication about the genesis of the structure itself. Given this definition, folds may be primary structures although most are secondary.
Fig. 1: The rocks in this road cut display several folds.
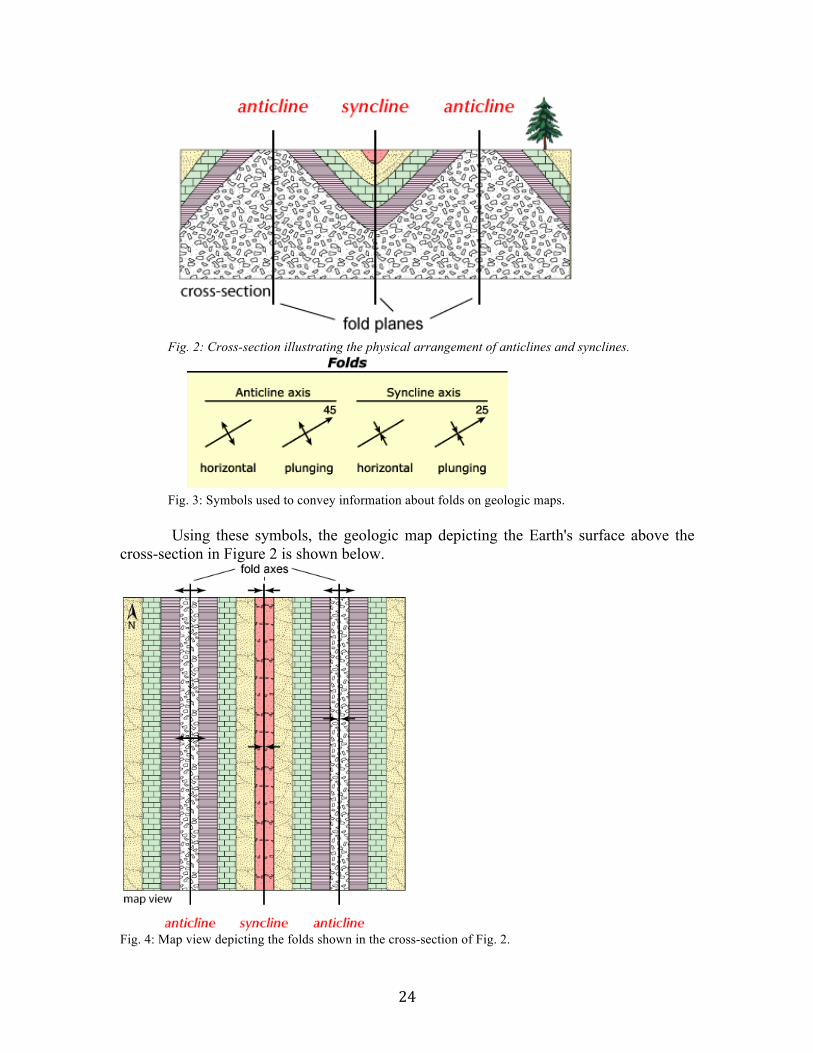
As the photo above clearly shows folds do not usually occur in isolation, rather they are coupled. This produces synclines and anticlines (Fig. 2). Synclines are folds in which the fold limbs dip toward the center of the fold. In contrast, an anticline is a fold in which the limbs dip outward.
A fold plane separates the two limbs of a fold and runs down through the fold's center. This position of a fold plane (or more correctly its axis) is what is shown on a geologic map using a special set of symbols (Fig. 3). The fold symbol consists of a long line that traces the fold axis on the surface an a set of arrows that indicates how the limbs of the fold are dipping. The symbol also indicates if the fold axis is horizontal or if it dips (plunges) as well as the direction and angle of the dip.
24
Fig. 2: Cross-section illustrating the physical arrangement of anticlines and synclines.
Fig. 3: Symbols used to convey information about folds on geologic maps. Using these symbols, the geologic map depicting the Earth's surface above the
cross-section in Figure 2 is shown below.
Fig. 4: Map view depicting the folds shown in the cross-section of Fig. 2.

25
Reference • Compton, R.R., 1962, Manual of Field Geology: John Wiley & Sons, Inc., New
York, NY, 378 pp. • McClay, K., 1991, The Mapping of Geologic Structures: John Wiley & Sons,
Inc., New York, NY, 161 pp. • Barnes, J.W., with R.J. Lisle, 2004, Basic Geological Mapping: John Wiley &
Sons, Inc., New York, NY, 184 pp. “Measuring Strike and Dip from Outcrop” The University of Calgary has created an excellent Web site on how strike and dip is defined and measured in the field. The site uses many pictures from the field to show how one actually measures the strike and dip of a geologic unit in the field. This site is definitely worth a visit. (http://courses.geo.ucalgary.ca/glgy203/images/sd1.htm)