Glanville Farm, Hinton Blewett, Development Barn BS29 5AT ...

This file is part of the following reference:
Kwelwa, Shimba Daniel (2017) Geological controls on
gold mineralization in the Kukuluma Terrain, Geita
Greenstone Belt, NW Tanzania. PhD thesis, James Cook
University.
Access to this file is available from:
http://researchonline.jcu.edu.au/49987/
The author has certified to JCU that they have made a reasonable effort to gain
permission and acknowledge the owner of any third party copyright material
included in this document. If you believe that this is not the case, please contact
[email protected] and quote
http://researchonline.jcu.edu.au/49987/
ResearchOnline@JCU

Page 1
Geological controls on gold mineralization in the Kukuluma Terrain, Geita Greenstone Belt, NW Tanzania
Thesis by
Shimba Daniel Kwelwa BSc, MSc UDSM (Tanzania)
for the degree of Doctor of Philosophy
in the College of Science and Engineering,
James Cook University, Australia
Original submission: December, 2016
Final submission: June, 2017

Page 2
TABLE OF CONTENTS
STATEMENT OF ACCESS
STATEMENT OF SOURCES DECLARATION
ELECTRONIC COPY DECLARATION
ACKNOWLEDGMENTS
CHAPTER 1.
INTRODUCTION AND THESIS OUTLINE
1.1. SUMMARY
1.2. ARCHITECTURE OF THE GREENSTONE BELT AND GOLD
MINERALIZATION
1.3. REGIONAL GEOLOGICAL FRAMEWORK
1.3.1. The Sukumaland Greenstone Belt
1.3.2. The Geita Greenstone Belt
1.3.3. Brief history of the Geita Gold Mine and gold mineralization
1.4. THESIS STRUCTURE
CHAPTER 2.
METHODS AND PROCEDURES USED IN MAPPING, CORE LOGGING AND 3-D
MODELLING OF MATANDANI, KUKULUMA AND A3 WEST DEPOSITS
2.1. INTRODUCTION
2.2. METHODOLOGIES
2.2.1. Mapping
2.2.2. Logging of diamond drill coreand rock chips
2.2.3. Rock types logged
2.2.4. Grade analysis/Assaying
2.2.5. Leapfrog modelling
2.2.6. Methodology for fault kinematic analysis
2.2.7. Methodology for major and trace element analysis
2.2.8. Methodology for zircon dating
2.2.9. Methodology for Hafmium (Hf) data collection

Page 3
CHAPTER 3.
THE STRUCTURAL HISTORY OF THE KUKULUMA AND MATANDANI
DEPOSITS AND CONTROLS ON GOLD MINERALIZATION, GEITA
GREENSTONE BELT, TANZANIA
3.1. SUMMARY
3.2. INTRODUCTION: GREENSTONE BELT AND GOLD MINERALIZATION
3.3. PREVIOUS STRUCTURAL WORK
3.4. ROCK TYPES AND STRATIGRAPHY OF THE KUKULUMA TERRAIN
3.4.1. Volcano-sedimentary units
3.5. THE HISTORY OF DEFORMATION AND INTRUSION IN THE CENTRAL
KUKULUMA TERRAIN
3.5.1. D1-bedding parallel shearing events
3.5.2. D2-D3 folding and shearing
3.5.3. D4 gentle upright folding
3.5.4. D5 recumbent folding and low-angle reverse fautling
3.5.5. D6 brittle-ductile shear zones
3.5.6. D7 faulting
3.5.7. The emplacement of intrusions during deformation
3.5.8. Syn-tectonic brecciation events
3.6. GOLD MINERALIZATION
3.7. DISCUSSION
3.7.1. Tectonic history of the Central Kukuluma Terrain
3.7.2. The nature of D1 events
3.7.3. Controls on gold mineralization
3.8. CONCLUSIONS
CHAPTER 4.
THE PETROGENESIS OF THE NEOARCHEAN KUKULUMA INTRUSIVE
COMPLEX, NW TANZANIA
4.1. SUMMARY
4.2. INTRODUCTION
4.3. THE KUKULUMA ITNRUSIVE COMPLEX

Page 4
4.4. ALTERATION AND ELEMENT MOBILITY
4.5. THE GEOCHEMISTRY OF THE KUKULUMA INTRUSIVE COMPLEX
4.5.1. The Monzonite Suite
4.5.2. The Diorite Suite
4.5.3. The Granodiorite Suite
4.6. THE PETROGENESIS OF THE KUKULUMA INTRUSIVE COMPLEX
4.6.1. The relative timing of emplacement
4.6.2. Depth and source of melts
4.6.3. Melt-Mantle interaction
4.6.4. Tectonic setting
4.7. CONCLUSIONS
CHAPTER 5.
ZIRCON U-Pb AGES AND HF ISOTOPE DATA FROM THE KUKULUMA
TERRAIN OF THE GEITA GREENSTONE BELT, TANZANIA CRATON:
IMPLICATIONS TO DEFORMATION HISTORY, SUPRACRUSTAL
STRATIGRAPHY, CRUSTAL GROWTH AND TIMING FOR GOLD
MINERALIZATION
5.1. SUMMARY
5.2. INTRODUCTION
5.3. PREVIOUS GEOCHRONOLOGY IN THE SUKUMALAND GREENSTONE
BELT
5.4. NEW ZIRCON AGES FROM THE KUKULUMA TERRAIN
5.4.1. Samples and field relationships
5.4.1.1. Samples KK51-Crystal tuff
5.4.1.2. Samples KK01- granodiorite dyke
5.4.1.3. Samples KK03- granodiorite dyke
5.4.1.4. Samples KK04- granodiorite intrusion
5.4.1.5. Samples MT20- granodiorite dyke
5.5. RESULTS
5.5.1. Geochronology
5.5.1.1. Samples KK51-Crystal tuff
5.5.1.2. Samples KK01- granodiorite dyke

Page 5
5.5.1.3. Samples KK03- granodiorite dyke
5.5.1.4. Samples KK04- granodiorite intrusion
5.5.1.5. Samples MT20- granodiorite dyke
5.5.2. Lu-Hf zircon results
5.6. DISCUSSION
5.6.1. Implications for the deformation history
5.6.2. Implications for the supracrustal stratigraphy
5.6.3. Timing of gold mineralization
5.6.4. Implications for crustal growth
5.7. CONCLUSIONS
CHAPTER 6.
CONCLUSIONS
REFERENCES
APPENDICES
A1. Map resources used
A2. Comparison of new stratigraphic units with the historical log data
A3. Description of type sections for drill cores
A4. Cross-sections used in 3-D modelling
A5. Results from Leapfrog modelling
A6. Lithological groupings in drill core
A7. Major and trace element analyses
A8. Data analyses of zircon standards used in geochronology

Page 6
STATEMENT OF ACCESS
I, undersigned, the author of this thesis, understand that James Cook University will make it
available of use within the University Library, and by microfilm or other means, allow access
to other users in other approved libraries.
All users consulting this thesis will have to sign the following statement:
In consulting this thesis, I agree not to copy closely or paraphrase it in whole or in part
without the written consent of the author; and to make proper public written
acknowledgement for any assistance that I have obtained from it.
Beyond this, I donot wish to place any restrictions on access to this thesis.
Shimba Daniel Kwelwa June, 2017

Page 7
STATEMENT OF SOURCES
DECLARATION
I declare that this thesis is my own work and has not been submitted in any form for another
degree or diploma at any other institution for tertiary education.
Information derived from published and unpublished work of others has been acknowledged
in the text and a list of references has been given.
Shimba Daniel Kwelwa June, 2017

Page 8
ELECTRONIC COPY
DECLARATION
I, the undersigned, the author of this thesis, declare that the electronic copy of this thesis
provided to the James Cook University Library is an accurate copy of the print thesis
submitted, within the limits of the technology available.
Shimba Daniel Kwelwa June, 2017

Page 9
ACKNOWLEDGMENTS
Firstly, I would like to thank the Geita Gold Mine management for funding this study as well
as giving me time to do my presentations and laboratory work at James Cook University in
northern Queensland, Australia. James Cook University is thanked for providing me with a
one year fee weaver through the Australia government research fund in order to finish-up my
studies at the time there was an economic crisis within the company due to a sudden fall in
the gold price.
My sincere appreciation goes to my university supervisors; Prof Paul Dirks, Dr Ioan Sanislav,
Prof Thom Blenkinsop and Dr Yvonne Cook. This group provided me with tireless support
during my entire course of study. Their boundless support and motivation inspired me to keep
going regardless of the rough situations that I faced during the course of this study. Many
thanks go to Mike Rubenach for the time that he dedicated to me for technical discussions on
various sections of my thesis.
I would also like to thank the staff working at the Advanced Analytical Centre at James Cook
University for providing me with technical assistance in terms of training in data collection
using the current state-of the art technology machines. Just to mention a few, Dr Kelvin
Blake is thanked for his support on electron microprobe and Dr Yi on the Laser Ablation
machine.
On the mine site, the former geology manager Steve Robins and his management team are
thanked for allowing me to do this study in a condusive environment. Craig Duvel, the
current head of the geology department is thanked for allowing me to have another visit to
James Cook University for six months in mid-2015 in order to finish-up my laboratory work
and other university requirements that needed my physical presence. My exploration
superintendent Hatari Mjinja and other members of the team are thanked for their tireless
support during my study. It will be unfair if I will not acknowledge the maximum support
that I got from a highly motivated team of field technicians such as Freeman Kaishe, Robert
Alphonce, Mkama Kajeri and Msafiri Solonga just to mention a few. These guys worked
really hard in this hilly and challenging terrain to make sure we accomplish what we planned
for particular days in the field.

Page 10
My former exploration manager Sergio L. Kolling is categorically thanked for inception of
the project and his continuous technical support that he provided to me since I joined the
company through the GGM-JCU the project. For sure, his tireless technical and motivational
support even during the weekends and late hours in weekdays was fantastic and non-
comparable. It is his technical support that has significantly helped me to build–up my
technical capabilities in mineral exploration and geology as a whole.
Lastly, I would like to thank my family for their love, patience, inspiration, moral support and
motivation that kept me strong even in times when I felt tired. Their motivation statements
and specifically from my mother pushed me to keep going fearlessly even in difficult
situations. It is for these reasons; I dedicate this work to my family.

Page 11
CHAPTER 1
INTRODUCTION AND THESIS OUTLINE
1.1. SUMMARY
A general introduction to greenstone belt geology and Archaean gold mineralization is
provided in which the broad parameters of different models for Archaean tectonic and
mineralization processes are discussed. This is followed by an overview of the geology of the
Tanzania craton, in which the general stratigraphy of the craton is introduced, after which the
geological setting of the Sukumaland and Geita greenstone belts is introduced in more detail.
These descriptions serve as general introductions to the structural history, intrusive history,
geochemistry and geochronology of the Kukuluma area, as presented in chapters 3, 4 and 5.
Following the introduction of the geological setting, the history of Geita Gold Mine will be
presented together with a brief outline of the structure of this thesis.
1.2. ARCHITECTURE OF GREENSTONE BELTS AND GOLD MINERALIZATION
The Archaean greenstone belts are elongate structures composed of supracrustal units
deformed in broadly synformal or keel-like shapes forming the younger units in most of the
Archaean Cratons such as Zimbabwe, Yilgarn, Dharwar, Superior and Tanzania Craton
(Chadwick et al., 2000; Percival et al., 2001; Jelsma and Dirks, 2002; Blewet et al., 2010;
Czarnota et al., 2010; Manikyamba and Kerrich, 2012; Bèdard et al., 2013; Anhaeusser,
2014; Sanislav et al., 2014). The supracrustal units that form these greenstone belts are made

Page 12
of bimodal metavolcanics intercalated with variable types of clastic sediments (Condie, 1994;
deWit and Ashwal, 2006; Anhaeusser, 2014), which are surrounded and intruded by tonalite-
trondhjemite-granodiorite (TTG) suites resulting in the formation of open, round antiforms,
arches or domes shapes (Bouhallier et al., 1995 and Anhaeusser, 2014).
To date, various tectonic models have been proposed to explain the geometric
configuration of these greenstone belts, but none of them have been satisfactory. These
models include vertical tectonics involving density inversion and diapiric emplacement of
mid- to lower-crustal melt into upper-crustal volcano-clastic sequences (e.g. Choukroune et
al., 1995; Chardon et al., 1996; Collins et al., 1998; Bédard et al., 2003; Van Kranendonk,
2011) or horizontal tectonic processes involving low-angle subduction and crustal stacking,
or core complex formation followed by late granite intrusions due to decompression melting
(Polat et al., 1998; Bouhallier et al., 1995; Kloppenburg et al., 2001;Jelsma and Dirks,
2002;Blewett et al., 2004; 2010a; Kabete et al., 2012), with these processes being linked to
early forms of plate tectonics, mantle plume activity or both (e.g. Moyen et al., 2006; Blewett
et al., 2010a).
In line with this debate, over the past few decades, geochemists have been conducting a
number of studies on the petrogenesis of the rocks of TTG or adakitic composition, which
form the dominant chemical composition of the Archaean rock record (Taylor and Mclennan,
1995; Condie, 2005; Moyen, 2011; Moyen and Martin, 2012; Tatsumi, 2008; Hacker et al.,
2015). The understanding of the tectonic models for greenstone belts formation become more
important during the Late Archaean period when major shifts in the composition of the TTG
suites are interpreted to reflect fundamental changes in global tectonics (e.g. Martin et al.,
2010; Moyen and Martin, 2012). In this geochemical perspective, two models have been
debated; a subduction–related model has been proposed as a suitable tectonic setting in the

Page 13
formation of the adakites and sanukitoids (Martin, 1999; Polat and Kerrich, 2001; Manya et
al., 2007; Manikyamba et al., 2007; Mohan et al., 2013; Kwelwa et al., 2013) like the
horizontal tectonics model described by Windley (1995). Alternatively, a vertical tectonic
model suggests that these “adakitic” rocks can form by melting thickened mafic lower crust
(e.g. Atherton and Petford, 1993; Rudnick, 1995; Wang et al., 2005), or through the
interaction of delaminated eclogitic lower crust with the underlying mantle (e.g. Bedard et al.,
2003; Gao et al., 2004; Wang et al., 2005; Goss et al. 2011).
The structural set-up and lithological composition are the key drivers for the
dominance of quartz vein or shear hosted gold deposits in greenstone belts. These deposits
formed in structural settings near major shear zones and quartz veins (Groves et al., 1998;
Goldfarb et al., 2005; Frimmel, 2008). Usually, these deposits are classified as orogenic by
linking their formation to the accretionary processes that occurred during the late stages of
cordilleran-type tectonics, where gold mineralization events correspond with shifts in the
stress regime from a compressional to a transpressional or transtensional phase, and that
suggests the existence of modern day plate tectonic during Archaean times (Kerrich et al.,
2000; Goldfarb et al., 2001, 2005; Groves et al., 2003, 2006; Bierlein et al., 2006; Frimmel,
2008; Begg et al., 2009; Dirks et al., 2013; Sanislav et al., 2015, 2016). To the contrary, a
some researchers propose an non-orogenic model for greenstone belt formation that involves
vertical melt segregation above mantle plumes challenging the orogenic origin for the lode
gold deposits (e.g. Bédard et al., 2014; Cook et al., 2015).
In many Archaean greenstone belts, the regional gold bearing structures are localized
within particular tectonic domains with suitable geological settings involving terrain
boundaries that act as first-order structures that control crustal-scale plumbing systems of
mantle-derived magma and hydrothermal fluids (e.g. Ridley et al., 1996; Goldfarb et al.,
2005; Phillips and Powell, 2010). The relationship between the regional structures, mantle –

Page 14
derived magma and hydrothermal fluids in the formation of these deposits make the
understanding of the timing of granitoid intrusion with respect to greenstone formation,
structural configuration of the controlling structures, host-rock, and intrusive geochemistry to
be important when targeting potential areas for gold mineralization on a terrain-scale.
Deposit-scale geology shows that the shear-hosted and lode-gold deposits are
associated with a number of dilatant, brittle-ductile structures that occur as secondary features
near major compressional or transpressional shear zones (Colvine et al., 1988; Groves et al.,
1998; Tripp and Vearncombe, 2004; Dirks et al., 2009). These shear zones act as the main
fluid pathways for the mineralizing fluids involving the repeated locking and reactivation of
fault planes in response to fluid pressure changes similar to the fault valve model (Sibson,
2001, 2004). Apart from the major brittle – ductile shear zones, gold mineralization locally
gets trapped in secondary structures including fracture arrays, breccia zones and fold hinges
within more brittle lithologies (Robert et al., 1991; Groves et al., 2000; Sanislav et al., 2015).
In these places, gold precipitation along the structural traps is facilitated by changes in
physico-chemical conditions of the fluids that occur during interaction between the gold-
bearing fluids with the wall-rock (e.g. Sanislav et al., 2015).
1.3. REGIONAL GEOLOGICAL FRAMEWORK
The supra-crustal stratigraphy of the Tanzania craton has been subdivided into three
main units (Fig. 1.1). The Dodoman Supergroup is the oldest unit, and consists of high-grade
mafic and felsic granulite with subordinate amounts of lower-grade schist and thin slivers of
greenstone (Kabete et al., 2012). The Nyanzian Supergroup overlies the Dodoman
Supergroup (e.g. Quennel et al., 1956; Gabert, 1990) and consists of a base dominated by
mafic volcanic units (i.e. the Lower Nyanzian comprising amphibolite, pillow basalt, andesite
and minor gabbro; Cook et al., 2015) dated at ~2823 Ma (Manya and Maboko, 2008; Cook et

Page 15
al., 2015) overlain by units dominated by felsic volcanic and pyroclastic rocks inter-bedded
with banded ironstone, chert, volcanoclastic sequences and immature turbiditic sediment (i.e.
the Upper Nyanzian; Kuehn et al. 1990; Borg 1992; Borg and Shackelton 1997; Borg and
Krogh 1999; Krapez, 2008).
The Kavirondian Supergroup rests unconformably on the Nyanzian Supergroup and
consists of a folded clastic assemblage composed of conglomerate, quartzite, grit, sandstone
and siltstone (Stockley, 1936; Harpum, 1970; Borg, 1992) deposited between ~2450 Ma and
~2762 Ma (Gabert, 1990; Chamberlain and Tosdale, 2007; Sanislav et al., 2015). Rocks of
the Nyanzian and Kavirondian Supergroups in general have been metamorphosed to
greenschist facies (Quennel et al., 1956). Locally, rocks record higher metamorphic grades
along major shear zones near margins of greenstone sequences, and as a result of contact
metamorphic processes (Borg and Shackleton, 1997).
The northern Tanzania Craton contains dispersed greenstone slivers that have been
grouped into six greenstone belts (Fig. 1.1), all clustered around the margins of Lake
Victoria, in a region commonly referred to as the Lake Victoria Gold Fields (Borg and
Shackleton, 1997). These greenstone belts include the Nzega, Musoma-Mara, Iramba-
Sekenke, Shinyanga-Malita, Kilimafedha and Sukumaland Greenstone Belts. Each of these
greenstone belts consist of several disconnected greenstone domains that have been grouped
based on stratigraphic correlations and geographic proximity; i.e. the various greenstone
portions may not necessarily share a common geological history (e.g. Kabete et al., 2012;
Cook et al., 2015). Kabete et al. (2012) proposed a terrane-based sub-division of the northern
Tanzania Craton in which the greenstone belts are interpreted as separate terrains accreted
across major lineaments (Fig. 1.1).

Page 16
Figure 1.1. Geological map of the northern half of the Tanzania Craton showing the main geological and tectonic units in the craton. SU — Sukumalanad Greenstone Belt; NZ — Nzega Greenstone Belt; SM—Shinyanga-Malita Greenstone Belt; IS—Iramba-Sekenke Greenstone Belt; KF—Kilimafedha Greenstone Belt; MM—Musoma-Mara Greenstone Belt. Super-terrane boundaries are as proposed by Kabete et al. (2012): ELVST— East Lake Victoria; MLEST —Mwanza Lake Eyasi; LNST — Lake Nyanza; MMST —Moyowosi-Manyoni; DBST — Dodoma Basement; MAST — Mbulu-Masai; NBT — Nyakahura-Burigi. Inset map of Africa shows the location of Archaean blocks. The figure has been adapted from Sanislav et al. (2015). The insert shows the study area as shown in figure 1.2 previously shown as Fig.2.
1.3.1. The Sukumaland Greenstone Belt
Of the six greenstone belts, the Sukumaland Greenstone Belt hosts most of the world-
class gold deposits including the Bulyanhulu, Geita Hill and Nyakanga deposits (Goldfarb et
al., 2001; Bierlein et al., 2006, 2009). Borg et al. (1990) and Borg (1994) describe the

Page 17
Sukumaland Greenstone Belt as an arcuate-shaped belt intruded by syn- to post-tectonic
granitoid of TTG affinity, and divide the belt into an inner arc dominated by Lower
Nyanzian, mafic volcanic rocks (Quennel et al., 1956; Borg, 1992; Borg and Shackleton,
1997) and an outer arc dominated by banded ironstone, felsic tuff and volcanoclastic
sediment of the Upper Nyanzian (Fig. 1.1; Barth, 1990; Borg, 1992; Borg and Shackleton,
1997). However, abundant mafic units have been described from the outer arc (e.g. Manya
and Maboko, 2008; Cook et al., 2015; Fig. 1.2), and sediments and felsic volcanic
intercalations are common in the inner arc (e.g. Cloutier et al., 2005; Manya and Maboko,
2008). In addition, young ages have been obtained from rocks in the inner arc, and old ages
from rocks in the outer arc (Borg and Krogh, 1999; Manya and Maboko, 2003; Chamberlain
and Tosdal, 2007), all indicating that the subdivision into an inner and outer arc is an
oversimplification of the greenstone stratigraphy in the area. Instead the Sukumaland
Greenstone Belt probably comprises several distinct greenstone fragments separated by major
shear zones and intrusives, which can be treated as greenstone belts in their own right (e.g.
Cook et al., 2015). Because of the uncertainty with the definition of the Sukumaland
Greenstone Belt, we prefer to adopt the terminology of Kuehn et al. (1990) and Sanislav et al.
(2014) who use the name Geita Greenstone Belt to refer to the segment of greenstone units
that host the Geita deposits.
1.3.2. The Geita Greenstone Belt (GGB)
The Geita Greenstone Belt (GGB, Fig. 1.2) forms an 80 x 25km large, generally east-
west trending portion of mafic and felsic volcanic, volcanoclastic and sedimentary units,
bounded to the south by a large, east-west trending shear zone that separates the belt from
gneiss and mylonitic granitoid. To the north, east and west the greenstone lithologies are

Page 18
intruded by late syn- to post-tectonic granitoid plutons dated at 2660-2620 Ma (Sanislav et al.
2014).
Age (Ma) Error
Dating Method Rock dated Comments Reference
2821 30 U-Pb zircon SHRIMP pyroclastic tuff SGB. Tulawaka;volcanism (pyroclastic tuff) Chamberlain and Tosdal, 2007*; Kabete et al, 2012; Sanislav et al, 2014
2808 3 single zircon U-Pb rhyolitic pyroclastic Upper Nyanzian, SGB Borg and Krogh, 1999*
2780 3 single zircon U-Pb rhyolitic pyroclastic Upper Nyanzian, SGB Borg and Krogh, 1999*
2779 13 U-Pb zircon SHRIMP felsic SGB. Nyanzaga;volcanism (pyroclastic tuff) Chamberlain and Tosdal, 2007*; Kabete et al, 2012; Sanislav et al, 2014
2771 15 U-Pb zircon SHRIMP tuff layer SGB. Nyamullilima, Geita; tuff interlayered with BIF Chamberlain and Tosdal, 2007*; Kabete et al, 2012; Sanislav et al, 2015
2770 9 U-Pb zircon SHRIMP rhyolite SGB. Masabi, Mega Hill, within the Siga Hills area; Chamberlain and Tosdal, 2007*; Kabete et al, 2012; Sanislav et al, 2014
2765 25 U-Pb zircon SHRIMP tonalite SGB. Kahama-Mwadui. Chamberlain and Tosdal, 2007*; Kabete et al, 2012; Sanislav et al, 2014
2758 7 U-Pb zircon SHRIMP diorite SGB.Imweru. Magmatism Chamberlain and Tosdal, 2007*; Kabete et al, 2012; Sanislav et al, 2014
2758 6 U-Pb zircon SHRIMP diorite SGB.Imweru. Magmatism Chamberlain and Tosdal, 2007*; Kabete et al, 2012; Sanislav et al, 2014
2758 7 U-Pb zircon SHRIMP diorite SGB.Imweru. Magmatism Chamberlain and Tosdal, 2007*; Kabete et al, 2012; Sanislav et al, 2014
2758 6 U-Pb zircon SHRIMP diorite SGB.Imweru. Magmatism Chamberlain and Tosdal, 2007*; Kabete et al, 2012; Sanislav et al, 2014
2743 12 U-Pb zircon SHRIMP diorite SGB. Lubando. Magmatism Chamberlain and Tosdal, 2007*; Kabete et al, 2012; Sanislav et al, 2014
2743 14 U-Pb zircon SHRIMP gabbro SGB. Lubando. Magmatism Chamberlain and Tosdal, 2007*; Kabete et al, 2012; Sanislav et al, 2014
2743 12 U-Pb zircon SHRIMP diorite SGB. Lubando. Magmatism Chamberlain and Tosdal, 2007*; Kabete et al, 2012; Sanislav et al, 2014
2743 14 U-Pb zircon SHRIMP gabbro SGB. Lubando. Magmatism Chamberlain and Tosdal, 2007*; Kabete et al, 2012; Sanislav et al, 2014
2738 9 U-Pb zircon SHRIMP tonalite SGB.-Geita. Magmatism Chamberlain and Tosdal, 2007*; Kabete et al, 2012; Sanislav et al, 2014
2738 9 U-Pb zircon SHRIMP tonalite SGB.-Geita. Magmatism Chamberlain and Tosdal, 2007*; Kabete et al, 2012; Sanislav et al, 2014
2719 16 U-Pb zircon SHRIMP dacites SGB. Bulyanhulu. Volcanism (pyroclastic tuff) Chamberlain and Tosdal, 2007*; Kabete et al, 2012; Sanislav et al, 2014
2710 10 U-Pb zircon SHRIMP porphyry dyke SGB. Bulyanhulu. Volcanism (minimum) Chamberlain and Tosdal, 2007*; Kabete et al, 2012; Sanislav et al, 2014
2699 9 U-Pb zircon age trachyandesite old Geita mine; monzodiorite? Borg and Krogh, 1999*
2698 12 U-Pb zircon SHRIMP gneiss/TTG SGB. Lubando. Deformation Chamberlain and Tosdal, 2007*; Kabete et al, 2012; Sanislav et al, 2014
2698 12 U-Pb zircon SHRIMP gneiss/TTG SGB. Lubando. Deformation Chamberlain and Tosdal, 2007*; Kabete et al, 2012; Sanislav et al, 2014
2697 10 U-Pb zircon SHRIMP quartz porphyry SGB. Geita. Volcanism (minimum) Chamberlain and Tosdal, 2007*; Kabete et al, 2012; Sanislav et al, 2014
2695 18 U-Pb zircon SHRIMP quartz-feldspar porphyry SGB. Geita. Volcanism (minimum) Chamberlain and Tosdal, 2007*; Kabete et al, 2012; Sanislav et al, 2014
2686 13 U-Pb zircon SHRIMP lamprophyre SGB. Geita. Au mineralization (minimum) Chamberlain and Tosdal, 2007*; Kabete et al, 2012; Sanislav et al, 2014
2684 21 U-Pb zircon SHRIMP feldspar porphyry Nyankanga pit, Geita; volcanism Chamberlain and Tosdal, 2007*; Kabete et al, 2012; Sanislav et al, 2014
2680 3 single zircon U-Pb migmatitic gneiss southern margin of SGB near Kahama; Borg and Krogh, 1999*
2680 9 U-Pb zircon SHRIMP granitoid SGB.Kahama-Mwadui. Magmatism Chamberlain and Tosdal, 2007*; Kabete et al, 2012; Sanislav et al, 2014
2670 21 U-Pb zircon SHRIMP feldspar dyke SGB. Biharamulo. Volcanism (minimum) Chamberlain and Tosdal, 2007*; Kabete et al, 2012; Sanislav et al, 2014
2667 14 U-Pb zircon SHRIMP feldspar porphyry dyke SGB. Imweru. Volcanism (minimum) Chamberlain and Tosdal, 2007*; Kabete et al, 2012; Sanislav et al, 2014
2666 8 U-Pb zircon SHRIMP granitoid SGB.Geita. deformation Chamberlain and Tosdal, 2007*; Kabete et al, 2012; Sanislav et al, 2014
2666 8 U-Pb zircon SHRIMP granitoid SGB.Geita. deformation Chamberlain and Tosdal, 2007*; Kabete et al, 2012; Sanislav et al, 2014
2661 14 U-Pb zircon LA-ICP-MS granite SGB. North of Geita. High-K granites Sanislav et al 2014*
2656 11 U-Pb zircon SHRIMP granitoid SGB.Kahama-Mwadui. Magmatism Chamberlain and Tosdal, 2007*; Kabete et al, 2012; Sanislav et al, 2014
2654 15 zircon U-Pb flow banded rhyolite SGB. lower Nyanzian from Kasubuya Borg and Krogh, 1999*
2653 10 U-Pb zircon SHRIMP granodiorite SGB. Kasubuya;magmatism Chamberlain and Tosdal, 2007*; Kabete et al, 2012; Sanislav et al, 2014
2652 10 U-Pb zircon LA-ICP-MS high-k granite SGB. North of Geita. High-K granites Sanislav et al 2014*
2646 14 U-Pb zircon SHRIMP high-k granite SGB. Bukoli. Magmatism Chamberlain and Tosdal, 2007*; Kabete et al, 2012; Sanislav et al, 2014
2644 3 zircon U-Pb lamprophyre dyke cross-cuts the ironstones at the Geita mine Borg and Krogh, 1999*
2642 32 U-Pb zircon LA-ICP-MS high-k granite SGB. North of Geita. High-K granites Sanislav et al 2014*
2634 41 U-Pb zircon LA-ICP-MS high-k granite SGB. North of Geita. High-K granites Sanislav et al 2014*
2628 12 U-Pb zircon LA-ICP-MS high-k granite SGB. North of Geita. High-K granites Sanislav et al 2014*
2623 15 U-Pb zircon LA-ICP-MS high-k granite SGB. North of Geita. High-K granites Sanislav et al 2014*
2617 11 U-Pb zircon LA-ICP-MS high-k granite SGB. North of Geita. High-K granites Sanislav et al 2014*
2717 12 U-Pb zircon LA-ICP-MS crystal tuff SGB. Kukuluma pit. Geita area This study
2661 16 U-Pb zircon LA-ICP-MS granodiorite dyke SGB.Kukuluma pit. Geita area This study
2658 15 U-Pb zircon LA-ICP-MS granodiorite dyke SGB.Kukuluma pit. Geita area This study
2662 6 U-Pb zircon LA-ICP-MS granodiorite intrusion SGB. Kukuluma terrain. Geita area This study
2651 14 U-Pb zircon LA-ICP-MS granodiorite dyke SGB. Matandani pit. Geita area This study
Table 1.1. Summary of the existing zircon ages from the SGB.

Page 19
The southern part of the GGB contains metabasalt with minor gabbro and a MORB-
like affinity, yielding ages of ~ 2823 Ma (Manya and Maboko 2008; Cook et al., 2015). The
remainder of the greenstone belt is dominated by meta-ironstone units intercalated with and
overlain by turbiditic meta-sedimentary units and volcanoclastic beds older than 2699 ± 9 Ma
(Borg and Krogh, 1999, Sanislav et al., 2015), and intruded by syn-tectonic igneous
complexes of dioritic to tonalitic composition (e.g. Sanislav et al., 2015, 2016) with intrusives
around Nyankanga and Geita Hill dated between 2686 ± 13 Ma and 2699 ± 9 Ma (U-Pb
zircon; Borg and Krogh, 1999; Chamberlain and Tosdal 2007). A summary of all zircon ages
from the GGB is presented in Table 1.1.
Figure 1.2. Geological map of the Geita Greenstone belt showing the distribution of the main lithological units, structures gold deposits in the area (modified from Sanislav et al., 2015). The insert shows the study area in figure 1.3. NT = Nyamulilima Terrain; CT = Central Terrain; KT = Kukuluma Terrain
Outcrop of the greenstone sequence is generally poor, with the exception of the meta-
ironstone units that form steep hills and ridges along the length of the GGB. The meta-
Fig 1.3
KT
CT
NT

Page 20
ironstone units are exposed in three distinct northwest-southeast trending terrains separated
by areas with little or no outcrop that are underlain by meta-sediments and characterized by
major lineaments visible on aero-magnetic datasets and interpreted as large shear zones or
terrain boundaries (Fig. 1.2). These terrains are the Nyamulilima terrain to the west, the
Central terrain in the middle, and Kukuluma terrain to the east (Fig. 1.2). The Nyamulilima
terrain contains three major gold deposits along a northwest-southeast trend (Ridge 8, Star &
Comet and Roberts; Fig.1.2). The Central terrain contains at least seven major gold deposits
with the three largest occurring along a northeast-southwest trend including the Geita Hill,
Lone Cone and Nyankanga deposits (Sanislav et al., 2015, 2016). The Kukuluma terrain
contains two major gold deposits and several exploration targets distributed along a
westnorthwest to eastsoutheast trend (Figs 1.2 and 1.3), referred to in this paper as the
Kukuluma Mineralized Trend. Two of these, the Matandani and Kukuluma deposits, were
mined until 2007. The nearby deposits of Area 3 are undeveloped. The area around
Matandani, Kukuluma and Area 3, within the central part of the Kukuluma Mineralized
Trend, forms the focus of this study. No detailed geological work is available for the
Kukuluma terrain apart from mine reports (Bansah et al., 2000; Porter, 2002; Skead, 2003).
1.3.3. Brief history of Geita Gold Mine and context of the study
The GGB hosts the Geita Gold Mine, which is a collection of gold deposits owned by
Anglo Gold Ashanti. Over the past five years, the mine has been performing very well in
terms of gold production. For example in 2015, Geita Gold Mine produced 476,880 ounces
against the set target of 525,747 ounces at an average cut–off grade of 0.5g/t Au.

Page 21
(a)
(b)
Figure 1.3. (a) Geological map of the central Kukuluma Terrain showing the position of the main gold deposits in the area. The distribution of the “Fe-rich bedded sediments” is derived from geophysics. (b) Geological map in the vicinity of the Matandani and Kukuluma pits.

Page 22
Gold mineralization within the GGB was discovered by a german prospector in 1898
(GGM internal report). A follow up regional survey in the area was conducted in 1930 by a
Kenyan Prospecting company, which resulted in a mine development in 1934-1936 at Geita
Hill as an underground operation.
The mining operations closed in 1966 due to the drop in gold price and changes in the
Tanzanian government policies on the mining sector. In 1994, Cluff Resources re-opened the
exploration activities in the area and operated for two years before selling its shares to
Ashanti in 1996. In 1998, Ashanti acquired SAMAX, which owned the Kukuluma Terrain.
Continued exploration by Ashanti Company within the Geita Greenstone Belt resulted into
the discovery and eventual opening of the Nyankanga world–class gold deposit as an open pit
in 1999. In the year 2000, AngloGold acquired 50% of the Ashanti`s Geita Gold Mine
shares, which resulted in the formation of the company known as AngloGold Ashanti. One
year later, in 2001, the open pit mining commenced at Lone Cone, a deposit connecting
Nyankanga and Geita Hill deposits. Mining started at Geita Hill deposit (currently known as
Geita Hill West deposit) in 2004. Continued exploration activities in the Kukuluma Terrain
led to the opening of the Kukuluma open pit in 2002 and the Matandani pit in 2005, which
were eventually suspended in 2006 and 2007 respectively due to the refractory nature (high
arsenopyrite content) of the ore. Mining in the Nyamullilima Terrain started in 2008 with the
Star and Comet open pit. Currently the Star and Comet deposit operates as an underground
mine.
The Kukuluma Terrain is one of the least studied parts of the GGB and there were no
systematic studies conducted on the geology of the deposits. The terrain hosts three deposits
(Matandani, Kukuluma, and Area 3 West) and two prospects (Central and South). The
deposits are overlain by a few meters’ thick regolith below which, the weathering profile is as

Page 23
deep as 150 m. The intensity of oxidation and weathering led to gold redistribution by
leaching up to 20m deep and supergene enrichment of gold near the base of the regolith
(Bansah et al., 2000). The leaching and supergene enrichment phenomena are evidenced by
the distribution of artisanal workings in the Kukuluma pit.
Historical exploration activities in 1994-1996 involved trenching of strong and weak
soil anomalies in deeply weathered and leached rock within the Kukuluma-Matandani area,
and gave a few results indicative of the potential existence of large ore bodies at depth. This
was supported by free gold found in old artisanal workings.
Follow-up exploration drilling conducted in the area returned 2-3 g/t average values
between 60-105 m depth at Kukuluma and a planar zone of gold enrichment was found
between the base of the regolith and the top of fresh rock (Bansah et al., 2000). Mining
conducted between 2002 and 2007 exposed the geology in the Matandani and Kukuluma pits.
Since 2007 no exploration activities were conducted in this area until 2011, when AngloGold
Ashanti resumed drilling for metallurgical testing. The aim was to investigate the feasibility
of mining the arsenopyrite-rich ore and to test potential extensions both down-dip and along
strike of the known orebodies in the individual deposits.
Internal mine reports (Skead, 2003; Bansah et al., 2000; Porter, 2002) proposed that
gold mineralization in the Matandani and Kukuluma deposits is spatially linked to the major
northwest-southeast trending, steeply dipping Juma and Kasata shears. At Kukuluma deposit,
for example, the Juma shear zone locally cuts obliquely along limbs of a fold described by
Skead (2003), whereas the Kasata shear intersects a fold hinge. In Area 3 West, gold
mineralization occurs at the intersection of crosscutting northeast faults with northwest
shears. The gold is associated with arsenopyrite in magnetite-rich bands or occurs with
silicification and quartz veins at the sheared contact between the ironstones and felsic tuffs.

Page 24
The mineralization is described as high grade over relatively narrow widths (e.g.
18.85g/t@6m, 13.9 g/t @8m etc). The internal mine reports focused on the distribution of the
gold mineralization within the mineralized zones only and therefore the overall geology of
the area and the geological controls on gold mineralization remained unknown.
1.4. THESIS STRUCTURE
This thesis applies a multidisciplinary approach to better understand the geology of the
Kukuluma Terrain and the geological controls on gold mineralization. I used a combination
of field, computer and laboratory based techniques to help me constrain a variety of factors
influencing the gold mineralization. This thesis is subdivided into 6 chapters with appendices
as follows:
Chapter 1 is the introduction to the thesis study topic and the geological setting of the
Tanzania craton and Geita Greenstone Belt. It also provides a brief history of the Geita Gold
Mine.
Chapter 2 presents the methodologies followed in compiling the data sets presented in
chapters 3, 4 and 5. I report on data collected from internal mine reports, regional and pit
scale geological mapping, drill core logging, cross-section interpretations, and 3D modelling
using Leapfrog (software version 3.1.1), and provide an overview of the methodologies used
in the structural (chapter 3), geochemical (chapters 4 and 5) and geochronological (chapter 5)
studies.
Chapter 3 presents the first detailed structural evolution history of the Kukuluma Terrain and
discusses the structural controls on gold mineralization. The structural evolution of the area
was developed based on overprinting relationships observed from detailed regional and

Page 25
deposit-scale geological mapping, drill core logging and the review of historical datasets such
as maps and geophysical images, the details of which are included in chapter 2. I use the
relationships between the distribution of gold mineralization and different structures to place
spatial and temporal correlation between the structural evolution and the mineralizing event. I
also constrained the relative timing of dykes and intrusive rocks emplacement in relation to
deformation and mineralization. This chapter has been prepared for publication.
Chapter 4 deals with the petrogenesis of the dykes and intrusive units within the Kukuluma
Terrain. I present detailed petrographic descriptions of the igneous rocks and high quality
major and trace element geochemical analyses. The igneous rocks that intruded the
Kukuluma Terrain form three suites: a monzonite suite, a diorite suite, and a granodiorite
suite. Because the three suites overlap in space and partly in time I grouped them into the
Kukuluma Intrusive Complex. The monzonite and the diorite suites form a ~ northwest-
southeast oriented body that runs through the middle of the Kukuluma Terrain and they are
virtually undistinguishable in the field while the granodiorite suite occurs mostly as dykes
with various orientations and locally form small intrusive bodies. The petrogenetic evolution
of the igneous rocks is of particular importance, because of their close spatial relationship
with the gold mineralization. It is also possible that fluids related to the emplacement of the
igneous rocks may have played a role in gold mineralization. For example, the timing of
emplacement and the geochemical characteristics of sanukitoid-type igneous rocks have been
linked to gold mineralization in many Archaean gold deposits (Mikkola et al., 2014). This
chapter has been submitted for publication.
Chapter 5 presents the first zircon ages and Hf isotope data from igneous rocks and
sediments from the Kukuluma Terrain. The geochronological results are used to constrain the
absolute timing of emplacement and deformation where possible. The results of zircon dating

Page 26
made it possible to place a maximum mineralization age in the area. The detrital age data is
used to understand the timing of sedimentation in the area, but also set up the timing on the
beginning of deformation in the area. I used the Hf isotope data to better constrain the sources
and to understand the processes of crustal growth in this part of the Tanzania Craton. This
chapter has been submitted for publication.
Chapter 6 contains the conclusions of the thesis and provides recommendations for further
work in the area.
Chapters 3, 4 and 5 have been written as papers to be submitted to international
journals. Chapter 3 has been written using a similar structure as that used by Sanislav et al.
(2015, 2016), and will be submitted to the African Journal of Earth Sciences or a similar
journal. Chapter 4 in its current form has been submitted to Precambrian Research and is
under review, Chapter 5 will be submitted to a suitable international journal. Because of this
approach there is some overlap in materials presented in the various chapters. However, I
have tried to minimize this overlap, by presenting the introductory geological setting only
once (in Chapter 1), and by combining all methodological sections in Chapter 2.

Page 27
CHAPTER 2
METHODS AND PROCEDURES USED IN MAPPING, CORE
LOGGING AND 3-D MODELLING OF THE MATANDANI,
KUKULUMA AND AREA 3 WEST DEPOSITS.
2. 1. INTRODUCTION
This chapter explains the methods and procedures that were followed during surface
mapping, drill core logging, chip logging and the construction of the 3-D geological models
for the Matandani, Kukuluma and Area 3 West deposits. These models and the associated
maps and logs provide the basic datasets that underpin the geological (structural and
intrusive) framework presented in chapter 3, and the geochemistry and geochronology work
presented in chapters 4 and 5 respectively.
In conducting the mapping, logging and modelling, a number of challenges were
encountered during the compilation of historical data sets, including: incomplete back-ground
information (e.g. collar position for drill holes); cross-sections without coordinates; and
geological maps for which projections were not known. In addition, the nomenclature used to
describe lithologies in the company`s database did not always match the lithological names
and codes used in historical reports.
This made it necessary to review large amounts of data (e.g. Table A2-1) in order to
generate a consistent nomenclature and stratigraphy for the lithologies in the area (as
presented in Chapter 3), by grouping related geological units and providing them with a
proper lithological name based on petrological and geochemical work (as presented in

Page 28
Chapter 4). The standardized geological nomenclature was than used to define stratigraphic
subdivisions from which 3-D models were built.
2.2. METHODOLOGIES
2.2.1. Mapping
All mapping was done in UTM with information referenced to datum ARC1960, 36S.
Surface geological mapping was conducted in open pits, along road cuts and river valleys
using high-definition aerial photography and digital terrain models provided by GGM. In
mapping, use was made of historical maps held in the GGM database, which were mostly
compiled during the exploration phase for the mine in the 1990’s and early 2000’s (see
Appendix A1). Because of poor outcrop, use was made of high-resolution geophysical
images including airborne magnetics, radiometrics and surface EM (electromagnetics), to
identify the aerial extent of mainly magnetic units (the cherts and ironstones) and structures
(see Appendix A1).
All data and maps produced were scanned and georeferenced (UTM36S, Arc1960) in
GIS ArcMap software (v. 10.3.1) and entered into the mine database. This information forms
the basis for the geological maps presented in this theses (e.g. Fig.1.3).
2.2.2. Logging of diamond drill cores and rock chips.
Cross-sections, maps and 3-D models are largely based on the re-logging of drill core
and rock chips that were collected in the early 2000`s and kept in the database, and the
collection of new data from drill core obtained between January 2013 and early 2016. A total
of 14600 drill holes were used in the reconstruction of the 3-D geology, spread across the
three deposits (Fig.2.1a; Appendix A2).

Page 29
(a)
(b)
Figure. 2.1 (a) Regional geological map of the Kukuluma terrain showing the topography and spatial distribution of drill holes (black coloured dots) in Matandani, Kukuluma and Area 3 West deposits; (b) Distribution of drill holes around the Matandani deposit used in 3D-modelling. The image is taken looking north with reference to the Kukuluma Local Mine Grid (i.e. Local = UTM + 44.5degrees)
Of these, 11000 had been logged previously by Geita Gold Mine exploration
geologists. The re-logging of drill cores and chips was done for 13000 drill holes as part of
this study in order to get a consistent observational base from which to construct the surface

Page 30
maps and cross-sections. Core logs with structural measurements and data on lithologies,
alteration and ore-grade were entered into the GGM data base.
Each logged drill core was photographed following the GGM standard operating
procedure for diamond drill core photography (Brayshaw, 2011). Specific areas of interest
were selected and described in more detail to assist in geological interpretations. Rock chip
samples obtained from percussion drilling were split for gold analysis. Sampling for logging
and assays was done on a 1 m interval as per GGM standard chip sampling procedure. Gold
assay results are taken as an average value within the sampled meter. The accurate logging of
rock chips is difficult in the deeply weathered regolith, which can be up to ~100 m thick. To
overcome rock identification problems, logging of the rock chips was done in an interactive
manner with the logging of diamond drill cores that originated from nearby the percussion
holes.
2.2.3. Rock types logged
Due to a lack of consistency in the historical logs, a standardized nomenclature was
developed for the rock types encountered in the Kukuluma terrain. Note that historically there
has been a great deal of variability in the way some of the units have been identified in drill
core. The details of the standardized nomenclature based on the re-logging campaign versus
the historical names in the database are summarized in Appendix A2, Table A2.1. A
summary stratigraphy constructed from these drill cores is shown in figure 2.2.
2.2.4. Grade analysis/Assaying
During logging of drill cores, ore zones were first identified using visual indicators of
mineralization including increased silicification and carbonate ± chlorite alteration, and
fracture networks in-filled with pyrrhotite. High-grade zones are characterized by the

Page 31
development of cubical arsenopyrite and the replacement of magnetite by pyrrhotite. In rock
chips, mineralized zones are harder to identify, but they can be recognized based on the
presence of highly silicified and sulphidized chips.
Once a mineralized zone has been identified, the core was cut, and half-core was
assayed. In relatively barren zones, assay results were collected at sample intervals of 1 m. In
well-mineralized zones, a standard sampling interval of 0.5 m has been used. Samples were
assayed at the on-site SGS laboratory, and results entered in the data base and used to model
ore envelopes. Envelopes were reconstructed in Leapfrog at a lower cut off of 0.5g/t. Higher
grade envelopes were constructed at >1 g/t as required.
Figure 2.2. Summary stratigraphy for the Kukuluma terrain.

Page 32
2.2.5. Leapfrog modeling
3-D models have been constructed from geological maps and cross-sections
(Appendix A4). The cross sections were constructed from surface maps and drill cores. The
most detailed 3-D model (i.e. the model based on the largest number of reconstructed
sections) presented in this study is from the Matandani deposit (Appendix A5; Fig. A5.1),
which has been the focus of exploration in recent years.
Geological modelling was done using Leapfrog Geo software (v. 3.1.1). In this
project, a local UTM grid, called the Kukuluma Local Mine Grid (KLMG) was used for data
input. This grid was constructed at a high angle to the expected envelope of the ore bodies.
The relationship between the KLMG and the regional UTM grid (i.e. ARC1960, 36S) is as
follows: KLMG = Arc 1960, 36s UTM + 44.5°.
Drillholes were drilled along the north-south line on the local grid, either plunging to
the southwest or to the northeast at an approximate plunge of 65°. Drill spacing is variable.
The locations of drill holes used in this study are shown in figure 2.1.
All datasets were imported into Leapfrog before modelling was done, including: drill
hole data (collar position, down hole orientation survey, gold assay results and lithological
units). Validation of the drill hole data was done by making sure that all data entry is
consistent. All lithological units entered were grouped as shown in Table A2.1.
After all data was entered into Leapfrog, logging data was projected onto vertical
section planes. These section planes were used as base maps for the drawing of cross
sections. Cross sections were constructed along the north-south lines in the KLMG at
intervals of 50-100m (Appendix A4; Fig. A4.1). In this context it is important to note that
sections constructed during the earlier stages of this project (e.g. the Kukuluma sections; Fig.

Page 33
A4.2b) did not fully capture all the deformational details, whereas later sections (e.g. some of
the Matandani and Area 3 West sections; Fig. A4.2c) more faithfully reflect the complex fold
interference patterns described in Chapter 3. Once hand-drawn sections were completed and
cross checked by supervisors on the mine, the sections were scanned, digitized and imported
into Leapfrog.
The cross sections have been used as the base information for constructing 3-D solids
of lithological units and ore-envelopes in Leapfrog. The data in cross sections was augmented
with drill core data obtained away from section lines. Results of the 3-D modelling for each
of the ore bodies have been included in Appendix 5 (Figs A5.1, A5.2 and A5.3).
2.2.6. Methodology for fault kinematic analysis
Results of kinematic analysis for faults in the Kukuluma and Matandani pits have
been presented in Chapter 3 (Figs 3.6 and 3.9). The methodologies on which the analyses are
based are briefly summarized below. Kinematic data from faults can be used to reconstruct
palaeo-stress fields (e.g. Angelier and Mechler, 1977). For this, information is required on the
orientation of the fault plane, the slip direction visible as slickenlines, striations or gouge
marks, and the sense of movement. Stress inversion techniques rely on the assumption that
the slip direction coincides with the resolved shear stress on the fault plane, and that the set of
faults used in the analysis, formed or were active in response to the same far field stress.
Fault-slip data can be inverted to a reduced moment tensor with information on the direction
of the principal stress axes with their relative size expressed as a stress ratio (Angelier, 1994;
Delvaux and Sperner, 2003). This reduced stress tensor can be calculated using the P and T
axes that bisect the fault plane and an auxiliary plane perpendicular to the fault, by using
least-square minimization techniques of direction cosines (e.g. Marrett and Allmendinger,
1990) or iterative methods that test a variety of possible tensor solutions (e.g. Etchecopar et

Page 34
al., 1981). Stress axes can also be determined graphically using the right dihedron method
(Lisle, 1987; Delvaux and Sperner, 2003), which constrains the orientation of principal stress
axes by determining the area of maximum overlap of compressional and extensional
quadrants for a suite of faults.
In analyzing the fault-slip data, we have used a linked Bingham distribution tensor
calculated with the programme FaultKinWin (Allmendinger, 2001, 2012) following methods
described by Marrett and Allmendinger (1990), and Cladouhos and Allmendinger (1993).
The FaultKinWin programme (Allmendinger, 2001) uses the distribution of P and T axes for
a suite of faults to calculate a Bingham axial distribution based on a least squares
minimization technique for direction cosines. In this technique, the dihedral angle between
the fault plane and an auxiliary plane is 90º and bisected by P and T axes. The eigenvectors
for the calculated Bingham axial distribution provide average orientations for the maximum,
minimum and intermediate concentration direction of the P and T axes, and the eigenvalues
provide a measure of the relative concentration, or distribution of P and T axes. These
eigenvalues vary between -0.5 and +0.5, with maximum values reached when P and T axes
are perfectly concentrated. Variations in the eigenvalues (ev) can be linked to the stress
regime using the relative size of the normalized eigenvalues expressed in a ratio, Rev, (with
Rev = [ev2-ev3]/[ev1-ev3]) (constrictional stress: Rev=1 with ev1 = ev2; plane stress: Rev
=0.5 with ev2 = 0; flattening stress: Rev = 0 with ev2 = ev3). The FaultKinWin programme
output is a plot of linked Bingham axes with eigenvalues and a related fault plane solution
diagram displaying P and T quadrants in a manner similar to earthquake focal mechanisms
(Figs 3.6 and 3.9 in Chapter 3).
Although stress analysis from fault slip data is widely applied, debate continues
whether the obtained solutions represent a stress field or provide a measure of strain and
strain rate (e.g. Molnar, 1983, Twiss and Unruh, 1998). Marrett and Allmendinger (1990)

Page 35
and Allmendinger (2001), using FaultKinWin, prefer to interpret the fault plane solutions as
an indicator of strain rather than stress. Here, the linked Bingham fault plane solution through
FaultKinWin has been interpreted as an indication of the palaeo-stress field. In doing this we
are aware of the various pitfalls. Faults, once formed, can interact in complex ways in
response to an imposed stress-field due to scale-dependent strain partitioning, complex fault
interactions, block rotations, inhomogeneities in the rock mass etc. (e.g. Twiss and Unruh,
1998). In spite of such limitations, the palaeo-stress analysis technique has been successfully
applied in a wide variety of tectonic settings (e.g. Sperner et al., 2003; Dirks et al., 2009,
2013), and we believe that it does provide valuable insights in the tectonic controls on gold
mineralization at Kukuluma.
Misfits in collected datasets may have resulted from observational errors, the mixing
of unrelated data points or limitations in the approach used. They can also be due to non-
uniform stress fields as a result of fracture interactions, anisotropies in the rock mass, block
rotations or slip partitioning. In calculating a Bingham tensor solution using FaultKinWin all
data points collected were included, and every measurement was given the same weight. It is
stressed that throughout the analyses of datasets, few data points were incompatible with the
final results, suggesting generally homogeneous data.
As a general rule, the results from the palaeo-stress analyses are best constrained for
large data sets that combine fracture planes with different directions and movement sense.
Thus, conjugate fracture sets, or Riedel, anti-Riedel and P-shear arrays provide good results
more likely to be indicative of the regional palaeo-stress field, especially if the stress
inversion is based on at least 15 fracture planes (Delvaux and Sperner, 2003; Sperner et al.,
2003), whilst sites in which only few planes, or planes in a limited number of directions can
be measured provide at best an indication only of the local palaeo-stress field, which may or
may not conform with the regional results.

Page 36
2.2.7. Methodology for major and trace element analyses
With respect major and trace element analyses as reported in Chapter 4, all
geochemical analyses were performed at the Advanced Analytical Centre at James Cook
University (JCU) on samples collected from drill cores. All samples were collected away
from the mineralized zones to minimize the effect of alteration. Representative sample
material was milled to a fine powder in a tungsten carbide ring mill. Major elements were
analyzed by conventional X-ray fluorescence (XRF) using a Bruker-AXS S4 Pioneer XRF
Spectrometer on fused beads. The fused beads consist of rock powders mixed with 12:22
borate flux (XRF Scientific Limited, Perth, Australia) at 1:8 sample to flux ratio that were
fused to glass after heating to 1050 °C for 15 min in a F-M 4 Fusion Bead Casting Machine
(Willunga, Australia).
For trace element analyses, chips of the fused beads were mounted into a standard
epoxy puck and analyzed for a range of trace elements using a Geolas Pro 193 nm ArF
Excimer laser ablation unit (Coherent) coupled to Varian 820 quadrupole ICP-MS. Helium
was used as the carrier gas (0.8 l/min), which was subsequently mixed with Ar via a mixing
bulb between the ablation cell and the ICP-MS to smooth the ablation signal. Laser energy
density was set to 6 J/cm2, and laser spot size and repetition rate were set to 120 μm and 10
Hz, respectively. Each fused bead was analyzed 3 times and average values are reported. The
ICP-MS was tuned to ensure robust plasma conditions and low oxide production levels (≤
0.5% ThO) with the plasma power set at 1.25 kW. NIST SRM 610 glass was used as a
bracketed external standard using the standard reference values of Spandler et al. (2011).
Data were quantified using Ca (as previously determined by XRF on the same fused bead) as
the internal standard, and data were processed using the Glitter software (Van Achterbergh et
al., 2001). To monitor precision and accuracy of the analyses, we analyzed Hawaiian basalt
Page 37
reference glass (KL2-glass; n=21) as a secondary standard (Jochum et al., 2006). The
precision for REE analyses by LA-ICP-MS is better than 5% (mostly <3%), and the accuracy
is better than 6%, often <2%. The standard reference material NIST612 (n=11) was analyzed
as a ternary standard. The precision for all the elements, besides Zn (3.5%) and Ge (~8.3 %,)
is <2%, and <1% for REE. The accuracy for all the elements (standard reference
concentrations taken from Spandler et al., 2011) is <3%. The only exceptions are Tb (6.5%),
Ge (~8.3%), Sb (~9%), and Zn (~5.3%) where relatively large uncertainties in the NIST612
glass have to be taken into consideration. The results of the analyses are presented in
Appendix 7.
2.2.8. Methodology for zircon dating
With respect the zircon dating presented in chapter 5, for each outcrop targeted for
dating, 2-3 kilograms of sample was collected. The samples were split and the weathered
surfaces were removed. The split fraction from each sample was milled with a tungsten
carbide disc mill to a grain size of ≤ 500 μm. The 500 μm portion was run in water current on
a Wilfley table, and the heavy mineral fraction was collected and subsequently run through a
Frantz magnetic separator. The non-magnetic fraction was divided further using heavy liquids
from which the heavy fraction was run again through a Frantz magnetic separator. Zircons
were hand-picked from the non-magnetic fraction and mounted into epoxy resin blocks and
polished to about half of their thickness; first with a 3 μm diamond paste than with a 1 μm
diamond paste.
Before the analysis, all zircon grains were imaged using a Jeol JSM5410LV with
attached cathodoluminescence detector to identify growth domains and inherited cores within
the grains. U–Pb isotope analyses were obtained using a GeoLas 200 Excimer Laser Ablation
System in a He ablation atmosphere, coupled to a Varian ICP-MS 820 series instrument.

Page 38
Laser parameters during the analyses include a repetition rate of 10 Hz, spot size of 32 µm
and energy of 6.0 J/cm2. Analyses involved 30 seconds of background measurement (gas
blank) followed by 35 seconds of acquisition of U-Pb isotope data. U–Pb fractionation was
corrected using the GJ-1 (ID-TIMS 207Pb/206Pb age = 608.5 ± 0.4Ma (Jackson et al., 2004) as
the primary standard. FC-1 zircons (ID-TIMS 207Pb/206Pb age = 1099.0 ± 0.6Ma (Paces and
Miller, 1993) and the 91500 zircons (ID-TIMS 206Pb/238U age = 1062 ± 1Ma (Wiendenbeck
et al., 1995) were used as secondary standards. Several zircon grains were excluded from
analysis due to the metamict nature and small size of the grains. Analyses with high common
Pb and/or significant discordance (>10%) were not included in the age calculations.
Data processing was done using the software package GLITTERTM (Jackson et al.,
2004), and the age calculations were made using Isoplot (Ludwig, 2003). Over the duration
of this study the reported weighted average age (errors at 95% confidence) for GJ-1 is 602
± 3 Ma for 206Pb/238U and the concordia age is 602 ± 3 Ma. FC-1 gave a weighted average
age of 1100 ± 10 Ma for 207Pb/206Pb and 1099 ± 10 Ma for the concordia age. 91500
weighted average during the analyses was 1061 ± 6 Ma for 207Pb/206Pb and the concordia age
was 1061± 7 Ma. 207Pb/206Pb grain ages are used in this study. Abundances of U and Th were
measured using a NIST 610 glass standard in conjunction with internal standardization using
the known stoichiometric abundance of Si in zircon. The data analyses for the various zircon
standards used in this study are presented in Appendix 8.
2.2.9. Methodology for hafmium (Hf) data collection
For Hf isotope data acquisition the analytical protocols followed the procedures
outlined in Kemp et al. (2009). The Hf isotope compositions were acquired with a Thermo-
Scientific Neptune multi-collector ICP-MS attached to a Coherent GeoLas 193 nm ArF laser.

Page 39
Each analysis was performed on the same area of the zircons that were previously dated by
LA-ICP-MS or on the same CL defined growth domain. A 60 µm laser beam diameter was
used at a 4Hz laser repetition rate. Standard zircons analyzed during the study were Mud
Tank and FC1, the latter to check the isobaric interference corrections for Yb. The average
176Hf/177Hf and the 2 sigma errors during the analyses for the standards were: 0.282482
(±0.000004) for Mud Tank, and 0.282153 (±0.000005) for FC1. Epsilon Hf (εHf) values were
calculated using the present day chondritic values of 176Hf/177HfCHUR (0) =0.282785 and
176Lu/177HfCHUR (0) = 0.0336 (Bouvier et al., 2008). For this study, we adopted the 176Lu decay
constant of 1.867 X 10⁻⁵ m.y.-1 proposed by Soderlund et al. (2004). The data analyses for the
various zircon standards used in this study are presented in Appendix 8.

Page 40
CHAPTER 3
THE STRUCTURAL HISTORY OF THE KUKULUMA AND
MATANDANI DEPOSITS AND CONTROLS ON GOLD
MINERALIZATION, GEITA GREENSTONE BELT,
TANZANIA
3.1. SUMMARY
A series of westnorthwest trending gold deposits centred on the Kukuluma deposit
occur over a ~5 km strike length in the eastern part of the Geita Greenstone Belt, northwest of
Tanzania and are hosted within an Archaean meta-volcanosedimentary package dominated by
ironstone. The deformation history in the area encompasses a series of ductile folding and
shearing events (D1-D5) which formed at upper-greenschist to amphibolite facies conditions,
simultaneous with the emplacement of monzonite-diorite-gabbro intrusions (the Kukuluma
Intrusive Complex), and overprinted by a first generation of porphyritic dykes and sills. D1
comprises a family of structures including boudins of primary bedding, layer-parallel chert
veins and intrafolial folds in near-layer-parallel chert units interpreted as low-angle shear
zones. D2 folding is widespread, and coincides with the peak of regional metamorphism and
the formation of a penetrative fabric that in many places is near parallel to the compositional
layering. D2 folds are closed to isoclinal and vary in scale from 1-500m, and are overprinted
by 1-500 m scale D3 folds, which form the dominant structures in the area. They consist of
open to closed upright folds developed in fold domains separated by planar high strain zones
or foliation domains where S0, S1, S2 and S3 have been transposed. D2 and D3 structures form
complex, Type 2 fold interference patterns that affect the distribution of chert and ironstone
units, which are the main host to gold mineralization. D3 structures were refolded by near
Page 41
vertical, D4 gentle folds and D5 low angle reverse faults and associated open, recumbent
folds.
The earliest intrusions of the Kukuluma Igneous Complex were emplaced pre-D3,
with the main face of igneous activity occurring syn-D3, resulting in the alignment of
intrusive bodies with the axial plane of D3 folds. Emplacement and crystallization of the
intrusive bodies was associated with fluid release resulting in localized breccia development
within the more brittle meta-ironstone lithologies. These events were followed by the
development of east- to southeast-trending, steeply dipping, brittle-ductile shear zones (D6)
that formed along a westnorthwest corridor as a result of north-south compression. The D6
shear zones are transected by at least one generation of later north-trending porphyry dykes,
and have subsequently been reactivated (D7) at brittle-ductile to brittle conditions as normal
faults, mostly with a sinistral component of shear.
Gold mineralization within the Kukuluma area is late and spatially associated with D6
shear zones along the steeply dipping contacts between diorite of the Kukuluma Intrusive
Complex and iron-rich lithologies (mainly chert and bedded ironstone) conducive to the
precipitation of sulphide and gold. The distribution of these lithologies is strongly affected by
D2-D3 fold interference patterns, creating a discontinuous distribution of host lithologies in
sectional planes. The complex D2-D3 fold architecture and breccia zones also created the
micro-fracture networks and dilatant zones needed for fluid movement, with enhanced
mineralization observed in areas of intense D3 folding. Gold precipitation was accompanied
by the replacement of magnetite by pyrrhotite and the growth of arsenopyrite, pyrite, stibnite
and scheelite in fracture networks and as disseminations. Mineralisation overprints the late
north-trending porphyry dykes, and is interpreted to be associated with D7 faulting, in part by
re-activating D6 shear zones during northnortheast-southsouthwest extension.

Page 42
3.2. INTRODUCTION: GREENSTONE BELTS AND GOLD MINERALIZATION
Archaean granite greenstone belts are elongate structures that consist of supracrustal
units deformed in broadly synformal or keel-like shapes. They vary in composition from
ultramafic to felsic metavolcanics, interbedded with clastic sediments that range from distal
turbidite units to proximal, coarse-clastic conglomerate (e.g. Condie, 1994; Jelsma and Dirks,
2002; Anhaeusser, 2014). Greenstone belts are commonly bounded and cut by large intrusive
complexes of tonalite-trondhjemite-granodiorite (TTG) composition that form open, rounded
antiforms, arches or domes (Condie, 1994; Bouhallier et al., 1995; Jelsma and Dirks, 2002;
Anhaeusser, 2014). Various tectonic models have been proposed to explain the characteristic
geometry of granite-greenstone terrains including vertical tectonics involving density
inversion and diapiric emplacement of mid- to lower-crustal melt into upper-crustal volcano-
clastic sequences (e.g. Choukroune et al., 1995; Chardon et al., 1996; Collins et al., 1998;
Bédard et al., 2003; Van Kranendonk, 2011), or horizontal tectonic processes involving low-
angle subduction and crustal stacking, or core complex formation followed by late granite
intrusions due to decompression melting (Polat et al., 1998; Bouhallier et al., 1995; Windley,
1995; Shackleton, 1995, Dirks and Jelsma, 1998, Jelsma and Dirks, 2002; Kloppenburg et al.,
2001; Blewett et al., 2004; 2010b; Kabete et al., 2012), with these processes being linked to
early forms of plate tectonics, mantle plume activity or both (e.g. Moyen et al., 2006; Blewett
et al., 2010a,b).
Greenstone belts represent one of the principle settings for gold deposits, which are
generally categorized as quartz lode or shear zone hosted deposits, considering their
association with secondary structures near major shear zones and associated quartz veining
(Groves et al., 1998; Goldfarb et al., 2005; Frimmel, 2008). Gold deposits forming in
greenstone belts are commonly interpreted as orogenic gold deposits linked to accretionary
processes in arc settings during the late stages of Cordilleran–type tectonics (e.g. Groves et

Page 43
al.,1998; Bierlein et al., 2006, 2009), with gold mineralisation coinciding with change in the
stress regime from a compressional to a trans-pressional or trans-tensional phase (e.g. Kerrich
et al., 2000; Goldfarb et al., 2001,2005; Groves et al., 2003, 2006; Bierlein et al.,2006;
Frimmel, 2008; Begg et al., 2009; Dirks et al., 2013; Sanislav et al., 2015, 2016). Linking
Archaen lode or shear hosted deposits to orogenic processes would imply that modern plate
tectonics, in some form would have occurred in the Archaen (e.g. Kabete et al., 2012; Groves
and Santosh, 2015). With respect gold mineralization the sharp increase in the number of
gold deposits during the Late Archaean has been used to illustrate the advent of plate-
tectonics at that time (e.g. Goldfarb et al., 2001; Bierlein et al., 2006, 2009). In contrast,
alternative tectonic models for greenstone belt formation that invoke vertical melt segregation
above mantle plumes (e.g. Bédard et al., 2014; Cook et al., 2015), would imply that lode-gold
deposits are not orogenic in origin.
Regionally, large gold systems are thought to be selectively developed in specific
tectonic domains with suitable geological settings involving terrain boundaries, which act as
first-order structures that control crustal-scale plumbing systems of mantle-derived magma
and hydrothermal fluids (e.g. Ridley et al., 1996; Goldfarb et al., 2005; Leahy et al. 2005;
Bierlein et al., 2006; Phillips and Powell, 2010). The timing of granitoid intrusion with
respect greenstone formation, geometric orientation of controlling structures, and host-rock
and intrusive geochemistry are major factors to be considered when targeting areas that are
prospective for mineralization on a terrain-scale. Particular indicators for mineralisation can
be the presence of late- to post-kinematic granitoids that act as proxies for the heat engines
critical for driving gold mineralization (e.g. Phillips and Zhou, 1999).
On a mine- or camp-scale, shear-hosted, lode-gold deposits are associated with
complex arrays of dilatant, brittle-ductile structures commonly interpreted to form as
secondary features near compressional or transpressional shear zones (Colvine et al., 1988;

Page 44
Robert et al., 1991; Groves et al., 1998; Cox et al., 2001; Tripp and Vearncombe, 2004; Dirks
et al., 2009). Such shear zones are generally seen as the principle conduits for mineralizing
fluids involving the repeated locking and reactivation of fault planes in response to fluid
pressure fluctuations (i.e. the fault valve model of Sibson, 2001, 2004). Secondary structures
include fracture arrays, breccia zones and fold hinges within more brittle lithologies (Robert
et al., 1991; Ojala et al., 1993; Groves et al., 2000; Sanislav et al., 2015). The gold-bearing
fluids interact with wall-rocks along structural traps where favourable changes in physico-
chemical conditions lead to ore formation (e.g. Sanislav et al., 2015).
In the Tanzania Craton, many gold deposits were developed in the 1990’s and early
2000’s by re-opening and extending known historical workings. The Geita Greenstone Belt
(GGB) in the northern part of the craton (Fig. 1.2) hosts a number of large (>1Moz) gold
deposits spread along 25km of the greenstone belt. These deposits, include (from west to
east) the Star & Comet, Nyankanga, Lone Cone, Geita Hill, Matandani and Kukuluma
deposits , and are commonly referred to collectively as Geita mine (e.g. Bierlein et al. 2006).
All of these deposits are largely hosted by meta-ironstone units near the intrusive contacts of
monzonitic to dioritic bodies that intruded internal to the greenstone belt (e.g. Borg, 1994;
Sanislav et al., 2015, 2016).
To date no detailed work has been published for the major deposits that occur in the
eastern part of the GGB (Figs.1.2 and 1.3). These include the Matandani, Kukuluma and Area
3 deposits that collectively host several Moz of gold. In this chapter, a deformation model for
the area around the Matandani and Kukuluma pits will be presented, based on detailed
mapping, core logging in the pits and surrounding areas. The deformation model will be
linked to the relative timing of intrusive units and gold mineralization, and forms the basis for
geochemical and geochronological studies in the area (see Chapters 4 and 5). For background

Page 45
to the general geology of the Tanzania Craton and geological setting of the Geita Greenstone
Belt I refer to the introduction in Chapter 1.
3.3. PREVIOUS STRUCTURAL WORK
Initial models for the deformation history of the GGB and associated gold deposits
did not move beyond a general scheme involving early upright folding (D1), overprinted by a
second folding event characterized by steeply plunging axes (D2) and cut by later shear zones
(D3), with gold mineralization post-dating D2 and utilizing regional-scale shear zones as fluid
pathways (Booth, 1954a, b; Borg et al., 1990; Borg, 1992, 1994). Mine models in the early
2000’s assumed that mineralised shear zones in the GGB were part of complex thrust stacks
associated with horizontal shortening and stacking of the greenstone sequence with gold-
mineralisation concentrating in dilatant zones along thrusts and near fold hinges (Painter,
2004). Subsequent mining has demonstrated that the structures associated with gold did not
facilitate large-scale thrusting, but instead have complex deformation histories as shown for
the Nyankanga and Geita Hill deposits (Sanislav et al., 2015, 2016). These deposits are
centred on NW dipping reverse faults (D6) that overprint a complexly sheared and folded (D1-
5) stack of meta-ironstone and chert, and were reactivated as (D8) normal faults at the time of
mineralization. Gold-deposition preferentially occurred along diorite-meta-ironstone contacts
exploited by the shear system (Sanislav et al., 2015, 2016) after 2644 Ma (Borg and Krogh
1999), i.e. 40-50 Ma later than the formation of D6 thrusts (Sanislav et al., 2016).
3.4. ROCK TYPES AND STRATIGRAPHY OF THE KUKULUMA TERRAIN
The Kukuluma terrain forms the eastern part of the GGB and is bounded to the west
by a major northwest-trending shear zone, which juxtaposes lower greenschist facies meta-
sediments of the Central terrain, with lower amphibolite facies mafic to ultramafic meta-

Page 46
basalts of the Kukuluma terrain (Fig. 1.2; Cook et al. 2015). In this section, we provide brief
descriptions of the lithological units and proposed stratigraphy as encountered along the
Kukuluma Mineralized Trend in the central part of the Kukuluma terrain (Figs 1.3). A
summary stratigraphic column is provided in Figure 2.2. Examples of the main lithological
units are shown in Figure 3.1.
3.4.1. Volcano-sedimentary units
The sedimentary sequence in the central Kukuluma terrain is dominated by clastic
sediments interbedded with chert beds of possibly tectonic origin (see below), magnetite-rich
meta-ironstone units and volcanoclasic beds, which overlie mafic volcanics preserved along
the western margin of the Kukuluma terrain (Figs 1.2, 2.2, 3.1). The base of the clastic
sedimentary pile consists of a black, graphitic shale unit of undefined thickness (drill
intersections indicate a minimum thickness of ~10m) that is well exposed at the bottom of
Kukuluma pit. They are locally interlayered with chert and meta-ironstone beds (Figs 2.2,
3.1), and associated with pyrite and pyrrhotite nodules. The black shale unit transitions into a
well-layered meta-ironstone unit, with a thickness that is variable as a result of structural
attenuation, folding, transposition and tectonic duplication. The meta-ironstone unit is widely
distributed across the central parts of the Kukuluma terrain (Fig. 1.3), and consists of
regularly layered packages with magnetite-rich layers and selvages interlayered with more
well-foliated shale beds and highly silicified, quartzose beds with a glassy appearance that are
locally cherty (Fig. 3.1).

Page 47
(a) (b)
( c )
( d )
( e)
(f )
( g)
Figure 3.1. Examples of the main lithological units in the central Kukuluma terrain: (a) well-layered ironstone; (b) fragmental volcanoclastic unit; (c) intraformational conglomerate within the ironstone units, in which conglomerate clasts are mostly composed of angular chert fragments [drill core hole ID: MTRD0009 (458 - 461m)]; (d) black shale with remnants of pyrrhotite nodules; (e) turbiditic siltstone and sandstone showing graded bedding; (f) intrusive diorite with biotite after amphibole blasts elongated along S3; (g) late felsic porphyry dyke.

Page 48
Individual meta-ironstone beds vary in thickness from several mm’s to several tens
of cm. In some places, the unit contains thick beds of chert (up to 10m), that form prominent
ridges (Fig. 1.3). The chert layers are locally discontinuous, possibly due to deformational
processes (boudinaging and shearing), and may contain magnetite-rich layers that transition
into chlorite-biotite-rich shale bands, with abundant grunerite along the contacts.
In places (e.g. in the northen wall of the Kukuluma pit) the meta-ironstone unit is
intercalated with volcanoclastic units that include fragmental rocks with ignimbritic
characteristics. These fragmental pyroclastic flow deposits are exposed in the Kukuluma area
as two, northwest striking elongate bodies each ~350m long and 30m thick. They are layered
and contain shards of silica-rich, glassy material with chilled margins embedded in a fine-
grained, feldspar-rich matrix (Fig. 3.1).
In the Kukuluma-Matandani area, the magnetite-rich meta-ironstone unit transitions
into meta-greywackes that comprise laminated shale- to sandstone units (Fig. 8) best exposed
along the eastern and western walls of Matandani pit and the northeastern and southern walls
of Kukuluma pit. The clastic meta-greywackes are well-bedded with a typical bed thickness
of 5-15 cm and are interlayered with fine-grained meta-tuff beds and volcanoclastics.
Sedimentary structures are well preserved within the meta-greywacke unit and include graded
bedding (fining upward with partial Bouma sequences), low-angle cross bedding and scour
marks, which provide younging indicators (Fig. 3.1e). Some of the thicker meta-sandstone
units contain small, well-rounded chert pebbles or grit at their base. These graded beds are
reminiscent of turbidites and are interbedded with several more massive, non-structured (i.e.
no grading), matrix supported conglomerate beds that contain mostly angular chert clasts,
<3cm in diameter embedded in a coarse, sand matrix. The sedimentary structures suggest that
these beds were laid down on the proximal parts of a marine fan-delta system with input of
immature sediment (e.g. Hofmann et al., 2001a). Younging directions confirm that the unit

Page 49
underwent early isoclinal folding making it hard to estimate the original stratigraphic
thickness. In Kukuluma pit the unit is underlain by a thick chert horizon associated with
intense shear, isoclinal folding and numerous quartz veins, which is probably of tectonic
origin (Figs 3.1a; 3.2a). The meta-greywacke unit is generally deeply weathered and has
previously been described as felsic tuff (e.g. Skead, 2003).
3.5. THE HISTORY OF DEFORMATION AND INTRUSION IN THE CENTRAL
KUKULUMA TERRAIN
The deformation events in the Kukuluma-Matandani area comprise an early group of
penetrative structures involving overprinting folding, shearing and brecciation events, which
occurred when the rocks mostly behaved in a ductile manner (D1-D5), and a later group of
more localized structures as strain was partitioned into brittle-ductile shear zones, faults and
joints (D6-D7). With respect gold mineralization, the former group of structures created the
architecture that influenced the distribution of rock-types favorable for gold precipitation,
whereas the latter group of structures more closely controlled fluid flow. Deformation events
were accompanied by the emplacement of two separate diorite and monzonite suites that
intruded syn-tectonically, and a granodiorite suite (mostly dykes) that intruded late syn-
tectonically, which collectively form the Kukuluma Intrusive Complex (KIC; Chapter 4). The
KIC probably formed as a result of intracrustal melting at the base of a thickened oceanic
plateau, and may not have involved subduction (Chapter 4), similar to other volcanic units in
the area (e.g. Cook et al., 2015). The intrusions of the KIC are spatially associated with
breccia bodies along their intrusive margins with meta-ironstone units. Late-tectonic felsic
porphyry dykes cross-cut all units. The deformation events have been summarized in Table
3.1. In describing the structural sequence, heavy reliance has been placed on the outcrops in
the Kukuluma and Matandani pits, because outcrop outside of pits is limited.

Page 50
(a) (b)
(c) (d)
(e) (f)
(g) (h) Figure 3.2. Examples of shear zones in the central Kukuluma terrain: (a) Closely spaced magnetite-bearing quartz veins that intruded along a D1 shear zone (Kukuluma pit: 0417844-9687934); (b) Planar chert ridge cuts at a low-angle through primary bedding (Kukuluma pit: 417644-9687702). The chert is interpreted as a D1 shear zone; (c) Planar chert horizon in stratigraphy E of Area 3 (0420250-9688160). The chert parallels S0 in the surrounding sediments, but internally the chert is strongly folded with a mylonitic appearance (S1); (d) D5 low-angle reverse fault and associated recumbent folding in chert (Kukuluma pit); (e) Cataclasite and tectonic breccia zone along D6 shear zone where it truncates chert in Kukuluma pit; (f) D6, Kasata shear in NW corner of Matandani pit; (g) D7 fracture plane with (white) sericite and sulphide alteration in artisanal workings along W wall of Matandani pit; (h) D7 fracture plane with (white) sericite and slickenlines indicative of normal-sinistral movement ( Matandani pit).

Page 51
Deformation event Intrusive event (age) Description Mineralisation
D1a Deposition of sedimentary sequence D1b - Chert horizons with disharmonic folds
- intrafolial folds - Local formation of S0-parallel fabric, S1
D2 - non-cylindrical folding on 1-500 m scale
- Formation of penetrative S0-parallel fabric, S2
Start of emplacement of KIC: Diorite & Monzonite suites
- Sills, dykes and plugs of gabbro-diorite-monzonite
Mineralisation along diorite-ironstone contacts
D3 continued emplacement of KIC : Diorite & Monzonite suites
- folding on 1-500 m scale with - plunge varies across F2 fold limbs, - associated with a planar axial planar
cleavage that dips steeply SW - High-strain foliation domains bound
folded domains - Emplacement of KIC along D3 axial
planes; development of internal S3 fabric
- Extensive brecciation of D2-D3 folded ironstone near margins of KIC intrusions
Mineralisation linked to F3 fold axial zones Mineralisation in fracture/breccia zones
D4 - Open, cylindrical upright folding - Symmetric folds plunging steeply
WNW - Limited S4 fabric development
D5 - Open cylindrical recumbent folding - Associated with low angle reverse faults
with small offsets (<10m)
continued emplacement of KIC : Granodiorite suite
- Felsic porphyry dykes truncate D1-4 folds
D6 - NW to WNW trending, steeply dipping, brittle ductile shear zones.
- Dextral-reverse as a result of N-S compression
- Form fracture networks overprinting D3 folds and breccia zones
- Near contacts between KIC and meta-sediments
- Locally associated with tectonic breccia
D6 shear zones are mineralised
Emplacement of felsic dykes
- N trending felsic porphyry dyke Mineralisation overprints dykes
D7 - Normal faulting - Reactivation of D6 shears as sinistral
normal faults
D7 shear zones are mineralised
Granitoids plutons 2620-2640 Ma1
Table 3.1. Summary of deformation and intrusive events to affect the central Kukuluma terrain. 1 after Sanislav et al., (2013)

Page 52
3.5.1. D1- bedding parallel shearing events
The well-layered, silicified meta-ironstone units locally preserve fine lamellae of
foliated, para-concordant and anastomosing magnetite-rich horizons, that are associated with
silicification and the formation of fine (<3mm thick) chert layers. This tectonic layering is
concordant with, but overprints sedimentary bedding and results in a finely laminated
sequence of rocks, with a complex compositional banding referred to as S0/S1 layering. S0/S1
has been folded around both D2 and D3 fold hinges confirming a D1 origin for the composite
layering. S0/S1 lithological banding is variably developed across the area and locally
intensifies in layered packages, or units, up to 30m thick that are dominated by chert layers,
which originated as, locally, slightly discordant planar units. A good example of this occurs
along the access ramp into Kukuluma pit between 418900-9688150 and 418950-9688180 (all
grid references in WGS84, zone 36S). In this zone, moving from southwest to northeast, a
well-layered greywacke unit consisting of alternating graded, meta-sandstone-siltstone beds
is intruded by dark-grey, planar quartz veins with a fine-grained chert-like appearance (Fig.
3.2a). The veins are largely parallel to layering, but locally transect each other and the
primary compositional layering within the meta-greywacke units, and there parallelism with
S0 is in part due to rotational alignment as a result of flattening strain. Over a horizontal
distance of about 15m the density of these intrusive veins increases from 2-3 veins per meter
to over 20 veins per meter, as the rocks change from bedded meta-greywacke into a massive
glassy chert unit. As the density of chert-like quartz veins increases, the wall rock greywacke
becomes strongly silicified, and coarser grained sandstone beds are boudinaged, in which
individual boudins display a clockwise rotation around a vertical axis. Where the
boudinaging of primary layering becomes apparent, a layer-parallel fabric (S1) has developed,
and rare intrafolial folds and dextral shear bands occur. An L1 mineral stretching lineation is
locally preserved and plunges southwest at a shallow angle (~234/15). This lineation and the

Page 53
asymmetry of shear bands and boudin trains suggests that the D1 structural zone was a shear
zone that accommodated top-to-northeast displacement, although the regional significance of
such movement is undefined as a result of later deformation overprints. The fact that this
zone is associated with boudinaging and extension of the host rock layering suggests an
extensional origin. This chert-rich zone has been interpreted as a D1 high-strain zone, or
layer-parallel shear zone, marking a lithological boundary between meta-greywacke and
meta-ironstone (Fig. 1.3).
Similar discordant chert horizons are common throughout the central Kukuluma
terrain. In many places (e.g. Fig. 3.2b) they display abrupt boundaries, in which the chert
layer transects the surrounding meta-ironstone or meta-greywacke units at a low angle. In
other places the orientation of chert beds is parallel to layering within the wall rock (Fig.
3.2c). The chert beds are generally <5m wide, but may be as wide as 20-30m and display
internal layering, similar to that described for Kukuluma pit (i.e. the layering may have a
tectonic origin). It is common to find several generations of 0.1-1m scale, highly non-
cylindrical, disharmonic folds inside the chert bands, whilst the surrounding sediments
remain non-deformed (Fig. 3.2c). In places such folds assume sheath-like geometries within
an ultra-fine-grained finely laminated, glassy fabric with mylonitic affinities (e.g. 420250-
9688160).
On a regional scale, the chert bands form low ridge lines, and constitute the only exposure on
the landscape. As a result they can be relatively easily mapped, and some can be traced for
several kilometres (Fig. 1.3). Such chert horizons display large thickness variations along
strike and in places bifurcate or merge to form anastomosing patterns. The chert bands are
affected by all later folding events described below, and therefore must have formed early in
the tectonic history of the Kukuluma terrain. Figure 10a shows a stereo plot of the poles to
S0/S1 for the cenral Kukuluma terrain. The bedding orientation, although variable, shows a

Page 54
consistent NW trend with steep dips that vary from 50° northeast to 50° southwest around
vertical (Fig. 3.3a). The spread of data arises from fold overprints detailed below.
(a)
(b) (c)
(d)
(e)
(f) (g) Figure 3.3. (a) Orientation of poles to S0 (N=304); Orientation of poles to the intrusive diorite-sediment contacts as observed in drill core and the field (N=38); (c) Orientation of F2 fold axes in Kukuluma and Matandani pits (N = 33). Colour coding of fold axes refers to domains in the pits: red = S ramp in Kukuluma pit; Blue = SW side in Matandani pit; green = NE side in Matandani pit; (d) Orientation of S3, fold axial planes (great circles) and F3 fold axes in Kukuluma and Matandani pits. Colour coding of fold axes refers to domains in the pits: red = S ramp in Kukuluma pit; orange = W ramp in Kukuluma pit; brown = NW wall in Kukuluma pit; Blue = SW side in Matandani pit; green = NE side in Matandani pit;

Page 55
(e) Orientation of S3, fold axial planes (great circles) and F3 fold axes (red dots) in Kukuluma and Matandani pits. S3 and F3 are distributed in two clusters in either limb of D4 folds. The orientation of the D4 axial plane has been constructed from the distribution of the two clusters (i.e. S4 equals the plane bisecting the obtuse angle = 290/65) Bingham stats for poles to the S3 surfaces (N = 24): Axis Eigenvalue Trend Plunge 1. 0.7885 019.8, 01.5 2. 0.1893 110.5, 24.5 3. 0.0222 286.5, 65.4 (f) Orientation of F2 fold axes in Kukuluma and Matandani pits in which the Kukuluma axes have been rotated clockwise by 50 degrees around an axes of 287/65, to remove the effects of D4 open folding (i.e. the average orientations of S3 in the S-wall of Kukuluma and SW part of Matandani have been rotated towards parallelism, by keeping the orientation of S3 in Matandani fixed and by moving S3 in Kukuluma). Colour coding of fold axes refers to domains in the pits: brown = rotated orientations along S ramp in Kukuluma pit; Blue = SW side in Matandani pit; green = NE side in Matandani pit; (g) Orientation of F3 fold axes in Kukuluma and Matandani pits in which the Kukuluma axes have been rotated clockwise by 50 degrees around an axes of 287/65, to remove the effects of D4 open folding (i.e. the average orientations of S3 in Kukuluma and Matandani have been brought into parallelism, by rotating Kukuluma data). Colour coding of fold axes refers to domains in the pits: red = rotated F3 orientations in Kukuluma pit; Blue = F3 orientations in Matandani pit.
In drill core, chert-rich laminated ironstone preserves an early layer-parallel fabric (S1). Thin
chert and sandstone layers are locally boudinaged, and small-scale, syn-sedimentary normal
faults are common in laminated cherts and shales. These features suggest that D1 events were
associated with syn-sedimentary extension and normal faulting at the time of deposition of
the volcano-sedimentary package.
3.5.2. D2-D3 folding and shearing
The composite S1/S0 fabric in the central Kukuluma terrain is folded, and locally
sheared in response to D2 and D3 events (Figs 3.4, 3.5). In the Kukuluma and Matandani area
this has resulted in locally complex D2-D3 interference folding of the volcano-sedimentary
stratigraphy, including those units that preferentially host gold mineralization.
F2 folds can be locally recognized on outcrop scale as tight to isoclinal folds that
develop a penetrative axial planar cleavage in fine-grained shale. F2 fold axes are highly
variable in orientation (Fig. 3.3c). This variability is in part due to the non-cylindrical nature

Page 56
of D2 folds (similar to observations made in the Geita Hill area; Sanislav et al., 2016), which
affects variability on outcrop scale, and partly results from later folding overprints causing
more regional variability in the D2 fold axes.
(a) (b)
(c) (d)
(e) (f) Figure 3.4. Examples of fold structures in the central Kukuluma terrain: (a) ductile, flame-like isoclinal folds in turbiditic greywacke interpreted as folding associated with fluidization during D1; (b) D3 folds in alternating shale and ironstone beds. Note well developed S3 crenulation cleavage in shale horizons; (c) tight D3 vertical folds in ironstone in SW Matandani pit; (d) close up of S3 spaced crenulation cleavage in shale; (e) open recumbent D5 folding in chert bands; (f) open D5 folding along the margin of a felsic porphyry dyke affected by the D5 folding.

Page 57
In single outcrops where F2-F3 interference folding is well developed (e.g. Fig. 3.5), the
orientation of F2 fold axes can vary from near-parallelism with F3 fold axes, to high angles to
F3 fold axes; a trend reflected in stereoplots of F2 (Fig. 3.3). The existence of large-scale
(>100m scale) D2 folds is evident from the regional distribution patterns of chert ridges
(Fig.1.3), and can also be inferred from the domainal distribution of D3 fold axes orientations
(Fig. 3.3) as explained below.
(a) (b)
(c) (d)
(e) (f)
Figure 3.5. Examples of outcrop-scale D2-D3 fold interference patterns in the central Kukuluma terrain shown as annotated pairs. Marker layers have been highlighted in yellow; the D2 fold axial trace is shown in light blue; the D3 fold axial trace is shown in red. (a) & (b) horizontal view of fold pair along access road to Kukuluma pit; (c) & (d) vertical view of fold pair in erosion gully along the E face of Matandani pit; (e) & (f) horizontal view of fold pair on the upper benches in the SW corner of Matandani pit.

Page 58
D3 folds are common in the area and comprise upright to vertical folds that vary from
open to near-isoclinal, with tightening of the folds occurring near planar high strain zones.
The S3 axial planar surface is generally near vertical and varies in trend from E-W to NW
with orientations in the pits showing two clear maxima around 210/80 and 350/75 (Fig 10d).
These variations in orientation of S3 are the result of D4 folding (discussed below). S3 fold
axial planar fabrics vary in character from well-developed closely spaced (<1mm) planar
crenulation cleavages in shale domains (Fig. 3.4), to more widely spaced, fracture cleavages
with a high degree of cleavage refraction in more competent silicified meta-ironstone beds
with cleavage planes in folded chert units commonly decorated by thin quartz veinlets along
the outside rims of folds indicative of buckle folding (Fossen, 2016).
F3 fold axes orientations vary in a systematic manner across the pits as a result of D2-
D3 fold interference (Fig. 3.3). Along the southern wall of the Kukuluma pit, F3 fold axes
generally plunge shallowly east (ave. F3 = 091/17; Fig. 3.3d). This same orientation also
occurs along the western ramp into Kukuluma pit, although the F3 orientation locally rotates
towards a shallow northwest plunge as a result of D4 fold overprints. Towards the nothern
wall of the Kukuluma pit, F3 fold axes rotate to near-vertical (ave. F3 = 287/83; Fig. 3.3d),
with outcrop scale D3 folds assuming vertical to steeply reclined orientations. The same
vertical D3 fold orientations also dominate outcrops in the area between Kukuluma and
Matandani pits, and in the SW wall of Matandani pit (Fig. 3.3d).
Towards the northeastern wall of the Matandani pit, F3 fold axes are more variable
and rotate between a near vertical plunge and a gentle northwest-southeast plunge (Fig. 3.3d).
This domainal distribution of F3 fold axes across the pits is illustrated with a stereoplot in
figure 3.3d. The bimodal distribution of F3 fold axes along the S3 axial planar surface, which
itself maintains a relatively constant orientation, indicates that large-scale D2 folds are
present, with the hinge zone of one such fold trending in a general northeast direction along

Page 59
the northwestern margin of Kukuluma pit, and a second possible hinge zone passing through
Matandani pit. Before the occurrence of upright D3 folding, these F2 hinge zones would have
separated a generally steeply north to northwest dipping S0/S1composite layering across the
southern part of Matandani pit and the area between Matandani and Kukuluma pits, from
generally shallow dipping layering in most of Kukuluma pit and the northern part of
Matandani pit. This pattern suggests the presence of a 500 m scale, possibly southeast
verging, asymmetric antiformal D2 fold with a northwest dipping axial planar surface.
Outcrop scale vergences of D3 folds vary across the pits, reflecting large-scale D3
folding. Along the southern and western walls of Kukuluma pit, outcrop scale D3 folds are
generally asymmetric and verge north, whereas D3 folds along the northern wall of the pit
verge south. This means that Kukuluma pit is positioned in the centre of a 500m scale east to
southeast trending, upright, closed D3 fold and occurs together with Matandani pit along the
hinge zone of a large-scale D3 anticlinorium, which overprinted earlier reclined, non-
cylindrical D2 folds, which were tighter, but had developed at a similar scale.
D2-D3 fold interference patterns are common on outcrop-scale (e.g. 0418140-
9688080; Fig. 3.5) and are generally of type 2, in which both F2 fold hinges and S2 axial
planes have been folded by D3 folds (Thiessen, 1986; Fossen, 2016). Interference patterns are
characterized by crescent and hook shapes (Fig. 3.5) and locally converge to type 3 fold
interference patterns where F2 and F3 fold hinges reach near-parallelism (Thiessen, 1986).
The large-scale fold interference patterns described from the variable distribution of D3 fold
axes orientations can also be seen from the outcrop patterns of D1 chert ridges around Area 3,
where they locally preserve 500-800m scale type 2 fold interference patterns (Fig.1.3).
Locally the D2-D3 fold domains are truncated by planar foliation domains that are
unaffected by D2-D3 folding, except for the presence of isoclinal intrafolial folds within the
foliation, good examples can be seen along the southeastern wall of Matandani pit (e.g.

Page 60
418180-9688300). These foliation domains trend in a northwest direction across the central
Kukuluma terrain and are generally near-vertical. They are associated with a moderately to
steeply west to northwest plunging mineral lineation that parallels the axes of intrafolial folds
within the high strain domains. The layering in these foliation domains is composite in nature
with S0/S1/S2/S3 all transposed and parallel to each other, and they developed at the same time
as D3 folding. The regional distribution of these D3, high-strain zones cannot be assessed due
to poor outcrop.
3.5.3. D4 gentle upright folding
D4 folds are gentle, cylindrical, upright folds with steep axial planes that warp S3 (and earlier
foliations) on a 0.5-1km scale. D4 folds are not clearly visible in outcrop, but can be seen
when tracing D1 chert horizons or S3 along strike; e.g. across Kulkuluma pit S3 orientations
change from steeply southwest dipping (ave. 210/80) in the northwestern corner of the pit to
steeply north dipping (ave. 350/75) across the rest of the pit as a result of large-scale, D4
folding with a steeply west plunging fold axes and northwest dipping fold axial plane (Fig.
3.3e). Similar open folding of D3 structures is apparent across the area (Figs 1.3, 3.6, 3.7),
with the fold axial trace of D4 folds trending roughly northnortheast-southsouthwest. No
penetrative S4 fabric has developed, but where D4 folds affect thick chert layers, e.g. around
Area 3 West deposit a spaced northnortheast-trending fracturing can be observed in the hinge
zones.

Page 61
(a)
(b) Figure 3.6. (a) 2015 version of geological map of Matandani pit. This version has been used for the construction of leap-frog models as explained in chapter 2, and has been updated with later mapping as shown in Figure 1.3. (b) Trend map of Matandani pit (2016 version) showing main folding events and shears.

Page 62
(a)
(b) Figure 3.7. (a) 2015 version of geological map of Kukuluma pit. This version has been used for the construction of leap-frog models as explained in chapter 2, and has been updated with later mapping as shown in Figure 1.3. (b) Trend map of Kukuluma pit (2016 version) showing main folding events and shears.
3.5.4. D5 recumbent folding and low-angle reverse faulting
D5 involved localized low-angle reverse faulting and associated recumbent folding
that is poorly visible in areas without good vertical exposure. Low-angle reverse fault planes
Page 63
are best developed within the well-bedded ironstone units in the western side of Kukuluma
pit. Fault planes vary in thickness from several mm to ~20cm, but are generally thin and
discrete, and visible as thin grey clay zones that ramp up through the ironstone units. The
larger (i.e. wider) fault zones generally dip gently north (around 000/20), but they locally
vary in orientation and narrow secondary faults display more variable attitudes with S
dipping orientations most common. These secondary faults locally steepen where fracture
surfaces move in parallelism with bedding. Fault planes are hard to trace along strike partly
because they are narrow, move in parallelism with bedding planes and are masked by breccia
zones in ironstone units (see below), but also because their development is localized, with
discrete fault planes having limited strike lengths before dissipating in networks of minor
fractures. Displacements across the faults are indicative of reverse movements, although clear
lineations on thrust planes have not been observed. Displacement of lithological contacts
suggests that none of the fault zones accommodated displacements in access of ~10m with
most faults accommodating significantly less.
Folding is common in spatial association with the fault planes. D5 folds vary in scale
from 0.1-5m and are generally open recumbent folds with near horizontal to shallowly
dipping axial planar surfaces that parallel the low angle fault planes (Figs. 3.2d, 3.4e,f), and
shallowly east or west plunging fold axes. In places the folds are asymmetric and have the
appearance of drag folds associated with the faults (Fig. 3.2d). Elsewhere, D5 folds form open
corrugations in well-bedded meta-ironstone, with a widely spaced fracture cleavages (Fig.
3.4f).
3.5.5. D6 brittle-ductile shear zones
A network of generally steeply dipping, northwest to westnorthwest trending shear
zones can be traced along the Kukuluma Mineralised Trend. These D6 shears cross cut the

Page 64
folded sequence and have been linked to mineralization (e.g. Skead, 2003). In the Kukuluma
and Matandani pits the system of D6 shear zones is referred to as the Juma and Kasata shear
zones (Figs 1.3b, 3.6, 3.7). In Area 3 similar west to northwest trending shear zones are
targeted by artisanal gold miners, and can be seen in drill core, but poor outcrop prevents
these shears from being mapped in detail.
The Juma shear zone can be traced along the entire length of the Kukuluma and
Matandani pits, and also occurs within the small open pit between Kukuluma and Matandani
(Fig. 1.3b). The shear zone is positioned along the westnorthwest to northwest trending
northern contact of a major intrusive diorite sill belonging to the KIC (Figs 1.3b, 3.6, 3.7).
Towards the eastern end of Kukuluma pit, the Juma shear, which trends towards 110°,
terminates into a network of smaller moderately to steeply dipping fracture zones with
variable trends (mainly northwest, northeast and east-west trending; Fig. 1.3b).
The Kasata shear zone can be traced through the centre of Kukuluma pit as a
composite, steeply dipping, and generally west to westnorthwest trending fracture zone. In
Matandani pit it re-appears in the southern corner of the pit as several westnorthwest
trending, semi-parallel fracture zones that merge towards the northwestern part of the pit into
a single northwest trending brittle-ductile shear zone that follows the contact of the same
intrusive diorite bordering the Juma shear (Figs 1.3b, 3.6). In the eastern part of Kukuluma
pit the Juma and Kasata shears merge across a complex network of mostly east-west trending
fractures. In drill core from Area 3 a similar D6 shear zone spatially associated with
mineralization was observed along the contact of intrusive monzonite and sediment.
Individual shear planes vary in width from <1 cm to ~10 cm, with wider shear zones
commonly accompanied by damage zones several meters in width that are associated with
secondary jointing, brecciation, veining and silicic alteration. Where several shear planes are
in close proximity to one another (e.g. in the southern corner of Matandani pit, or where the

Page 65
Kasata and Juma shears merge in the eastern part of Kukuluma pit), up to 15m wide,
extensively fractured and altered (strongly silicificied) domains occur. Where the shears
transect micaceous schists, chlorite-muscovite shear bands have developed into S-C like
fabrics (e.g. Fig. 3.2f). In meta-ironstone beds magnetite bands have localized strain and
chlorite-magnetite-quartz segregations along foliation domains are apparent in which chert is
reduced to mm-sized fragments. Brittle deformation structures (veins, breccia and cataclasite
zones) are more common in portions where the shear zone cuts across massive, chert-rich
meta-ironstone units (Fig. 3.2e). Lineations on the shear zones are visible as mineral
alignments in foliation domains, and as striations and quartz rods in quartz-rich portions of
the shears and along veins.
The orientation of the D6 fracture zones associated with the Juma and Kasata shears as
measured in the Kukuluma pit is shown in figure 3.8a. Here, four distinct shear orientations
have been observed that are all interconnected. The dominant shear zones (i.e. the main
strands of the Juma and Kasata shears) trend westnorthwest (020/80) with a gently northwest
or southeast plunging lineation recording a dextral sense of movement with a reverse
component. A prominent set of 2nd order shears trends more northwest with a steep southwest
dip (ave. 235/75) and moderately south plunging lineation recording reverses dextral
movements. A third set of steeply northnorthwest to northwest dipping shear zones (ave.
324/72) with moderately to steeply north plunging lineations record sinistral-reverse
movements and a fourth set of steeply southerly dipping, east-west trending faults (ave.
175/76) hosts down dip lineations and a pure reverse (south over north) sense of movement
(Fig. 3.8a). This network of shears is consistent with Y-shears (the Juma shear), Riedel shears
(northwest trending set) and anti-Riedel shears (southwest trending set) within a wider dextral
transpressional shear system (Fossen, 2016), that combines with high-angle reverse faults
(the east-trending set). On a larger scale, the distribution of the main D6 shear zones is

Page 66
reminiscent of a right stepping en echelon array of westnorthwest to northwest trending
shears within a more east-west trending shear envelope accommodating reverse dextral
movement (Fig. 1.3).
( a )
(b)
Figure 3.8. Orientation and palaeo-stress analysis for D6 shear zones measured in Kukuluma and Matandani pits (N = 27). (a) plot of fault planes and lineations, arrows point in direction of movement of the hanging wall; (b) fault plane solution (Bingham matrix solution) for the measured D6 faults (compression dihedron in white; tension dihedron in grey). P axes are shown in blue, T axes in red. The Bingham solution shows N-S compression with a near-horizontal σ1, and a dispersed distribution of P and T axes, i.e. σ2 and σ3 are similar. Bingham solution: Axis Eigenvalue Trend Plunge 1. 0.1918 083.1, 50.2 2. 0.0419 264.5, 39.8 3. 0.2337 173.9, 00.7
A paleo-stress analysis for the D6 faults in Kukuluma and Matandani pits using
Faultkin (Marrett and Allmendinger, 1990; Allmendinger et al., 2012; Chapter 2 for a
description of the methodology) was performed on a total of 27 shear planes for which
kinematic data was obtained (Fig. 3.8b). These shear zones are all part of the interconnected
network of fractures that form the Juma and Kasata shear zones (Fig. 1.3), and hence it is
assumed that they formed simultaneously in response to the same far field stress (see

Page 67
appendix 1 for a more detailed discussion). In doing the analysis all shear planes were given
the same weight. The results are shown in Fig. 3.8b, and indicate that the D6 shear zones in
the central Kukuluma terrain formed in response to horizontal, near north-south shortening in
a plane strain to flattening strain environment (Rev = 0.35)
3.5.6. D7 faulting
The D6 shear zones are locally reactivated along mm-wide discrete fracture surfaces
that are commonly slickensided, with slickenfibres defined by sericite. Reactivation of D6
shear zones during D7 is most clearly demonstrated in Matandani pit, where a north-trending
porphyry dyke cuts through the D6 shear zones, but is fractured and slightly displaced as a
result of brittle reactivation of the D6 shears. Where the D7 faults cut the dyke, the dyke is
mineralized. The D7 shearing event on the westnorthwest to northwest trending shear zones is
generally associated with discrete fracture planes containing variable lineation directions, but
they record a consistently normal sense of movement, commonly with a sinistral component.
D7 reactivation planes of the Juma shear can be seen in the eastern corner of Kukuluma pit,
where artisanal miners have excavated the high-grade mineralisation along the shear zone.
Displacements on D7 shear planes are small, i.e. in the order of centimeters.
Apart from reactivation of D6 shear zones, narrow fracture zones attributed to D7
occur in parts of the pits and in Area 3 (Figs 3.2g, h). Such fractures have the appearance of
joints, and are locally paralleled by thin grey quartz stringers. They have only been observed,
because they are targeted by artisanal miners who dig out the fracture planes, which are
strongly mineralized. Good examples of such mineralized fracture arrays occur in Matandani
pit.
In the western wall of Matandani pit, three 15-20m wide fracture zones occur to the west of
the Kasata shear zone, within deeply weathered layered turbiditic meta-sediment and

Page 68
ironstone. Each fracture zone comprises an interconnected network of variable orientated
fractures within envelopes that trend roughly 290-110. The three fracture zones are arranged
in an en echelon array along a northwest trend. Within each fracture zone, individual
fractures have maximum strike lengths of several 10’s of meters, but most are shorter in
length.
Axis Eigenvalue Trend Plunge
1. 0.3361 217.8, 32.5
2. 0.0356 315.7, 12.2
3. 0.3717 063.5, 54.7
(a)
Axis Eigenvalue Trend Plunge
1. 0.2589 194.3, 23.9
2. 0.0660 288.0, 08.3
3. 0.1929 035.8, 64.5
(b)
Axis Eigenvalue Trend Plunge
1. 0.3299 180.3, 02.0
2. 0.0011 271.3, 26.4
3. 0.3288 086.2, 63.5
(c)
Axis Eigenvalue Trend Plunge
1. 0.2856 205.2, 26.5
2. 0.0261 304.9, 18.7
3. 0.3117 065.9, 56.7
(d)
Figure 3.9. Orientation and palaeo-stress analysis for D7 fracture arrays measured in Kukuluma and Matandani pits. For each area, the plot shows the fault planes as great circles and lineations as arrows that point in the direction of movement of the hanging wall; these are placed on top of the fault plane solution (Bingham matrix solution) for the measured D7 faults (compression dihedron in white; tension dihedron in grey). The Bingham solutions for each data set are shown below the stereoplot. (a) W wall of Matandani pit (N = 30);(b) NE wall of Matandani pit (N = 13); (c) E wall of Kukuluma pit (N = 8); (d) all measurements from kukuluma and Matandani pits combined (N=51). All plots show N-S to NE-SW extension with a steep σ1, and flat. σ2 and σ3 orientations.

Page 69
The fractures are narrow (<3mm) and characterized by sericitic alteration (now mostly visible
as white kaolinite staining) with disseminated sulphide growth (now mostly oxidized).
Fracture planes preserve excellent slickenlines and shear sense indicators indicative of
predominantly sinistral-normal movement (Fig. 3.2h).
Paleo-stress analyses for the D7 fracture zones in Kululuma and Matandani pits using
Faultkin (Marrett and Allmendinger, 1990; Allmendinger et al., 2012; appendix 1 for a
description of the methodology) was performed on a total of 53 fracture planes for which
kinematic data was obtained. These fractures are all part of interconnected fault zones
targeted by artisanal workers, and hence it is assumed that they formed simultaneously in
response to the same far field stress (see appendix 1 for a more detailed discussion). In doing
the analysis all fracture planes were given the same weight. The results are shown in Fig. 3.9,
and indicate that the D7 shear zones in the central Kukuluma terrain formed in response to
horizontal, NNE extension in a plane strain environment.
Similar fractures are also targeted by artisinal miners in Area 3, where many are
decorated by stringers of thin (<1cm wide) grey quartz veins. The larger scale distribution of
the D7 faults, beyond the pit areas, is not clear, because the structures are extremely subtle
and not exposed beyond the workings of artisanal miners. However, the structures are clearly
targeted by artisanal miners and therefore important to mineralisation.
3.5.7. The emplacement of intrusions during deformation
Deformation events were accompanied by the emplacement of two separate suites of
syn-tectonic intrusions, one gabbroic to dioritic, the second monzodioritic to monzonitic in
composition, and a granodiorite suite that manifests itself as a first generation of porphyry
dykes and sills. These intrusions are collectively called the Kukuluma Intrusive Complex
(KIC; see Chapter 4) and they occur across the central part of the Kukuluma terrain where
Page 70
they can be traced from the far eastern parts of Area 3 to northwest of Matandani pit (Fig.
1.3). They have been overprinted by a second generation of felsic porphyry dykes.
The monzonite and diorite suites of the KIC are dominated by equigranular, fine- to
medium-grained, sheet-like bodies, stocks and plagioclase-rich porphyritic dykes of irregular
thickness (e.g. northwestern corner of Kukuluma pit), which locally form interconnected
networks that both transect and parallel bedding (Figs 1.3, 3.6, 3.7).
The granodiorite suite comprises thin (<2 m wide) dykes that occur in a variety of
orientations (steeply dipping dykes with west, northnorthwest and north trends have been
observed), with porphyritic textures in which rounded quartz augen and euhedral to subhedral
feldspar crystals are embedded in a fine-grained felsic matrix (Fig. 3.1g).
The intrusive diorite and monzonite bodies of the KIC are weakly to moderately
foliated as a result of D3 deformation. In some places intrusive margins were folded during
D3 and vein systems internal to the intrusions are also (D3) folded (e.g. 0418900-9687780).
More commonly intrusions form sheet-like bodies that were emplaced along axial planar
orientations of D3 fold, with intrusive contacts cutting through (D3) folded meta-sedimentary
sequences, whilst foliations parallel to S3 develop within the intrusions. In the southwestern
part of Matandani pit, rafts of D3 folded meta-ironstone occur within an intrusive diorite body
that is foliated in an orientation parallel to S3. Nowhere did we see diorite or monzonite
intrusions being folded around D2 structures, but the intrusions are affected by the large-scale
warping caused by D4. Plagioclase-rich porphyritic dykes of the diorite suite cut through the
more massive diorite bodies, and are foliated. Where these dykes cut through meta-sediment
and especially D3 planar high strain zones, they can be slightly folded as a result of D3. These
relationships indicate that the diorite and monzonite suites were emplaced as a number of
separate intrusions after D2, but immediately before and during D3 events.

Page 71
The porphyritic granodiorite dykes of the KIC are not foliated and intrude into the
diorite and monzonite bodies within Kukuluma and Matandani pits. They are overprinted by
D5 reverse faults and recumbent folds.
A second generation of felsic porphyry dykes represented by a single, north-trending,
1-2m wide, porphyritic felsic dyke transects Matandani pit (Figs 1.3b, 3.6). The dyke has
chilled margins and no internal fabric and cuts through D1-D6 structures. Where this dyke
cuts through the Juma and Kasata shears it can be seen to transect D6 fabrics. However, the
dyke is cut by narrow fracture planes assigned to D7, associated with slickensides, a sinistral
normal sense of movement with limited displacement (<5cm) and alteration including
sulphide growth and gold mineralization, i.e. the timing of emplacement of this dyke is post
D6, but pre D7 and pre-mineralisation (Table 3.1).
3.5.8. Syn-tectonic brecciation events
Parts of the folded meta-sedimentary sequences in Kukuluma and Matandani pits
were affected by brecciation processes. In Kukuluma pit, the breccia zones occur as
elongated bodies, 5-50m thick covering the entire height of the pit wall that are largely
restricted to the W wall of the pit. They occur within the strongly D2-D3 folded package of
meta-ironstone units with clasts consisting mostly of chert embedded in a more micaceous
and feldspar-rich matrix, in close spatial association with intrusive dykes and stocks of the
KIC.In Matandani pit, extensive brecciation occurs in the southwestern part of the pit, within
strongly D2-D3 folded meta-ironstone intercalated with micaceous and graphitic shale, and
concentrated along the W contact of a diorite intrusion that transects the centre of the pit (Fig.
1.3b). Outside the open pits, a major breccia body (~100x50 m in size) has been recognized
to the northwest of Matandani pit (Fig.1.3a), where it has also been intersected in drill core.

Page 72
The relationship between the breccia bodies, and the various deformation and
intrusive events is well preserved along the access ramp descending the western wall of
Kukuluma pit. Here the breccia’s vary form crackle breccias, in which breccia blocks have a
close jig-saw fit, where the underlying folds and layering are preserved and still visible in a
semi-coherent manner (Fig. 3.10a), to massive chaotic breccia in which the primary layering
is no longer visible (Fig. 3.10b). The change form jigsaw breccia to chaotic breccia is
gradational, and along the western wall of the pit, zones of more intense brecciation alternate
with folded zones were brecciation is weak to absent. Zones that display both D2 and D3 folds
are brecciated, with some of the brecciation appearing more intense near fold hinge zones, i.e.
in areas where the S3, axial planar fracture cleavage was more intensely developed. Although
the breccia zones are highly silicic, intensive quartz veining or vein stockworks are largely
absent, and the matrix to the breccia blocks is mostly made up of clay-rich micaceous
material and smaller chert fragments.
Zones of brecciation show a close spatial relationship with meta-ironstone units and
dykes belonging to the KIC, with breccia occurring along the margins of intrusive diorite-
monzonite bodies, or with dykes intruding into breccia zones. In one location (0418636-
9687782; Fig.3.10e-h) a porphyritic diorite dyke intruded into the breccia and displays highly
irregular boundaries, involving a planar trail of irregular, blob-like intrusive bodies up to 2 m
in size with indented boundaries and irregular protrusions and apophyses of dyke material
emplaced into meta-ironstone breccia. This intrusive relationship suggests that the dyke was
emplaced at the time the wall rocks had lost coherency, i.e. were ‘fluidized’ as a result of
brecciation. In other words this dyke was emplaced at the same time as breccia formation.

Page 73
(a) (b)
(c) (d)
(e) (g)
(g) (h)
Figure 3.10. Examples of hydrothermal, syn-D3 breccia and intrusions in W wall of Kukuluma pit: (a) & (b) progressive brecciation in ironstons including a complexly folded zone with crackle breccia in which the original folded bedding is still visible (a) and more advanced brecciation in which individual clasts have moved, but remnants of underlying folds are visible (b); (c) layer-parallel breccia in the core of a D3 fold (0418852-9688107); (d) fine-grained breccia pipe transecting folded ironstone/chert package (0418494-9688242). The inset shows hydrothermal breccia in a dioritic intrusive (drill hole ID: MTRD0005-588m); (e) to (h) relationship between diorite intrusion and breccia, suggesting emplacement into fluidized breccia with pepperite-like textures. (e) & (f), diorite dyke with highly irregular margins is emplaced into the breccia zone; (g) & (h) irregular blebs and fragments of diorite mixed within the breccia near the intrusive contacts of the dyke shown in (e) & (f).

Page 74
In other places (e.g. 0418621-9687801), polymict breccias can be observed in which
rare green, chlorite-actinolite-rich clasts of altered mafic origin, occur mixed with meta-
ironstone clasts along zones that show no internal layering or structure and transect folded
meta-ironstone beds. In such areas there is evidence for considerable movement between
breccia clasts. In places the breccia bodies show a much higher degree of matrix material and
a much smaller clast size along highly-altered, clay-rich planar zones that are reminiscent of
fluid pathways in intrusive breccia pipes (Fig. 3.10d). One such zone (0418574-9687942;
Fig.3.10d) cuts through an area of ironstone that was intensely folded during D3. Directly
adjacent to this zone, a strongly brecciated layer in sharp contact with non-brecciated meta-
ironstone is folded around a D3 fold (0418580-9688000; Fig. 3.10c) indicating that some
brecciation pre-dates D3 folding and is strata-bound, possibly even indicating a syn-
sedimentary origin for this breccia. In Matandani pit a raft of crackle breccia in which
brecciation overprints D3 folds, is embedded within a diorite intrusion with an S3 foliation.
The relationship between the breccia zones and D4 is not well developed within the pits, but
the breccia zones are truncated by low angle reverse faults of D5 origin and affected by D5
recumbent folding. In areas where D5 thrusts cut through the highly folded and fractured
meta-ironstone units, brecciation also appears to occur in spatial association with the D5 fault
planes.
When considered together, it appears that the bulk of the breccia bodies in Kukuluma
and Matandani pits formed immediately preceding or during D3 at the same time as the
emplacement of the diorite and monzonite bodies to which they are spatially linked. They are
best developed in the chert-rich meta-ironstones affected by D2-D3 folds. The highly folded
zones may have been conducive to breccia formation as a result of the pervasive S3 fracture
cleavage, which developed within the competent meta-ironstones during folding events.

Page 75
Although most brecciation appears to have been in-situ brecciation of folded competent rock
units, some ‘streaming’ of breccia blocks with pipe-like characteristics did occur. The field
relationships indicate that this type of breccia probably formed as a result of the emplacement
of the KIC during D3 events, with D3 folding, magma emplacement and hydrofracturing
working in concert to break up the competent meta-ironstone units.
Apart from the hydrothermal breccia associated with the KIC, there are planar breccia
zones or cataclasite zones associated with D6 shear zones (Fig. 3.2e), and syn-sedimentary
chert clast breccias (Fig. 3.1c). The D6 breccia zones are limited in areal extent and restricted
to places where D6 shear zones transect thick chert beds. These breccia bodies are elongate
and up to 2m wide and consist of laminated chert clasts embedded in a commonly sulfidic,
iron-rich matrix, which weathers black.
Fragmental sedimentary rocks, probably of volcanoclastic origin, are also common as
intercalations within the meta-greywackes, especially along the northern wall of Kukuluma
pit (Figs 3.1b, c). These fragmental volcanoclasic rocks have the appearance of strata-bound,
matrix supported breccia layers in which angular clasts and layer fragments of chert are
embedded in a matrix of siltstone/sandstone rich in micas and feldspar. They differ from the
hydrothermal breccia in the proportion of clasts to matrix, the fact that some display a degree
of grading and the fact that they are stratabound. Some of these syn-sedimentary fragmental
layers may also be affected by the later hydrothermal brecciation processes described above.
3.6. GOLD MINERALIZATION
The deposits of Kukuluma and Matandani occur on a deeply weathered erosional
plateau that possibly formed part of the (Cretaceous) African Erosion Surface, and they are
overlain by a thick regolith. Complete oxidation and weathering of all rock types occurs to
depths of >100m, which influenced gold distribution with leaching of gold in the top 20m of

Page 76
the regolith profile, and supergene enrichment of gold near the base of the regolith (Bansah et
al. 2000) as evidenced by the distribution of artisanal workings in Kukuluma pit. The gold
anomalies in Area 3 occur along the edge of the plateau, where the thick regolith has been
largely removed by erosion.
Initial trenching of a weak soil anomaly in deeply weathered and leached rock in the
Kukuluma-Matandani area gave few indications of the large ore bodies at depth, although,
free “leaf” gold in old artisanal workings indicated gold was present. Exploration drilling
revealed a general 2-3 g/t increase in mean grade between 60 and 105m depth at Kukuluma
and a planar zone of gold enrichment between the base of the regolith and the top of fresh
rock (Bansah et al., 2000). Mining of the oxidized ore zones took place between 2002-2007,
but once primary mineralization in fresh rock was reached mining stopped due to the
refractory nature of the ore (arsenopyrite-rich ore with locally abundant graphitic shale).
Gold mineralization along the Kukuluma Mineralized Trend is spatially related to D6
shear zones, to competent iron-rich lithologies, including meta-ironstone and chert that are
distributed in a complex manner due to D2-D3-D4 fold interference, and to the margins of
sheet-like intrusions of the KIC including gabbro, monzonite and diorite especially where
these intrusions are in contact with ironstone (Fig. 3.11). High-grade mineralisation is also
closely related to fracture networks of D7 origin. The ore zones are generally tabular in shape
with a northnorthwest strike and dips around vertical, parallel to the contact zones of
intrusions (Fig. 3.11). In Kukuluma pit it was observed that mineralisation widens along the
Juma shear where it cuts across the nose of an eastern plunging D3 fold, and narrows again
where the Juma shear runs oblique along the limbs of D3 folds (Skead, 2003). A second ore
zone in the pit occurs along the Kasata shear and is up to 50m wide, trending 290°, where the
Kasata shear intersects a complex D2-D3 antiformal fold interference structure in meta-

Page 77
ironstone; i.e. the presence of D3 fold hinge zones appears to have affected the width of ore
zones.
Figure 3.11. E-W cross-section through Matandani pit showing ore distribution along the margin of the Dioritic body as part of the Kukuluma Intrusive Complex. The cut- off grade of ore envelope is 0.5 ppm. The orange coloured ore envelope represents gold values 0.5-1 g/t Au whereas the one in red colour within the ore envelope represents gold grades > 1.0g/t Au.
Higher grade ore in the Matandani, Kukuluma and Area 3 deposits is normally found
within meta-ironstone and chert units, with low-grade ore distributed over a larger range of
lithologies (Table. 3.2, Fig. 3.12). For 30 diamond drill holes, representing a total length of
6094m from Matandani (2160m), Kukuluma (1787m) and Area 3 (2147m), which transect

Page 78
the main ore zones, the total length of mineralized rock at grades of >0.1, >0.5, >1 and >5
ppm gold was measured as a function of rock type.
Deposit grade Chert Ironstone Volc Seds Bshale Diorite FP Total
Matandani >0.1 ppm Au (m) 533.44 300.49 112.01 69.35 30.24 31.49 5.19 1082.21
>0.5 ppm Au (m) 287.65 208.38 32.76 29.04 5.45 15.60 2.54 581.42
>1.0 ppm Au (m) 193.59 174.70 20.04 18.64 1.50 15.60 0.00 424.07
>5.0 ppm Au (m) 33.28 65.17 9.00 1.00 0.00 13.00 0.00 121.45
Kukuluma >0.1 ppm Au (m) 175.79 283.07 73.07 92.11 17.97 40.47 0.00 682.48
>0.5 ppm Au (m) 111.30 111.41 16.20 52.89 4.00 8.30 0.00 304.10
>1.0 ppm Au (m) 86.65 45.98 3.00 41.75 3.00 4.30 0.00 184.68
>5.0 ppm Au (m) 21.00 4.45 1.00 15.98 0.00 11.00 0.00 53.43
Area 3 West >0.1 ppm Au (m) 127.75 265.34 49.86 7.00 17.35 17.00 0.00 484.30
>0.5 ppm Au (m) 60.11 128.50 27.00 1.00 2.50 10.00 0.00 229.11
>1.0 ppm Au (m) 37.36 93.34 12.70 0.00 0.00 4.00 0.00 147.40
>5.0 ppm Au (m) 10.21 28.44 2.00 0.00 0.00 2.00 0.00 42.65
(a)
Deposit grade Chert Ironstone Volc Seds Bshale Diorite FP Total
Matandani >0.1 ppm Au (%) 49.29 27.77 10.35 6.41 2.79 2.91 0.48 100.00
>0.5 ppm Au (%) 49.47 35.84 5.63 4.99 0.94 2.68 0.44 100.00
>1.0 ppm Au (%) 45.65 41.20 4.73 4.40 0.35 3.68 0.00 100.00
>5.0 ppm Au (%) 27.40 53.66 7.41 0.82 0.00 10.70 0.00 100.00
Kukuluma >0.1 ppm Au (%) 25.76 41.48 10.71 13.50 2.63 5.93 0.00 100.00
>0.5 ppm Au (%) 36.60 36.64 5.33 17.39 1.32 2.73 0.00 100.00
>1.0 ppm Au (%) 46.92 24.90 1.62 22.61 1.62 2.33 0.00 100.00
>5.0 ppm Au (%) 39.30 8.33 1.87 29.91 0.00 20.59 0.00 100.00
Area 3 West >0.1 ppm Au (%) 26.38 54.79 10.30 1.45 3.58 3.51 0.00 100.00
>0.5 ppm Au (%) 26.24 56.09 11.78 0.44 1.09 4.36 0.00 100.00
>1.0 ppm Au (%) 25.35 63.32 8.62 0.00 0.00 2.71 0.00 100.00
>5.0 ppm Au (%) 23.94 66.68 4.69 0.00 0.00 4.69 0.00 100.00
(b)
Table 3.2. (a) Length of logged drill core expressed in meters, listed by grade and rock type for the Matandani, Kukuluma and Area 3 West deposits. (b) Length of logged drill core expressed in % of total, listed by grade and rock type for the Matandani, Kukuluma and Area 3 West deposits. The lithological units listed comprise the following: Chert = massively banded chert and highly silicified laminated sedimentary units; Ironstone = well bedded, silicified, magnetite-rich units including BIF. Transitional with chert; Volc = volcanoclastic units including agglomerate, fragmental tuff and ignimbrite; Seds = sediments comprising alternating siltstone-shale units with layers of coarser-grained sandstone, grit and rare conglomerate; Black shale = black shale; Diorite = monzonite, and diorite of the Kukuluma Intrusive Complex.

Page 79
It was noted, that rocks were not always logged in the same manner, and that some
rock types were not identified, so that some generalizations had to be made. Nevertheless, it
is clear that all deposits show similar relationships between host lithology and ore grade, with
>75% of high-grade material (>5ppm) hosted in grunerite-magnetite-chlorite-biotite-rich
meta-ironstone and chert units (81% at Matandani, 73% at Kukuluma and 82% at Area 3;
Fig. 3.12), which are commonly logged as chert-rich BIF or sedimentary BIF (Sanislav et al.,
2016), suggesting a close relationship between mechanically competent, iron-rich lithologies
and gold mineralisation. Significant high-grade mineralisation may also occur in sedimentary
units (30% at Kukuluma) and diorite (11% at Matandani, 21% at Kukuluma and 5% at Area
3; Fig. 3.12).
The monzonite-diorite intrusions are generally mineralized to within ~3m from the contact
with mineralized meta-ironstone, especially near zones were the margin is sheared and meta-
ironstone xenoliths occur within the intrusions. At lower grades (<1ppm), other lithologies
host some mineralization, but the bulk of the ore (~70-80%) continues to be hosted in the
highly fractured, silicified meta-ironstone and chert lithologies (Fig. 3.12). Gold in fresh
rock is fine-grained (<20 mµ) and occurs preferentially in silicified meta-iron stone units,
within magnetite, pyrrhotite and arsenopyrite grains that are spatially associated with fibrous
grunerite aggregates and pyrrhotite, pyrite and chlorite alteration (Fig. 3.13. Note, that
grunerite is not restricted to ore zone, but is also a regional metamorphic mineral that is
pervasive in meta-ironstone and formed during D2-D3 events. In mineralized zones magnetite
is commonly replaced by pyrrhotite and arsenopyrite, pyrrhotite, pyrite, stibnite and scheelite
occur in fracture networks and as disseminations. Silicification, chlorite-biotite alteration and
minor veining characterize the ore zones more broadly. Arsenopyrite–pyrrhotite–magnetite–
chlorite assemblages are dominant in highly brecciated chert units whereas pyrite is more

Page 80
common where meta-ironstone is interbedded with shale units. The alteration assemblages
affect intrusive units at or near the sheared contact zones (Fig. 3.11). Higher grades are
recorded in areas where arsenopyrite is dominant and chlorite alteration less prominent. In
highly mineralized zones gold is generally associated with a network of mm-scale micro-
fractures that are in-filled with pyrrhotite and arsenopyrite (Fig.3.13), and that are best
develop in the chert-rich layers of brecciated and folded meta-ironstone units. It is these
fracture zones at that are also targeted on surface by artisanal miners, and they are probably
the result of D7 faulting.
Figure 3.12. Length of logged drill core expressed in % of total length, listed by grade and rock type for the Matandani, Kukuluma and Area 3 West deposits. The plots are based on values listed in Table 2. The lithological units listed comprise the following: Chert = massively banded chert and highly silicified laminated sedimentary units; Ironstone = well bedded, silicified, magnetite-rich units including BIF. Transitional with chert; Volc = volcanoclastic units including agglomerate, fragmental tuff and ignimbrite; Seds = sediments comprising alternating siltstone-shale units with layers of coarser-grained sandstone, grit and rare conglomerate; Bshale = black shale; Diorite = monzonite, and diorite of the Kukuluma Intrusive Complex.

Page 81
In places, hydrothermal breccia zones are mineralized (Fig.3.13c) where they are cut
by D6-shear zones, which themselves are associated with tectonic cataclasite or breccia zones
infiltrated with sulphide (e.g. southern part of Matandani pit). Gold mineralization has also
been observed in breccia zones that are not obviously (D6) sheared, but that are close to
shears and occur next to the contact with the diorite/monzonite intrusives. In such areas,
intense micro-fracturing, probably of D7 origin can be observed in drill core with progressive
infill of pyrrhotite in fractures within the ore zone. The highly fractured zones represented by
the D3 fold hinges and breccia zones in chert and meta-ironstone would have acted as easy
passageways for mineralizing fluids at the time of gold mineralization, which can happen
away from D6 shear zones.
(a) (b)
(c) (d) Figure 3.13. Examples of mineralised lithologies in the Matandani deposit and Kukuluma deposits: (a) laminated ironstone package with pyrrhotite mineralization along thin fractures; (b) ironstone with gold-rich pyrrhotite replacement of magnetite; (c) mineralized brecciated ironstone with a siliceous matrix affected by carbonate infill; (d) Strongly foliated mafic volcaniclastic unit with gold-rich arsenopyrite (21g/t Au).
3.7. DISCUSSION
3.7.1. Tectonic history of the central Kukuluma terrain.
A summary of the deformation, intrusive and mineralizing events encountered in the
central Kukuluma terrain is presented in Table 3.1. Following deposition of the volcano-

Page 82
sedimentary sequence at least 7 separate deformation events and 2 intrusive episodes have
been identified. The ductile deformation events D1-D5 evolved from early layer-parallel
shearing (D1) possibly in response to syn-sedimentary extension, via a first episode of upright
folding (D2) and a second phase of distributed shearing and cylindrical upright folding with
northwest trending axial planar surfaces (D3) to a late stage of open vertical folding (D4) and
then recumbent folding and thrusting (D5) in response to north-south shortening. This was
followed by the development of a network of brittle-ductile shear zones recording dextral
reverse movement on NW trending structures and sinistral reverse movement on southwest
trending shears, consistent with continued north-south shortening (D6; Fig. 3.8) and finally
reactivation of the shears as normal faults (D7; Fig. 3.9). Considering that both D5 thrusts and
D6 shears are consistent with N-S shortening, both events could have formed progressively.
Early deformation events were accompanied by the emplacement of the Kukuluma Intrusive
Complex (KIC), with dykes, stocks and tabular plugs belonging to diorite and monzonite
intrusions being emplaced during D3, with earliest intrusions preceding D3 folding, and latest
intrusions intruding along D3 fold axial planes, but still preserving an internal S3 foliation.
Porphyritic granodiorite dykes interpreted as a late felsic phase belonging to the KIC,
intruded after D5, but before the development of D6 shear zones. A second generation of
(north trending) felsic porphyry dykes was emplaced after D6, but before D7 and has been
affected by D7 normal faulting and alteration, which included gold mineralization (Table 3.1).
The deformation and intrusive sequence of events described for the central Kukuluma
terrain (Table 3.1) is near-identical to the deformation-intrusive sequences obtained in the
Nyankanga (Sanislav, 2015) and Geita Hill (Sanislav, 2016) deposits in the Central terrain,
even though the latter occur across a major terrain boundary at somewhat lower peak
metamorphic conditions (Fig. 1.2). Both areas record early D1 events associated with chert
formation along discordant zones, and D2-4 events in both areas are near identical, with the

Page 83
exception that structures in Nyankanga and Geita Hill are generally co-linear around a
moderately northwest plunging lineation with fold interference patterns dominated by type 3
patterns, whereas D2-4 structures in the central Kukuluma terrain preserve a greater diversity
in fold-axes orientation with type 2 interference folding being common. This suggests that the
central Kukuluma terrain experienced lower strain, which is consistent with the excellent
preservation of primary sedimentary structures in the area. Nevertheless, localized, planar D3
high strain zones with northwest plunging lineations in which S0, S1, S2 and S3 fabrics have
been transposed also occur in the central Kukuluma terrain where strain was partitioned on a
500-1000m scale in planar domains, enveloping fold domains, in a manner not dissimilar
from foliation domains and microlithons described for crenulation cleavages in thin section
(e.g. Passchier and Trouw, 2006), but on a much larger scale. The fold domains represent
areas of relatively low D3 strain where sedimentary structures and layering are clear and D1,
D2 and D3 folds are well exposed. In contrast planar domains, which look less deformed at
first glance, actually represent areas of relatively high D3 strain where all earlier fabrics have
been transposed into a planar S3 fabric. In the central Kukuluma terrain these zones vary in
width from several metres up to50m, but elsewhere in the GGB, larger planar high strain
zones have been recognized, especially along the S margin of the belt (Cook et al., 2015)
where they are equated with major terrain boundaries (e.g. Kabete et al., 2012; Fig. 1.2).
The similarity in deformation histories for the Central and Kukuluma terrains
suggests that the tectonic history for much of the GGB is similar, and that terrain boundaries
internal to the GGB do not separate diverse domains as would be expected in accretionary
terranes (e.g. Dirks et al., 2002; Blewett et al., 2010b; Kabete et al., 2012a), at least not at the
scale of the GGB. It is common in many greenstone terrains that early, layer-parallel shear
zones (D1) are overprinted by later, more upright folding events (D2-4), which resulted in the
formation of synformal or keel-like geometries (e.g. Peterson and Zaleski, 1999; Hofmann et

Page 84
al., 2003; de Witt et al., 2011; Bedard et al., 2013; Lin and Beakhouse, 2013); i.e. the GGB
does not vary significantly from many other greenstone terrains and its tectonic history may
reflect greenstone tectonics more broadly.
D5 events in the Kukuluma area are more clearly developed than at Geita Hill or
Nyankanga (Sanislav et al., 2015, 2016); with recumbent folding showing a clear relationship
with low-angle reverse faults. Such structures are common in many greenstone belts, and
may have resulted from the rise of diapirs and consequent steepening of the margins of the
greenstone belt (e.g. Jelsma et al. 1996; Lin and Beakhouse 2013).
D6 brittle-ductile shears along the Kukuluma Mineralised Trend correlate to the N-
dipping sinistral thrust zones in Nyankanga and Geita Hill; they are identical in metamorphic
grade (and association with gold) and only vary in orientation and dominant shear sense, but
both are consistent with north-south shortening (Sanislav et al., 2016). In the Kukuluma and
Matandani pits, the network of D6 shear zones share a common, steeply westnorthwest
plunging (Fig. 3.6) intersection lineation that more-or-less parallels D4 fold axes, a dominant
cluster of D3 fold axes (Fig. 3.3e) and the mineral elongation lineation in D3 high strain
zones. This co-linearity of deformation features was also noted in the Geita Hill deposit
(Sanislav et al., 2016) where mineralization followed the same general trend, and it has been
interpreted to reflect a co-genetic relationship of D2-D6 events linked to the same large-scale
accretionary processes (Sanislav et al., 2015, 2016).
Later reactivation of D6 shears in Geita Hill and Nyankanga involved several events
including strike-slip and normal movements grouped as D7-8 events, whilst in the central
Kukuluma terrain these events are grouped as D7 with normal movement being dominant,
These D7 events resulted from northnortheast extension and they can be linked to gold
mineralization. In a similar way, the KIC correlates in composition and relative timing with
the Nyankanga Intrusive Complex (Sanislav et al., 2014; Chapter 4), and both areas show

Page 85
evidence of igneous events associated with felsic dykes and lamprophyres after D6 and before
D7.
Considering the close correlation between the two terrains it is suggested that
following Sanislav et al. (2015), D1-6 events in the Kukuluma terrain occurred at the same
time as D1-6 events at Geita Hill, i.e. between 2700 and 2680 Ma including the emplacement
of the KIC. In the Nyankanga deposit, quartz porphyry dykes dated at 2689 ± 11 Ma
(Chamberlain and Tosdal 2007; Sanislav et al., 2015) truncate D6 shear zones, which suggests
that D6 (and D5) events represent the retrograde, waning stages immediately following
accretionary D1-4 events. Using a similar comparison, emplacement of the late porphyry dyke,
D7 normal faulting and mineralization occurred later (probably <2650 Ma) and coincided
with emplacement of 2620-2660 Ma granitoids to the east, north and west of the GGB
(Sanislav et al. 2014). This deformation and intrusive framework has been tested with zircon
geochronology presented in chapter 5.
3.7.2. The nature of D1 events.
D1 chert ridges in the central Kukuluma terrain form prominent structures and can be
linked to quartz veining, display low angle truncations with S0, preserve internal disharmonic
folding of a well-developed early fabric, and show bifurcation of quartz ridges. These
tectonic characteristics suggest that many of the chert ridges in the area originated as low
angle shear zones during D1 (e.g. Hofmann et al., 2001a, 2001b, 2003; Dirks et al., 2002),
rather than exhalative deposits associated with ironstone formation in the original volcano-
sedimentary pile (e.g. Borg and Rittenauer 2000; Krapez et al. 2003). Similar tectonic chert
units decorating early low-angle shear zones have been described from other greenstone belts
(e.g. Zegers et al., 1996; deWit and Ashwal, 1997; Hofmann et al., 2003; Dirks et al., 2003,
2009; Weinberg and van der Borgh, 2008), and have been equated to low-angle shear zones

Page 86
that either accommodated stratigraphic duplication of the greenstone sequence (e.g. deRonde
and deWit, 1994; Hofmann et al., 2001a) or extension (e.g. Zegers et al., 1996; Kloppenburg
et al., 2001). It is noted that on a regional scale, stratigraphic duplications of the greenstone
sequences appear absent, which could suggest that the D1 structures in the Kukuluma terrain
represent low-angle detachment zones that facilitated basin development in which the
greenstone sequences accumulated (e.g. Zegers et al., 1996; Kloppenburg et al., 2001).
Given that at least some of the cherts originated as layer-parallel quartz veins that intruded in
large numbers, and that layering at the time of D1 was probably sub-horizontal (i.e. D1 events
predated all upright folding events), it would indicate that the D1 cherts formed close to
surface (i.e. at a level where regional fluid pressures would allow the emplacement of
horizontal quartz veins across large areas). This would suggest that basinal fluids, possibly of
diagenetic origin, were channeled along these structures during early stages of burial, in a
manner similar to that described for the Neo-Proterozoic, Belingwe Greenstone Belt in
Zimbabwe (e.g. Hofmann et al. 2001b, 2003). Syn-sedimentary extensional structures and
chert formation have been described from the Geita-Nyankanga area (Krapez, 2008), which is
consistent with this interpretation.
3.7.3. Controls on gold mineralization
Spatially, gold mineralization within the Kukuluma Mineralized Trend is closely
associated with D6-D7-shear zones where they utilize the contact zone between diorite
intrusions of the KIC and magnetite-rich, meta-ironstone units within the surrounding
volcano sedimentary package (Fig. 3.11). High-grade mineralisation is also closely associated
with networks of extensional D7 fractures. Ore zones occur almost entirely within the meta-
ironstone units, and differ in this respect from mineralisation in Nyankanga and Geita Hill,
where diorite of the Nyankanga Intrusive Complex is widely mineralised, be it at a lower

Page 87
grade (Borg et al., 1990; Borg, 1994; Sanislav, 2015). The ore zones widen where D6-D7
shear zones traverse intensely folded and highly brecciated areas, with D3 fold axial zones
and syn-D3 hydrothermal breccia zones near KIC intrusive margins especially conducive to
the infiltration of mineralising fluids along pre-existing micro-fracture networks. However,
this relationship only holds where mineralised D6 shear zones are in close proximity to the
folded and brecciated areas; i.e. brecciation of meta-ironstone units in itself does not
guarantee gold mineralisation. These relationships indicate that the D6-D7 shear zones along
the Kukuluma Mineralised Trend acted as upper-crustal channel ways for the mineralising
fluids, facilitating the infiltration into fractured zones offered by the strongly folded and
brecciated meta-ironstones (e.g. Robert et al., 1991; Cox et al., 2001). In this context it is also
important to note that the distribution of the ironstones is highly complex as a result of D2-
D3-D4 fold interference, and, therefore, that the intersection zones of D2-D3-D4 folded
ironstones and D6-D7 shears is highly discontinuous, which contributes to the distributed
nature of the ore zones in the area. Earlier reports (e.g. Skead, 2003) argued that
mineralisation was controlled by the Juma and Kasata shears, and that their apparent
displacement between Kukuluma and Matandani pits was the result of later E-W sinistral
faults.
A similar east-west fault was assumed to have displaced the southern end of the Juma
shear to account for mineralisation in Area 3 to the east. Pit exposure, now shows that the
Juma and Kasata shears anastomose and change in orientation from west-trending to
northwest trending, with no evidence of offsets by later east-west faults. Likewise the eastern
tip of the Juma fault displays a complex fault splay, characteristic for fault tips or
terminations (Fossen, 2016), with no evidence of displacement by cross cutting faults. Thus,
the spaced distribution of mineralisation from Area 3 West, via Kukuluma to Matandani
should be understood in terms of an en echelon array along a westnorthwest trending

Page 88
corridor, rather than a continuous northwest trending ore zone displaced by later east-west
faults.
The close spatial relationship of gold with meta-ironstone and the intrusive margins of
the KIC indicate a litho-chemical control on mineralisation with sulphidization of the
magnetite-rich units being particularly important. It is, therefore, assumed that much of the
gold entered the system as sulphur complexes, which destabilised upon contact with
magnetite-rich rocks (e.g. Seward, 1973; 1991; Kerrich, 1989; Shernberger and Barnes, 1989;
McCuaig and Kerrich, 1998; Likhoidov et al., 2007; Sanislav et al., 2015). Compared to
other major deposits in the GGB, mineralisation along the Kukuluma Mineralised Trend is
more pyrrhotite-arsenopyrite rich, which may reflect a combination of higher metamorphic
grade and host-rock control.
In terms of timing of gold mineralisation in the Kukuluma terrain, reference again
must be made to the similarity of the geological history between Geita Hill, and Kukuluma
and Matandani. Similar to Kukuluma and Matandani, mineralisation at Nyankanga is
spatially linked to D6 reverse faults that formed prior to ~2685Ma (Chamberlain and Tosdale,
2007; Sanislav et al., 2015). However, the mineralising event is late-tectonic and associated
with normal fault reactivation of the older reverse faults (i.e. D8 at Nyankanga and Geita Hill;
Sanislav, 2015, 2016; D7 at Matandani-Kukuluma; Table 1). The mineralising events post-
date an intrusive event dated at Geita Hill at 2644 Ma (Borg and Krogh 1999). By analogy,
the mineralisation along the Kukuluma Mineralised Trend, which truncates the late north-
trending porphyry dyke in Matandani, is similarly late-tectonic and associated with extension
of the older D6 structures (see also Chapter 5). Thus, whilst the ore-body geometries are
entirely controlled by deformational structures and lithological distributions that formed
during the early (i.e. 2700-2680 Ma) stages of evolution of the GGB, the actual mineralising
events probably occurred much later when fluids, possibly linked to a deeper igneous source,

Page 89
were pumped into the dilatant zones during extension. In this context it is important to note
that the ore zones in Kukuluma and Matandani pits widen, where the D6 shear zones display
s-like bends (from northwest to west to northwest trending). Such S-bends would be
constraining bends (Fossen, 2016) during D6 dextral reverse faulting, but during D7 the faults
were reactivated to accommodate sinistral-normal movement, meaning that the S-bends
would be areas of maximum dilatancy.
In review papers on gold mineralisation the Geita mine is commonly classified as a
Neoarchean, BIF-hosted, orogenic gold deposit (e.g. Goldfarb et al., 2001, 2005; Groves et
al., 2006; Bierlein et al., 2006, 2009) related to subduction-accretion systems with all mafic
sequences deposited in a subduction-back arc environment (Kabete et al., 2012). Cook et al.
(2015) and Sanislav et al. (2015, 2016) showed that this interpretation needs adjustment.
They argue that, rather than forming in a classic orogenic setting, mineralization entered the
greenstone belt during an extensional phase concomitant with the emplacement of
widespread TTG granites (Sanislav et al., 2014), ~40-50 Ma after compressional deformation
and accretion of the greenstone sequence. Cook et al. (2015) showed that the mafic-
intermediate volcanics in the GGB could have evolved from melt segregation of depleted
mantle below thick oceanic plateaus away from subduction systems and accretionary
margins, and that the greenstone sequence may in fact have never experienced accretion-
subduction processes as postulated by Kabete et al., 2012. If so, this would further invalidate
a traditional orogenic setting for the gold deposits in the GGB (Goldfarb et al., 2001).
3.8. CONCLUSIONS
Detailed mapping of the central part of the Kukuluma terrain in the E GGB shows that
the deformation-intrusive history of the area (Table 3.1) is near identical to the geological
history of the Central terrain which hosts the world class Nyankanga and Geita Hill deposits.

Page 90
This similarity occurs across major structural boundaries, and suggests that the geological
history of much of the GGB is similar, with an early compressional-accretionary phase (D2-6)
between 2700-2680Ma associated with the emplacement of internal intrusions of the KIC,
and a later extensional phase (D7) associated with a second generation of intrusions, and gold
mineralisation.
The geometry of the ore bodies at Kukuluma and Matandani is controlled by the
distribution of magnetite-rich meta-ironstone, near the margins of monzonite-diorite bodies
of the KIC where they are cut by D6-D7 shear zones. High-grade mineralisation is enhanced
by pre-existing breccia zones and D3 fold hinges characterised by a high density of micro-
fracturing. The actual mineralising events may have happened late (<2650 Ma), during D7
extensional reactivation of some D6 shear zones, and the formation of broader D7 deformation
zones.

Page 91
CHAPTER 4
THE PETROGENESIS OF THE NEOARCHEAN KUKULUMA
INTRUSIVE COMPLEX, NW TANZANIA*
*This chapter has been submitted to Precambrian Research as: S. D. Kwelwa, I. V. Sanislav, P. H. G. M. Dirks, T. Blenkinsop, S. L. Kolling, 2017 etc.
4.1. SUMMARY
Kukuluma Intrusive Complex (KIC) is an intermediate to felsic, late Archean igneous
complex that intruded the Geita Greenstone Belt of northwest of Tanzania. The KIC consists
of two separate diorite and monzonite suites that intruded syn-tectonically, and a granodiorite
suite (mostly dykes) that intruded late syn-tectonically. The monzonite and the diorite suites
have low silica content (SiO2 ≤ 62 wt %), moderate Mg# (Mg#average = 49), high Sr/Y
(Sr/Yaverage = 79) and high La/Yb (La/Ybaverage = 56) ratios, and strongly fractionated
chondrite normalized (Lan/Ybn = 9 to 69) REE patterns. Their moderate Ni (Niaverage= 50
ppm), Cr (Craverage= 85 ppm), variable Cr/Ni ratio (0.65-3.56) and low TiO2 (TiO2average= 0.5
wt%) indicate little to no interaction with the peridotitic mantle. For most major elements
(Al2O3, FeOt, Na2O, TiO2 and P2O5) the monzonite and the diorite suites display sub parallel
trends for the same SiO2 content indicating they represent distinct melts. Intrusions belonging
to the diorite suite have high Na2O (Na2Oaverage = 4.2 wt %), Dy/Ybn (Dy/Ybn-average = 1.6), a
positive Sr anomaly and uncorrelated Nb/La and Zr/Sm ratios suggesting derivation from
partial melting of garnet-bearing amphibolite in which plagioclase was not stable. Intrusions
belonging to the monzonite suite have higher Na2O (Na2Oaverage = 5.61 wt %), Dy/Ybn
(Dy/Ybn-average = 2.21), a negative Sr anomaly and correlated Nb/La and Zr/Sm ratios

Page 92
consistent with derivation from partial melting of eclogite with residual rutile. Small
variations in the Th/U ratio and near chondritic/MORB average values (Th/Umonzonite = 3.65;
Th/Udiorite = 2.92) are inconsistent with a subducting slab signature, and it is proposed that the
monzonite and the diorite suites of the KIC formed by partial melting of the lower mafic crust
of an oceanic plateau.
The granodiorite suite has lower Mg# (Mg#average = 41), moderately fractionated REE,
low Sr/Y (Sr/Yaverage = 20), La/Yb (La/Ybaverage = 15), Dy/Ybn (DyYbn-average= 1.24) and small
negative Eu anomalies suggesting derivation from partial melting of amphibolite and
plagioclase fractionation. Near-MORB Th/U (Th/Uaverage = 2.92) and Zr/Sm (Zr/Smaverage =
30.21) ratios are consistent with intracrustal melting of amphibolite.
4.2. INTRODUCTION
The geochemical signature of intermediate to felsic rocks with fractionated REE
patterns and high Sr/Y and La/Yb ratios has been interpreted to indicate melt derivation from
a subducted slab at amphibolite to eclogite facies conditions (Defant and Drummond, 1990;
Drummond and Defant, 1990). Their particular geochemical signature, including a high Mg#
(molecular (Mg/Mg+Fe) x100) and enriched large-ion lithophile elements (LILE) were
interpreted to represent different degrees of interaction between slab melts and mantle
peridotite in the mantle wedge (e.g. Kay, 1978; Tatsumi and Ishizaka, 1981; Shirey and
Hanson, 1984; Stern et al., 1989; Defant and Drummond, 1990; Drummond and Defant,
1990; Tatsumi, 2006; Moyen, 2009; Castillo, 2012). Arc rocks with similar geochemical
signatures, including andesite, dacite, sodic rhyolite and their plutonic equivalents, were
grouped under the term “adakites” by Defant and Drummond (1990) implying they share a
specific petrogenetic history, namely, melting of the mantle wedge induced by fluids and/or

Page 93
melts from the subducted slab. Another class of rocks sharing similar petrogenetic processes
(e.g. melting of mantle peridotite metasomatised by subduction fluids/melts) and
geochemically similar to adakites includes the high-Mg andesites or sanukitoids (e.g. Tatsumi
and Ishizaka, 1981; Shirey and Hanson, 1984; Tatsumi, 2006; Tatsumi, 2008), and the crustal
contaminated sanukitoids of South India described as “Closepet-type” granites (Jayanada et
al., 1995).
The important message contained in the original definition of adakites and sanukitoids
was that the metasomatised mantle wedge is the primary source for these magmas, and the
slab derived fluids/melts are just the metasomatic agents, thus imparting a subduction
signature. Martin et al. (2005) subdivided adakites into two groups, low-silica adakites
(LSA) and high-silica adakites (HSA), corresponding to distinct petrogenetic processes. In
this subdivision the LSA are equivalent to sanukitoids and their petrogenesis involves melting
of subduction modified peridotite as originally proposed by Defant and Drummond (1990).
On the other hand, the HSA are proposed to be analogues of the late Archean tonalite-
trondhjemite-granodiorite (TTG) magmas and derived from partial melts of subducted
basaltic crust in the garnet stability field, which reacted with peridotite during ascent (Martin
et al., 2005). Archean rocks with an “adakitic” geochemical signature have been used to
argue in favour of a plate tectonics regime in the Archean (e.g. Martin, 1999; Polat and
Kerrich, 2001; Manya et al., 2007; Manykyamba et al., 2007; Mohan et al., 2013; Kwelwa et
al., 2013).
However, alternative models propose that rocks with an “adakitic’ signature can form
by fractional crystallization in the garnet stability field (e.g. Kamber et al., 2002; Macpherson
et al., 2006; Richard and Kerrich, 2007; Rooney et al., 2011), by melting thickened mafic
lower crust (e.g. Atherton and Petford, 1993; Rudnick, 1995; Wang et al., 2005), or through

Page 94
the interaction of delaminated eclogitic lower crust with the underlying mantle (e.g. Bedard et
al., 2003; Tuloch and Kimbrough, 2003; Gao et al., 2004; Wang et al., 2005; Goss et al.
2011). Since most of the continental crust was formed in the Archean (e.g. Taylor and
Mclennan, 1995; Tatsumi, 2008; Hacker et al., 2015) and the Archean rock record is
dominated by rocks with an adakite-like (TTG’s; e.g. Condie, 2005; Moyen, 2011; Moyen
and Martin, 2012) geochemical signature, understanding the petrogenetic processes that
resulted in the formation of rocks with an adakitic signature in the Archean is essential. This
is particularly important for the late Archean period when major shifts in the composition of
the TTG suites are interpreted to reflect fundamental changes in global tectonics (e.g. Condie,
2005; Martin et al., 2010; Moyen and Martin, 2012; Condie, 2014). In this contribution we
present major and trace element geochemical data from the Kukuluma Intrusive Complex
(KIC) that intruded the NeoArchean Geita Greenstone Belt of NW Tanzania and discuss the
petrogenesis and tectonic setting of the KIC. For background to the general geology of the
Tanzania Craton and geological setting of the Geita Greenstone Belt I refer to the
introduction in Chapter 1.
4.3. THE KUKULUMA INTRUSIVE COMPLEX
The Kukuluma Intrusive Complex (KIC) consists of a series of northwest trending
intermediate to felsic igneous rocks (Fig. 1.3) that intruded the folded sequence of the Upper
Nyanzian sediments. Three major gold deposits, Matandani, Kukuluma and Area 3 West,
occur along the contact between the KIC and the sediments (Fig. 1.3). The KIC is dominated
by equigranular, fine- to medium-grained and locally porphyritic, intermediate intrusives
(Fig. 4.1) and subordinate felsic (Fig. 4.1) porphyritic dykes.

Page 95
Figure 4.1. Photomicrographs showing the three main rock types found in the KIC. a and b) Medium grained diorite; the mineralogy is dominated by amphibole (mostly actinolite) and plagioclase with minor quartz. c and d) Medium grained monzonite; the mineralogy is dominated plagioclase, k-feldspar, biotite and amphibole with minor quartz. The diorite and monzonite have been deformed and metamorphosed to greenschist facies. As a result amphibole and pyroxene have been partly replaced by actinolite. Note that the feldspars in both rock types are not altered to sericite and appear fresh under microscope suggesting that the samples have not been significantly affected by hydrothermal alteration. e and f ) Photographs of a porphyritic granodiorite dyke. Note that the feldspars from the granodiorite have been partly replaced by sericite but appear mostly fresh under microscope. Small amounts of carbonate and chlorite, disseminated or as microveins are present in all samples.

Page 96
The intermediate intrusive bodies are weakly to moderately foliated, indicating syn-D3
emplacement (using the deformation scheme of Sanislav et al., 2015). The mineralogy is
dominated by plagioclase (30-45 %), amphibole (30-40 %), alkali-feldspar (5-25 %), biotite
(5-15%) pyroxene (5-10%) and quartz (5-20%). Based on the mineralogical composition the
intermediate intrusives of the KIC can be separated into a diorite suite (gabbro-diorite and
diorite; Figs 4.3a and b) and a monzonite suite (monzodiorite and monzonite; Figs 4.1c and
d). The feldspars are only partly sericitized (Figs. 4.1b and d) while some of the mafic
minerals are partly replaced by metamorphic actinolite. Accessory minerals include apatite,
magnetite and rutile. Minor chlorite and carbonate are present as disseminated minerals,
partly replacing the mafic minerals or along veins.
The felsic porphyritic dykes (Figs 4.1e and f) show a narrower variation in their
mineralogical composition. Their mineralogy is dominated by quartz (15-40 %), plagioclase
(50-70%), K-feldspar (5-40%), biotite (5-15%) and amphibole (1-10%). Based on their
mineralogical composition the felsic phase of the KIC varies between granodiorite and
tonalite. The plagioclase is partly sericitized and the mafic minerals are partly replaced by
chlorite.
4.4. ALTERATION AND ELEMENT MOBILITY
The KIC rocks are deformed, metamorphosed and locally overprinted by hydrothermal
alteration related to the three gold deposits located along its margins. The top 100 meters of
the intrusive complex is highly weathered so that all samples were collected from diamond
drill holes that intercepted the intrusive complex at more than 400 meters below the surface.
Petrographic examination of the samples revealed minor carbonate and chlorite alteration
indicating that the samples have been hydrated and carbonated. The loss of ignition (LOI)

Page 97
values of up to 5.5% confirms the petrographic observations and requires that all samples be
screened for element mobility.
To test the element mobility for the KIC samples we used only the monzonite and
diorite suites, because the higher number of samples allows compositional variations induced
by post-magmatic alteration to be identified more easily. Na, K, Rb and Sr are all easily
mobilised during low-temperature hydrothermal alteration and metamorphism. The post-
magmatic disturbance of Na, K, Rb and Sr by hydrothermal alteration and metamorphism can
be tested by plotting their concentration against the LOI values. A lack of correlation
indicates little or no significant disturbance while well-correlated trends indicate significant
disturbance and mobility. The lack of any correlation between these elements and the LOI
values (Fig. 4.2) combined with their coherent behaviour on other geochemical plots suggests
that the post-magmatic alteration did not significantly mobilised these elements and they can
be used for petrogenetic interpretations. In general REE and HFSE are considered immobile
during hydrothermal alteration and greenschist facies metamorphism but situations where the
REE were mobile have been documented (e.g. Wood et al., 1976; Condie et al., 1977); with
the LREE considered to be more mobile than the HREE (Sun and Nesbit, 1978). To test the
mobility of the REE from the KIC rocks, we plotted the concentration of La against Zr (Fig.
4.2e), and to test the mobility of the HFSE we plotted the concentration of Nb against Zr (Fig.
4.2f).
The strong positive correlation that exists between these elements in combination with
the coherent behaviour of the REE and HFSE on chondrite and primitive mantle normalised
plots indicate that these elements most probably retained their original concentrations. The
ratio of highly incompatible elements such as Th and U should be near chondritic
(Th/Uchondrite= 3.63; Sun and McDonough, 1989) unless disturbed by alteration processes

Page 98
when U is mobile under oxidizing conditions. The average Th/U ratio of all KIC rocks
(Th/Umonzonite=3.65; Th/Udiorite= 2.92; Th/Ugranodiorite= 2.92) is near chondritic suggesting little
to no mobility of these elements during hydrothermal alteration and metamorphism.
Figure 4.2. Series of diagrams showing that although the rocks of the KIC have been hydrated and carbonated, as indicated by the petrography and LOI values, their major and trace element composition was very little disturbed. Diagrams a and b show that there is no correlation between the concentration of two of the most mobile major elements, Na2O and K2O, and the LOI values. The same pattern is observed in c and d where the concentration of two of the most mobile trace elements, Rb and Sr, are plotted against the LOI values suggesting that most likely the concentration of these elements is close to their initial values. The mobility of REE and HFSE was tested by plotting the values of La (e) and Nb (f) against Zr, a highly immobile element. The good correlations suggest that these elements were most likely immobile during post-magmatic alteration and metamorphism.

Page 99
4.5. THE GEOCHEMISTRY OF THE KIC
The geochemical composition of the KIC (Tables A7.1-A7.3; Fig. 4.3) is characterised
by: intermediate SiO2 (59.17 wt %), moderate #mg (0.47), high Al2O3 and FeO (15.83 wt%
and 5.66 wt% respectively) and moderate MgO (2.78 wt %). The K2O/Na2O ratio is less than
1 (0.70) and CaO+Na2O is more than 8 (8.82%). The Y content is low (14.5 ppm) and Sr is
high (765 ppm) with an average Sr/Y ratio of 59. The HREE are depleted relative to the
LREE with an average La/Yb ratio of 42 and the Cr content is moderately high (62 ppm). The
chondrite normalized REE pattern (Fig. 4.4) show fractionated patterns while the primitive
mantle normalized multi-element patterns show negative Nb and Ti anomalies and a general
enrichment in the large ion lithophile elements (LILE).
4.5.1. The Monzonite suite
The geochemical composition of rocks that belong to the monzonite suite (Fig. 4.3;
Table A7.1) from the KIC is characterized by intermediate SiO2 (51.7- 62.1 wt%), FeO (3-9
wt%), MgO (2.5-5.6wt%) and CaO (3.8-7 wt%), moderate K2O (0.9-3.6 wt%), high Al2O3
(14.4-16.5 wt%) and Na2O (4.5-6.6 wt%) and low TiO2 (0.4-0.6 wt%). They have high
CaO+Na2O (8.6-12.9), high Sr (537-1563 ppm) and high LREE (Lan = 241-777; the subscript
“n” refers to chondrite normalized). These features combined with a low K2O/Na2O ratio
(0.1-0.8), low Y (11-30 ppm), low HREE (Ybn = 4-11) and high Sr/Y and La/Yb ratios (30-
119 and 67-102 respectively) indicate that the monzonite suite has geochemical
characteristics similar to adakites, sanukitoids and Closepet-type granite. Martin et al (2005)
suggested that less differentiated sanukitoids (SiO2<62 wt %) are similar to LSA and
Closepet-type granite. However, rocks that belong to the monzonite suite from the KIC have,
on average, higher Y, Yb and La/Yb than the LSA, higher #mg, Sr, Cr, Sr/Y and La/Yb than

Page 100
the Closepet-type granite, and higher La/Yb than the average sanukitoid. At the same time
the monzonite suite has lower TiO2, #mg, Sr, Cr, Ni and Sr/Y than the LSA, lower TiO2, Y,
Yb than the Closepet-type granite and lower Cr compared to the average sanukitoid.
Figure 4.3. Major elements variation diagrams for the KIC. The grey area shows the field of sanukitoids from Martin et al., (2010). The field of LSA (continuous line in Figure 5b) is from Castillo (2012) and the field of basaltic experimental melts is from Rollison (1997) and Martin et al., (2005).

Page 101
Figure 4.4. Chondrite normalized REE diagrams (a, c and e) and primitive mantle normalized trace element diagrams (b, d and f) for the KIC rocks. Also shown is the average of LSA, HSA, sanukitoids and Closepet-type granite from Martin et al., (2005).

Page 102
The chondrite normalized REE pattern (Fig. 4.4a) of monzonite suite rocks is
subparallel to the pattern from average LSA, sanukitoid and Closepet-type granite and shows
the strong LREE enrichment characteristic for these type of rocks. When plotted on a
primitive mantle normalized multielement diagram (Fig. 4.4b) the monzonite suite shows
strong negative anomalies for Nb and Ti, and moderate negative anomalies for Zr and Sr.
Their pattern is subparallel to that of the LSA, sanukitoids and Closepet-type granite. Notable
differences are the positive Sr anomaly for the LSA, the lack of a Sr anomaly in sanukitoids
and the lack of a negative Zr anomaly in LSA, sanukitoids and Closepet-type granite.
4.5.2. The Diorite suite
Rocks that belong to the diorite suite (Fig. 4.3; Table A7.2) have similar SiO2 (53-63
wt %) contents compared to monzonite suite rocks with slightly higher Al2O3 (14.4-17.1 wt
%), FeO (2.8-7.8 wt %), and TiO2 (0.3-0.7 wt %), and slightly lower Na2O (3.1-5.6 wt %),
K2O (1.2-3.2 wt %) and P2O5 (0.1-0.3 wt %). These values combined with K2O/Na2O ~ 0.54,
CaO+Na2O ~ 8, low Y (7.5-11.9 ppm), low HREE (Ybn = 3-7.4) and high Sr (572-1062
ppm), Cr (49-98.5 ppm) and LREE (Lan= 45-161) suggest that the diorite suite also shares
geochemical features with sanukitoid, adakite and Closepet-type granite. The average
composition of rocks from the diorite suite is similar to the average composition of HSA
except for lower SiO2 (58.6 vs 64.8), higher FeO (6.39 vs. 4.27), higher Cr (75 vs 41) and
higher Sr/Y (85 vs 56).
The chondrite normalized REE pattern (Fig. 4.4c) is similar to the average HSA and
subparallel to, but at lower concentrations than the average LSA, sanukitoid and Closepet-
type granite. On a primitive mantle normalized multi-element diagram (Fig. 4.4d) diorite
suite rocks show a pronounced negative Nb anomalies, moderately negative Ti anomalies and
moderately positive Sr anomalies, all of which are also typical for LSA. The overall pattern is

Page 103
similar to that of HSA, except for the positive Sr anomaly, and is subparallel to the average
pattern of LSA, sanukitoid and Closepet-type granite but at lower concentrations.
4.5.3. The Granodiorite suite
Four samples from the KIC were classified as granodiorites. Although the samples
were collected a few hundred meters apart their major and trace element composition is
almost identical (Fig. 4.3; Table A7.3). They have moderate SiO2 (av. 62.5 wt %), low FeO
(av. 4.9 wt %), MgO (av. 1.9 wt %), CaO (av. 3.7 wt %) and high K2O (av. 3.67 wt %) when
compared to rocks from the monzonite and the diorite suite. Their K2O/Na2O ratio is high
(av. 1.1), CaO+Na2O is low (av. 7.4), Y is low (av. 16.4), HREE are low (Ybn = 9.7), LREE
are moderately high (Lan= 100), and Sr and Cr content are relatively high (332 and 21 ppm
respectively). The lower Sr content (< 400 ppm), a Sr/Y ratio of less than 40 and a La/Yb
ratio of less than 20 suggest that the granodiorites cannot be considered to have an adakite-
like signature sensu Defant and Drummont (1990). However, as pointed out by Moyen
(2009), HSA can have a Sr/Y ratio as low as 20.
On a chondrite normalized REE diagram (Fig. 4.4e) the granodiorites display a
subparallel trend to that of the HSA but they plot at higher concentrations. They also show a
weak negative Eu anomaly indicative of plagioclase fractionation. On a primitive mantle
normalized multi-element diagram (Fig. 4.4f) their pattern is similar to that of the HSA,
except that they have a weak negative Sr anomaly while the HSA have a weak positive Sr
anomaly.

Page 104
4.6. PETROGENESIS OF THE KIC
4.6.1. Relative timing of emplacement
There is no age data available for the rocks forming the KIC. However, field evidence
may help constrain their relative timing of emplacement. The KIC occurs as a series of
intrusive bodies subparallel to the northwest-southeast trending regional fabric (Fig. 1.3). The
diorite and the monzonite suite rocks contain a weakly to well-developed foliation that is
subparallel to the axial planar surface of regional D3 folds (Sanislav et al., 2015, 2016)
indicating coeval and syntectonic emplacement. The granodiorite suite rocks are not foliated
suggesting that their emplacement postdates the emplacement of the diorite and the
monzonite suite. Felsic dykes similar in composition to the granodiorite suite outcrop in the
Kukuluma and Matandani deposits where they crosscut the folded sequence and are crosscut
by brittle ductile shear zones. Borg and Krogh (1999) obtained a single zircon age of 2699±9
Ma from a diorite dyke subparallel to the banded ironstones from the Geita Hill deposit
interpreted to indicate the minimum sedimentation age for the Upper Nyanzian sequence in
the Geita area. The deformed sequence is intruded and truncated by the 2660-2620 Ma high-
K granites (Sanislav et al., 2014). This constrains the timing of emplacement for the KIC
between 2700 Ma and 2660 Ma.
4.6.2. Depth and source of melts
Fractionated REE patterns (Fig. 4.4), high Sr/Y and La/Yb ratios (Figs. 4.5a and b),
and low Y and Yb contents suggest that garnet was present as a fractionating or residual
phase in the melt. However, high Sr/Y and La/Yb ratios can also reflect an enriched source
(Moyen, 2009), can be produced by the fractionation of amphibole, and by the delayed
crystallization of plagioclase in hydrous mafic magmas (Castillo, 2012), while fractionated
REE patterns may result from amphibole fractionation (e.g. Romick et al., 1992; Richards

Page 105
and Kerrich 2007). Continental crust has high Sr/Y and La/Yb ratios, therefore, melting of
continental crust and/or mixing with continental crust may impart high Sr/Y and La/Yb to
their derivative melts. The low SiO2 and moderate Mg# of the KIC rocks suggest a mafic to
ultramafic source and preclude any significant contribution from felsic rocks. In mafic melts
fractionation of amphibole may increase the La/Yb ratio of the residual melt, but the REE
pattern will not develop a strongly concave shape. As magma becomes more dacitic the
hornblende REE distribution coefficients increase and magmas develop concave REE
patterns and high La/Yb ratios (Romick et al., 1992). So the net effect of amphibole and
plagioclase fractionation is an increase in La/Yb and decrease in Dy/Yb (Moyen, 2009) while
garnet fractionation or partial melting with residual garnet will effectively increase the Dy/Yb
ratio in the melt (e.g. Macpherson et al., 2006; Davidson et al., 2007). Kelemen et al. (2003)
proposed that melts with a clear garnet (eclogite) signature should have Dy/Ybn ratios ≥ 1.5.
All samples of the monzonite suite and the majority of the diorite suite samples have Dy/Ybn
> 1.5 (Fig. 4.5c) suggesting that their high Sr/Y and La/Yb ratios are related to deep melting.
Eclogite melts reacting with the mantle (Kelemen et al., 2003) would effectively decrease
both the Dy/Yb and the La/Yb ratios (Fig. 4.5d) of the initial melt. Therefore, a lack of
eclogite melting signature in some of the samples (i.e. the granodiorite suite) does not
automatically rule out their derivation from eclogite/garnet-bearing melts. Moreover,
plagioclase crystallization can decrease Sr/Y ratios and increase Y concentrations. Thus, a
deep melting signature (based on this ratio) can be erased by large degrees of plagioclase
fractionation (e.g. Richard and Kerrich, 2007).
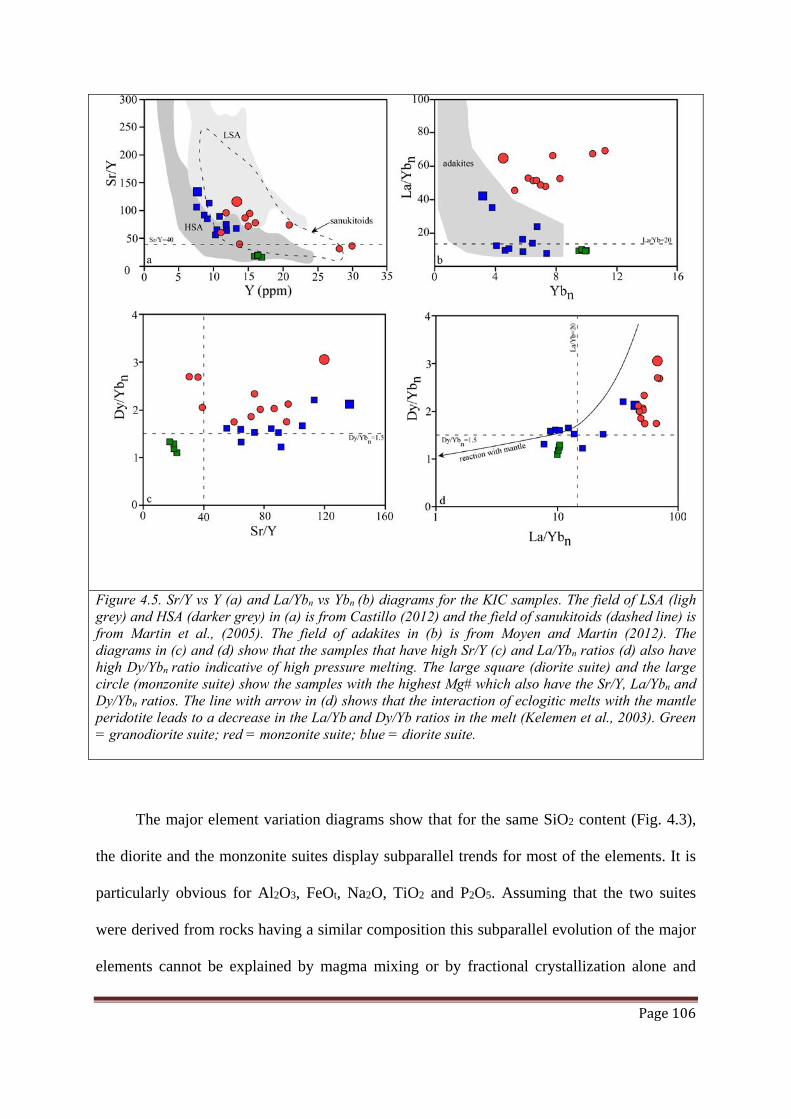
Page 106
Figure 4.5. Sr/Y vs Y (a) and La/Ybn vs Ybn (b) diagrams for the KIC samples. The field of LSA (ligh grey) and HSA (darker grey) in (a) is from Castillo (2012) and the field of sanukitoids (dashed line) is from Martin et al., (2005). The field of adakites in (b) is from Moyen and Martin (2012). The diagrams in (c) and (d) show that the samples that have high Sr/Y (c) and La/Ybn ratios (d) also have high Dy/Ybn ratio indicative of high pressure melting. The large square (diorite suite) and the large circle (monzonite suite) show the samples with the highest Mg# which also have the Sr/Y, La/Ybn and Dy/Ybn ratios. The line with arrow in (d) shows that the interaction of eclogitic melts with the mantle peridotite leads to a decrease in the La/Yb and Dy/Yb ratios in the melt (Kelemen et al., 2003). Green = granodiorite suite; red = monzonite suite; blue = diorite suite.
The major element variation diagrams show that for the same SiO2 content (Fig. 4.3),
the diorite and the monzonite suites display subparallel trends for most of the elements. It is
particularly obvious for Al2O3, FeOt, Na2O, TiO2 and P2O5. Assuming that the two suites
were derived from rocks having a similar composition this subparallel evolution of the major
elements cannot be explained by magma mixing or by fractional crystallization alone and

Page 107
requires melting at different pressures. For example, the Al2O3 content of melts becomes
depleted with increasing pressure at the same degree of partial melting (e.g. Hirose and
Kushiro, 1993). The negative correlation between SiO2 and Al2O3 (Fig. 4.3a) in the diorite
suite may indicate garnet fractionation or residual garnet, which will effectively reduce Al2O3
with increasing SiO2 in the melt (Macpherson et al., 2006; Davidson et al., 2007). The
positive correlation observed in the monzonite suite may indicate that garnet was consumed
during melting. The monzonite suite rocks tend to have higher Na2O at the same CaO (Fig.
4.6a) compared to the diorite suite rocks. This can also indicate a higher pressure during
melting as Na2O becomes more compatible in clinopyroxene at higher pressure (e.g. Kogiso
et al., 2004).
On chondrite normalized diagrams (Fig. 4.4) the REE patterns for the two suites are
subparallel, but the LREE elements are more fractionated for the monzonite suite compared
to the diorite suite. This is also illustrated by much higher La/Ybn and Dy/Ybn ratios (Fig.
4.5) suggesting that rocks belonging to the monzonite suite may represent deeper melts
compared to rocks from the diorite suite. Their primitive mantle normalized trace element
patterns (Fig. 4.4) are also sub-parallel, with the notable difference that the diorite suite rocks
have a positive Sr anomaly while the monzonite suite rocks have negative Sr and Zr
anomalies. The presence of a significant positive Sr anomaly in the diorite suite cannot be
explained by melting or crystallization unless plagioclase is involved. The lack of any
correlation between the Sr/Sr* and the MgO (Fig. 4.6b) excludes fractionation. Thus, a
plagioclase-rich component is required in the melt source region. Alternatively, interaction of
the melt with a plagioclase-rich region (assimilation) will produce a similar effect. However,
assimilation will result in a large decrease in FeOt and a large increase in Al2O3 with

Page 108
decreasing MgO (e.g. Peterson et al., 2014), which is not the case here. Therefore
assimilation can be excluded.
The only viable explanation is that the positive Sr anomaly is related to the source rock.
We propose that the diorite suite was formed by melting of garnet-bearing amphibolite and
plagioclase was completely transferred into the melt, leaving behind a Sr-depleted (relative to
Ce and Nd) residue of garnet-clinopyroxene-rutile eclogite. Further melting of the eclogite
with residual rutile produced the monzonite suite with negative Sr and Zr anomalies. Zr and
Hf have similar chemical properties and should not fractionate from each other in geological
processes; i.e. their ratio should be chondritic in all earth materials (e.g. Zr/Hf=~36.3; Sun
and McDounough, 1989). The diorite suite has an average Zr/Hf ratio of 36.8 (Fig. 4.6c),
which is similar to the chondritic value, but the monzonite suite has an average Zr/Hf ratio of
42.7 (Fig. 4.6c), which exceeds the chondritic value suggesting that these elements were
fractionated from each other.
Experimental data on amphibole/melt partition coefficients (e.g. Foley et al., 2002;
Tiepolo et al., 2007) have shown that amphibole can fractionate most HFSE causing negative
Ti and Nb anomalies, but only high-Mg amphibole can fractionate Zr from Hf. The ability of
garnet to fractionate Zr from Hf is dependent on pressure and MgO content (e.g. Green et al.,
2000; van Westrenen et al., 1999). The only mineral able to effectively fractionate HFSE
from each other is rutile (Stalder et al., 1998; Foley et al., 2000). If rutile was the residual
phase, the Nb/La and Zr/Sm ratios of the melt will correlate positively (Münker et al., 2004),
but if high-Mg amphibole was the residual phase the melt ratios of these elements will
correlate negatively. The monzonite suite shows a clear positive correlation between Nb/La
and Zr/Sm (Fig. 4.6d) implying residual rutile. However, the diorite suite shows no
correlation between these two ratios. Rutile cannot coexist with basaltic melts arising from

Page 109
the partial melting of peridotite (e.g. Ryerson and Watson, 1987; Woodhead et al., 1993;
Thirlwall et al., 1994) because it reacts with the olivine to form orthopyroxene and ilmenite.
Thus, the most likely source for the monzonite suite is rutile-bearing, garnet-clinopyroxene
eclogite.
Figure 4.6. Diagram (a) showing that at similar CaO values the monzonite suite has higher Na2O, which may reflect clinopyroxene in the source and melting at higher pressure. (b) The lack of correlation between the MgO and the Sr/Sr* suggest that the Sr anomaly is not the result of plagioclase fractionation. (c) Shows that Zr and Hf are fractionated from each other in the monzonite suite which we attribute to residual rutile. The effect of residual rutile is shown in (d) where the positive correlation between Nb/La and Zr/Sm ratios is indicative of residual rutile (Münker et al., 2004). The dashed lines in (c) and (d) shows the chondritic ratios for the respective elements while the arrows in (d) show the effect of residual rutile (positive correlation) vs the effect of residual high-Mg amphibole (negative correlation). Green = granodiorite suite; red = monzonite suite; blue = diorite suite.

Page 110
4.6.3. Melt - mantle interaction
The low SiO2 content, average Mg numbers, and relatively high Ni and Cr
concentrations indicate that the source rocks for the KIC must be mafic or ultramafic. Their
intermediate composition (SiO2 ≤ 62 wt %) suggests that fractionation played a minor role in
their petrogenesis and they are close to primary magmas. From this point of view the rocks of
the KIC resemble LSA and sanukitoid. However, there are some important differences.
Firstly, at the same SiO2 content the rocks of the KIC have much lower MgO compared to
LSA and sanukitoid (Fig. 4.3b). Secondly, the rocks of the KIC overlap the field of mafic
experimental melts (Figs 4.1a,b and f) while the LSA plot above it, and the sanukitoids
overlap it but only for low MgO concentrations. Because of their low SiO2, high Mg numbers
and high Cr and Ni concentrations, the LSA and the sanukitoids are commonly interpreted to
have formed by partial melting of mantle peridotite metasomatised by felsic melts (e.g.
Shirey and Hanson, 1984; Rapp et al., 1999; Martin et al., 2005). The rocks of the KIC have
lower Mg numbers (at the same SiO2 content) and much lower Cr, Ni, Sr, K, Rb and Nb
concentrations compared to the LSA and the sanukitoids (Fig. 4.7 and Tables A7.1-A7.3 ).
The difference between KIC rocks and the LSA is clearly illustrated in figure 4.7 where the
composition of KIC rocks overlaps the composition of the HSA, and closely resembles the
composition of experimental melts of basalt (Figs. 4.5a and b).
On the K vs Rb diagram (Fig. 4.7a) some of the LSA plot subparallel to the y-axis
suggesting high K/Rb ratios, which were interpreted to reflect Rb depletion by selective
melting of metasomatic amphibole in a peridotite source (e.g. Martin et al., 2005 and
references therein). However, in the absence of metasomatism, both peridotite and basaltic
melts result in K/Rb ratios much lower than average oceanic basalt (K/Rb=1071; Sun and
McDonough, 1989). High Sr contents can reflect deep melting at pressures above the

Page 111
plagioclase stability field, melting of a source that was already high in Sr, and/or melt
interaction with high-Sr geological materials (e.g. Moyen, 2009). Given the low SiO2 (≤ 62
wt %) of the KIC samples, their source rock must have been mafic or ultramafic.
Experimental melting of basalt produced liquids with up to 1000 ppm Sr (Fig. 4.7b),
but to achieve the high Sr observed in LSA, interaction with mantle peridotite is required
(e.g. Martin et al., 2005). Rocks from the diorite and granodiorite suites plot within the fields
of basaltic melts and HSA (Fig. 4.7b), while some of the samples from the monzonite suite
plot at higher Sr values (~1500 ppm) within the field of LSA, which may indicate some level
of interaction with mantle peridotite. However, if the source of the KIC rocks was mafic
lower crust (Sr = 348 ppm; Rudnick and Gao, 2003; Sr = 289 ppm; Hacker et al., 2015) rather
than an average oceanic basalt (Sr = 90 ppm; Sun and Mcdonough, 1989), than high Sr
values observed in the monzonite suite do not necessary require interaction with peridotite
mantle. Maybe the most useful ratio to use when separating melts derived from partial
melting of metasomatised mantle peridotite (LSA) and melts derived by partial melting of
mafic rocks (HSA) is the Cr/Ni ratio (Fig. 4.7c; Martin et al., 2005). The Cr/Ni ratio for KIC
samples (Fig. 4.7c) is clearly distinct from that of the LSA and overlaps the field of the HSA
suggesting a mafic source and minimum interaction with the mantle. The lack of correlation
between the Cr/Ni ratio and the Mg# (Fig. 4.7d) suggests that the Cr/Ni ratio of the KIC
samples is a source characteristic and not dependent on fractionation.

Page 112
Figure 4.7. Diagrams showing the compositional differences between LSA and HSA on K vs Rb (a), Sr vs CaO+Na2O (b) and Cr/Ni vs TiO2 (c) compiled by Martin et al., (2005). In (a) the continuous line shows the average K/Rb ratio in MORB (Sun and McDonough, 1989) while the arrows show the effect of metasomatism, which increases the ratio and the effect of partial melting, which decreases the ratio. In all three diagrams the KIC samples resemble more the HSA than the LSA and mostly overlap the field of experimental basaltic melts. The diagram in (d) show that there is no correlation between the Cr/Ni ratio and the Mg# indicating that the Cr/Ni ratio in the KIC samples is a source characteristic rather than the result of fractionation. Green = granodiorite suite; red = monzonite suite; blue = diorite suite.
4.6.4. Tectonic setting
The rocks of the KIC have major and trace element signatures similar to “adakitic’
rocks. Although the original description of adakites (e.g. Defant and Drummond, 1990)
specifically indicates that their geochemical signature is derived from partial melting of a
subducted slab, it is clear now that high Sr/Y and La/Yb ratios alone cannot be used to

Page 113
unequivocally indicate a subduction setting (e.g. Moyen, 2009; Castillo, 2012), and rocks
with “adakitic” signature can form in different tectonic settings as well. The KIC was
emplaced syn-tectonically along axial planar surfaces of upright regional folds suggesting a
period of crustal thickening. The age data from the northern half of the Tanzania Craton (e.g.
Kabete et al., 2012; Sanislav et al., 2014) suggest that growth of this part of the craton started
at ~ 2820 Ma with extensive tholeiitic mafic volcanism (e.g. Manya and Maboko, 2003,
2008; Cook et al., 2015) followed by a period dominated by the intrusion of diorite and TTG
and completed with the intrusion of the 2620-2660 Ma high-K granites (Sanislav et al.,
2014). Thus, the KIC was emplaced during the transition period from higher depth TTG
magmas to shallower depth high-K magmas.
Cook et al. (2015) proposed that the ~ 2820 Ma mafic volcanics (Kiziba Formation)
that form the base of the stratigraphic sequence (Lower Nyanzian) in the Sukumaland
Greenstone Belt were emplaced in an oceanic plateau like setting. However, it is unclear at
the moment whether or not the Upper Nyanzian sediments (intruded by the KIC) were
deposit on top of the Kiziba Formation or the two units were tectonically juxtaposed. In the
Geita region the contact between the two units is structural (Cook et al., 2015), but there
appears to be evidence that the Geita Greenstone Belt is underlain by the mafic rocks of the
Kiziba Formation suggesting that crustal growth in this part of Tanzania occurred by partial
melting and maturation of an oceanic plateau by lower crustal delamination/modification
(e.g. Vlaar et al., 1994; Zegers and van Keken, 2001; Bedard, 2006; Bedard et al., 2013;
Cook et al., 2015). Chiaradia (2015) showed that there is a strong correlation between the
Sr/Y and MgO of recent arc magmatism and the upper plate thickness indicating that source
processes (slab melting, slab melt-mantle interactions) do not play a major role in the
generation of high Sr/Y signatures. This implies that high Sr/Y occurs at lower MgO

Page 114
contents, suggesting that thicker crust favours magma evolution at deeper levels, thus Sr/Y
increases steadily with magmatic differentiation (Fig. 4.8a). In contrast, Archean rocks show
a sudden increase of the Sr/Y ratio between ~2.5 and ~0.5 wt% MgO (Fig. 4.8a) suggesting
that, as opposed to modern arc lava, source processes control the Sr/Y ratio of Archean rocks
(Chiaradia, 2015). Source processes may include partial melting in the garnet stability field of
subducted mafic crust or partial melting of delaminated lower mafic crust.
Figure 4.8. Diagram showing the variation of the Sr/Y ratio with MgO in modern arcs, Archean adakites and experimental melts from Chiaradia (2015). Chiaradia (2015) showed that in the modern arcs the Sr/Y ratio is a function of crustal thickness and the gradual increase of the Sr/Y ratio with increased crustal thickness also correlates with decreasing MgO suggesting that the Sr/Y ratio in modern arcs better reflects intracrustal processes than source characteristics. The sudden increase in Sr/Y ratios at low MgO in Archean adakites is similar to the data obtained for experimental basaltic melts and is consistent with partial melting of the lower mafic crust in the Archean. The KIC samples have Sr/Y and MgO values similar to the experimental basaltic melts and the Archean adakites suggesting lower mafic crust melting. The diagram in (b) shows that the diorite and the granodiorite suite have near MORB/chondritic Zr/Hf and Th/U ratios while the monzonite suite has Zr/Hf ratios similar to the mafic end member (mlc) of the lower crust (Hacker et al, 2015) and the Th/U ratio varies between the mafic end member of the lower crust and the lower continental crust values of Rudnick and Gao (2003). However, the Th/U ratios in all samples are near chondritic suggesting that Th and U were not fractionated from each other as required by a subduction environment. Green = granodiorite suite; red = monzonite suite; blue = diorite suite.
To investigate a possible subduction component in the generation of the KIC rocks we
use Th/U vs Zr/Hf ratios. Given the highly incompatible behaviour of Th and U, normal

Page 115
magmatic processes cannot significantly fractionate these elements from each other. U and
Th are easily fractionated during surface processes because of the higher mobility of U during
weathering and under oxidizing conditions. Seafloor alteration and addition of slab fluids will
lower the Th/U ratio while dehydration and addition of sediment melts will increase the Th/U
ratio (e.g. Bebout, 2007). Figure 4.8b shows that the diorite and the granodiorite suites have
almost MORB-like Th/U and Zr/Hf ratios, thus precluding a subduction component. The
monzonite suite has higher Zr/Hf ratios due to residual rutile (see above) and the Th/U ratio
varies between the values for the lower mafic crust end-member of Hacker et al. (2015) and
the values for the average lower continental crust of Rudnick and Gao (2003). Overall, the
KIC shows a very narrow variation in Th/U ratios, which is more consistent with partial
melting of the mafic lower crust than partial melting of a subducted oceanic crust.
4.7. CONCLUSIONS In general Archean igneous rocks with adakite-like signature were interpreted to
indicate a subduction setting. We have shown that although the rocks of the KIC can be
easily classified as “adakites”, detail screening of their composition revealed important
differences. Given the recognition that rocks with adakite-like signature can form in a variety
of tectonic settings from non-unique petrogenetic processes, requires a re-examination of the
existing Archean datasets. Higher Archean geothermal gradients would have favoured the
development of thicker lithospheric roots and partial to complete eclogitization of the mafic
lower crust; the removal of the eclogitised crust would favour partial melting of the thickened
lower crust to generate adakite-like rocks. This scenario is similar to the interpretation of the
post-tectonic adakite-like rocks from the Tibetan Plateau with the main difference that the
KIC is syn-tectonic. Alternatively, KIC formed by partial melting of eclogitised mafic lower
crust of an Archean oceanic plateau.

Page 116
CHAPTER 5
ZIRCON U-Pb AGES AND Hf ISOTOPE DATA FROM THE
KUKULUMA TERRAIN OF THE GEITA GREENSTONE
BELT, TANZANIA CRATON: IMPLICATIONS FOR THE
DEFORMATION HISTORY, SUPRACRUSTAL
STRATIGRAPHY, CRUSTAL GROWTH AND TIMING OF
GOLD MINERALIZATION
5.1. SUMMARY
The Geita Greenstone Belt is a late Archean greenstone belt located in the Tanzania
Craton, trends approximately east-west and can be subdivided into three northwest-southeast
trending terrains: the Kukuluma Terrain to the east, the Central Terrain in the middle and the
Nyamullilima Terrain in the west. The Kukuluma Terrain forms a northwest-southeast
trending zone of complexly deformed sediments, intruded by the Kukuluma Intrusive
Complex which contains an early-syntectonic diorite-monzonite suite and a late-syntectonic
granodiorite suite. Three gold deposits (Matandani, Kukuluma and Area 3West) are found
along the contact between the Kukuluma Intrusive Complex and the sediments. A crystal tuff
layer from the Kukuluma deposits returned an age of 2717±12 Ma which can be used to
constrain maximum sedimentation age in the area. Two granodiorite dykes from the same

Page 117
deposit and a small granodiorite intrusion found along a road cut yielded zircon ages of
2667±17 Ma, 2661±16 Ma and 2663±11 Ma respectively. One mineralized granodiorite dyke
from the Matandani deposit has an age of 2651±14 Ma which can be used to constrain the
maximum age of the gold mineralization in the area.
The 2717 Ma crystal tuff has zircon grains with suprachondritic 176Hf/177Hf ratios
(0.28108 to 0.28111 at 2717 Ma) and positive (+1.6 to +2.6) εHf values indicating derivation
from juvenile mafic crust. Two of the granodiorite samples have suprachondritic 176Hf/177Hf
ratios (avg. 0.28106 and 0.28107 at 2663 and 2651 Ma respectively) and nearly chondritic
εHf values (avg. -0.5 and -0.3 respectively). The other two granodiorite samples have
chondritic 176Hf/177Hf ratios (avg. 0.28104 and 0.28103 at 2667 and 2661 Ma respectively)
and slightly negative εHf values (avg. -1.1 and -1.5 respectively). The new zircon age and
isotope data suggest that the igneous activity in the Kukuluma Terrain involves a significant
juvenile component and occurred within the 2720 to 2620 Ma period which is the main
period of crustal growth in the northern half of the Tanzania Craton.
5.2. INTRODUCTION
The architecture of many late Archean cratons such as the Zimbabwe Craton (Kusky,
1998; Jelsma and Dirks, 2002), the Yilgarn Craton (Blewet et al., 2010; Czarnota et al.,
2010), the Dharwar Craton (Chadwick et al., 2000; Manikyamba and Kerrich, 2012) or the
Superior Province (Percival et al., 2001; Bèdard et al., 2013) is commonly described in terms
of a series of terranes assembled along major crustal-scale shear zones. In general, the
assembly contains a core of older terrane fragments against which, younger terranes have
been juxtaposed in a linear manner, commonly interpreted to indicate terrane accretion

Page 118
analogous to modern day plate tectonic processes (e.g. Zeh et al., 2009; Blewet et al., 2010;
Kabete et al., 2012a). Alternative tectonic scenarios include accretion of basaltic plateaus
against proto-cratons along dominantly oblique strike-slip shear zones (Bedard et al., 2013)
or inversion of intracontinental rift systems sited above mantle plumes (Hayman et al., 2015).
The tectonic architecture of the Tanzania Craton was initially (e.g. Harpum, 1970;
Gabert, 1990; Kuehn et al, 1990) interpreted in terms of a basement unit, the Dodoman
Basement Complex, on top of which younger units (the greenstone belts), such as the
Nyanzian and the Kavirondian, were thrusted in a process comparable to continental arc
tectonics. This interpretation was based mainly on the degree of tectonism described from the
above units. The Dodoman Basement Complex comprises mainly high-grade metamorphic
rocks including gneiss, migmatite and granulite that formed under mid- to lower crustal
conditions, while the Nyanzian and Kavirondian units comprise mainly lower amphibolite to
greenschist facies metavolcanics and metasediments.
Borg and Shackleton (1997) proposed that the geology of the Nyanzian and the
Kavirondian units that occur in the northern half of the Tanzania Craton is distinct from the
gneisses and granulites of the Dodoman Basement Complex that occur to the south and must
be treated as a separate tectonic granite-greenstone domain. They subdivided the supra-
crustal units in this part of the craton into six individual greenstone belts (Fig. 1.1) of which
the Sukumaland Greenstone Belt is the largest. This interpretation was later confirmed when
the first U-Pb zircon dating (Borg and Krogh, 1999) was performed on different units from
the Sukumaland Greenstone Belt and it became evident that the gneisses and the migmatites,
previously considered basement units, were in part younger that the overlying volcanics and
sediments.
Subsequent, more extensive U-Pb zircon dating (Manya et al., 2006; Chamberlain and
Tosdal, 2007; Mtoro et al., 2009; Kabete et al., 2012b; Sanislav et al., 2014) revealed that in

Page 119
the northern half of the Tanzania Craton it is common for the ‘basement’ the gneiss, granite
intrusions and felsic volcanics incorporated in the greenstone sequence to yield ages that are
younger than or similar to the ages obtained from the mafic metavolcanics (dated at ~ 2820
Ma; Manya and Maboko, 2003; Manya and Maboko, 2008; Cook et al., 2015), attributed to
the lower Nyanzian units. Following these new findings, the greenstone belts were
interpreted to have formed in arc-like settings (e.g Manya and Maboko, 2003; Manya and
Maboko, 2008; Mtoro et al., 2009; Mshiu and Maboko, 2012), to represent lateral accretion
of exotic terranes (Kabete et al., 2012a) or to be reminiscent of oceanic plateaus (Cook et al.,
2015). Thus, different parts of the northern half of the Tanzania Craton record specific
geological histories. Manya et al. (2006) proposed that is unlikely that all the greenstone belts
in the Tanzania Craton belong to the Nyanzian Supergroup and the geology of each
greenstone belt should be treated individually.
Moreover, each of the six greenstone belts (Fig. 1.1) shows a highly fragmented map
pattern. For example, the SGB is made of at least 15 individual greenstone fragments. It is
unclear how much of this fragmentation is tectonic in nature, related to the intrusion of
plutons or just a consequence of poor outcrop exposure. The lack of detailed studies on most
of the greenstone fragments makes it difficult to assess whether they share a common
geological history or not. The Geita Greenstone Belt (GGB; Fig. 1.2; Sanislav et al., 2014) is
one of the largest and the best studied greenstone fragment that occurs within the SGB. It
contains stratigraphic elements that can be related to the original description (e.g. Stockley,
1936; Quennel et al., 1956; Harpum, 1970) of the Nyanzian and the Kavirondian successions;
a lower mafic unit, overlain by intercalations of shales, ironstones, sandstones, siltstones,
mudstones and volcanoclastics which are unconformably overlain by quartzitic
conglomerates and grits (Sanislav et al., 2015; Cook et al., 2015). In this contribution, we
present U-Pb zircon ages and Hf isotope data from tuffaceous sediments, granodiorite dykes

Page 120
and intrusions from the GGB and discuss their significance in terms of field relationships,
timing of gold mineralization, implications for the stratigraphic relationships and for the
crustal growth in the Tanzania Craton. For background to the general geology of the
Tanzania Craton and geological setting of the Geita Greenstone Belt I refer to the
introduction in Chapter 1.
5.3. PREVIOUS GEOCHRONOLOGY IN THE SUKUMALAND GREENSTONE
BELT
The oldest reported zircon ages from the Sukumaland Greenstone Belt (SGB) are
from pyroclastic tuffs and range in age from 2821 Ma to 2770 Ma (Table 1.1; Borg and
Krogh, 1999; Chamberlain and Tosdal, 2007). The oldest zircon age of 2821±30 Ma comes
from an altered ash layer of intermediate composition derived from the Tulawaka gold
deposit (Chamberlain and Tosdal, 2007), which is located approximately 50 km southwest of
Geita. From the southern part of the SGB, near Kahama, Borg and Krogh (1999) reported
zircon ages of 2808±3 Ma and 2780±Ma from pyroclastic tuffs of rhyolitic composition.
Similar zircon ages of 2779±13 Ma and 2770±9 Ma (Chamberlain and Tosdal, 2007) from
pyroclastic tuffs of rhyolitic composition were reported from the Nyanzaga area about 100
km east of Geita. From the Nyamullima Terrain in the western part of the GGB a tuff layer
interbedded with banded ironstones was dated at 2771±15 Ma (Chamberlain and Tosdal.,
2007). The next oldest set of zircon ages was obtained from suites of intrusive rocks of
dioritic and tonalitic composition that range in age between 2765 Ma and 2738 Ma
(Chamberlain and Tosdal, 2007). The oldest age at 2765±25 Ma comes from a tonalite
intrusion near Kahama. The remaining ages come mostly from the Lubando and Imweru
areas, west of Geita, where diorite to gabbro-diorite intrusions that were emplaced into the

Page 121
mafic volcanics yield ages ranging between 2758 and 2743 Ma. From the GGB two identical
tonalite ages of ~ 2738 Ma are reported by Chamberlain and Tosdal (2007). One of the
tonalites intruded the Kiziba Formation in the southern part of the greenstone belt while the
other one intruded into the Nyamullilima Terrain. Field observations indicate that the former
is strongly deformed; the latter tonalite intrusion could not be identified in the field.
From Bulyanhulu a pyroclastic felsic tuff was dated at 2719±16 Ma and interpreted to
indicate a maximum age for volcanic activity in the area while a felsic porphyry dyke dated at
2710±10 Ma was interpreted to indicate the minimum age for the volcanism (Chamberlain
and Tosdal, 2007). At Geita Hill a monzodiorite that cuts the ironstones at a low angle and
locally follows the stratigraphy was dated at 2699±9 Ma and interpreted to constrain the age
of deposition of the ironstones to before 2700 Ma (Borg and Krogh, 1999). From northwest
of the Nyankanga deposit, chloritic and feldspathic sandstones contain detrital zircons which,
returned homogenous ages of 2702±8 Ma, 2699±8 Ma and 2687±16 Ma (Chamberlain and
Tosdal, 2007). From the Nyankanga deposit a diorite dyke was dated at 2698±14 Ma and two
felsic porphyries and a lamprophyre yielded ages between 2693 and 2686 Ma (Chamberlain
and Tosdal, 2007). The felsic porphyries were interpreted to represent a minimum age for
volcanic activity in the area, while the mineralized lamprophyre dyke was interpreted to
provide a maximum age constrain on the mineralization. The age of mineralisation has been
further constrained by (Borg and Krogh, 1999) who obtained a zircon age of 2644±3 Ma for a
deformed and mineralized lamprophyre dyke from the Geita Hill deposit. This age has been
interpreted to provide a maximum age for the gold mineralization.
From the southern margin of the SGB, Borg and Krogh (1999) report two identical
migmatitic gneiss ages of 2680 ± 3 Ma, which, showed that the gneisses that outcrop in the
region do not belong to the Dodoman Supergroup and cannot form the basement to the
greenstone sequence. From the same area, near Kahama, Chamberlain and Tosdal (2007)

Page 122
reported a consistent granitoid age of 2680 ± 9 Ma.
Two felsic porphyry dykes that intruded near Imweru and Biharamulo, west of the
GGB, were dated at 2670±21 Ma and 2667±14 Ma respectively, and were interpreted to
provide an estimate for the minimum age of volcanism in the area (Chamberlain and Tosdal,
2007). From S of the GGB, near Samena Hill, and from the granites that crop out north of the
GGB, Chamberlain and Tosdal (2007) reported two identical ages of 2666±8 Ma. Sanislav et
al., (2014) reported a series of ages ranging from 2661±14 Ma to 2617±11 Ma from the high-
K granites that crop out in the northern part of the GGB. Similar ages with the high-K
granites, were reported from across the SGB, by Chamberlain and Tosdal (2007), including
from the Nyankanga deposits (2653±35 Ma), the Kahama area (2656±11 Ma), Kasubuya
(2653±10 Ma) and Bukoli (2646±14 Ma). A flow banded rhyolite from near Bulyanhulu
dates at 2654±15 Ma and was interpreted to indicate an Upper Nyanzian sedimentation age.
5.4. NEW ZIRCON AGES FROM THE KUKULUMA TERRAIN
5.4.1. Samples and field relationships
Five samples were dated by LA-ICP-MS at the Advance Analytical Centre at James
Cook University. Samples were collected from volcanoclastic sediments, intrusive units
belonging to the Kukuluma Intrusive Complex (KIC) and from late-intrusive, feldspar
porphyry dykes and intrusions in and around Matandani and Kukuluma pits (Fig. 5.1). The
samples from the KIC contained no zircons or had a very low zircon yield and could not be
dated. From five samples including a crystal tuff, three felsic porphyries and a felsic intrusion
enough zircon grains were separated to obtain an age.

Page 123
Figure 5.1. Geological map of the Kukuluma Terrain showing samples location.
5.4.1.1. Sample KK51 – crystal tuff
This sample was collected from the haul road that descends into Kukuluma pit, along
the southern wall of the pit (Fig. 5.1), where a succession of well-bedded sediments
intercalated with volcanoclastics is exposed. Sample KK51 was collected from a layer of
crystal tuff interbedded with sandstone, siltstone and mudstone (Fig. 5.2). The sequence on

Page 124
this side of the pit is dominated by tight D3 folds with sub-vertical axial planes and shallowly
plunging fold axes (for more detail see Chapter 3). This part of the stratigraphy is interpreted
to represent the upper part of the Nyanzian. The crystal tuff layer is approximately 5 to 7 cm
thick and contains a high amount of visible feldspar crystals that are up to 2 millimetres in
diameter and are embedded in a fine-grained matrix. The feldspar phenocrysts and the matrix
have been completely altered to sericite. Small quartz grains (~20%) are visible under the
hand lens. No lithic fragments were identified and the layer appears to be compositionally
homogenous.
5.4.2.2. Sample KK01 – granodiorite dyke.
A dyke of granodioritic composition (see Chapter 4) is approximately 1.5 metres (Fig.
5.2) wide and is well exposed in the western part of Kukuluma pit (Fig. 5.1). The dyke trends
approximately northwest-southeast and cuts across D2-D3 fold interference patterns that are
well developed in this part of the pit. The dyke also transects the hydrothermal breccia zones
that developed along the margins of intrusive diorite-monzonite bodies belonging to the
Kukuluma Intrusive Complex (KIC) and intrusions of the KIC itself. The dyke is exposed
along the entire height of the western wall of Kukuluma pit and appears to be gently folded
by open recumbent folds of D5 origin. Although the relationship with D4 folding is unclear;
the relative age of emplacement of this dyke occurred at some point between D3 and D5. The
dyke has been intersected in drill cores where its composition could be better assessed. It is
composed of 40% quartz, 35% plagioclase, 20% k-feldspar and ~ 5% mafics (mostly
hornblende), and has been classified as granodiorite. There is a visible decrease in grain size
at the contact with the brecciated ironstones indicating chilled margins.

Page 125
Figure 5.2. Photographs showing field relationships fro samples KK51(a) KK01 (b) KK03 (c).The crystal tuff layer (a) is interlayered with well-bedded immature sandstone, siltstone and mudstone.The dikes are weathered but the massive igneous texture is well preserved. These dikes cut across folded and brecciated ironstones.
5.4.2.3. Sample KK03 – granodiorite dyke.
A second dyke of granodioritic composition is well exposed along the W wall of

Page 126
Kukuluma pit (Fig. 5.1). It is about 1 metre thick (Fig. 5.2c) and trends approximately
northwest-southeast. The dyke is porphyritic and highly weathered, but altered feldspar and
mafic phenocrysts (hornblende) can still be identified. In fresh drill core its mineralogical
composition is near-identical to KK01 above, but it lacks chilled margins. The dyke transects
D3 folds, hydrothermal breccia zones and the KIC, and the dyke has been displaced by D6
shear zones that run along the margins of the KIC. It’s relative time of emplacement is
therefore similar to KK01.
5.4.2.4. Sample KK04 –granodiorite intrusion.
A small granodiorite intrusion (Fig. 5.1) crops out in a road cutting along the
Kukuluma access road (Fig. 5.3). In this outcrop, well layered sediments intruded by diorite
dykes and sills are affected by D3 and D4 folds. A penetrative S3 cleavage is preserved in
mudstones and the diorite sills. The granodiorite intrusion is massive and cuts across the
layering and the quartz-diorite dykes, but it was affected by a D6 shear zone which developed
along its contact; i.e. the timing of emplacement of this granodiorite body is similar to the
timing of the granodiorite dykes described above. The granodiorite is coarse grained,
equigranular and is composed of quartz (30-40%), plagioclase (30-40%), k-feldspar (20-30%)
and mafics (less than 10%).
5.4.2.5. Sample MT20 – granodiorite dyke.
A granodiorite dyke cuts across the Matandani deposit along a north-south trend, and
the dyke can be traced outside the pit to the Kukuluma access road 300m to the south (Fig.
5.1). The dyke is up to 3 metres thick (Fig. 5.4), grey in colour and partly weathered. It
contains large plagioclase phenocrysts (~40%), small quartz grains (~30%), altered fine

Page 127
grained k-feldspar (~25%) and a small amount of altered biotite (~5 %). In fresh samples
collected from drill core minor sulfide and iron oxide can also be seen.
Figure 5.3. Photograph and outcrop sketch showing the field relationships for sample KK04.
In the pit the dyke cuts across the D2-D3 interference fold pattern and has not been
affected by D4 and D5 folding. It cuts the diorite – monzonite suite as part of the KIC and the
tectonic breccias found on in the SW corner of the pit. Along the Eastern diorite-Ironstone
contact, both the dyke and the ironstone ± other sediments are locally (~3m thick zone of
shearing) overprinted by the D6 shear zone (Figs A4.1a and 1.3b). Within this sheared zone,
the groundmass and the plagioclase phenocrysts display are clear preferential orientation

Page 128
parallel to the orientation of the D6-shear zone. However, a number of the fractures are
identified within the ironstones and few in the granodiriote dike, which attributed to D7
reactivations along the D6 shear zone. These fractures did not accommodate visible
displacement of the dyke, but this sheared part of the dyke does contain low grade
mineralization. The relative timing of emplacement of this dyke therefore occurred prior to
D6 and D7.
Figure 5.4. Photograph showing the field relationship for sample MT20. This dyke cuts across tight D2-D3 folds, the KIC and overprinted by the D6 shear zones.
5.5. RESULTS
5.5.1. Geochronology
5.5.1.1. Sample KK51-crystal tuff
Nine of the zircon grains analysed from sample KK-51 yielded analyses with 10% or
less discordance (Table 5.1). The zircon grains are euhedral in shape, luminescent and have

Page 129
concentric zoning without any evidence of relict cores or rim overgrowths (Fig. 5.5). All
zircon grains from this sample show similar cathodoluminescence images suggesting a
population derived from the same volcanic source.
Figure 5.5. Cathodoluminescence images of zircon grains from sample KK51 (a), KK01 (b), KK03 (c), KK04 (d) and MT20 (e).

Page 130
Analysis 238U/206Pb Error (1σ)
207Pb/206Pb Error (1σ) 207Pb/235U Error (1σ)
206Pb/238U Error (1σ) Rho Age (Ma) 207Pb/206Pb Error (1σ) Age (Ma) 206Pb/238U Error (1σ) Discordance (%)
KK51-01 1.824 0.018 0.186 0.002 14.042 0.149 0.548 0.005 0.94 2705 18 2818 23 -4
KK51-02 2.168 0.022 0.187 0.002 11.876 0.125 0.461 0.005 0.95 2713 18 2445 20 10
KK51-03 1.863 0.019 0.187 0.002 13.818 0.146 0.537 0.005 0.94 2713 18 2770 22 -2
KK51-04 1.886 0.019 0.186 0.002 13.594 0.144 0.53 0.005 0.94 2707 18 2743 22 -1
KK51-05 2.166 0.021 0.187 0.002 11.915 0.125 0.462 0.004 0.93 2718 18 2447 20 10
KK51-09 2.146 0.021 0.188 0.002 12.063 0.125 0.466 0.004 0.93 2723 18 2466 20 9
KK51-06 2.089 0.021 0.187 0.002 12.371 0.13 0.479 0.005 0.94 2720 18 2522 21 7
KK51-07 2.069 0.02 0.19 0.002 12.656 0.133 0.483 0.005 0.92 2742 18 2542 20 7
KK51-08 1.837 0.018 0.187 0.002 14.023 0.145 0.545 0.005 0.94 2714 18 2802 22 -3
Table 5.1. Analytical results and calculated ages for sample KK51.

Page 131
Figure 5.6. Diagrams showing the 207Pb/206Pb weighted average age (a) and the concordia age (b) for sample KK51.
The 207Pb/206Pb ages vary from 2742±18 Ma to 2705±18 Ma with a weighted average age of
2717±12 Ma (Fig. 5.6a). These ages are similar within error and can be considered to belong
to the same age population. The upper concordia age for these zircon grains is 2714±8 Ma
(Fig. 5.6b) which is similar within error to the weighted average 207Pb/206Pb age.
5.5.1.2. Sample KK01-granodiorite dyke
This sample contained many zircon grains of different shapes and sizes, and only nine
zircon grains returned nearly concordant analyses (≤6% discordance; Table 5.2). The zircon
grains have low luminescence and some grains contain relict cores with a rim overgrowth

Page 132
(Fig. 5.5). In most cases the relict cores have very low luminescence and are surrounded by a
thin line with high luminescence which separates the cores from a rim overgrowth. The relict
cores contain high common lead and no reliable age could be calculated while the rim
overgrowths were in most situations too thin to be analysed by laser ablation except one grain
that contained a rim overgrowth large enough to be analysed (Fig. 5.5).
Figure 5.7. Diagrams showing the 207Pb/206Pb weighted average age (a) and the concordia age (b) for sample KK01.

Page 133
This rim overgrowth returned a nearly concordant analysis with a 207Pb/206Pb age of 2663±19
Ma. The remaining analyses were performed on zircon grains with low luminescence having
a faint concentric zoning with no evidence of relict cores or rim overgrowths. Their
207Pb/206Pb ages vary between 2684±21 Ma and 2649±18 Ma. The 207Pb/206Pb weighted
average age for all nine analyses is 2661±16 Ma (Fig. 5.7a) which is similar within error to
the concordia age of 2667±14 Ma (Fig. 5.7b).
Analysis
238U/206Pb
Error (1σ)
207Pb/206Pb
Error (1σ)
207Pb/235U
Error (1σ)
206Pb/238U
Error (1σ)
Rho
Age (Ma) 207Pb/206Pb
Error (1σ)
Age (Ma) 206Pb/238U
Error (1σ)
Discordance (%)
KK01-01 1.960 0.028 0.181 0.004 12.738 0.308 0.510 0.007 0.59 2664 38 2658 31 0
KK01-02 2.102 0.028 0.181 0.002 11.886 0.179 0.476 0.006 0.88 2664 21 2509 28 6
KK01-03 1.977 0.030 0.180 0.003 12.588 0.261 0.506 0.008 0.72 2657 30 2639 32 1
KK01-04 2.112 0.033 0.180 0.006 11.738 0.361 0.473 0.007 0.51 2651 50 2499 32 6
KK01-05 1.972 0.026 0.180 0.002 12.576 0.196 0.507 0.007 0.85 2651 22 2645 29 0
KK01-06 1.969 0.025 0.181 0.002 12.678 0.173 0.508 0.006 0.93 2663 19 2648 27 1
KK01-07 1.935 0.024 0.183 0.002 13.064 0.187 0.517 0.006 0.87 2684 21 2686 27 0
KK01-08 2.073 0.026 0.180 0.002 11.941 0.159 0.482 0.006 0.95 2649 18 2538 26 4
KK01-09 1.976 0.026 0.180 0.003 12.554 0.232 0.506 0.007 0.71 2653 29 2640 29 1
Table 5.2. Table showing the analytical results and the calculated ages for sample KK01 5.5.1.3. Sample KK03-granodiorite dyke
This sample had a low zircon yield, with only ten zircon grains separated. However,
six grains returned nearly concordant (≤6% discordance; Table 5.3) analyses so that age
calculations could be performed. The zircon grains vary in shape from short and stubby to
elongated grains, and they have low luminescence with a vague concentric zoning (Fig. 5.5).
No relict cores or rim overgrowths were observed. The 207Pb/206Pb age of the nearly
concordant zircon grains varies between 2687±19 Ma and 2656±20 Ma with an average
weighted age of 2667±17 Ma (Fig. 5.8a). The concordia upper intercept age for this sample is
2658±15 Ma (Fig. 5.8b).

Page 134
Figure 5.8. Diagrams showing the 207Pb/206Pb weighted average age (a) and the concordia age (b) for sample KK03.
Analysis
238U/206Pb
Error (1σ)
207Pb/206Pb
Error (1σ)
207Pb/235U
Error (1σ)
206Pb/238U
Error (1σ)
Rho
Age (Ma) 207Pb/206Pb
Error (1σ)
Age (Ma) 206Pb/238U
Error (1σ)
Discordance (%)
KK03-01 1.998 0.026 0.180 0.002 12.444 0.178 0.500 0.006 0.90 2656 20 2616 27 2
KK03-02 2.105 0.026 0.182 0.002 11.896 0.159 0.475 0.006 0.93 2668 19 2506 26 6
KK03-03 2.052 0.025 0.181 0.002 12.179 0.164 0.487 0.006 0.92 2665 19 2559 26 4
KK03-04 1.980 0.024 0.181 0.002 12.593 0.166 0.505 0.006 0.93 2661 19 2636 27 1
KK03-05 2.040 0.025 0.184 0.002 12.421 0.163 0.490 0.006 0.92 2687 19 2572 25 4
KK03-06 2.036 0.032 0.181 0.005 12.232 0.320 0.491 0.008 0.60 2658 43 2576 33 3
Table 5.3. Table showing the analytical results and the calculated ages for sample KK03.
5.5.1.4. Sample KK04-granodiorite intrusion
Sample KK04 had a very good zircon yield so that a large number of zircon grains
could be analysed (Table 5.4).

Page 135
Analysis
238U/206Pb
Error (1σ)
207Pb/206Pb
Error (1σ)
207Pb/235U
Error (1σ)
206Pb/238U
Error (1σ)
Rho
Age (Ma) 207Pb/206Pb
Error (1σ)
Age (Ma) 206Pb/238U
Error (1σ)
Discordance (%)
KK04-01 1.926 0.023 0.179 0.002 12.843 0.168 0.519 0.006 0.926 2648 19 2696 27 -2
KK04-02 1.928 0.023 0.182 0.002 13.015 0.169 0.519 0.006 0.935 2671 19 2694 27 -1
KK04-03 1.997 0.024 0.180 0.002 12.424 0.163 0.501 0.006 0.927 2653 19 2617 26 1
KK04-04 1.959 0.023 0.181 0.002 12.768 0.165 0.510 0.006 0.920 2666 19 2658 26 0
KK04-05 2.152 0.031 0.180 0.005 11.495 0.295 0.465 0.007 0.553 2651 42 2460 29 7
KK04-06 1.948 0.026 0.182 0.002 12.878 0.193 0.513 0.007 0.880 2672 21 2671 29 0
KK04-07 1.941 0.024 0.182 0.002 12.895 0.170 0.515 0.006 0.922 2667 19 2679 27 0
KK04-08 1.954 0.025 0.181 0.003 12.774 0.197 0.512 0.007 0.835 2664 23 2664 28 0
KK04-09 1.956 0.025 0.181 0.002 12.739 0.193 0.511 0.007 0.850 2661 22 2662 28 0
KK04-10 1.984 0.025 0.181 0.003 12.567 0.194 0.504 0.006 0.801 2661 24 2631 27 1
KK04-11 2.095 0.025 0.181 0.002 11.918 0.158 0.477 0.006 0.899 2662 20 2516 25 5
KK04-12 2.083 0.027 0.181 0.003 11.971 0.224 0.480 0.006 0.683 2661 30 2528 27 5
KK04-13 2.130 0.029 0.181 0.004 11.701 0.272 0.469 0.006 0.589 2659 38 2481 28 7
KK04-14 2.039 0.025 0.182 0.002 12.270 0.160 0.490 0.006 0.927 2667 19 2572 26 4
KK04-15 2.031 0.027 0.181 0.003 12.284 0.197 0.492 0.006 0.823 2663 24 2581 28 3
KK04-16 2.211 0.032 0.182 0.003 11.319 0.213 0.452 0.007 0.774 2668 28 2405 29 10
Table 5.4. Table showing the analytical results and the calculated ages for sample KK04.
The zircon grains are euhedral to subhedral and vary in shape from elongated needle-
like grains to short and stubby grains. They are low luminescence with a vague concentric
zoning (Fig. 5.5). A few grains contain small relict cores with very low luminescence
surrounded by an overgrowth rim. These cores were too small to be analysed. One rim
overgrowth analyses returned a 207Pb/206Pb age of 2662±20 Ma. The remaining analyses
returned 207Pb/206Pb ages between 2671±21 Ma and 2648±19 Ma with a weighted average
age of 2663±11 Ma (Fig. 5.9a) and an almost identical upper concordia intercept age of
2662±9 Ma (Fig. 5.9b).

Page 136
Figure 5.9. Diagrams showing the 207Pb/206Pb weighted average age (a) and the concordia age (b) for sample KK04.
5.5.1.5. Sample MT20-granodiorite dyke
Seven of the zircon grains analysed from these samples returned nearly concordant
ages (≤5% discordance; Table 5.5). The zircon grains are euhedral with a prismatic shape
and medium luminescence. Most zircon grains show a well-developed concentric zoning but
several grains have more complex luminescence patterns (Fig. 5.5). Although, a few zircon
grains contained evidence of relict cores they were too small to be dated. The 207Pb/206Pb ages
of the zircon grains vary between 2660±19 Ma and 2632±20 Ma with a weighted average age

Page 137
of 2651±14 Ma (Fig. 5.10a) and an almost identical upper concordia age of 2650±8 Ma (Fig.
5.10b).
Analysis
238U/206Pb
Error (1σ)
207Pb/206Pb
Error (1σ)
207Pb/235U
Error (1σ)
206Pb/238U
Error (1σ)
Rho
Age (Ma) 207Pb/206Pb
Error (1σ)
Age (Ma) 206Pb/238U
Error (1σ)
Discordance (%)
MT20-01 1.845 0.018 0.180 0.002 13.454 0.158 0.542 0.005 0.84 2654 20 2791 22 -5
MT20-02 1.884 0.019 0.180 0.002 13.161 0.146 0.531 0.005 0.90 2651 19 2745 22 -4
MT20-03 2.011 0.021 0.178 0.002 12.195 0.144 0.497 0.005 0.86 2632 20 2602 22 1
MT20-04 1.981 0.019 0.181 0.002 12.575 0.130 0.505 0.005 0.92 2660 18 2634 21 1
MT20-05 1.893 0.018 0.181 0.002 13.159 0.133 0.528 0.005 0.93 2659 18 2735 21 -3
MT20-06 1.855 0.018 0.180 0.002 13.364 0.136 0.539 0.005 0.93 2651 18 2780 22 -5
MT20-07 2.004 0.019 0.179 0.002 12.323 0.144 0.499 0.005 0.83 2645 20 2610 21 1
Table 5.5. Table showing the analytical results and the calculated ages for sample MT20.
Figure 5.10. Diagrams showing the 207Pb/206Pb weighted average age (a) and the concordia age (b) for sample MT20.

Page 138
5.5.2. Lu-Hf zircon results
Hafnium isotope data is presented in Table 5.6 and Figure 5.11. All analysed zircon
grains have very low 176Lu/177Hf ratios, ranging from 0.00029 to 0.00233, suggesting that
following the time of zircon crystallization the 176Hf/177Hf ratio of zircon changed little, but
the εHf values changed significantly due to the increase of the chondritic 176Hf/177Hf ratio
over time. The zircon grains from the granodiorite samples have similar Hf isotope
compositions with nearly chondritic 176Hf/177Hfi ratios (Fig. 5.11a) and small εHf variations
(Fig. 5.11b). Sample KK01 shows 4 epsilon units variation, sample KK03 shows 2.2 epsilon
units variation, sample KK04 shows only 1 epsilon unit variation and sample MT20 shows
1.4 epsilon units variation between different grains.
Analyses 176Lu/177Hf 1 σ
176Hf/177Hf 1 σ
176Hf/177Hfi 2 σ εHf0 εHfi 2 σ
KK01
KK01-01 0.000629 0.000031 0.280993 0.000022 0.280961 0.000022 -63.4 -4.0 0.8
KK01-02 0.000850 0.000035 0.281082 0.000010 0.281039 0.000010 -60.2 -1.2 0.3
KK01-03 0.001280 0.000015 0.281080 0.000017 0.281015 0.000017 -60.3 -2.1 0.6
KK01-04 0.000932 0.000013 0.281096 0.000007 0.281048 0.000007 -59.7 -0.9 0.3
KK01-05 0.000294 0.000003 0.281080 0.000007 0.281065 0.000007 -60.3 -0.3 0.2
KK01-06 0.000363 0.000003 0.281091 0.000007 0.281073 0.000007 -59.9 0.0 0.2
KK01-07 0.000687 0.000008 0.281066 0.000010 0.281031 0.000010 -60.8 -1.5 0.4
KK01-08 0.001858 0.000076 0.281105 0.000012 0.281011 0.000012 -59.4 -2.2 0.4
KK03
KK03-1 0.000527 0.000002 0.281091 0.000008 0.281065 0.000008 -59.9 -0.4 0.3
KK03-2 0.000373 0.000004 0.281083 0.000009 0.281064 0.000009 -60.2 -0.4 0.3
KK03-3 0.000469 0.000007 0.281064 0.000010 0.281040 0.000010 -60.9 -1.3 0.3
KK03-4 0.001171 0.000025 0.281085 0.000017 0.281025 0.000017 -60.1 -1.8 0.6
KK03-5 0.001248 0.000029 0.281067 0.000041 0.281004 0.000041 -60.7 -2.6 1.5
KK04

Page 139
KK04-1 0.000397 0.000013 0.281062 0.000007 0.281042 0.000007 -60.9 -1.1 0.3
KK04-2 0.001456 0.000028 0.281125 0.000011 0.281051 0.000011 -58.7 -0.8 0.4
KK04-3 0.001469 0.000042 0.281124 0.000012 0.281049 0.000012 -58.7 -0.8 0.4
KK04-4 0.000824 0.000015 0.281107 0.000010 0.281065 0.000010 -59.3 -0.3 0.4
KK04-5 0.000581 0.000018 0.281079 0.000008 0.281049 0.000008 -60.3 -0.8 0.3
KK04-6 0.000543 0.000004 0.281070 0.000008 0.281043 0.000008 -60.6 -1.0 0.3
KK04-7 0.000871 0.000011 0.281126 0.000008 0.281081 0.000008 -58.7 0.3 0.3
KK04-8 0.000850 0.000006 0.281113 0.000009 0.281070 0.000009 -59.1 -0.1 0.3
KK04-9 0.000850 0.000006 0.281113 0.000009 0.281070 0.000009 -59.1 -0.1 0.3
MT20
MT20-1 0.000468 0.000018 0.281093 0.000009 0.281069 0.000009 -59.8 -0.4 0.3
MT20-2 0.002329 0.000062 0.281197 0.000016 0.281079 0.000016 -56.2 0.0 0.6
MT20-3 0.001047 0.000020 0.281148 0.000011 0.281095 0.000011 -57.9 0.5 0.4
MT20-4 0.001183 0.000021 0.281132 0.000013 0.281072 0.000013 -58.5 -0.3 0.5
MT20-5 0.000452 0.000002 0.281095 0.000007 0.281072 0.000007 -59.8 -0.3 0.2
MT20-6 0.000857 0.000010 0.281098 0.000009 0.281055 0.000009 -59.7 -0.9 0.3
MT20-7 0.000644 0.000006 0.281101 0.000009 0.281068 0.000009 -59.5 -0.4 0.3
KK51
KK51-1 0.000914 0.000012 0.281130 0.000009 0.281083 0.000009 -58.5 1.6 0.3
KK51-2 0.000970 0.000005 0.281161 0.000008 0.281111 0.000008 -57.4 2.6 0.3
KK51-3 0.001115 0.000009 0.281153 0.000009 0.281095 0.000009 -57.7 2.1 0.3
KK51-4 0.001076 0.000013 0.281147 0.000010 0.281091 0.000010 -57.9 1.9 0.4
KK51-5 0.000448 0.000009 0.281126 0.000008 0.281103 0.000008 -58.7 2.4 0.3
KK51-6 0.000805 0.000005 0.281136 0.000010 0.281094 0.000010 -58.3 2.0 0.4
KK51-7 0.000840 0.000007 0.281140 0.000007 0.281096 0.000007 -58.2 2.1 0.2
Table 5.6. Table showing the Hf isotope data for the zircon grains analysed in this study.
Overall, the granodiorite samples have a uniform Hf isotope composition with mean
176Hf/177Hf ratios of between 0.28107 and 0.28103, and mean εHf values that range from -0.3
to -1.5. The larger spread in Hf isotope composition and the lower εHf values observed in
sample KK01could be attributed to the presence of relict cores and possibly to some degree

Page 140
of crustal contamination experienced by this sample.
The zircon grains separated from the crystal tuff sample have suprachondritic
176Hf/177Hfi ratios and positive εHf values. This sample also shows very limited variation in
Hf isotope compositions between different grains with a maximum of one epsilon unit
difference between analyses.
5.6. DISCUSSION
5.6.1. Implications for the deformation history
The Kukuluma Terrain and the Central Terrain share a similar deformation history
suggesting that the entire GGB was deformed during the same period. The 2717±12 Ma
crystal tuff layer from the Kukuluma pit is interbedded and deformed together with the
turbiditic sediments and the ironstones. At the Geita Hill pit in the Central Terrain a
trachyandesite dyke dated by Borg and Korgh (1999) at 2699±9 Ma was interpreted by
Sanislav et al. (2015) to be one of the monzodiorite dykes that intruded and was folded
during D2 and/or D3 events. The intrusion of the KIC is most likely synchronous with the
Figure 5.11. Diagrams showing the initial 176Hf/177Hf ratios (a) and the εHf values (b) vs. the 207Pb/206Pb age of the zircon grains analysed in this study. The shaded areas show the range in Hf isotopic composition for the 2660-2620 Ma high-K granites (Sanislav et al., 2014).

Page 141
intrusion of the diorite dykes in the Central Terrain since both the KIC and the diorite dykes
are affected by the D3 deformation. The granodiorite dykes (samples KK01 and KK03) from
the Kukuluma pit and the small granodiorite intrusion (sample KK04) along the Kukuluma
access road were emplaced around 2660 Ma.
The 2662±6 Ma granodiorite (KK04) intrusion found along the Kukuluma access
road cuts across the D4 fold hinges, the 2661±16 Ma (KK01) granodiorite dyke from the
western wall of the Kukuluma deposit is affected by D5 sub-horizontal folding while the
2658±15 Ma (KK03) granodiorite dyke from the same side of the deposit is affected by D6
shearing. These field relationships suggest that the granodiorites were emplaced after D4,
possibly during D5 and before D6 deformation. The 2651±14 Ma granodiorite dyke from the
Matandani pit (MT 20) that cuts across the diorite –ironstone contact on both the western and
eastern is locally overprinted by shear fabrics. The fact that, shear fabrics cut along the
intersection of diorite-ironstone contact that is cut by the dike, suggests that, the D6-shear
zone overprints the emplacement of this dike. Also, the occurrence of the shear fractures in
both the ironstones and the dike might be interpreted to be associated with reactivation of the
D6-shear zone by D7-shear zone. By comparison, the 2658±15 Ma (sample KK03)
granodiorite dyke from the Kukuluma pit is clearly displaced by the D6 shear zones.
5.6.2. Implications for the supracrustal stratigraphy
The 2717±12 Ma crystal tuff layer is interbedded with turbiditic sediments and overlies
the banded ironstones. The banded ironstones and the turbiditic sediments are in general
interpreted to overlie the mafic volcanics of the Kiziba Formation (e.g. Manya and Maboko,
2008; Sanislav et al., 2015; Cook et al., 2015). The whole rock Sm-Nd model ages (Manya
and Maboko, 2003; Manya and Maboko, 2008; Cook et al., 2015) indicate that the mafic
volcanics were erupted around 2820 Ma, thus forming the oldest identified horizon in the

Page 142
stratigraphy. In the southern part of the GGB where the mafic volcanics are well exposed the
contact between the mafic volcanics and the upper part of the stratigraphy is structural (Cook
et al., 2015); the metamorphic grade changes from amphibolite facies to lower greenschist
facies in less than fifty meters.
It is unclear whether this structural contact follows an initial unconformity thus,
opening the possibility of a sedimentation gap between the eruption of the mafic volcanics
and the deposition of the ironstones and the related sediments. It is even less clear whether
stratigraphic horizons can be correlated across the GGB or for that purpose across the much
larger SGB. For example, the ironstone horizons are the most ubiquitous units across the
entire region, have the best surface exposure and a clear geophysical signature but,
correlating them across the region is not a straight forward exercise. In the Central Terrain
chloritic and feldspathic sandstones that overly the ironstones yielded zircon ages between
2702 and 2687 Ma (Chamberlain and Tosdal, 2007); the field relationships indicate a
continuous transition from the ironstones to the sandstones suggesting that the ironstones and
the sandstones belong to the same sedimentary cycle.
However, in the Nyamullima Terrain (Fig. 1.2), in the western part of the GGB, a tuff
horizon interbedded with the ironstones was dated at 2771±15 Ma (Chamberlain and Tosdal,
2007; Table 1.1) indicating ironstone deposition as early as 2770 Ma. Even though, the 2717
Ma crystal tuff layer overlies the ironstones in the Kukuluma Terrain, the ironstone units are
interbedded with tuffaceous sediments and show a gradual transition into turbiditic sediments
interlayered with volcanoclastics suggesting a continuous sedimentation history. Thus, it is
possible, the ironstones, the turbidites and the interlayered volcanoclastics form a continuous
unit in the Kukuluma Terrain and possibly the Central Terrain while the ironstones from the
Nyamullima Terrain belong to a separate and maybe older stratigraphic horizon. Further
evidence for an older ironstone stratigraphic horizon comes from the Nyanzaga area (Fig.

Page 143
1.1), east of the GGB where Chamberlain and Tosdal (2007) reported a 2779±13 Ma age for
pyroclastic tuffs overlaying the ironstone units (Table 1.1). Pyroclastic flows from near
Kahama, the southern part of the SGB, have ages of 2808±6 Ma and 2780±3 Ma (Borg and
Krogh, 1999) respectively, also pointing towards an early period of volcanism and
sedimentation. Although, the stratigraphic age relationships are poorly constrained, the few
available ages point towards the possibility of basin development over a considerable
timespan or towards the existence of discrete sedimentation episodes in different basins. Both
scenarios require testing in the field and systematic dating of selected stratigraphic horizons.
5.6.3. Timing of gold mineralization
The gold mineralization is spatially related with the D6 shear zones which were
reactivated during D7 as normal faults (see Chapter 3). The granodirote dike cuts across the
diorite-ironstone contact at Matandani pit (MT 20). The intersection between the diorite –
irosntone contact and the granodiorite dike is overprinted by the D6-shear zone that runs
along the diorite-irosntone contact. The fact that the D6-shear zone overprints both the diorite,
ironstone and the dike suggests that, the emplacement of the dike pre-dated the D6-shear
zone. In addition, gold mineralization occurs in spatial association with the D6-shear zone
that utilizes the contact between the diorite and Ironstones. In the mineralized zones, the D6-
shear zones are interpreted to be reactivated by the D7-shear fractures occuring as fracture
networks observed in both the dike and the ironstones. Therefore, the 2651±14 Ma age from
the Matandani pit granodiorite dike can be used to define a maximum age for the timing of
gold mineralization in the area.
The 2651±14 Ma age of this dyke is similar within error to the 2644±3 Ma age (Borg
and Krogh, 1999) of the mineralized lamprophyre dyke from the Geita Hill deposit
suggesting that gold mineralization in the Central Terrain and the Kukuluma Terrain may

Page 144
have occurred at about the same time. The gold mineralization in the Matandani pit consists
of two sub-parallel mineralisation envelopes occurring on both sides of the KIC. This dyke is
overprinted by both the eastern and western mineralization envelopes. This is evidenced by
the localised shearing of the granodiriote observed along the diorite –ironstone contact. It is
along this sheared zone where relatively low grade gold mineralization is recorded. However,
away from the sheared diorite-ironstone contact, no shear fabrics are observed within the
Granodiorite dyke. This strongly suggests that, gold mineralization within this area post-dates
the emplacement of the granodiorite dikes.
5.6.4. Implications for crustal growth
Four episodes of crustal growth can be recognised in the SGB based on the available
zircon ages (Fig. 5.12; Table 1.1). The earliest episode is represented by the extrusion of the
~2820 Ma mafic volcanics (Manya and Maboko, 2003; Manya and Maboko, 2008; Cook et
al., 2015) and the associated intermediate volcanics. This is followed between 2780 Ma and
2740 Ma (Fig. 5.12) by a period dominated by the emplacement of igneous rocks of
intermediate composition. A relatively continuous period occurred between 2720 Ma and
2620 Ma, over which magmatism transitions from mainly TTG and diorite in the early stages
to the more evolved high-K granites in the later stages. This prolonged period can be
subdivided into a TTG dominated period (2720-2660 Ma) and a high-K granite dominated
period (2660-2620 Ma). The GGB appears to comprise elements of all the periods of crustal
growth with the mafic volcanics being abundant in the southern part of the greenstone belt
(Cook et al., 2015), 2770 Ma tuffs occurring in the Nyamullilima Terrain (Chamberlain and
Tosdal, 2007) and ~ 2700 Ma diorite and TTG occurring all over the greenstone belt
(Sanislav et al., 2015; 2016). The eastern, northern and western side of the greenstone belt are
dominated by the 2660 to 2620 ma high-K granites (Sanislav et al., 2014).

Page 145
Figure 5.12. Probability density diagram showing the distribution of the zircon ages in the Sukumaland Greenstone Belt. Three main periods of crustal growth can be recognised. However, the 2720-2620 Ma period can be separated into a TTG dominated period (2720-2660 Ma) and a high-K granite dominated period (2660-2620 Ma).
This study presents the first zircon age data for the Kukuluma Terrain. This new
dataset indicates that the Kukuluma Terrain was mainly affected by the 2720 to 2620 Ma
episode of crustal growth. The 2717±12 Ma crystal tuff was most likely derived from igneous
rocks of intermediate or primitive TTG composition as indicated by positive εHf values and
suprachondritic 176Hf/177Hfi ratios (Fig. 5.11). This was followed by the intrusion of the
diorite and monzonite phase of the KIC most probably between 2700 and 2680 Ma by
comparison with the Nyankanga Intrusive Complex from the Central Terrain (Sanislav et al.,
2015; Chapter 3). It is worth noting that the igneous activity in the Kukuluma Terrain
follows a similar pattern with the igneous activity in the Central Terrain. That is, an early
phase dominated by intrusives of dioritic to monzonitic composition followed by a series of
dykes of granodioritic composition (Sanislav et al., 2015; 2016).
In the Kukuluma Terrain, the granodiorite phase appears to consistently return ages
between 2665 and 2650 Ma marking the transition to the more evolved 2660 to 2620 Ma

Page 146
high-K granites that are wide spread around the margin of the greenstone belt. The nearly
chondritic Hf isotope composition of the granodiorites requires a juvenile source for these
rocks, most likely of mafic composition which experienced very little interaction with felsic
crust. Two samples (KK04 and MT20) have almost identical Hf signatures and basically fall
within the chondritic evolution line. The other two samples (KK01 and KK03) have εHf
values as low as -4 which, can be explained by the assimilation of some sediment during
emplacement. However, their average isotopic signature is still nearly chondritic requiring an
important juvenile component in their source. Their geochemical signature (Chapter 4) is
consistent with intracrustal partial melting of amphibolite. The Hf signature of the
granodiorites is almost identical to the Hf signature of the similarly aged high-K granites
which also have nearly chondritic affinities indicating crustal growth from a juvenile source,
most probably of mafic to intermediate composition. The lack of a significant sub-chondritic
component in the isotopic signature of zircons precludes any involvement of older felsic crust
and the narrow compositional range indicates that little mixing or contamination occurred.
5.7. CONCLUSIONS
• The emplacement of the diorite and monzonite suites of the KIC may have occurred
between ~2700-2680 Ma.
• The 2717 Ma age of the crystal tuff layer from the Kukuluma pit provides a maximum
sedimentation age for this part of the greenstone belt. The crystal tuff layer is part of a
volcanoclastic sequence that overlaies the ironstone and forms the top of the Nyanzian
stratigraphy. It is possible that more than one ironstone horizons exist in the GGB.
• The 2650 Ma age of the mineralized granodiorite dyke from Matandani pit can be
used to constrain the maximum age of the mineralization in the Kukuluma Terrain.
This age is similar to the maximum mineralization age (2644 Ma; Borg and Krogh,

Page 147
1999) proposed for the mineralization in the Central Terrain. It is likely that gold
mineralization in the GGB occurred synchronously.
• Geochrological evidence suggests that Kukuluma Terrain was subjected to three
phases of crustal growth: pre-2700 Ma sedimentation in a volcanically active region,
the emplacement of the diorite, monzonite and granodiorite suites between ~2700 Ma
and 2660 Ma and finally the emplacement of the high-K granites along the margins of
the GGB.
• Hf isotopes suggest that magmatism and volcanism have a juvenile character.

Page 148
CHAPTER 6
CONCLUSIONS
A large amount of research has been conducted in the past five decades with the aim of
better understanding the geological controls on gold mineralization for the Archaean
greenstone-hosted gold deposits. Most of these researches were focused on deposits from
Western Australia, Canada, South Africa, India, Brazil, and China. However, the past two
decades have seen a constant increase of research activity on the Archean gold deposits from
Tanzania Craton. This thesis presents for the first time the geology of a mineralized terrain,
the Kukuluma Terrain, from the Geita Greenstone Belt. The Kukuluma Terrain contains three
gold deposits and a few prospects making it one of the highest prospective terrains in the
Geita Greenstone Belt. In this thesis, I used several techniques to study the geology of the
Kukuluma Terrain to create a better understanding of the controls on gold mineralization.
These techniques involved: geological mapping, geochemistry (XRF for major elements and
LA-ICP-MS for trace elements) (LA-ICP-MS), geochronology (LA-ICP-MS dating of zircon
grains), isotopes (Hf isotopes in zircon grains), interpretation of geophysical datasets and 3D-
modelling of key geological features.
In Chapter 2 of the thesis I presented the methods and the data I used as a foundation
for the following chapters. The aim of this chapter was to show how 3D-geological models
for the Matandani, Kukuluma and Area 3 West deposits were constructed from surface
mapping, drill core logging, chip logging, cross-section interpretations and modeling. As a
result, a standardized nomenclature (Table A2.1) of lithologies was established that led to the
generation of a coherent geological framework for the area. Shapes and geometries of various

Page 149
lithologies were established using cross-sections generated from individual deposits. The
relative timing relationships of various lithological units were established using various
techniques such as cross-cutting relationships and younging indicators. These observations
form the basis for material presented in chapters 3, 4 and 5. In this chapter, I have also
presented the methodologies and laboratory set-ups used for structural analyses (presented in
Chapter 3), geochemical analyses (presented in Chapters 4 and 5) and geochronology
(presented in Chapter 5).
In Chapter 3 of this thesis, I presented the detailed deformation and intrusive history of
the Kukuluma Terrain (Table 3.1). The Geita Greenstone Belt can be subdivided into three
NW-SE trending terrains: Kukuluma Terrain, Central Terrain, and the Nyamullilima Terrain.
There is no published data for the Nyamullilima Terrain (except a few internal mine reports),
but the geology of the Central Terrain has been discussed in a few papers over the last two
decades (e.g. Borg, 1994; Sanislav et al., 2015; 2016). In this study I have showed that the
Kukuluma Terrain experienced a complex deformation and intrusive history (Chapter 3) with
multiple folding events (D2 to D5 deformation) and shearing (D6 deformation) related to a
compressional-accretionary phase followed by normal faulting (D7 deformation) during the
waning stages of Archean deformation. The Kukuluma terrain was intruded by monzonite,
diorite and granodiorite forming the Kukuluma Intrusive Complex. The monzonite and the
diorite phase intruded early during D3 deformation while the granodiorite phase intruded
mainly as dykes during later deformation events.
Overall, the deformation and intrusive pattern in the Kukuluma Terrain is similar to the
deformation and the intrusive pattern described from other parts (e.g. Borg, 1994; Sanislav et
al., 2015; 2016) of the Geita Greenstone Belt suggesting that the entire greenstone belt
experienced a similar deformation and intrusive history. Gold mineralization is spatially

Page 150
linked to the diorite-ironstone contact that is overprinted by the D6-shear zone,
hydrothermally brecciated hinge zones of D3-folds and by the D7-normal reactivation of
earlier structures.
In Chapter 4 of the thesis I presented the major and trace element geochemistry of the
Kukuluma Intrusive Complex and discussed the petrogenesis of the monzonite, diorite and
the granodiorite suites. The major and trace element geochemistry of the Kukuluma Intrusive
Complex such as low SiO2 and relatively high MgO indicate their derivation from partial
melting of mafic or ultramafic sources. The trace element geochemistry of the diorite and the
monzonite suites resembles adakite rocks but it lacks a clear mantle or slab signature
suggesting that they formed most likely by lower crustal melting of eclogite, while the
granodiorite phase formed by partial melting of amphibolite. This indicates that crustal
growth in this part of Tanzania did not occur by modern day like plate tectonic processes but
involved a rather different tectonic setting mechanism specific for the Archean period.
In Chapter 5 of this thesis I presented new U-Pb zircon ages and Hf isotope data from
tuffaceous sediments and from granodiorite dykes and I discussed the findings in relation to
deformation history, timing of sedimentation, timing of mineralization and implications for
crustal growth in Tanzania Craton. The sedimentation age of the volcano-sedimentary units
within the Kukuluma terrain is proposed to be as old as ~2717Ma based on the crystal tuff
age which interbands with ironstones. This sedimentation age is close to the 2702 Ma and
2687 Ma zircon ages reported from the feldspathic sandstone units interbedded with the
ironstones in the Central Terrain. This similarity in the sedimentation ages between the two
terrains appeals for re-assessment of the timing of the formation of this terrain bounding
structure and its role if any in the sedimentation processes. In addition, the larger difference
showed by the 2771 Ma tuffaceous sediments interbedded with ironstones from the

Page 151
Nyamulilima Terrain indicates a more complex stratigraphic relationship over the GGB. This
may indicate that ironstones were deposited more than once in GGB. Alternatively, the
sedimentation processes were controlled by isolated volcanic activities in smaller basins that
formed within the Geita Greenstone Belt.
It is likely that the diorite and monzonite suite of the KIC were intruded about the
same time with the Nyankanga Intrusive Complex from the Central Terrain. That is indicated
by similar composition, by the age of sediments they intruded into and by the age of later
felsic porphyries that cut across these intermediate intrusive complexes. Thus, the KIC
intruded sometime between 2700 Ma and 2670 Ma.
Using the existing zircon geochronology and the new U-Pb zircon ages and Hf
isotopes presented in this thesis I proposed that the evolution of the Kukuluma Terrain fits
within the general pattern of crustal growth observed in this part of the Tanzania Craton. The
Kukuluma Terrain records prior to 2700 Ma a period dominated by volcanism and
sedimentation; this period was followed by the main accretionary processes and the
emplacement between ~ 2700 Ma and 2650 Ma of the intermediate phase of the KIC and the
granodiorite dykes. The last period that affected the Kukuluma Terrain coincides with the
emplacement of the 2660 Ma to 2620 Ma high-K granites around its north-eastern margin.
The Hf isotopes in zircon indicate that the sediments and the granodiorite dykes were derived
from a juvenile source and there are no indications of older crust being involved in the
petrogenesis of these rocks. These conclusions fit very well with the interpreted petrogenesis
of the granodiorite dikes (see Chapter 4) which, were interpreted to have formed by
intracrustal partial melting of a juvenile amphibolite source. The maximum age for gold
mineralization within the Kukuluma Terrain could be constrained to ~2650 Ma based on the
crosscutting relationship of a mineralized granodiorite dyke from the Matandani pit.

Page 152
This study has demonstrated that, the gold mineralization in the Kukuluma terrain
occurred late during the tectonic evolution of the Geita Greenstone Belt. The Kukuluma
Terrain experienced a complex deformation and intrusive history that created a favorable
structural geometry, which under the right conditions trapped the gold from mineralized
fluids. The late timing of gold suggests a potential link to the emplacement of the high-K
granites and important contributions from fluids derived from melting/crystallization of
crustally derived magmas. However, at the moment there is no clear evidence for a genetic
link between gold and the high-K granites. This could be a topic for further studies since
there may be implications for exploration. The isotope data supports a juvenile character for
the Kukuluma Terrain typical for many Archean gold provinces worldwide.
The ironstones are the main hosts for gold mineralization. They are complexly folded
and disrupted by shear zones and intrusives. Better understanding of their distribution and
geometry at the terrain scale should be major focus for further exploration work. The contact
between the KIC and the sediments is the next important control on gold distribution and
further studies/exploration should focus on understanding its undercover extent. The
relationship between the folded pattern and the KIC is also an important factor. It appears that
mineralization preferentially occurs in zones of complex D2-D3 interference pattern located in
bends of the KIC created by the D4 and cut across by D6 and D7 shear zones. It appears that
gold mineralization occurs along ~ east-west oriented structural corridors that intersect the
dominant N-W structural trend. These ~east-west corridors manifest as steeply dipping
fracture zones recording a normal component of movement. These corridors are visible in the
geophysics, the open pits and mined by artisanal miners. Field mapping should further
investigate their potential.

Page 153
The emplacement of the granodiorite dykes and intrusives appears to “just” predate
the gold mineralization. The composition and timing of some of these dykes and intrusives
was touched upon in this thesis but, field evidence suggests that their composition and timing
is more diverse compared to what has been presented here. The possibility of a link between
this intrusive phase and gold should be further investigated. A detailed study on the alteration
paragenesis and the alteration signature of the mineralizing fluids is missing. This has
enormous implications for exploration, metallurgy and the understanding of mineralization
therefore such a study is highly recommended.

Page 154
REFERENCES
Allmendinger, R.W., 2012. StereoWin for Windows. (www.geo.cornell.edu/geology/
faculty/RWA/programs.html).
Allmendinger, R.W., 2001. FaultKinWin, Version 1.1: a program for analyzing fault slip data
for Windows™. (www.geo.cornell.edu/geology/faculty/RWA/programs.html).
Angelier, J., 1994. Fault slip analysis and palaeostress reconstruction, in: Hancock, P.L.
(Ed.), Continental Deformation. Oxford, Pergamon, Oxford, pp. 101-120.
Angelier, J., Mechler, P., 1977. Sur une méthode graphique de recherche des contraintes
principales également utilisable en tectonique et en séismologie: la méthode des dièdres
droits. Bulletin de la Société Géologique de France 7, 1309-1318.
Anhaeusser, C.R., 2014. Archaean greenstone belts and associated granitic rocks-A review.
Journal of African Earth Sciences 100,684-732
Atherton, M.P., Petford, N., 1993. Generation of sodium-rich magmas from newly
underplated basaltic crust. Nature 362, 144-146.
Bansah, D., Chase, R., Davidson, A., Michael, H., Skead, M., Stuart, H., 2000. The Geita and
Kukuluma mineralised trends, Lake Victoria Goldfield, Tanzania ore body
characteristics and project planning. 4th International Mining Geology Conference,
Coolum, Queensland, 14–17 May 2000.
Barth, H., 1990. Explanatory Notes on the 1:500 000: Provisional Geological Map of the lake
Victoria Goldfields, Tanzania. Geologisches JahrbuchReihe B, Regional
GeologieAusland Heft 72.
Bebout, G.E., 2007. Metamorphic chemical geodynamics of subduction zones. Earth and
Planetary Science Letters 260, 373-393.
Bedard, J.H., 2006. A catalytic delamination-driven model for coupled genesis of Archaean
crust and sub-continental lithospheric mantle. Geochimica et Cosmochimica Acta 70,
1188-1214.
Bedard, J.H., Harris, L.B., 2014. Neo-archaean disaggregation and re-assembly of the
Superior Craton. Geology 42, 951-954.
Bedard, J.H., Harris, L.B., Thurston, P.C., 2013. The hunting of the snArc. Precambrian
Research 229, 20-48

Page 155
Bedard, J.H., Brouillette, P., Madore, L., Berclaz, A., 2003. Archaean cratonization and
deformation in the northern Superior Province, Canada: an evaluation of plate tectonic
vs vertical tectonic models. Precambrian Research 127, 61–87.
Begg, G.C., Griffin, W.L., Natapov, L.M., O'Reilly, S.Y., Grand, S.P., O'Neill, C.J., Hronsky,
J.M.A., Djomani, D.Y., Swain, C.J., Deen, T., Bowden, P., 2009. The lithospheric
architecture of Africa: seismic tomography, mantle petrology and tectonic evolution.
Geosphere 5, 23–50.
Bierlein, F.P., Groves, D.I., Cawood, P.A., 2009. Metallogeny of accretionary orogens- the
connection between lithospheric processes and metal endowment. Ore Geol. Rev.36,
282–292.
Bierlein, F.P., Groves, D.I., Goldfarb, R.J., Dubé, B., 2006. Lithospheric controls on the
formation of provinces hosting giant orogenic gold deposits. Miner. Deposita 40, 874–
886.
Blewett R.S., Czarnota K., Henson P.A., 2010a, Structural-event framework for the eastern
Yilgarn craton, Western Australia, and its implications for orogenic gold: Precambrian
Research 183, p. 203–229
Blewett, R.S., Henson, P.A., Roy, I.G., Champion, D.C., Cassidy, K.F., 2010b. Scale
integrated architecture of the world-class gold mineral systems of the Archean eastern
Yilgarn Craton. Precambrian Res. 183, 230–250.
Blewett, R.S., Shevchenko, S., Bell, B., 2004. The North Pole Dome: a non-diapiric dome in
the Archaean Pilbara Craton, Western Australia. Precambrian Research 133, 105–120.
Booth, J.K., 1954b. A note on the structural geology of the Geita Mine. - Rec. Geol. Surv.
Tanganyika 1, (1951), 20-21(1954).
Borg, G., 1994. The Geita gold deposit in NW Tanzania. Geology, ore petrography
geochemistry and timing events. Geol. Jb. D100, 545–595.
Borg, G., 1992. New aspects on the lithostratigraphy and evolution of the Siga Hills, an
Archaean granite-greenstone terrain in NW-Tanzania. Zeitschrift fur Angewandte
Geologie 38, 89-93.
Borg, G., Rittenauer, A., 2000. Syn‐ and epigenetic sulphides in Archean BIFs of
NW‐Tanzania and their significance to gold mineralization. In: Rammlmair (ed)
Applied mineralogy. Balkema, Rotterdam, pp 263–266
Borg. G., Krogh, T., 1999. Isotopic age data of single zircons from the Archaean Sukumaland
Greenstone Belt, Tanzania. Journal of African Earth Sciences 29, 301-312.

Page 156
Borg, G., Shackleton, R.M., 1997. The Tanzania and NE-Zaire Cratons. In: de Wit, M.J.,
Ashwal, L.D. (Eds.), Greenstone Belts. Oxford University Press, Oxford, pp. 608–619.
Borg, G., Lyatuu, D.R., Rammlmair, D., 1990. Genetic aspects of the Geita and Jubilee reef,
Archean BIF-hosted gold deposits, Tanzania. Geol. Rundsch. 79, 355–371.
Bouhallier, H., Chardon, D., Choukroune, P., 1995. Strain patterns in Archaean dome-and-
basin structures: the Dharwar craton (Kamataka, South India). Earth and Planetary
Science Letters 135, 57–75.
Bouvier, A., Vervoort, J.D., & Patchett, P.J., 2008. The Lu–Hf and Sm–Nd isotopic
composition of CHUR: Constraints from unequilibrated chondrites and implications for
the bulk composition of terrestrial planets. Earth and Planetary Science Letters, 273,
48–57.
Brayshaw, M., Kolling, S.L., 2012. Standardized graphic log paper used in drill core logging.
Geita Gold Mine.Internal document.
Castillo, P. R., 2012. Adakite petrogenesis. Lithos 134-135, 304-316.
Chadwick, B., Vasudev, V.N., Hegde G.V. 2000. The Dharwar Craton, southern
India,interpreted as the result of Late Archean oblique convergence. Precambrian
Research 99, 91–111.
Chamberlain, C.M., Tosdal, R.M., 2007. U–Pb geochronology of the Lake Victoria
Greenstone Terrane, Tanzania. Mineral Deposit Research Unit The University of
British Columbia (Research Program on World-class Gold Deposits and Advanced
Exploration Projects Owned and/or Joint Ventured to Barrick Gold, Placer Dome,
Anglogold-Ashanti, Resolute Mining NL as Main Sponsors.
Chardon, D., Choukroune, P., Jayananda, M., 1996. Strain patterns, decollement and incipient
sagducted greenstone terrains in the Archaean Dharwar craton (south India). Journal of
Structural Geology 18, 991–1004.
Chiaradia, M., 2015. Crustal thickness control on Sr/Y signatures of recent arc magmas: an
Earth scale perspective. Scientific Reports 5, 8115.
Choukroune, P., Bouhallier, H., Arndt, N.T., 1995. Soft lithosphere during periods of
Archaean crustal growth or crustal reworking. In: Coward, M.P., Ries, A.C. (Eds.),
Early Precambrian Processes. Geological Society of London Special Publication, vol.
95, pp. 67–86.
Cladouhos, T.T., Allmendinger, R.W., 1993. Finite strain and rotation from fault slip data.
Journal of Structural Geology 15, 771-784.

Page 157
Cloutier, J., Stevenson, R. K., Bardoux, M., 2005. Nd isotopic, petrologic and geochemical
investigation of the Tulawaka East gold deposit, Tanzania Craton. Precambrian
Research 139, 147-163.
Collins, W.J., Van Kranendonk, M.J., Teyssier, C., 1998. Partial convective overturn of
Archaean crust in the east Pilbara Craton, Western Australia: driving mechanisms and
tectonic implications. Journal of Structural Geology 20, 1405–1424.
Colvine, A.C., Fyon, J.A., Heather, K.B., Marmont, S., Smith, P.M., Troop, D.G., 1988.
Archaean lode gold deposits in Ontario. Ontario Geological Survey, Ontario, Canada.
Miscellaneous Paper 139, pp. 136.
Condie, K. C., 1994. Greenstones through time. In: Condie, K. C (Ed.), Archaean Crustal
Evolution. Elsevier, Amsterdam.
Condie, K.C., 2005. TTGs and adakites: are they both slab melts? Lithos 80, 33–44.
Condie, K.C., 2014. Growth of continental crust: a balance between preservation and
recycling. Mineral. Mag. 78, 623–637.
Condie, K.C., Viljoen, M.J., and Kable, E.D.J., 1977. Effects of alteration on element
distributions in Archaean tholeiites from the Barberton greenstone belt, South Africa.
Contributions to Mineralogy and Petrology 64, 75-89.
Cook, Y.A., Sanislav, I.V., Hammerli, J., Blenkinsop, T.G., Dirks, P.H.G., 2015. A primitive
mantle source for the Neoarchean mafic rocks from the Tanzania Craton. Geoscience
Frontiers, 7, 911-926.
Cox, S.F., Knackstedt, M.A., Braun, J., 2001. Principles of structural control on permeability
and fluid flow in hydrothermal systems. In: Richards, J.P., Tosdal, R.M. (Eds.),
Structural Controls on Ore Genesis. Reviews in Economic Geology, 14. Society of
Economic Geologists, Boulder, Colorado, pp. 1–25.
Czarnota K., Champion D.C., Goscombe B., Blewett R.S., Cassidy K.F., Henson
P.A.,Groenewald P.B., 2010, Geodynamics of the eastern Yilgarn craton: Precambrian
Research, v. 183, no. 2, p. 175–220.
Davidson, J., Turner, S., Handley, H., Macpherson, C., Dosseto, A., 2007. Amphibole
“sponge” in arc crust? Geology 35, 787–790.
de Ronde, E.J., de Wit, M.J., 1994. The tectonic history of the Barberton greenstone belt
South Africa: 490 million years of Archaean crustal evolution. Tectonics 13, 983–1005.
de Wit, M.J., Furnes, H., Robins, B., 2011. Geology and tectonostratigraphy of the Onverwacht
Suite, Barberton Greenstone Belt, South Africa. Precambrian Res 186:1–27

Page 158
de Wit, M.J., Ashwal, L.D., 1997. Greenstone Belts. Oxford University Press, Oxford,
Defant, M.J., Drummond, M.S., 1990. Derivation of some modern arc magmas by melting of
young subducted lithosphere. Nature 347, 662–665.
Delvaux, D., Sperner, B., 2003. New aspects of tectonic stress inversion with reference to the
TENSOR programme, in: Nieuwland, D.A. (Ed.), New insights into structural
interpretation and modelling. Geological Society of London, Special Publication, 212,
75-100.
Dirks, P.H.G.M., Charlesworth, E.G., Munyai, M.R., Wormald, R.J., 2013. Stress analyses,
post-orogenic extension and 3.01 Ga gold mineralization in the Barberton Greenstone
Belt, South Africa. Precambrian Res 226,157–184.
Dirks, P.H.G.M., Charlesworth, E.G., Munyai, M.R., 2009. Cratonic extension and Archaean
- gold mineralisation in the Sheba-Fairview mine, Barberton Greenstone Belt, South
Africa. South African Journal of Geology 112, 291–316
Dirks, P.H.G.M., Jelsma, H.A., Hofmann, A., 2002. Accretion of an Archean greenstone belt
in the Midlands of Zimbabwe. Journal of Structural Geology 24, 1707–1727.
Dirks, P.H.G.M., Jelsma, H.A., 1998. Horizontal accretion and stabilization of the Zimbabwe
Craton. Geology 26, 11–14.
Drummond, M.S., Defant, M.J., 1990. A model for trondhjemite–tonalite–dacite genesis and
crustal growth via slab melting: Archaean to modern comparisons. Journal of
Geophysical Research 95, 21503-21521.
Etchecopar, A., Vasseur, G., Daignie`res, M., 1981. An inverse problem in microtectonics for
the determination of stress tensors from fault striation analysis. Journal of Structural
Geology 3, 51–65.
Foley, S., Tiepolo, M., Vannucci, R., 2002. Growth of early continental crust controlled by
melting of amphibolite in subduction zones. Nature 417, 837– 840.
Foley, S.F., Barth, M.G., Jenner, G.A., 2000. Rutile/melt partition coefficients for trace
elements and an assessment of the influence of rutile on the trace element
characteristics of subduction zone magmas. Geochim. Cosmochim. Acta 64, 933–938.
Fossen, 2016. Structural geology. Cambridge University Press, Cambridge, 524pp
Frimmel, H.E., 2008. Earth's continental crustal gold endowment. Earth Planet. Sci. Lett.
267, 45–55.

Page 159
Gabert, G., 1990. Lithostratigraphic and tectonic setting of gold mineralization in the
Archaean Cratons of Tanzania and Uganda, East Africa. Precambrian Research 46, 59–
69.
Gao, S., Rudnick, R.L., Yuan, H.L., Liu, X.M., Liu, Y.S., Xu, W.L., Lin, W.L., Ayerss, J.,
Wang, X.C., Wang, Q.H., 2004. Recycling lower continental crust in the North China
craton. Nature 432, 892–897.
Goldfarb, R.J., Baker, T., Dubé, B., Groves, D.I., Hart, C.J.R., Gosselin, P., 2005.
Distribution, character and genesis of gold deposits in metamorphic terranes. Econ.
Geol. 100th Anniv. Vol. 407–450.
Goldfarb, R.J., Groves, D.I., Gardoll, S., 2001. Orogenic gold and geologic time: a global
synthesis. Ore Geol. Rev. 18, 1–75.
Goss, A.R., Kay, S.M., Mpodozis, C., 2011. The geochemistry of a dying continental arc: the
Incapillo Caldera and Dome Complex of the southernmost Central Andean Volcanic
Zone (28°S). Contributions to Mineralogy and Petrology 161, 101-128.
Green, T.H., Blundy, J.D., Adam, J., Yaxley, G.M., 2000. SIMS determination of trace
element partition coefficients between garnet, clinopyroxene and hydrous basaltic
liquids at 2 – 7.5 GPa and 1080–1200 °C. Lithos 53, 165– 187.
Groves, D.I., Santosh, M., 2015. Province-scale commonalities of some world-class gold
deposits: Implications for mineral exploration. Geoscience Frontiers, 6, 389-399.
Groves, D.I., Vielreicher, R.M., Goldfarb, R.J., Condie, K.C., 2006. Controls on the
heterogeneous distribution of mineral deposits through time. In: McDonald, I., Boyce,
A.J., Butler, I.B., Herrington, R.J., Polya, D.A. (Eds.), Mineral Deposits and Earth
Evolution: Geol. Soc., London Spec. Pub., 248.
Groves, D.I., Goldfarb, R.J., Robert, F., Hart, C.J.R., 2003. Gold deposits in metamorphic
belts: overview of current understanding, outstanding problems, future research, and
exploration significance. Econ. Geol. 98, 1–29.
Groves, D.I., Goldfarb, R.J., Knox-Robinson, C.M., Ojala, J., Gardoll, S., Yun, G.,
Holyland,P., 2000. Late-kinematic timing of orogenic gold deposits and significance
for computer-based exploration techniques with emphasis on the Yilgarn block,
Western Australia. Ore Geol. Rev. 17, 1–38.
Groves, D.I., Goldfarb, R.J., Gebre-Mariam, M., Hagemann, S.G., Robert, F., 1998. Orogenic
gold deposits: a proposed classification in the context of their crustal distribution and
relationship to other gold deposit types. Ore Geology Reviews 13, 7–27.

Page 160
Hacker, B.R., Kelemen, P.B., Behn, M.D., 2015. Continental lower crust. Annual Review of
Earth and Planetary Sciences 43, 167–205.
Harpum, J.R., 1970. Summary of the geology of Tanzania: structure and geotectonics of the
Precambrian. Tanzania Geol. Surv. Mem. 1 Part V, 58 pp.
Hayman, P. C., Thébaud, N., Pawley, M. J., Barnes, S. J., Cas, R. A. F., Amelin, Y., Pegg, I.,
2015. Evolution of a ~2.7Ga large igneous province: A volcanological, geochemical
and geochronological study of the Agnew Greenstone Belt, and new regional
correlations for the Kalgoorlie Terrane (Yilgarn Craton, Western Australia).
Precambrian Research 270, 334-368
Hirose K, Kushiro I. 1993. Partial melting of dry peridotites at high pressures: determination
of compositions of melts segregated from peridotite using aggregates of diamond. Earth
Planet. Sci. Lett. 114, 477–89.
Hofmann, A., Dirks, P.H.G.M. and Jelsma, H.A., 2001a. Late Archaean foreland basin
deposits, Belingwe greenstone belt, Zimbabwe. Sedimentary Geology, 141-142, 131-
168.
Hofmann, A., Dirks, P.H.G.M. and Jelsma, H.A., 2001b. Horizontal tectonic deformation
geometries in a late Archaean sedimentary sequence, Belingwe greenstone belt, Zimbabwe.
Tectonics, 20, 909-932.
Jackson, S.E., Pearson, N.J., Griffin, W.L., Belousova, E.A., 2004. The application of laser
ablation-inductively coupled plasma-mass spectrometry to in situ U-Pb zircon
geochronology. Chemical Geology 211, 47–69.
Jayananda, M., Martin, H., Peucat, J.J., Mahabaleswar, B., 1995. Late Archaean crust-mantle
interactions in the Closepet granite, Southern India: evidence from Sr–Nd isotopes,
major and trace element geochemistry. Contributions to Mineralogy and Petrology 119,
314–29.
Jelsma, H.A., Dirks, P.H.G.M., 2002. Neoarchaean tectonic evolution of the Zimbabwe
Craton. In: C.M.R. Fowler, C. Ebinger and C.J. Hawkesworth (Editors), The Early
Earth: Physical, Chemical and Biological Development. Geological Society of London
Special Publication, 199, 183–211.
Jelsma, H.A., Vinyu, M.L., Valbracht, P.J., Davies, G.R., Wijbrans, J.R., Verdurmen, E.A.T.,
1996. Constraints on Archaean crustal evolution of the Zimbabwe Craton: a U-Pb
zircon, Sm-Nd and Pb-Pb whole-rock isotope study. Contrib Mineralogy Petrology
124,55–70

Page 161
Jochum, K.P., Stoll, B., Herwig, K., et al., 2006. MPI-DING reference glasses for in situ
microanalysis: new reference values for element concentrations and isotope ratios.
Geochemistry, Geophysics, Geosystems 7.
Kabete, J.M., Groves, D.I., McNaughton, N.J., Mruma, A.H., 2012a. A new tectonic and
temporal framework for the Tanzanian Shield: implications for gold metallogeny and
undiscovered endowment. Ore Geology Reviews 48, 88–124.
Kabete, J.M., McNaughton, N.J., Groves, D.I., Mruma, A.H., 2012b. Reconnaissance
SHRIMP U–Pb zircon geochronology of the Tanzania Craton: Evidence for
Neoarchean granitoid–greenstone belts in the Central Tanzania Region and the
Southern East African Orogen. Precambrian Research 216 – 219, 232– 266.
Kamber, B.S., Ewart, A., Collerson, K.D., Bruce, M.C., McDonald, G.D., 2002. Fluid-mobile
trace element constraints on the role of slab melting and implications for Archean
crustal growth models. Contributions to Mineralogy and Petrology 144, 38–56
Kay, R.W., 1978. Aleutian magnesian andesites: melts from subducted Pacific Ocean crust.
Journal of Volcanology and Geothermal Research 4, 117–132.
Kelemen, P.B., K. Hanghøj, and A.R. Greene 2003. One view of the geochemistry of
subduction-related magmatic arcs with an emphasis on primitive andesite and lower
crust, in The Crust, (R.L. Rudnick, ed.), Vol. 3, Treatise on Geochemistry, (H.D.
Holland and K.K. Turekian, eds.), Elsevier-Pergamon, Oxford, 593-659,
Kemp, A. I. S., Foster, G. L., Schersten, A., Whitehouse, M. J., Darling, J., Storey, C., 2009.
Concurrent Pb–Hf isotope analysis of zircon by laser ablation multi-collector ICP-MS,
with implications for the crustal evolution of Greenland and Himalayas. Chem. Geol.
261, doi:10.1016/j.chemgeo.2008.1006.1019.
Kerrich, R., 1989. Shear zone hosted mesothermal gold deposits; a review of geochemical
evidence on the source of fluids and solute, In J. T.Bursnall (Editor), Mineralization
and Shear zones. Geological association of Canada. Short Course Notes, 6,129 - 197.
Kerrich, R., Goldfarb, R.J., Groves, D.I., Garwin, S., 2000. The geodynamics of world-class
gold deposits: characteristics, space-time distribution, and origins. In: Hagemann, S.G.,
Brown, P.E. (Eds.), Gold in 2000. Reviews in Economic Geology, 13. Society of
Economic Geologists, Boulder, Colorado, pp. 501–551
Kloppenburg, A., White, S.H., Zegers, T.E., 2001. Structural evolution of the Warrawoona
Greenstone Belt and adjoining granitoid complexes, Pilbara Craton, Australia:
implications for Archaean tectonic processes. Precambrian Research 112, 107–147.

Page 162
Kogiso T., Hirschmann M.M., Petermann M., 2004. High-pressure partial melting of mafic
lithologies in the mantle. Journal of Petrology 45, 2407-2422.
Krapez, B., 2008. Stratigraphic analysis of the Geita Mine Sequence. Geita GoldMine
internal report — unpublished.
Krapez, B., Barley, ME., Pickard, A.L., 2003. Hydrothermal and resedimented origins of the
precursor sediments to banded iron formations: sedimentological evidence from the
early.Palaeoproterozoic Brockman Supersequence of Western Australia.
Sedimentology 50, 979–1011.
Kuehn, S., Ogola, J., Sango, P., 1990. Regional setting and nature of gold mineralization in
Tanzania and southwest Kenya. Precambrian Research 46, 71-82.
Kusky, T.M., 1998. Tectonic setting and terrane accretion of the Archean Zimbabwe Craton.
Geology, 26, 163–166.
Kwelwa, S., Manya, S., Vos, I.M.A., 2013. Geochemistry and petrogenesis of intrusions of
the Golden Pride gold deposit in the Nzega Greenstone Belt, Tanzania. African Journal
of Earth Sciences, 86, 53-64.
Leahy, A., Barnicoat, A.C., Foster, R.P., Lawrence, S.R., Napier, R.W., 2005. Geodynamic
processes that control the global distribution of gold deposits. In: McDonald, I., Boyce,
I., Butler, I.B., Herrington, R.J., Polya, D.A. (Eds.), Mineral Deposits and Earth
Evolution: Geol. Soc. London, Spec. Publ., 248, pp. 119–132.
Likhoidov, G.G., Plyusnina, L.P., Shcheka, Zh.A., 2007. The behavior of gold during
listvenitization: experimental and theoretical simulation. Dokl. Earth Sci. 415, 723–
726.
Lin. S., Beakhouse, G.P., 2013. Synchronous vertical and horizontal tectonism at late stages
of Archean cratonization and genesis of Hemlo gold deposit, Superior craton, Ontario,
Canada. Geology 41, 359–362.
Lisle, R. J., 1987. Principal stress orientations from faults: an additional constraint. Annales
Tectonic 1, 155-158.
Ludwig, K.R., 2003. User’s Manual for Isoplot 3.00. A Geochronological Toolkit for
Microsoft Excel. Berkley Geochronology Centre Special Publication No.4.
Macpherson, C.G., Dreher, S.T., Thirwall, M.F., 2006. Adakites without slab melting: high
pressure processing of basaltic island arc magma, Mindanao, the Philippines. Earth and
Planetary Science Letters 243, 581–593.
Page 163
Manikyamba C., Kerrich R. 2012. Eastern Dharwar Craton, India: continental lithosphere
growth by accretion of diverse plume and arc terranes. Geoscience Frontiers 3, 225–
240.
Manikyamba, C., Kerrich, R., Khanna, T.C., Subba Rao, D.V., 2007. Geochemistry of
adakites and rhyolites from the Neoarchaean Gadwal greenstone belt, Eastern Dharwar
craton India: implications for sources and geodynamic setting. Canadian Journal of
Earth Sciences 44, 1517–1535.
Manya, S., Kobayashi, K., Maboko, M.A.H., Nakamura, E., 2006. Ion microprobe zircon U-
Pb dating of the late Archean metavolcanics and associated granites of the Musoma-
Mara Greenstone Belt, Northeast Tanzania: Implications for the geological evolution of
the Tanzanian Craton. Journal of African Earth Sciences 45, 355-366.
Manya, S., Maboko, M. A. H., 2003. Dating basaltic volcanism in the Neoarchaean
Sukumaland Greenstone Belt of the Tanzania Craton using the Sm–Nd method:
implications for the geological evolution of the Tanzania Craton. Precambrian Research
121, 35-45.
Manya, S., Maboko, M.A.H., 2008. Geochemistry of the Neoarchean mafic volcanic rocks of
the Geita area, NW Tanzania: implications for stratigraphical relationships in the
Sukumaland Greenstone belt. Journal of African Earth Sciences 52, 152–160.
Manya, S., Maboko, M.A.H., Nakamura, E., 2007. Geochemistry of high-Mg andesite and
associated adakitic rocks in the Musoma-Mara greenstone belt, northern Tanzania:
possible evidence for Neoarchaean ridge subduction?’’. Precambrian Research 159,
241–259.
Marrett, R. A., Allmendinger, R.W., 1990. Kinematic analysis of fault-slip data. Journal of
Structural Geology 12, 973-986.
Martin, H., 1999. The adakitic magmas: modern analogues of Archaean granitoids. Lithos 46
(3), 411–429.
Martin, H., Moyen, J.F., Rapp, R.P., 2010. The sanukitoid series: magmatism at the
Archaean-Proterozoic transition. Earth and Environmental Science. Transactions of the
Royal Society of Edinburgh 100 (1–2), 15–33.
Martin, H., Smithies, R.H., Rapp, R., Moyen, J.F., Champion, D., 2005. An overview of
adakite, tonalite–trondhjemite–granodiorite (TTG), and sanukitoid: relationships and
some implications for crustal evolution. Lithos 79, 1–24.

Page 164
McCuiag, T.C., Kerrich, R., 1998. P-T-t-deformation-fluid characteristics of lode gold
deposits: evidence from alteration systematic. Ore Geology Reviews12, 381 - 453.
Mikkola, P., Heilimo, S., Huhma, H., 2014. Relationships between Sanukitoids and crust-
derived melts and their implications for the diversity of Neo-archaean granitoids: A
case study from Surmansuo and nearby areas, Eastern Finland. Bulletin of Geological
Society of Finland, 86, 23-40.
Mohan, M.R., Piercey, S.J., Kamber, B.S., Sarma, D.S., 2013. Subduction related tectonic
evolution of the Neoarchean eastern Dharwar Craton, southern India: new geochemical
and isotopic constraints. Precambrian Research 227, 204–226.
Molnar, P., 1983. Average regional strain due to slip on numerous faults of different
orientations. Journal of Geophysical Research 88, 6430-6432.
Moyen, J. F., 2011. The composite Archaean grey gneisses: petrological significance, and
evidence for a non-unique tectonic setting for Archaean crustal growth. Lithos 123, 21-
36.
Moyen, J.-F., 2009. High Sr/Y and La/Yb ratios: The meaning of the “adakitic signature”.
Lithos 112, 556–574.
Moyen, J.-F., Martin, H., 2012. Forty years of TTG research. Lithos 148, 312–336
Moyen, J.F., Stevens, G., Kisters, A.F.M., 2006. Record of mid-Archaean subduction from
metamorphism in the Barberton terrain, South Africa. Nature 442, 559–562.
Mshiu, E.E., and Maboko, M.A.H., 2012. Geochemistry and petrogenesis of the late
Archaean high-K granites in the southern Musoma-Mara Greenstone Belt: Their
influence in evolution of Archaean Tanzania Craton. Journal of African Earth Sciences
66, 1-12.
Mtoro, M., Maboko, M.A.H., Manya, S., 2009. Geochemistry and geochronology of the
bimodal volcanic rocks of the Suguti area in the southern part of the Musoma-Mara
Greenstone Belt, Northern Tanzania. Precambrian research 174, 241-257.
Munker, C, Worner, G., Yogodzinski, G., Churikova, T., 2004. Behaviour of high field
strength elements in subduction zones: constraints from Kamchatka–Aleutian arc lavas.
Earth and Planetary Science Letters. 224, 275– 293
Ojala, J.V., Ridley, J.R., Groves, D.I., Hall, G.C., 1993. The Granny Smith gold deposit: the
role of heterogeneous stress distribution at an irregular granitoid contact in a
greenschist facies terrane. Miner. Deposita 28, 409–419.

Page 165
Paces, J.B., Miller, J.D., 1993. Precise U–Pb ages of the Duluth Complex and related mafic
intrusions, northeastern Minnesota: geochronological insights to physical, petrogenetic,
paleomagnetic, and tectonomagmatic processes associated with the 1.1 Ga
midcontinent rift system. Journal of Geophysical Research 98, 13997–14013.
Painter, M., 2004. Mineralization and structural architecture of the Geita Hill Shear Zone.
Geita Gold Mine Internal Report.
Passchier, C. W., Trouw, R. A. J., 2006. Microtectonics, 2nd ed. Springer-verlag, New York,
Berlin, Heidelberg, 362pp.
Percival, J.A., Stern, R.A., Skulski, T., 2001. Crustal growth through successive arc
magmatism: reconnaissance U–Pb SHRIMP data from the northeastern Superior
Province, Canada. Precambrian Research 109, 203–238.
Peterson, M. E.,A. E. Saal,E. Nakamura,H. Kitagawa,M. D. Kurz, and A. M., Koleszar.,
2014.Origin of the “ghost plagioclase” signature in Galapagos melt inclusions: New
evidence from Pb isotopes.Journal of Petrology, 55, 2193–2216.
Peterson, V.L., Zaleski, E., 1999. Structural history of the Manitouwadge greenstone belt and
its volcanogenic Cu-Zn massive sulphide deposits, Wawa subprovince, south-central
Superior Province. Can J Earth Sci 36,605–625
Phillips, G.N., Powell, R., 2010. Formation of gold deposits: a metamorphic devolatilization
model. J. Metamorph. Geol. 28, 689–718.
Phillips, G.N., Zhou, T., 1999. Gold-only deposits and Archean granite. Soc. Econ. Geol.
Newsl. 37 April 1999.
Polat, A., Kerrich, R., 2001. Magnesian andesites, Nb-enriched basalt–andesites, and adakites
from late-Archean 2.7 Ga Wawa greenstone belts, Superior Province, Canada:
implications for late Archean subduction zone petrogenetic processes. Contributions to
Mineralogy and Petrology 141 (1), 36–52.
Polat, A., Kerrich, R., Wyman, D.A., 1998. The late Archean Schreiber–Hemlo and White
River–Dayohessarah greenstone belts, Superior Province: collages of oceanic plateaus,
oceanic arcs, and subduction–accretion complexes. Tectonophysics, 289, 295-326.
Porter, C.W.P., 2002. Structural analysis and target generation Kukuluma-Matandani Area,
Geita Greenstone Belt, Tanzania. Internal company report.
Quennell, A.M., McKinley, A.C.M., Aiken, W.G., 1956. Summary of the geology of
Tanganyika: introduction and stratigraphy. Tanganyika Geol. Surv. Mem. 1 (Pt. 1) 264
pp.

Page 166
Rapp, R.P., Shimizu, N., Norman, M.D., Applegate, G.S., 1999. Reaction between slab-
derived melts and peridotite in the mantle wedge: experimental constraints at 3.8 GPa.
Chemical Geology 160, 335–356.
Richards, J. P., Kerrich, R., 2007. Adakite-like rocks: their diverse origins and questionable
role in metallogenesis. Economic Geology 102, 537–576.
Ridley, J.R., Mikucki, E.J., Groves, D.I., 1996. Archaean lode gold deposit: fluid-flow and
chemical evolution in vertically extensive hydrothermal systems. Ore Geology
Reviews, 10, 279-293.
Robert, F., Sheahan, P.A., Green, S.B., 1991. Greenstone Gold and Crustal Evolution.
Publication of the Mineral Deposits Division, Geological Association of Canada, pp. 1–
252.
Romick, J.D., Kay, S.M., Kay, R.M., 1992. The influence of amphibole fractionation on the
evolution of calc-alkaline andesite and dacite tephra from the central Aleutians, Alaska.
Contributions to Mineralogy and Petrology 112, 101–118.
Rooney, T.O., Franceschi, P., Hall, C.M., 2011. Water-saturated magmas in the Panama
Canal region: a precursor to adakite-like magma generation? Contributions to
Mineralogy and Petrology 161, 373-388.
Rudnick, R. L., Gao S., 2003. Composition of the continental crust. See Holland & Turekian
2003, pp. 1–64
Rudnick, R.L., 1995. Making continental crust. Nature 378, 573–578.
Ryerson, F. J., Watson, E. B., 1987. Rutile saturation in magmas: Implications for Ti–Nb–Ta
depletion in island-arc basalts. Earth and Planetary Science Letters 86, 225–239.
Sanislav, I. V., Brayshaw, M., Kolling, S. L., Dirks, P. H. G. M., Cook, Y. A. and
Blenkinsop, T., 2016. The structural history and mineralization controls of the world-
class Geita Hill gold deposit, Geita Greenstone Belt, Tanzania. Mineralium Deposita
(10.1007/s00126-016-0660-1)
Sanislav, I.V., Kolling, S.L., Brayshaw, M., Cook, Y.A., Dirks, P.H.G.M., Blenkinsop, T.G.,
Mturi, M.I., Ruhega, R., 2015. The geology of the giant Nyankanga gold deposit, Geita
Greenstone Belt, Tanzania. Ore Geology Reviews 69, 1-16.
Sanislav, I.V., Wormald, R.J., Dirks, P.H.G.M., Blenkinsop, T.G., Salamba, L., Joseph, D.,
2014. Zircon U–Pb ages and Lu–Hf isotope systematics from late-tectonic granites,
Geita greenstone belt: implications for crustal growth of the Tanzania craton.
Precambrian Res. 242, 187–204.

Page 167
Seward, T. M., 1991. The hydrothermal geochemistry of gold, In: Foster, R. P. (Ed), Gold
Metallogeny and exploration. Blackie, pp 37 - 62.
Seward, T.M., 1973. Thio complexes of gold and the transport of gold in hydrothermal ore
solutions. Geochim. Cosmochim. Acta 37, 379–399.
Shackleton, R.M., 1995. Tectonic evolution of greenstone belts. In: Coward, M.E., Ries, A.C.
(Eds.), Early Precambrian Processes, Special Publications 95. Geological Society,
London, pp. 53–65.
Shenberger, D. M., Barnes. H. L., 1989.Solubility of gold in aqueous sulphide solutions from
150 to 3500C. Geochim.Cosmochim.Acta 53, 269 - 278.
Shirey, S. B., Hanson, G. N., 1984. Mantle derived Archaean monzodiorites and
trachyandesites. Nature 310, 222–4.
Sibson, R.H., 2001. Principles of structural control on permeability and fluid flow in
hydrothermal systems. In: Richards, J.P., Tosdal, R.M. (Eds.), Structural Controls on
Ore Genesis. Reviews in Economic Geology, 14. Society of Economic Geologists,
Boulder, Colorado, pp. 25–50.
Sibson, R.H., 2004. Controls on maximum fluid overpressure defining conditions for
mesozonal mineralization. Journal of Structural Geology 26, 1127–1136.
Skead, M.B., 2003. Geology and Structure of the Kukuluma Deposit, Geita Greenstone Belt,
Tanzania. Company confidential report.
Soderlund, U., Patchett, P.J., Vervoort, J.D., Isachsen, C.E., 2004. The 176Lu decay constant
determined by Lu–Hf and U–Pb isotope systematics of Precambrian mafic intrusions.
Earth Planet. Sci. Lett. 219, 311–324.
Spandler, C., Pettke, T., Rubatto, D., 2011. Internal and external fluid sources for eclogite-
facies veins in the Monviso meta-ophiolite, Western Alps: Implications for fluid flow in
subduction zones. Journal of Petrology 52, 1207–1236.
Sperner, B., Müller, B., Heidbach, O., Delvaux D., Reinecker, J., Fuchs, K., 2003. Tectonic
stress in the Earth’s crust: advances in the world stress map project. in: Nieuwland,
D.A. (Ed.), New insights into structural interpretation and modelling. Geological
Society of London Special Publication 212, 101-116.
Stalder, R., Foley, S.F., Brey, G.P., Horn, I., 1998. Mineral aqueous fluid partitioning of trace
elements at 900-1200 degrees C and 3.0-5.7 GPa: New experimental data for garnet,
clinopyroxene, and rutile, and implications for mantle metasomatism. Geochimica et
Cosmochimica Acta 62, 1781-1801.

Page 168
Stern, R. A., Hanson, G. N., Shirey S. B., 1989. Petrogenesis of mantle-derived, LILE-
enriched Archaean monzodiorites and trachyandesites (sanukitoids) in southwestern
Superior Province. Canadian Journal of Earth Sciences, 26, 168- 171.
Stockley, G.M., 1936. Geology of the south and south-western region of Musoma District.
Tanganyika Geol. Surv. Short Pap., 13.
Sun, S. S., McDonough, W. F., 1989. Chemical and isotopic systematics of oceanic basalts:
implications for mantle composition and processes. In: Saunders, A.D., Norry, M.J.
(Eds.), Magmatism in the Ocean Basins. Geol. Soc. London, London, pp. 313–345.
Sun, Shen-SU., Nesbitt, R.W., 1978. Petrogenesis of Archaean ultrabasic and basic volcanics:
evidence from the rare earth elements. Contributions to Mineralogy and Petrology 65,
301-325.
Tatsumi, Y, and Ishizaka, K., 1981. Existence of andesitic primary magma: An example from
Southwest Japan. Earth and Planet Science Letters 53, 124-130.
Tatsumi, Y., 2006. High-Mg Andesites in the Setouchi Volcanic Belt, Southwestern Japan:
Analogy to Archean Magmatism and Continental Crust Formation? Annu Rev Earth
Planet Sci, 34, 467―499.
Tatsumi, Y., 2008. Making continental crust: the sanukitoid connection. Chinese Science
Bulletin 53 (11), 1620–1633.
Taylor, S. R. and McLennan, S. M., 1995. The Geochemical Evolution of the Continental
Crust Reviews of Geophysics 22-2, 241-265.
Thiessen, R. L., 1986. Two-dimensional refold interference patterns. J. Struct. Geol. 8, 563-
573.
Thirlwall M. F., Smith T. E., Graham A. M., Theodorou N., HollingsbP., Davidson J. P., and
Arculus R. J., 1994. High field strength element anomalies in arc lavas: source or
process? Journal of Petrology 35, 819–838.
Tiepolo, M., Oberti, R., Zanetti, A., Vannucci, R., Foley, S., 2007. Trace-element partitioning
between amphibole and silicate melt. In: Hawthorne, F.C., Oberti, R., Ventura, G.D.,
Mottana, A. (Eds.), Amphiboles: Crystal Chemistry, Occurrence, and Health Issues:
Mineralogical Society of America and Geochemical Society, Reviews in Mineralogy
and Geochemistry, 67, pp. 417–452.
Tripp, G.I., Vearncombe, J.R., 2004. Fault/fracture density and mineralization: a contouring
method for targeting in gold exploration. Journal of Structural Geology 26, 1087–1108.

Page 169
Tulloch, A.J., Kimbrough, D.L., 2003. Paired plutonic belts in convergent margins and the
development of high Sr/Y magmatism: Peninsular Ranges batholith of Baja- California
and Median batholith of New Zealand. Geological Society of America Special Paper
374, 1–21.
Twiss, R.J., Unruh, J.R., 1998. Analysis of fault slip inversions: Do they constrain stress or
strain rate? Journal of Geophysical Research 101, 8335-8361.
van Achterbergh E., Ryan C.G., Jackson S.E., Griffin, W.L., 2001. Data reduction software
for LA-ICP-MS. In: Sylvester P (ed) Laser-ablation-ICPMS in the earth sciences:
principles and applications. Mineralogical Association of Canada, Short Course 29, pp
239–243.
van Kranendonk, M.J., 2011. Cool greenstone drips and the role of partial convective
overturn in Barberton Greenstone Belt evolution. Journal of African Earth Sciences 60,
346–352.
van Westeren, W., Blundy, J., Wood, B., 1999. Crystal-chemical controls on trace element
partitioning between garnet and anhydrous silicate melt. American Mineralogist 84,
838–847.
Vlaar, N.J., van Keken, P.E., van den Berg, A.P., 1994. Cooling of the Earth in the Archaean:
Earth and Planetary Science Letters, v. 121, p. 1–18.
Wang, Q., McDermott, F., Xu, J.F., Bellon, H., Zhu, Y. T., 2005. Cenozoic K-rich adakitic
volcanic rocks in the Hohxil area, northern Tibet: lower-crustal melting in an
intracontinental setting. Geology 33, 465–468.
Weinberg, R.F., van der Borgh, P., 2008. Extension and gold mineralization in the Archaean
Kalgoorlie Terrane, Yilgarn Craton. Precambrian Res 161, 77–88
Wiedenbeck, M., Allé, P., Corfu, F., Griffin, W.L., Meier, M., Oberli, F., von Quadt, A.,
Roddick, J.C., and Spiegel, W., 1995. Three natural zircon standards for U-Th-Pb, Lu-
Hf, trace element and REE analyses. Geostandards Newsletter, 19, 1-23.
Wiedenbeck, M., Allé, P., Corfu, F., Griffin, W.L., Meier, M., Oberli, F., von Quadt, A.,
Roddick, J.C., Spiegel, W., 1995. Three natural zircon standards for U-Th-Pb, Lu-Hf,
trace element and REE analyses. Geostandards Newsletter, 19, 1-23
Windley, B.F., 1995. The Evolving Continents, 3rd ed. John Wiley, Chester, 526 pp.
Wood, D.A., Gibson, I.L., Thompson, R.N., 1976. Elemental mobility during zeolite facies
metamorphism of the Tertiary basalts of eastern Iceland. Contributions to Mineralogy
and Petrology 55, 241-254.

Page 170
Woodhead J., Eggins S., Gamble J., 1993. High field strength and transition element
systematics in island arc and back-arc basin basalts: Evidence for multi-phase
extraction and a depleted mantle wedge. Earth Planet. Sci. Lett. 114, 491–504.
Zegers, T.E., van Keken, P.E., 2001. Middle Archean continent formation by crustal
delamination. Geology 29, 1083–108.
Zegers, T.E., White, S.H., de Keyzer, M. and Dirks, P.H.G.M., 1996. Extensional structures
during deposition of the 3460 Ma Warrawoona Group in the eastern Pilbara Craton,
Western Australia. Precambrian Research 80, 89-105
Zeh, A., Gerdes, A., Barton, J.M., Jr., 2009. Archean accretion and crustal evolution of the
Kalahari Craton—the zircon age and Hf isotope record of granitic rocks from
Barberton/Swaziland to the Francistown Arc. Journal of Petrology 50, 933–966.

Page 171
APPENDICES
Appendix 1. Map resources used
In the course of this study the following historical maps were used in the construction
of figures, stratigraphic columns and sections:
Previous regional geological mapping conducted in the Matandani-Kukuluma area;
a) Mapping done during the initial exploration phase with maps held in the Geita Gold
Mine database;
(1) Geological map compiled by Hatari Mjinja in 2006
(2) Geological map compiled by Hatari Mjinja in 2005
(3) Geological map compiled by Hatari Mjinja in 2004
(4) Geological map compiled by Hatari Mjinja in 2003
b) Geological mapping done during the PhD by contractor staff;
(1) Geological map of the Kukuluma access road compiled by Tom Blenkinsop in
2011.
(2) Geological map of the Matandani pit compiled by Ioan Sanislav in 2011
(3) Geological map of the Kukuluma pit compiled by Ioan Sanislav in 2011
(4) Geological map of the Kukuluma pit compiled by Mathew Brayshaw in 2013
(5) Geological map of the Kukuluma pit compiled by Paul Dirks in 2011
c) Regional geological mapping of the Kukuluma terrain including Matandani and
Kukuluma pits by Shimba Kwelwa in the period from 2013-2014.
Geophysical datasets used in the compilation of the geological map for the Kukuluma terrain
include:
(a) U (red) –Th (blue) – K (white) radiometric map.
(b) Aeromagnetic map (xcal_amf_avg1) showing the iron-rich lithologies as
magnetic highs
Examples of various map types are displayed in Figure A1.1
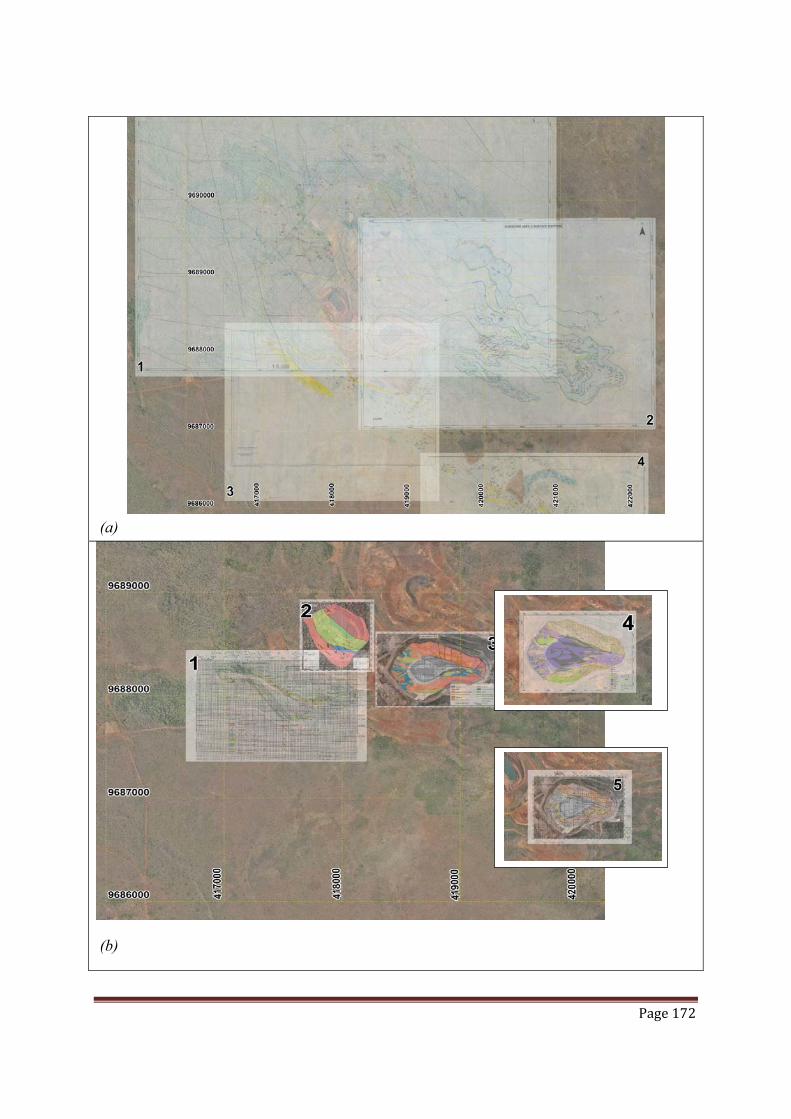
Page 172
(a)
(b)

Page 173
(d)
(c )

Page 174
(e) Figure A1.1. Examples of various types of maps used in the compilation of data presented in this thesis. (a) historical map coverage across the area of interest; (b) and (c) maps of Matendai and Kukuluma pits produced during this study; (d)radiometric map across the area; (e) aeromagneti map across the area.
Using these various data sets together with new mapping and drill core logging, the following
geological maps were produced during this study (e.g. Figs 1.3a and b).
1. A regional geological map of the Kukuluma terrain compiled from historical
mapping, drill core information, geophysical datasets and mapping by Shimba
Kwelwa in 2013-2015 (Fig.1.3a).
2. Detailed geological map of the Matandani and Kukuluma pits compiled from
historical mapping, drill core information and mapping by Shimba Kwelwa in 2013-
2015 (Fig. 1.3b).

Page 175
Appendix 2. Comparison of new stratigraphic units with historical log
data
Based on analyses of lithological units in drill hole, the stratigraphy can be condensed into 5 volcano-sedimentary units and 4 main types of intrusive lithologies. Summaries for these various lithologies and comparisons to their historical names and logging codes are presented in Table A2.1. Historical names/ codes Standardized nomenclature and descriptions Thickness in drill cores(m)
VOLCANO-SEDIMENTARY UNITS
• Black shale with arsenopyrite nodules (BSHAsP),
• Graphitic black shale (BSHG), Pyritic black shale nodules (BSHP),
• Black shale with pyrrhotite nodules (BSHPr),
• Carbonaceous pelite (CP), Carbonaceous shales (CSH or SHC),
• Graphitic shale (SHG), • Pyritic black shales
(SHPN) • Shale (SH)
Black shale • Very fine grained, dark coloured rock. • Sometimes contains pyrrhotite ± pyrite nodules,
which are syn-sedimentary or early-diagenetic features.
• Occurs near the stratigraphic base of the volcano-sedimentary units.
Few cm -14m
• Banded Iron Formation (BIF),
• BIF-Chemical (BIFC), • Oxide Facies BIF
(BIFO), • BIF Undefined (BI) • BIF-Sedimentary (BIFS). • Chert (CH)
Ironstone • Dominated by variable thicknesses of chert-
magnetite interbands, ~15-30cm thick, with local thinner mudstone/shale units.
• Chlorite and grunerite do occur on the margins between chert and magnetite or chert and chloritic mudstone layers.
• Intra-formational conglomerates are observed within the Ironstones having dominantly chert ± mudstone clasts in a chloritised siltstone and /or mudstones matrix. These conglomeratic units occur as intraformational units, layer-parallel to the Ironstones. The clasts within them are randomly oriented whereas their boundaries are clearly layer parallel to Ironstone. Their thicknesses range from 3cm-53m as observed in the drill cores.
• Variable breccia zones are observed within the ironstones ranging from hydrothermal breccia associated with replacement textures with vein –networks, that cut the layering randomly. Some of the breccia zones are a result of reactivation of early intra-formational conglomerates associated with the emplacement of the intrusives and some are related to the hinge zones of the fold systems. Likewise, the thicknesses of this breccia vary from 1m – 30m thick.
Chert • These occur as relatively thinner layers or
massive to banded highly silicified laminated sedimentary units. Normally interbedded with ironstones.
Few cm – 70m
• Acidic tuff (AT), Volcaniclastics Few cm – 66m

Page 176
Table A2.1: Standardized nomenclature and descriptions for the volcano-sedimentary units and intrusive rocks found within the Kukuluma terrain, with comparisons to historical logging codes.
• Agglomerates (AG), • Crystal tuff (CT), • Intermediate tuff (IT), • Intermediate
Undifferentiated (IM) and
• Lithic tuff (LT)
• Fine–medium grained intermediate to felsic, layered unit.
• Composed of cherty-like fragments or glassy-shards possessing reaction rim-like structures.
• The shapes of the fragments are variable raging from angular, sub-rounded to ellipsoidal.
• Occassional chert layering parallel to the volcaniclastic layers is observed.
• The volcaniclastic package includes ignimbrites and tuffaceous sediments.
• Occurs interbanded with Ironstone. • BIF-Sedimentary (BIFS), • Greywacke (GWAC|), • Meta-Sandstones
(MetaSS), • Meta-psammite
(Metapsammite) • sandstones (SS).
Intercalated Chert-Siltstone • The package is associated with interlayered chert
and siltstone units. • The individual thicknesses of the chert layers and
siltstone are variable ranging from 3cm – 30cm. • In places, relatively narrow zones composed of
greywacke and mudstone are found to be intercalated with this package.
• Intense grunerite and chlorite alteration are visible in the siltstone unit.
Few cm- 37m
• Siltstones (ST), • Meta-siltstones
(MetaST), • sandstone units (SS) • mudstone units (MSS).
Siltstone • These are fine-grained sedimentary units with
local occurrences of sandstone. • The unit occurs interlayered with chert-siltstone
intercalations where the boundary between the two is gradational.
Few cm – 190m
INTRUSIVE UNITS • Andesite (AN), • Dacite (DA), • Diorite (DI), • Dolerite (DL), • Intermediate Tuff (IT), • Acidic tuff (AT), • Intermediate
undifferentiated (IM) • Sandstones (SS).
Diorite-Monzonite ± Tonalite • Medium- to fine-grained, intermediate coloured
unit. • Composed of plagioclases and hornblendes.
Occassional occurrence of a Tonalite in Area 3 West with an increased amount of quartz phenocrysts in it. However, an exact cross-cutting relationship with the Diorite is not recognized in the drill cores. The fact the Tonalite is also termed as quartz –diorite then this unit will be grouped as Diorite.
• These intrusives appear to cross-cut the volcano-sedimentary units in the Kukuluma terrain.
• It is chloritized and carbonate altered. The carbonate alteration is evidenced by intense randomly oriented vein networks.
• These intrusives form part of the Kukuluma Intrusive Complex (KIC).
6-115m
Felsic porphyry (FP) Granodiorite • This is an intermediate coloured, porphyritic
dyke. • Composed of plagioclase phenocrysts in a fine-
grained groundmass. Rarely, biotites are visible within the unit.
• This is the youngest intrusive unit in the area and cuts both the volcano-sedimentary units and the intrusive units.
2m

Page 177
A2.1 Volcano-sedimentary units
The volcano-sedimentary rocks in the Kukuluma terrain comprise 5 units, which,
from old to young include: black shale, ironstone, volcanoclastic sediment, intercalated chert-
siltstone and massive siltstone (Fig. 2.2).
The stratigraphically lowermost unit in the sequence is black shale, variably logged
as: black shale with arsenopyrite nodules (BSHAsP), graphitic black shale (BSHG), pyritic
black shale nodules (BSHP), black shale with pyrrhotite nodules (BSHPr), carbonaceous
pelite (CP), carbonaceous shales (CSH or SHC), graphitic shale (SHG), pyritic black shales
(SHPN) and shale (SH) (Table A2.1). The unit reaches a maximum thickness of ~14m in drill
core. The shale is generally only outcropping in areas that have been mined or have been
cleared for drilling and in places next to, or within intrusive margins.
A well-bedded ironstone unit overlies the graphitic shale (Fig. 2.2). Historically this
ironstone unit has been logged as Banded Iron Formation (BIF), BIF-chemical (BIFC), Oxide
Facies BIF (BIFO), BIF undefined (BI) and some as the BIF-Sedimentary (BIFS) (Table
A2.1). The ironstone package is widely distributed across the entire area (Fig. 1.3), and has a
distinct magnetic signature on geophysical data sets. Within the unit logged as ironstone,
lenses of intra-formational conglomerate are locally observed.
The ironstone unit is overlain by a volcaniclastic unit that reaches a maximum
thickness of 66 m in drill core (Fig.A3.1c). Historically this unit has been logged as Acidic
tuff (AT), Agglomerates (AG), Crystal tuff (CT), Intermediate tuff (IT), and Intermediate
Undifferentiated rock (IM) and Lithic tuff (LT) (Table A2.1). All the historical logging in the
database mentioned the tuffaceous nature of the rock.
In parts of Kukuluma pit, the ironstone unit transitions into an interbedded chert-
siltstone unit consisting of chert layers interbedded with sandstone-siltstone beds that vary in
thickness from 1.5 m to less than 10 cm thick (Fig. 3.8a). Historically, the chert-siltstone unit
has been logged as Siltstones (ST), Meta-siltstones (MetaST), sandstone (SS) and mudstone
(MSS). The maximum thickness of this unit in drill core is 30 m.
The intercalated chert-siltstone layers transitions into a massive siltstone Unit that
reaches a maximum thickness of 190m in drill core. Historically this unit has been logged as
BIF-Sedimentary (BIFS), Greywacke (GWAC), Meta-Sandstones (MetaSS), Meta-psammite
(Metapsammite) and sandstones (SS). This unit may be a lateral equivalent of the
volcanoclastic unit, and appears to be interlayered with volcanoclastic sediments; however,
they have been logged as a distinct lithostratigraphic package. The Chert-Siltstone and

Page 178
Siltstone Units are widely distributed in the area and occur as extremely weathered rock
previously mapped as tuffaceous sediment.
A2.2 Intrusive units
Four main types of intrusives were identified in drill core within the Kukuluma
terrain: diorite, monzonite, tonalite and granodiorite (see chapter 4 for details), however these
units are hard to differentiate in drill core. Therefore, diorite is the adopted name in this study
for the purpose of geological modeling. Units identified as diorite on geochemical grounds
(see Chapter 4) were historically logged as Andesite (AN), Dacite (DA), Diorite (DI),
Dolerite (DL), Intermediate Tuff (IT), Acidic tuff (AT), Intermediate undifferentiated (IM)
and Sandstones (SS) (Table A2.1).
Granodiorite dykes form a distinct set of intrusives in the Kukuluma terrain, and have
historically been logged as Felsic porphyry (FP) (Table A2.1).

Page 179
Appendix 3. Descriptions of type sections from drill core In this appendix, typical geological observations identified in drill core and used in 3-
D modelling are presented. A full analysis of the deformation and intrusive history of the area
as recognized in these drill holes, is presented in chapter 3. Summary diagrams of typical drill
core intersections for each of the three major deposits are shown in figure A3.1. Each of these
type sections from drill core are described below.
(a)
(b)
(c)
Fig. A3.1 Typical examples of relationships between lithologies, folds, shear zones, intrusions and mineralization as observed in drill core. (a) drill hole ID: MTRD0023 from Matandani pit; (b) drill hole ID: KKRD0002 from Kukuluma pit; (c) drill hole ID: AWDD0003 from Area 3 West pit. All the drill hole sketches are projected in the right orientation with respect to the drilling azimuths in the respective pits. Both are drawn looking north with respect to the Kukuluma Mine Grid.
A3.1 Matandani type stratigraphy from drill core ID: MTRD0023
A total of seven lithological units were identified during the re-logging exercise of
Matandani drill hole: MTRD0023 (Fig. A3.1a), which serves as a reference hole for the type

Page 180
stratigraphy in the Matandani Pit. These units are black shale, ironstones, volcaniclastics,
chert-siltstone intercalations, siltstones, diorites and granodiorite dyke.
From 495-605 m (~110m thick) ironstone is inter-bedded with both chert-siltstone
and intra-formational conglomerate (Fig. A3.1a). In this interval the ironstone unit appears
thicker (~30 m) in the hinge zone of a fold and progressively gets thinner (~10 m) towards
the limb zones. The Intra-formational conglomerates are locally brecciated due to folding.
These observations show that, there is considerable thickness variation in lithologies down-
hole and possibly along strike depending on the position of the lithological unit in a fold
system.
The drill core observation shows that, the diorite-ironstone contact is not intrusive.
The interface between the diorite and ironstone is occupied by black shale between 606 m
and 609 m. Over this interval, the black shale and the diorite are overprinted by a well-
developed shear fabric dipping steeply to the northeast (Fig. A3.1a). The shear fabric can be
traced for about 26 m into the diorite where it overprints early carbonate veins. Within the
first 5 m from the contact, the quartz-carbonate-pyrrhotite veins are rotated into parallelism
with the shear fabric. Assay results from the sheared diorite contact returned ~1 g/t Au.
Intense hydrothermal brecciation was observed within the diorite at 681-686 m. The diorite
fragments are randomly oriented in a carbonate dominated matrix. The carbonate matrix
contains minor amounts of disseminated pyrrhotite and arsenopyrite. Assay results indicate
1.11g/t Au at 681.5m within this hydrothermally brecciated zone in the diorite.
The black shale unit is in contact with strongly brecciated ironstone composed of
chert clasts in a black shale matrix with disseminated pyrrhotite. The clasts constitute 70% of
the total rock mass. The bedded ironstone next to this brecciated zone is well-layered, and
replacement of magnetite by pyrrhotite is common. Within the ironstone unit, a relatively
weak shear fabric is observed. However, a complex network of fractures and veins which are
in-filled by silica-pyrrhotite-arsenopyrite ± carbonate ± chlorite are observed. The assay
results over this interval returned an average of ~ 2.5g/t Au. The higher gold values (> 3.0g/t
Au) are found within ironstone that is highly fractured, intensely silicified, and where the
magnetite is completely replaced by pyrrhotite. Intra-formational conglomerate, inter-layered
with ironstone has low gold values < 0.5 g/t Au.
Apart from the main shear zone at the diorite-ironstone contact, a subordinate shear
zone is developed through the hinge zones of a prominent fold observed in the drill core at
422-440 m (~ 18 m thick; Fig. A3.1a). This shear zone overprints the granodiorite dyke

Page 181
which cuts through the folded sequence. The plagioclase phenocrysts and the groundmass of
the granodiorite dyke show a preferred orientation which is parallel to the shear fabric. Where
the shear zone cuts across ironstone and volcanoclastics a well-developed shear fabric is
observed.
From 420 m to 600 m the hole contains a ~180 m thick mineralized zone bounded by
two shear zones (Fig. A3.1a). However, gold mineralization is not uniformly distributed and
most of the high grade gold is concentrated in ironstone layers while the chert-siltstone,
volcaniclastic and intra-formational conglomerates units record low gold values (<0.5g/t Au).
A3.2 Kukuluma type stratigraphy from drill core ID: KKRD0002
Five rock units were identified in drill hole KKRD0002, which serves as a reference
hole for the stratigraphy in Kukuluma pit, including: black shale, ironstone, volcanoclastics,
chert-siltstone and diorite.
The diorite and ironstone units are never in direct contact in this hole. Instead they are
everywhere separated by a thin layer of strongly sheared black shale. The shear fabric dips
steeply northeast. The first 2 meters of diorite is also foliated (Fig. A3.1b). This shear zone is
~ 13 m thick down the hole and can be observed from 396-410 m. It is associated with
intense carbonate alteration. Within the diorite, zones of hydrothermal breccia (example at
458 m) with a carbonate rich matrix can be found.
The ironstone that overlies the sheared black shale unit is only weakly sheared. In
general the ironstone is well-layered with pyrrhotite replacing magnetite. An intense network
of micro-fractures that are in-filled by pyrrhotite-carbonate veins is observed at 372-396 m.
These micro-fracture networks are better observed in the chert layers where they are in-filled
by pyrrhotite. The whole zone is intensely silicified. These micro-fractures indicate normal
movement based on the displacement of the ironstone layers. Locally, within the ironstone
unit the micro-fractures interconnect and form brecciated zones. It is within these intensely
fractured zones that high gold values have been recorded.
Between 260-266m, a zone of moderately silicified and chloritized ironstone was
observed. The ironstone preserves chert-magnetite layering. Minor amount of pyrrhotite has
replaced the magnetite layers. The amount of micro-fracture development within this zone is
minimal and the micro-fractures cut across the layering at right angles. These micro-fractures
are in-filled with pyrrhotite. The gold grade within this zone is ~ 0.51g/t Au. This zone
appears to be located within the hinge zone of a fold (Fig. A3.1b).

Page 182
General observations from this drill core show that, high grade gold mineralization is
localized in ironstones that are highly fractured and intensely silicified, carbonate altered and
well supplied with disseminated pyrrhotite and arsenopyrite. Spatially, the ironstones appear
to occur closely to the sheared diorite contact in a complexly folded pattern. The relatively
lower grade gold values are found in ironstones within folded domains not linked to any clear
shear zone or diorite contact, and in the chert-siltstones and volcanoclastics that appear to be
spatially associated with the shear zone or the sheared diorite contact (Fig. A3.1b).
A3.3 Area 3 West type stratigraphy from drill core: AWDD0003
Four lithological units were identified during logging in drill hole AWDD0003, which
is taken as a type section for the Area 3 West area. These are black shale, ironstones,
volcaniclastics and diorite. The geology along the drill hole shows complex fold interferences
as seen at 238-270 m (Fig. A3.1c). Within this folded zone, a volcaniclastic package (~32 m
thick) intercalated with a relatively thin (~2 m thick) pyrrhotite-nodules-rich black shale is
observed. Within the volcaniclastic unit, a ~22m thick, hydrothermal breccia zone was
observed that spatially occurs along the hinge zone of the fold system. This observation
shows that, there is a connection between the formation of breccia and the hinge zone of the
fold system. These breccia zones appear to be steeply dipping at 80° to the west (Fig. A3.1c).
Similar hydrothermal breccia zones were observed at 148-160 m within the hinge zone of a
fold in volcaniclastics. This breccia zone shows volcaniclastic fragments in a quartz-
carbonate matrix with disseminated pyrrhotite grains. The thickness of the volcanoclastic
unit varies from the hinge zones where it is thicker to the the limb zone where it thins out.
The diorite-volcaniclastic contact is intrusive with the diorite truncating layering. This
contact is overprinted by a weak foliation that dips ~ 75 - 80° west. The diorite is ~30 m
thick; medium to fine grained and contains black shale xenoliths.
Gold mineralization is found within intensely brecciated material within the
volcaniclastic unit (~24 m thick down the hole) with some mineralization along minor traces
of steeper (~80° dipping towards W) foliations at 262 m that might possibly be local shear
zones. Specifically, the mineralized zone is ~ 17 m thick from 241-258 m based on a cut-off
grade of 0.5g/t Au. This volcaniclastic unit is intensely silificied and carbonate altered. The
unit is composed of glassy-fragments of different shapes ranging from sub-rounded to
ellipsoidal (example at 258 m depth) in a greenish coloured matrix. In places, these fragments
are shattered by quartz-carbonate veins and in-filled by pyrrhotite veins. The entire

Page 183
volcaniclastic unit within this zone is infiltrated by disseminated pyrrhotite and local
arsenopyrite, which occur as clusters and some of them occur as fracture fill within the
intensely fractured zones. Similar mineralization textures are observed with the volcaniclastic
unit at 149-160 m. Within this zone, an intense hydrothermal breccia associated with intense
carbonate ± chlorite alteration and disseminated pyrrhotite and some arsenopyrites are
observed.
In general gold mineralization is linked to a ~20 m thick hydrothermally brecciated
volcaniclastic unit that is associated with carbonate-chlorite-pyrrhotite ± arsenopyrite
alteration. These hydrothermally brecciated zones occur along the hinge zones of folds (Fig.
A3.1c). In addition, the hydrothermally brecciated zone at ~150 m depth is positioned in
close proximity to the diorite contact.

Page 184
Appendix 4. Cross sections used in 3-D modelling
A total of nine cross sections were constructed across the Matandani deposit, four
across the Kukuluma deposit and three across Area 3 West (Fig. A4.1).
(a)
(b) Figure A4.1. Geological maps showing the position of the section lines across the Matandani deposit (a), and Kukuluma deposit (b). The sections form the basis of 3-D models for the ore bodies. In both images the view is north with reference to the Kukuluma Local Mine Grid.

Page 185
Sections were constructed by hand considering: bedding orientation, younging
directions and folding. Examples of three sections are presented in figure A4.2. Results of the
3-D modelling for each of the ore bodies are shown in Figures A5.1, A5.2 and A5.3.
(a)
(b)

Page 186
(c) Figure A4.2. Examples of geological cross sections through the three deposits. (a) cross-section 21760 through the Matandani deposit; (b) cross-section through the Matandani deposit; (c) cross-section 20010 through the Area 3 West deposit. Sctions drawn with Leapfrog Geo software looking north with respect to the Kukuluma Mine Grid.

Page 187
Appendix 5. Results from Leapfrog modeling The key findings from the leapfrog modeling are described below; this information
provides background information to the deformation scheme presented in Chapter 3.
A5.1 Matandani deposit
Geological cross-sections (e.g. Fig. A4.2) generated for this deposit from the 3-D
geological model indicate that gold mineralization is spatially associated with shear zones
that utilize the contact between the intrusive diorite and ironstone units.
(a)
(b)
(c)
(d)

Page 188
(e)
(f)
(g)
(h)
Figure A5.1. Images illustrating relationships between lithologies, folds, shear zones and gold mineralization for the Matandani deposit. (a) 3D model showing the mineralized sheared diorite-ironstone contact. The image was taken looking SW with respect to the local grid; (b) model showing the spatial relationship between the shear zone and mineralization envelope. The image was taken looking SW; (c) Geological cross-section 21760 showing the relationship between the diorite, ironstones with fold interference patterns, shear zone and mineralization envelope. The image was taken looking N; (d) Top view of the deposit showing the spatial relationship between the diorite and the poly-folded ironstones, the granodiorite dyke, the shear zone and mineralization envelope. The image was taken looking NE; (e) 3D model showing the relationship between the diorite, irregular shapes of ironstones, shear zones/planes and the ore envelopes. The image was taken looking N; (f) A view from the bottom of the 3D model showing the relationship between the ironstones being cut by the shear zone that are associated with gold mineralization;(g) Long section view of the Matandani deposit looking W; (h) Long section view of the Matandani deposit looking E .
Along strike, the shapes of the diorite intrusion change in orientation from north-south
to northeast trending defining a fold-like shape observable along the mid-western and eastern
contacts between the diorite and ironstone units. The width of the ironstone unit along this
folded portion of the eastern diorite-ironstone contact appears to widen (Fig.A5.1). Within
this thickened zone of ironstone a wider (~113 m apparent thickness viewed from above)
mineralized zone (ore envelope) is observed. A long section view along the eastern diorite–

Page 189
ironstone contact shows a patchy ore envelope with some variable plunges towards south and
north. This relationship spatially coincides with changes in the ironstone geometries down-
dip (Fig.A5.1h), probably linked to folding.
Only a few diamond drill holes were drilled into the western diorite-ironstone contact
zone. However, use was made of the available rock chip information together with the
deposit`s surface geology to generate a geological model for this part of the deposit. The
irregular orientation of the diorite-ironstone contact characterized by indentations, described
for the eastern part of the deposit also occurs on the western side and towards the
southwestern part of the deposit (Fig.A5.1g). Within these indentations along the diorite
contact, a relatively greater thickness for the ironstone unit is found. The areas with thicker
ironstone coincide with a widening of the ore envelope, spatially associated with a shear zone
along the diorite-ironstone contact (Fig.A5.1d-e). A closer look along the southwestern
diorite–ironstone contact shows patchy mineralization within the intra-formational
conglomerate that is inter-banded with the ironstone unit (Fig.A5.1d). The patchy nature of
the orebody within this unit occurs in places where the unit is cut by the shear zone.
The northwestern diorite ironstone contact shows some bending. However, these
bends do not correlate with the shape of the orebody as the latter becomes progressively
thinner and eventually become patchy towards the northnorthwest. Observations made from
the long section view on the western diorite-ironstone contact show a consistent plunge to the
southwest and patchy orebody shape towards the north (Fig.A5.1g).
A5.2 Kukuluma deposit
The results obtained for the Kukuluma deposit show two main, elongated, irregular
lenses of Diorite that have a general northwest-southeast trend (relative to the Kukuluma
Mine Grid). The shape of the eastern diorite lens is linear, whereas the western diorite lens
appears to be more irregular in shape and associated with a number of folds that occur along
its strike. The deposits show a spatial association with two lenses of ironstone units with a
general northwest-southeast strike (Fig.A5.2a-b). The eastern ironstone unit appears to be
linear and continuous both along strike and down dip, and has black shale associated with it.
The linearity of the ironstones along strike is similar to that observed in the eastern diorite
lens (Fig. A5.2a).
The western ironstone unit, which is bounded by two diorite bodies, is thicker on its
northwestern part and thins towards its southern end (Fig. A5.2). This irregular shape fits

Page 190
well with the irregular shape of the western diorite body observed in the deposit. The diorite-
ironstone contacts are overprinted by late-stage shear zones.
The planar eastern, sheared diorite–ironstone contact shows a strong correlation with
the orebody shape. Observations made from the long section view of the eastern diorite-
ironstone contact show that, the shape of the orebody is ‘patchy’ down-dip without any
definitive trend or plunge (Fig. A5.2c-d).
(a)
(b)
(C)
(d)
Figure A5.2. Images illustrating the relationships between lithologies, folds, shear zones and gold mineralization for the Kukuluma deposit. (a) Top view of the Kukuluma deposit showing cross-sections and two mineralized envelopes along the diorite-ironstone contacts in the E and a probable hinge zone of a fold in the W. Image was taken looking N; (b) Geological cross-section 21000 showing the relationship between the diorite, ironstones, shear zones and the mineralization envelope. The image was taken looking N; (c) N-directed view from below the Kukuluma deposit showing a circular to semi-circular cluster of mineralization in the west, and a linear mineralization trend in the E part of the deposit; (d) NNE view of the Kukuluma deposit showing mineralization trends. The mineralization envelope is represented by the red bodies.

Page 191
Observations made along the western diorite–ironstone contact show an irregular shape
of the orebody similar to the irregular shape of the diorite contact. Two sets of late-stage
shear zones appear associated with mineralization along the western orebody: one along the
diorite–ironstone contact; and a second within the ironstone unit. The western orebody
appears to be circular towards the northern part of the deposit coincident with a widening of
the ironstone unit between the two diorites and the trend of two shear zones that cut through
the ironstones (Fig. A5.2b). Along strike towards the southern part of the deposit, the orebody
shape gets progressively more planar as it coincides with the sheared diorite-ironstone
contact. Observations made from a long section view of the western diorite-ironstone contact
zones show that, there is possible plunge of the orebody towards the north on the northern
part of the deposit.
A5.3 Area 3 West deposit
Results from the Area 3 West deposit show two main lenses of diorite with a general
north-south strike (Fig. A5.3a). These diorite bodies are locally intruded by tonalite bodies
with a general north-south orientation. The diorite bodies sandwich a complexly folded
package of volcano-sedimentary rocks (Fig. A5.3b). Intense steeply dipping hydrothermal
breccia zones have been observed along the hinges zones of the dominant folds.
Both individual geological cross-sections and 3-D view projections in Leapfrog
demonstrate the strong spatial relationship between fold hinge zones and the planar, steeply
dipping orebody shape along strike. A long section view of the mineralization within the
Area 3 West deposit shows a plunge of the mineralization towards the south (Fig. A5.3c-d).
The geological cross-sections show that the orebody is mainly located in the ironstone and
volcaniclastic units.
(a)
(b)

Page 192
(c)
(d)
Figure A5.3. Images illustrating the relationships between lithologies, folds, shear zones and gold mineralization for the Area3 West deposit. (a) Top view of the Area 3 West deposit showing cross-sections and a mineralized envelope along the hinge zone of a fold. Image was taken looking north; (b) Geological cross-section 19950. The image was taken looking N; (c) A long section view of the Area 3 West ore zone, showing a possible south plunge. The image was taken looking east; (d) An oblique long section view towards east showing the relationship between the probable southern plunge of mineralization and the thicker ironstone in the hinge zone in the southernmost section of the deposit. The mineralization envelope is represented by the red coloured bodies.

Page 193
Appendix 6. Relationship between host lithology and gold
mineralization
This appendix provides a description of the data collected to establish the relationship
between mineralization and lithology. A summary of this data is presented as part of chapter
3 (Fig. 3.12).
ID E (UTM) N (UTM) Elevation Length Azimuth Plunge Deposit MTDD0001 417969 9688963 1524 410.6 226 56 MATANDANI MTDD0002 417832 9688702 1501 320.1 226 54 MATANDANI MTDD0003 418112 9688653 1506 186.1 226 55 MATANDANI MTDD0004 418006 9688500 1505 165.2 226 55 MATANDANI MTDD0005 418006 9688500 1505 188.0 226 55 MATANDANI MDD_205 418037 9688692 1542 200.0 225 50 MATANDANI MTMT_1 418006 9688651 1543 161.1 226 75 MATANDANI MTMT_2 417924 9688738 1536 150.0 226 90 MATANDANI MTMT0005 418016 9688616 1477 79.8 226 90 MATANDANI MTMT0006 418011 9688616 1477 148.7 46 77 MATANDANI MTRC0007 417821 9688630 1540 150.0 270 49 MATANDANI KKDD0001 418824 9688261 1461 306.6 226 55 KUKULUMA KKDD0002 418681 9688166 1443 317.4 46 52 KUKULUMA SRKKG_2 418619 9688112 1560 210.0 1 50 KUKULUMA KKGT_1 418879 9688404 1574 60.0 147 65 KUKULUMA KKGT_2 418869 9688347 1564 105.2 147 70 KUKULUMA KKGT_3 418844 9688231 1553 95.0 327 70 KUKULUMA KKGT_4 418837 9688200 1552 50.0 327 70 KUKULUMA A1D_201 418764 9688316 1563 77.6 181 50 KUKULUMA A1D_203 418865 9688316 1559 250.0 181 50 KUKULUMA A1D_206 418790 9688291 1560 210.5 181 50 KUKULUMA
A1D_207 418903 9688290 1556 105.0 181 50 KUKULUMA 3WD_1 420085 9688066 1492 236.6 40 55 AREA 3 WEST 3WD_2 420174 9687991 1471 209.0 44 55 AREA 3 WEST 3WD_3 420118 9688017 1478 227.0 44 60 AREA 3 WEST AWDD0001 420082 9687989 1473 329.6 41 57 AREA 3 WEST AWDD0002 420024 9688027 1497 299.6 45 55 AREA 3 WEST AWDD0003 419978 9688063 1510 269.8 45 60 AREA 3 WEST AWDD0004 419929 9688092 1520 291.2 46 60 AREA 3 WEST AWDD0005 420138 9687974 1459 284.0 46 50 AREA 3 WEST
Total 6093.6 Table A6.1. List of drill holes used in the analysis of ore grade as a function of lithology. A total of 6094 m of core was examined from the Matandani, Kukuluma and Area 3 West deposits.
Field mapping and core logging indicate that there is a strong lithological control on
gold distribution and gold grades in the Kukuluma terrain. Diamond drill holes were selected
from the Matandani, Kukuluma and Area 3 West deposits (Table A6.1) to investigate the role
of lithology on the distribution of gold mineralization.

Page 194
The lithology of each hole was recorded and compared to the assay results extracted
from the mine database. At Geita Gold Mine half of each diamond drill core is sampled every
meter and assayed for gold (see section on assay procedures). Thus, a direct comparison
between lithology and gold grades can be made. For the purpose of this exercise, all samples
with gold grades above 0.1 ppm, above 0.5 ppm (the cut-off grade), above 1 ppm and above 5
ppm Au, were classified by lithological unit. The number of meters for each lithological unit
falling into each of the four grade-categories was recorded, and the relative contribution of
each lithology to the grade category, expressed as a percentage of total length, was
calculated.
A6.1 Lithological groupings in drill core
In grouping the lithologies use was made of pre-existing core logs that were kept in
the database at Geita Gold Mine. For each deposit 2-3 drill holes were re-logged, to check on
the accuracy of the logging. It was noted that not all units were identified in the pre-existing
logs with the same level of confidence, making it necessary to group units in the general
categories listed here (Table A6.2). In all instances, ironstone units were easily identified
because of their magnetic nature due to the abundance of magnetite (and pyrrhotite). Chert
includes both massively banded chert and highly silicified, laminated lithologies of
sedimentary origin. Many of the cherts are magnetic, and they are transitional to the
ironstones. Black shales are graphite-rich and have been accurately logged. Volcanoclastic
units comprise a range of lithologies including, agglomerate and breccia, fragmental tuff,
ignimbritic units and tuff beds (see Appendix 2; Table A2.1). Sediments consist of alternating
siltstone-shale units interpreted as greywackes with turbiditic characteristics, alternating with
coarser-grained sandstone, grit and intra-formational conglomerate. The diorite unit
comprises both monzonite, and diorite of the Kukuluma Intrusive Complex as discussed in
chapter 4. In some logs, altered diorite may have been mis-identified as sediment; i.e. the
relative contributions of sediment and diorite may vary slightly, compared to what is reported
in Table A2.1. The granodiorite unit is distinct and has been logged accurately. This
lithological grouping was later been matched with the standardized nomenclature for the
rocks within the Kukuluma terrain proposed in this study (Table A2.1). Therefore, the
nomenclature of the lithologies used in the descriptions below is the ones adopted in Table
A2.1.

Page 195
A6.2 Matandani deposit
From the Matandani deposit 11 diamond drill holes (Tables A6.1 and A6.2) were
examined as part of this exercise, with a total of 2159.60 meters drilled. Nine of these holes
were drilled towards the southwest, one was drilled towards the north east and one was
drilled towards the west. Six holes were drilled at ~ 55° dip, two holes were drilled at ~75°
dip and two holes were drilled vertically.
In the Matandani deposit all lithological units present within the drill core have been
affected by low-grade mineralisation and record values above 0.1 ppm Au (Table A6.2;
Fig.A6.1a). However, the lithological distribution is highly asymmetric with the chert (49%)
and the well-bedded ironstone (28%) units recording ~80% of all gold above 0.1 ppm. The
chert unit is the main host of gold for low grades, followed by ironstone, but as the grade
increases the ironstone unit becomes the dominant host of gold. Other lithological units that
are important hosts for low grade gold mineralization are the siltstones and the
volcanoclastics. They host between 5 and 10% each of low grade mineralization. The
remaining lithological units host less than 5% each of the mineralization. At values above 5
ppm Au the ironstone unit hosts 54% of the gold mineralization while the chert unit hosts
only 27% of the gold. Other important lithological hosts for high grade mineralization are the
volcanoclastics (~7%) and the diorite of the Kukuluma Igneous Complex (~11%). The most
poorly mineralized units in the Matandani pit are the black shales and the granodiorites.
A6.3 Kukuluma deposit
From the Kukuluma deposit 11 diamond drill holes (Tables A6.1 and A6.2) were
examined with a total of 1787.25 metres drilled. Four of these holes were drilled towards the
south, two holes were drilled towards the northwest, two holes were drilled towards the
southeast, one was drilled towards the northeast, one was drilled towards the north and one
towards the southwest. Seven holes were drilled at ~50° dip, three holes were drilled at ~70°
dip and one hole was drilled at ~65° dip.
The lithological controls on the gold grades in the Kukuluma deposit are similar to the
Matandani deposit (Table A6.2; Fig. 3.12). For example, at gold values above 0.1 ppm the
main host for gold is ironstone (41%) followed by chert (27%), with moderate contribution
from sediments, volcanoclastics and diorite.
Using a cut-off grade of 0.5 ppm gold, the chert and the ironstone units’ host similar
amounts of gold (~36% each) followed by siltstone units (~17%). At higher grades the role of

Page 196
ironstone as a host for gold decreases from ~25% (>1 ppm Au) to ~8% (>5 ppm Au), whilst
the role of chert increases with ~47% (>1 ppm) and ~39% (>5 ppm Au) of the total
respectively. At gold values over 1 ppm the sediments are important host rocks (~23%),
which increases to ~30% for grades above 5 ppm. At low and moderate grades (<5 ppm Au),
diorite contributes less than 5% of gold mineralisation, however, at grades over 5ppm gold,
diorite is an important host rock accounting for ~21% of mineralisation. No mineralised
granodiorites were identified in the Kukuluma deposit and the black shales host only minor
amounts of gold.
A6.4 Area 3W deposit
From the Area 3 West deposit eight diamond drill holes were examined with a total of
2146.70 metres drilled (Tables A6.1 and A6.2). All holes were drilled towards the northeast
at dips between 50 and 60°.
In the Area 3 West deposit, Ironstone Unit is the main host for mineralization at all
gold grades, with a gradual increase in importance as a host rock for progressively higher
grades: i.e. ironstone hosts 55% of the total core length at >0.1 ppm gold; 56% at >0.5 ppm
gold; 63% at >1 ppm gold, and 67% at grades over 5 ppm gold. Chert units host ~25% of
gold mineralization at all grades (Table A6.2; Fig. 3.12). Other rock units hosting significant
gold mineralization are the volcanoclastics and diorite. Siltstone and black shale units host
only low grade mineralization (< 0.5 ppm Au) and granodiorite host no significant
mineralization.

Page 197
Deposit grade Chert Ironstone Volc Seds Bshale Diorite Gran Total Matandani >0.1 ppm Au (m) 533.44 300.49 112.01 69.35 30.24 31.49 5.19 1082.21
>0.5 ppm Au (m) 287.65 208.38 32.76 29.04 5.45 15.60 2.54 581.42
>1.0 ppm Au (m) 193.59 174.70 20.04 18.64 1.50 15.60 0.00 424.07
>5.0 ppm Au (m) 33.28 65.17 9.00 1.00 0.00 13.00 0.00 121.45
Kukuluma >0.1 ppm Au (m) 175.79 283.07 73.07 92.11 17.97 40.47 0.00 682.48
>0.5 ppm Au (m) 111.30 111.41 16.20 52.89 4.00 8.30 0.00 304.10
>1.0 ppm Au (m) 86.65 45.98 3.00 41.75 3.00 4.30 0.00 184.68
>5.0 ppm Au (m) 21.00 4.45 1.00 15.98 0.00 11.00 0.00 53.43 Area 3 West >0.1 ppm Au (m) 127.75 265.34 49.86 7.00 17.35 17.00 0.00 484.30
>0.5 ppm Au (m) 60.11 128.50 27.00 1.00 2.50 10.00 0.00 229.11
>1.0 ppm Au (m) 37.36 93.34 12.70 0.00 0.00 4.00 0.00 147.40
>5.0 ppm Au (m) 10.21 28.44 2.00 0.00 0.00 2.00 0.00 42.65
(a) Deposit grade Chert Ironstone Volc Seds Bshale Diorite Gran Total
Matandani >0.1 ppm Au (%) 49.29 27.77 10.35 6.41 2.79 2.91 0.48 100.00
>0.5 ppm Au (%) 49.47 35.84 5.63 4.99 0.94 2.68 0.44 100.00
>1.0 ppm Au (%) 45.65 41.20 4.73 4.40 0.35 3.68 0.00 100.00
>5.0 ppm Au (%) 27.40 53.66 7.41 0.82 0.00 10.70 0.00 100.00
Kukuluma >0.1 ppm Au (%) 25.76 41.48 10.71 13.50 2.63 5.93 0.00 100.00
>0.5 ppm Au (%) 36.60 36.64 5.33 17.39 1.32 2.73 0.00 100.00
>1.0 ppm Au (%) 46.92 24.90 1.62 22.61 1.62 2.33 0.00 100.00
>5.0 ppm Au (%) 39.30 8.33 1.87 29.91 0.00 20.59 0.00 100.00 Area 3 West >0.1 ppm Au (%) 26.38 54.79 10.30 1.45 3.58 3.51 0.00 100.00
>0.5 ppm Au (%) 26.24 56.09 11.78 0.44 1.09 4.36 0.00 100.00
>1.0 ppm Au (%) 25.35 63.32 8.62 0.00 0.00 2.71 0.00 100.00
>5.0 ppm Au (%) 23.94 66.68 4.69 0.00 0.00 4.69 0.00 100.00 (b)
Table A6.2. (a) Length of logged drill core expressed in meters, listed by grade and rock type for the Matandani, Kukuluma and Area 3 West deposits. (b) Length of logged drill core expressed in % of total, listed by grade and rock type for the Matandani, Kukuluma and Area 3 West deposits. The lithological units listed comprise the following: Chert = massively banded chert and highly silicified laminated sedimentary units; Ironstone = well bedded, silicified, magnetite-rich units including BIF. Transitional with chert; Volc = volcanoclastic units including agglomerate, fragmental tuff and ignimbrite; Seds = sediments comprising alternating siltstone-shale units with layers of coarser-grained sandstone, grit and rare conglomerate. These units dominantly fall under the Siltstone group; Bshale = graphitic black shale; Diorite = monzonite and diorite of the and Gran = Granodiorite.

Page 198
Appendix 7. Major and Trace element analyses Element/Sample no. KIC-01 KIC-02 KIC-03 KIC-04 KIC-05 KIC-06 KIC-07 KIC-08 KIC-09 KIC-10
KIC-11
SiO2 57.14 59.10 56.69 56.68 56.00 55.38 62.06 52.70 56.23 51.73 56.77
TiO2 0.46 0.42 0.47 0.51 0.52 0.51 0.42 0.58 0.49 0.56 0.46
Al2O3 16.33 14.49 16.08 16.12 16.52 15.97 16.50 14.44 16.32 14.92 15.05
FeO 3.09 3.78 5.88 6.14 5.44 5.54 3.97 7.11 5.89 9.03 6.90
MnO 0.05 0.07 0.10 0.05 0.08 0.07 0.05 0.09 0.07 0.07 0.08
MgO 2.53 3.55 2.94 3.61 3.00 3.40 2.58 5.53 3.47 5.62 2.77
CaO 6.23 5.85 5.29 4.09 4.50 4.39 3.96 6.98 3.78 4.51 5.26
Na2O 6.64 4.97 6.17 4.49 5.69 6.22 6.61 4.46 5.63 4.50 6.27
K2O 0.86 2.43 3.15 3.44 3.17 2.75 2.05 3.57 2.67 2.71 1.71
P2O5 0.50 0.40 0.36 0.44 0.47 0.45 0.35 0.86 0.43 0.83 0.46
LOI 4.58 3.97 1.88 4.53 3.78 3.58 0.92 3.14 4.54 4.13 4.86
Total 98.40 99.02 99.00 100.09 99.16 98.26 99.48 99.45 99.52 98.61 100.59
CaO+Na2O 12.87 10.82 11.46 8.58 10.19 10.61 10.58 11.44 9.41 9.01 11.53
Mg# 59.31 62.57 47.12 51.14 49.55 52.23 53.66 58.08 51.19 52.61 41.69
V 75.40 67.18 88.22 104.95 105.07 99.43 72.43 131.39 91.29 135.21 91.66
Cr 31.91 98.13 83.13 83.51 46.82 66.18 49.42 195.17 77.35 195.93 28.45
Ni 34.24 63.01 35.31 56.46 26.36 41.88 33.92 56.35 59.34 78.74 27.55
Rb 9.19 40.12 47.72 74.72 84.37 93.51 27.93 109.23 72.04 99.75 23.11
Sr 1446.78 1562.91 1534.81 1262.89 1245.08 1075.26 1135.55 855.53 674.15 1082.07 537.09
Y 15.22 13.15 20.86 14.56 16.05 15.00 11.83 28.13 11.21 29.96 13.73
Zr 185.55 149.11 238.28 138.60 173.40 170.01 151.97 274.58 131.85 284.22 187.15
Nb 6.00 4.61 9.40 5.53 6.04 5.80 5.09 9.74 5.62 9.82 5.39
Ba 237.37 1413.89 1898.63 1783.46 1600.76 1345.47 1722.08 2545.32 1385.58 749.87 149.30
La 121.78 68.59 102.61 81.02 82.68 80.94 57.01 166.15 77.27 184.12 78.90
Ce 235.18 142.95 212.18 163.65 169.19 167.96 116.12 353.66 158.17 379.51 161.82
Pr 25.95 17.15 24.48 18.69 19.48 19.36 13.28 42.13 18.30 44.78 18.43
Nd 96.49 69.46 95.99 72.82 75.62 75.68 52.45 172.62 71.57 177.99 74.67
Sm 13.96 11.14 15.46 11.17 11.85 11.29 8.25 26.47 10.25 28.78 11.76
Eu 2.80 2.77 3.73 2.65 3.01 2.71 2.05 6.53 2.28 6.67 2.54
Gd 7.17 6.57 9.21 6.35 6.99 6.66 5.15 15.35 5.42 16.27 6.61
Tb 0.79 0.66 1.04 0.70 0.78 0.70 0.57 1.64 0.51 1.55 0.64
Dy 3.34 3.34 4.73 3.31 3.60 3.18 2.74 6.87 2.64 7.39 3.27
Ho 0.52 0.48 0.73 0.52 0.57 0.52 0.46 1.04 0.42 1.08 0.51
Er 1.38 1.09 1.80 1.35 1.36 1.27 1.05 2.29 1.09 2.47 1.35
Tm 0.19 0.15 0.22 0.18 0.18 0.18 0.15 0.27 0.16 0.33 0.18
Yb 1.25 0.71 1.33 1.07 1.17 1.12 0.85 1.68 0.99 1.81 1.05
Lu 0.18 0.10 0.17 0.15 0.17 0.17 0.13 0.21 0.16 0.24 0.17
Hf 4.41 3.53 5.30 3.70 4.02 4.13 3.61 6.14 3.23 6.29 4.08
Th 20.30 12.00 18.25 11.55 16.89 17.06 11.95 31.58 17.52 32.83 16.22
U 3.75 3.95 4.59 4.59 4.26 4.09 3.47 7.40 8.36 7.78 5.24
Sr/Y 95.06 118.82 73.59 86.76 77.56 71.68 96.02 30.41 60.14 36.12 39.12

Page 199
La/Yb 97.17 96.61 77.15 75.67 70.43 71.97 67.10 99.10 77.79 101.91 75.50
La/Ybn 66.01 65.63 52.41 51.40 47.84 48.89 45.58 67.32 52.85 69.23 51.29
Dy/Ybn 1.74 3.08 2.33 2.02 2.01 1.85 2.11 2.68 1.74 2.68 2.05
Zr/Hf 42.08 42.28 44.93 37.49 43.10 41.17 42.14 44.72 40.78 45.21 45.83
Zr/Sm 13.29 13.39 15.41 12.40 14.63 15.05 18.42 10.37 12.86 9.88 15.91
Nb/La 0.05 0.07 0.09 0.07 0.07 0.07 0.09 0.06 0.07 0.05 0.07
Th/U 5.41 3.04 3.97 2.52 3.96 4.17 3.44 4.27 2.10 4.22 3.10
Cr/Ni 0.93 1.56 2.35 1.48 1.78 1.58 1.46 3.46 1.30 2.49 1.03
Sr/Sr* 0.71 1.15 0.79 0.85 0.81 0.70 1.07 0.25 0.47 0.31 0.36
Table A7.1. Major and trace element analyses for the monzonite suite.
Element/Sample no.
KIC-12 KIC-13 KIC-14 KIC-15 KIC-16 KIC-17 KIC-18 KIC-19 KIC-20 KIC-21
SiO2 58.29 62.74 62.75 61.71 53.29 55.04 58.86 58.85 57.09 57.52
TiO2 0.39 0.32 0.33 0.58 0.67 0.64 0.51 0.59 0.61 0.51
Al2O3 15.81 14.88 14.40 16.70 16.82 16.33 15.96 16.76 17.07 16.21
FeO 7.49 2.83 3.02 6.98 7.82 7.00 6.91 6.78 7.33 7.71
MnO 0.04 0.04 0.05 0.07 0.10 0.13 0.12 0.09 0.06 0.08
MgO 2.04 2.61 2.70 2.97 4.16 3.46 2.70 3.07 3.17 2.15
CaO 2.92 3.46 4.20 3.13 6.26 6.55 4.38 4.71 3.65 6.59
Na2O 5.11 5.17 5.61 3.62 3.56 3.79 3.36 4.79 3.84 3.14
K2O 2.84 3.24 2.18 1.75 1.67 1.35 2.74 1.18 2.45 2.21
P2O5 0.15 0.21 0.20 0.21 0.24 0.27 0.20 0.20 0.31 0.18
LOI 3.38 3.24 3.92 1.72 5.24 5.55 4.16 2.43 1.44 3.32
Total 98.45 98.73 99.35 99.43 99.83 100.11 99.88 99.44 97.02 99.61
CaO+Na2O 8.03 8.62 9.81 6.75 9.82 10.34 7.73 9.50 7.48 9.73
Mg# 32.68 62.17 61.48 43.12 48.65 46.87 41.10 44.69 43.50 33.15
V 75.17 62.49 56.28 175.05 162.55 158.14 112.83 135.19 149.50 114.20
Cr 63.84 96.59 98.49 81.82 97.60 87.08 49.50 89.57 87.43 84.63
Ni 36.76 61.37 57.92 57.86 60.24 66.02 76.78 30.00 59.29 23.80
Rb 98.78 60.84 52.48 72.66 62.47 48.33 87.85 43.04 94.59 65.72
Sr 797.59 1024.75 1062.38 978.06 773.78 679.84 800.15 778.44 876.08 572.36
Y 8.74 7.54 9.38 10.94 11.91 10.50 7.59 9.17 11.86 10.31
Zr 105.93 108.92 107.38 112.81 80.17 79.30 93.03 104.81 145.07 96.88
Nb 2.91 2.98 3.32 3.03 2.43 2.53 2.54 2.95 5.16 2.16
Ba 695.82 1477.81 1156.30 560.89 563.32 418.35 556.74 329.70 725.24 380.48
La 22.33 31.39 31.58 21.22 13.72 12.31 12.02 12.07 38.26 10.72
Ce 42.52 65.60 65.89 46.35 30.72 29.06 26.67 26.91 76.19 22.00
Pr 4.59 7.65 7.92 5.74 4.01 4.05 3.54 3.53 8.76 2.80
Nd 17.11 30.62 32.22 24.19 17.65 17.04 14.47 16.21 34.33 12.69
Sm 2.96 5.07 5.94 4.86 3.74 3.70 3.08 3.47 5.77 2.65
Eu 0.86 1.22 1.42 1.31 1.11 1.15 1.07 1.19 1.51 0.85
Gd 2.23 3.14 3.78 3.55 3.21 3.13 2.53 2.78 3.90 2.33

Page 200
Tb 0.32 0.36 0.44 0.46 0.44 0.46 0.35 0.35 0.49 0.31
Dy 1.75 1.62 2.05 2.41 2.39 2.27 1.67 1.93 2.53 1.84
Ho 0.31 0.28 0.34 0.45 0.46 0.44 0.32 0.36 0.45 0.35
Er 0.86 0.61 0.88 1.19 1.27 1.08 0.76 0.99 1.29 0.94
Tm 0.14 0.09 0.12 0.18 0.19 0.16 0.12 0.14 0.18 0.14
Yb 0.94 0.50 0.61 1.04 1.19 0.94 0.66 0.79 1.09 0.75
Lu 0.14 0.08 0.08 0.17 0.18 0.15 0.11 0.12 0.16 0.10
Hf 3.05 2.83 2.91 2.99 2.27 2.31 2.53 2.88 3.73 2.54
Th 4.34 6.90 6.92 2.45 1.64 1.49 1.68 1.53 5.25 1.09
U 1.31 2.39 2.68 0.86 0.57 0.48 0.61 0.52 1.64 0.40
Sr/Y 91.26 135.97 113.22 89.40 64.97 64.75 105.42 84.89 73.87 55.52
La/Yb 23.88 63.08 51.91 20.40 11.53 13.10 18.21 15.28 35.10 14.29
La/Ybn 16.22 42.85 35.26 13.86 7.83 8.90 12.37 10.38 23.84 9.71
Dy/Ybn 1.22 2.14 2.20 1.52 1.31 1.58 1.66 1.60 1.52 1.61
Zr/Hf 34.69 38.49 36.90 37.73 35.32 34.33 36.77 36.39 38.89 38.14
Zr/Sm 35.79 21.50 18.08 23.21 21.44 21.43 30.20 30.20 25.14 36.56
Nb/La 0.13 0.09 0.11 0.14 0.18 0.21 0.21 0.24 0.13 0.20
Th/U 3.32 2.89 2.58 2.85 2.88 3.10 2.75 2.94 3.20 2.73
Cr/Ni 1.74 1.57 1.70 1.41 1.62 1.32 0.64 2.99 1.47 3.56
Sr/Sr* 2.17 1.68 1.69 2.15 2.44 2.24 2.99 2.74 1.26 2.52
Table A7.2. Major and trace element analyses for the diorite suite.
Element/Sample no. KIC-22 KIC-23 KIC-24 KIC-25
SiO2 62.90 62.76 62.20 62.15
TiO2 0.55 0.56 0.55 0.56
Al2O3 15.74 15.94 15.56 15.53
FeO 4.83 5.04 4.81 4.87
MnO 0.08 0.08 0.08 0.08
MgO 1.87 1.93 1.88 1.89
CaO 3.78 3.11 3.88 4.09
Na2O 3.39 3.87 3.24 2.98
K2O 3.60 3.41 3.72 3.93
P2O5 0.17 0.17 0.16 0.17
LOI 3.66 3.15 3.23 3.70
Total 100.57 100.00 99.32 99.94
CaO+Na2O 7.16 6.98 7.12 7.07
Mg# 40.88 40.54 41.07 40.90
V 61.71 67.21 66.97 66.05
Cr 21.21 22.22 20.78 20.74
Ni 13.75 15.99 10.53 13.46
Rb 102.33 97.69 83.46 85.94
Sr 302.20 340.07 358.09 327.49

Page 201
Y 16.88 16.54 16.30 15.93
Zr 132.42 128.70 132.30 130.04
Nb 5.70 6.04 5.90 5.73
Ba 584.53 520.77 507.52 545.58
La 24.26 23.89 23.69 23.52
Ce 52.25 50.96 50.99 49.37
Pr 6.15 5.79 5.89 5.79
Nd 23.64 22.66 22.88 22.49
Sm 4.45 4.21 4.36 4.31
Eu 0.96 0.86 1.05 1.15
Gd 3.61 3.70 3.63 3.46
Tb 0.50 0.49 0.52 0.48
Dy 3.17 3.08 2.46 2.86
Ho 0.57 0.55 0.62 0.56
Er 1.87 1.69 1.71 1.63
Tm 0.25 0.26 0.29 0.25
Yb 1.56 1.57 1.61 1.54
Lu 0.26 0.25 0.24 0.23
Hf 3.89 3.92 3.81 3.76
Th 8.30 8.12 8.10 7.67
U 2.82 2.76 2.83 2.62
Sr/Y 17.90 20.56 21.97 20.55
La/Yb 15.52 15.25 14.71 15.31
La/Ybn 10.54 10.36 10.00 10.40
Dy/Ybn 1.33 1.29 1.12 1.22
Zr/Hf 34.04 32.86 34.76 34.59
Zr/Sm 29.78 30.55 30.32 30.20
Nb/La 0.24 0.25 0.25 0.24
Th/U 2.95 2.94 2.86 2.93
Cr/Ni 1.54 1.39 1.97 1.54
Sr/Sr* 0.63 0.74 0.77 0.72
Table A7.3 Major and trace element analyses for the granodiorite suite.

Page 202
Appendix 8. Data analyses of zircon standards used in geochronology
Analysis
238U/206Pb
Error (1σ)
207Pb/206Pb
Error (1σ)
207Pb/235U
Error (1σ)
206Pb/238U
Error (1σ)
Rho
Age (Ma) 207Pb/206Pb
Error (1σ)
Age (Ma) 206Pb/238U
Error (1σ)
Discordance (%)
GJ1-1 10.192 0.13 0.060 0.00 0.812 0.01 0.098 0.001 0.83 604 29 603 8 0
GJ1-2 10.165 0.14 0.060 0.00 0.818 0.02 0.098 0.001 0.57 615 49 605 8 2
GJ1-3 10.179 0.13 0.061 0.00 0.831 0.01 0.098 0.001 0.87 652 28 604 8 7
GJ1-4 10.238 0.13 0.062 0.00 0.828 0.02 0.098 0.001 0.66 657 40 601 7 9
GJ1-5 10.299 0.15 0.059 0.00 0.786 0.02 0.097 0.001 0.48 556 63 597 8 -7
GJ1-6 10.304 0.15 0.059 0.00 0.787 0.03 0.097 0.001 0.46 559 69 597 9 -7
GJ1-7 10.165 0.13 0.060 0.00 0.819 0.02 0.098 0.001 0.61 618 44 605 8 2
GJ1-8 10.183 0.13 0.060 0.00 0.810 0.01 0.098 0.001 0.74 597 35 604 8 -1
GJ1-9 10.285 0.14 0.062 0.00 0.826 0.02 0.097 0.001 0.56 663 49 598 8 10
GJ1-10 10.319 0.14 0.059 0.00 0.793 0.02 0.097 0.001 0.47 580 63 596 8 -3
GJ1-11 10.199 0.13 0.062 0.00 0.839 0.02 0.098 0.001 0.60 676 44 603 8 11
GJ1-12 10.116 0.13 0.059 0.00 0.807 0.02 0.099 0.001 0.59 574 46 608 7 -6
GJ1-13 10.203 0.13 0.061 0.00 0.823 0.02 0.098 0.001 0.58 636 45 603 7 5
GJ1-14 10.256 0.13 0.058 0.00 0.786 0.01 0.098 0.001 0.70 548 36 600 7 -10
GJ1-15 10.149 0.13 0.060 0.00 0.819 0.01 0.099 0.001 0.83 614 29 606 7 1
GJ1-16 10.251 0.13 0.061 0.00 0.815 0.01 0.098 0.001 0.83 625 29 600 7 4
GJ1-17 10.253 0.12 0.060 0.00 0.809 0.01 0.098 0.001 0.77 609 31 600 7 1
GJ1-18 10.299 0.14 0.062 0.00 0.826 0.02 0.097 0.001 0.67 666 40 597 8 10
GJ1-19 10.111 0.13 0.061 0.00 0.826 0.02 0.099 0.001 0.55 624 48 608 7 3
GJ1-20 10.180 0.13 0.059 0.00 0.804 0.01 0.098 0.001 0.68 581 38 604 7 -4
GJ1-21 10.093 0.13 0.060 0.00 0.820 0.02 0.099 0.001 0.57 606 47 609 7 0
GJ1-22 10.171 0.13 0.060 0.00 0.814 0.01 0.098 0.001 0.70 604 36 605 7 0
GJ1-23 10.310 0.13 0.060 0.00 0.802 0.01 0.097 0.001 0.75 603 33 597 7 1
GJ1-24 10.324 0.13 0.060 0.00 0.798 0.02 0.097 0.001 0.64 594 40 596 7 0
GJ1-25 10.316 0.13 0.060 0.00 0.801 0.01 0.097 0.001 0.84 601 28 597 7 1
GJ1-26 10.316 0.13 0.060 0.00 0.802 0.02 0.097 0.001 0.58 604 45 596 7 1
GJ1-27 10.126 0.13 0.060 0.00 0.816 0.01 0.099 0.001 0.72 601 35 607 7 -1
GJ1-28 10.179 0.13 0.060 0.00 0.807 0.01 0.098 0.001 0.79 587 31 604 7 -3
Table A8.1. U-Pb data for the GJ1 zircon standard.

Page 203
Analysis
238U/206Pb
Error (1σ)
207Pb/206Pb
Error (1σ)
207Pb/235U
Error (1σ)
206Pb/238U
Error (1σ)
Rho
Age (Ma) 207Pb/206Pb
Error (1σ)
Age (Ma) 206Pb/238U
Error (1σ)
Discordance (%)
FC1-1 5.267 0.07 0.076 0.001 1.993 0.03 0.190 0.002 0.92 1098 23 1121 13 -2
FC1-2 5.384 0.07 0.076 0.001 1.950 0.03 0.186 0.002 0.91 1100 24 1098 13 0
FC1-3 5.525 0.08 0.076 0.002 1.901 0.04 0.181 0.003 0.63 1100 43 1072 14 2
FC1-4 5.041 0.07 0.076 0.001 2.085 0.04 0.198 0.003 0.79 1101 29 1167 14 -6
FC1-5 5.044 0.07 0.076 0.001 2.082 0.03 0.198 0.003 0.86 1100 26 1166 14 -6
FC1-6 5.132 0.07 0.076 0.001 2.046 0.03 0.195 0.003 0.89 1100 25 1148 14 -4
FC1-7 5.712 0.08 0.076 0.001 1.838 0.03 0.175 0.002 0.70 1100 35 1040 13 5
FC1-8 5.222 0.07 0.076 0.001 2.011 0.03 0.191 0.002 0.87 1100 25 1129 13 -3
FC1-9 4.913 0.06 0.076 0.001 2.138 0.03 0.204 0.002 0.75 1100 30 1194 13 -9
FC1-10 5.012 0.06 0.076 0.001 2.101 0.03 0.200 0.002 0.78 1105 28 1173 13 -6
FC1-11 5.221 0.06 0.076 0.001 2.013 0.03 0.192 0.002 0.81 1101 28 1130 13 -3
FC1-12 5.240 0.07 0.076 0.001 2.006 0.03 0.191 0.002 0.87 1102 25 1126 13 -2
FC1-13 5.212 0.06 0.076 0.001 2.015 0.03 0.192 0.002 0.79 1100 28 1131 12 -3
FC1-14 5.105 0.06 0.076 0.001 2.056 0.03 0.196 0.002 0.95 1099 22 1153 13 -5
FC1-15 5.206 0.06 0.076 0.001 2.017 0.03 0.192 0.002 0.89 1100 24 1133 13 -3
FC1-16 5.249 0.06 0.076 0.001 2.003 0.03 0.191 0.002 0.89 1102 24 1124 12 -2
FC1-17 5.224 0.06 0.076 0.001 2.011 0.03 0.191 0.002 0.94 1100 22 1129 13 -3
FC1-18 5.264 0.06 0.076 0.001 1.995 0.03 0.190 0.002 0.94 1100 22 1121 13 -2
FC1-19 5.043 0.06 0.076 0.001 2.083 0.03 0.198 0.002 0.83 1100 26 1166 13 -6
FC1-20 5.132 0.06 0.076 0.001 2.049 0.03 0.195 0.002 0.88 1102 24 1148 12 -4
FC1-21 5.239 0.06 0.076 0.001 2.005 0.03 0.191 0.002 0.78 1099 29 1126 12 -2
FC1-22 5.261 0.06 0.076 0.001 1.995 0.03 0.190 0.002 0.89 1099 24 1122 12 -2
FC1-23 5.224 0.06 0.076 0.001 2.011 0.03 0.191 0.002 0.94 1101 22 1129 13 -3
FC1-24 5.292 0.06 0.076 0.001 1.985 0.03 0.189 0.002 0.93 1100 22 1116 12 -1
Table A8.2. U-Pb data for the FC1 zircon standard.

Page 204
Analysis
238U/206Pb
Error (1σ)
207Pb/206Pb
Error (1σ)
207Pb/235U
Error (1σ)
206Pb/238U
Error (1σ)
Rho
Age (Ma) 207Pb/206Pb
Error (1σ)
Age (Ma) 206Pb/238U
Error (1σ)
Discordance (%)
91500-1 5.597 0.08 0.074 0.00 1.827 0.06 0.179 0.003 0.47 1047 63 1060 15 -1
91500-2 5.591 0.08 0.072 0.00 1.778 0.05 0.179 0.003 0.52 990 53 1061 14 -7
91500-3 5.574 0.08 0.074 0.00 1.831 0.03 0.179 0.002 0.74 1042 33 1064 13 -2
91500-4 5.578 0.07 0.075 0.00 1.859 0.03 0.179 0.002 0.77 1075 31 1063 13 1
91500-5 5.564 0.08 0.078 0.00 1.926 0.04 0.180 0.002 0.71 1141 35 1065 13 7
91500-6 5.593 0.08 0.075 0.00 1.845 0.05 0.179 0.003 0.50 1066 57 1061 14 0
91500-7 5.583 0.07 0.075 0.00 1.856 0.04 0.179 0.002 0.61 1073 41 1062 13 1
91500-8 5.579 0.07 0.076 0.00 1.880 0.03 0.179 0.002 0.70 1098 33 1063 12 3
91500-9 5.588 0.07 0.075 0.00 1.839 0.03 0.179 0.002 0.68 1056 36 1061 13 0
91500-10 5.614 0.07 0.075 0.00 1.833 0.03 0.178 0.002 0.71 1059 34 1057 13 0
91500-11 5.600 0.07 0.075 0.00 1.838 0.04 0.179 0.002 0.66 1060 38 1059 13 0
91500-12 5.585 0.07 0.074 0.00 1.827 0.04 0.179 0.002 0.58 1042 43 1062 13 -2
91500-13 5.589 0.07 0.075 0.00 1.861 0.03 0.179 0.002 0.78 1081 30 1061 12 2
91500-14 5.587 0.07 0.075 0.00 1.853 0.04 0.179 0.002 0.69 1072 36 1061 13 1
91500-15 5.589 0.08 0.075 0.00 1.850 0.05 0.179 0.002 0.53 1069 51 1061 13 1
91500-16 5.592 0.07 0.075 0.00 1.845 0.04 0.179 0.002 0.56 1063 46 1061 13 0
Table A8.3. U-Pb data for the 91500 zircon standard.

Page 205
Fig. A8.1.The weighted average age and concordia age for the GJ1zircon standard.
Fig. A8.2.The weighted average age and concordia age for the FC1 zircon standard.
Fig. A8.3.Weighted average age and concordia age for the 91500 zircon standard.