Geological Applications of Fossils Sue Rigby 1. An introduction to palaeontological data 2....
64
Geological Applications of Fossils Sue Rigby An introduction to palaeontologic data 2. Biostratigraphy 3. Palaeobiogeography 4. Palaeoenvironments 5. Taphonomy + practicals and computer assignments Assessment by practical folder and exam
-
Upload
phoebe-tucker -
Category
Documents
-
view
215 -
download
1
Transcript of Geological Applications of Fossils Sue Rigby 1. An introduction to palaeontological data 2....

Geological Applications of FossilsSue Rigby
1. An introduction to palaeontological data
2. Biostratigraphy
3. Palaeobiogeography
4. Palaeoenvironments
5. Taphonomy
+ practicals and computer assignments
Assessment by practical folder and exam
1. An introduction to palaeontological data
a. Types of fossilb. The potential of the fossil recordc. How good is the fossil record?d. Taxonomy and phylogenye Data from a single fossilf. Data from a set of fossils
Practical: A crash course in fossil identification
Computer assignment:Manipulating data from fossils
a. Types of fossil
Body fossils
Trace fossils
Biomarkers, eg dinosterane
Isotopic signatures eg light C isotopes
Rocks - reefs, coal, oil, black shale etc.
Temporal information in DNA/RNA

b. The potential of the fossil record.
Secular changes in organisms
Secular changes in Earth system
Local changes in environment
Local changes in palaeogeography
Short term records of events - ontogeny, population dynamics
Relative timescales
Post-mortem events
c. Is the fossil record good enough?
For some things but not for others.
Fossil record is of about 250 000 species
About 2 million species known today.
Probably less than half the total number
(But most of these are insects and their fossil record is terrible)
Fossil record lasts 3.5 billion years
Hence a small sample.
In addition it is a biased sample
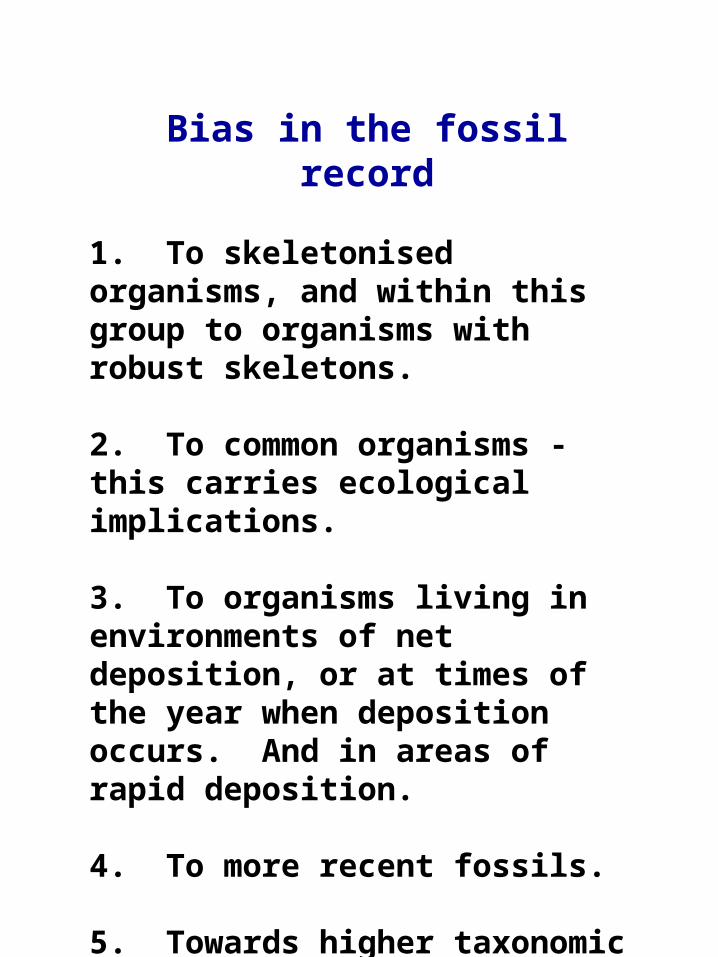
Bias in the fossil record
1. To skeletonised organisms, and within this group to organisms with robust skeletons.
2. To common organisms - this carries ecological implications.
3. To organisms living in environments of net deposition, or at times of the year when deposition occurs. And in areas of rapid deposition.
4. To more recent fossils.
5. Towards higher taxonomic groups
6. To particular sea level stands/systems tracts.


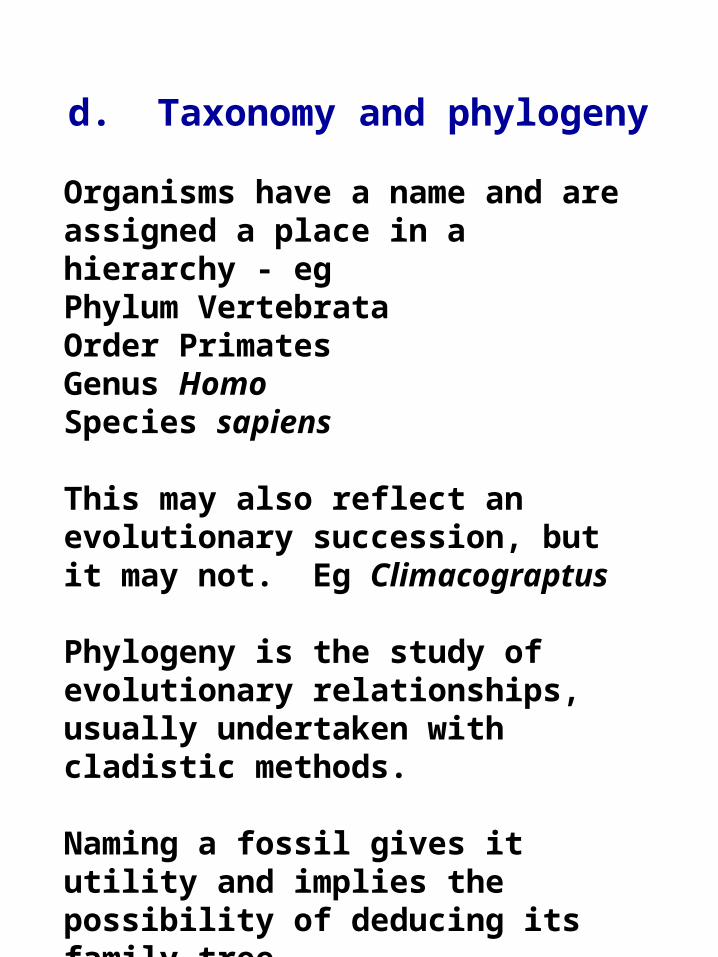
d. Taxonomy and phylogeny
Organisms have a name and are assigned a place in a hierarchy - eg Phylum VertebrataOrder PrimatesGenus HomoSpecies sapiens
This may also reflect an evolutionary succession, but it may not. Eg Climacograptus
Phylogeny is the study of evolutionary relationships, usually undertaken with cladistic methods.
Naming a fossil gives it utility and implies the possibility of deducing its family tree.

e. Data from a single fossil
Complete/ damagedOntogeny?PhylogenyCharacteristics relative to its group - big, small, odd?Unique indicator of conditions?Eg Kodonophyllum from Torquay Limestone.
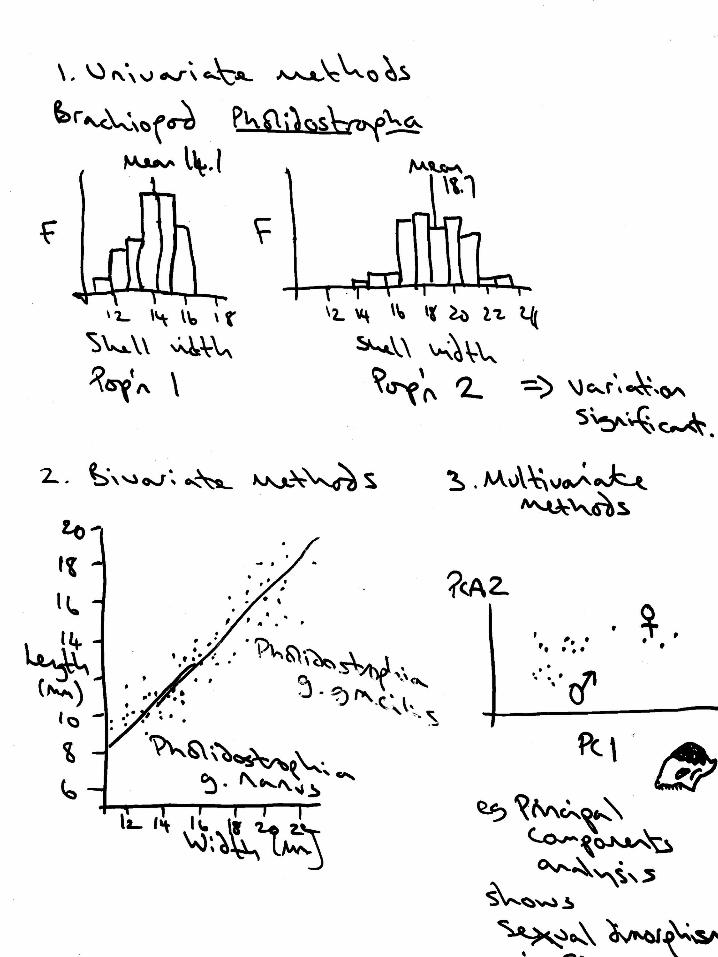
f. Data from a set of fossilsVariations within and between sets of fossils
UnivariateBivariateMultivariate measures of form data
Explored in computer assignment.


2. Biostratigraphy
a. Stratigraphic procedureb. Correlating with fossils - evolution vs ecologyc. Calibration of the fossil recordd. Confidence limits on stratigraphye. Sequence stratigraphy and fossils
Practical: A crash course in microfossil identification
Computer assignment:Producing a functional biostratigraphic solution from outcrop data.

a. Stratigraphic procedure
‘Stratigraphy is the study of the geometry, composition and time relations of stratified rocks.’
Biostratigraphy addresses these questions via fossil data.
Three aims:1. Lithostratigraphy - define and describe individual rock units in the area of study.2. Correlation - correlate these units with units elsewhere and with standardised time scales.3. Chronostratigraphy - to define and refine a standard global timescale.

Elements of Stratigraphy

Lithostratigraphy
Hierarchy:SupergroupGroup FormationMemberBed
Formation is the basic mappable unit. Usually named after a locality and a rock type, eg. Speaton Clay Formation.
Formation boundaries need not by isochronous.
Definition of formations is the choice of the individual mapper.
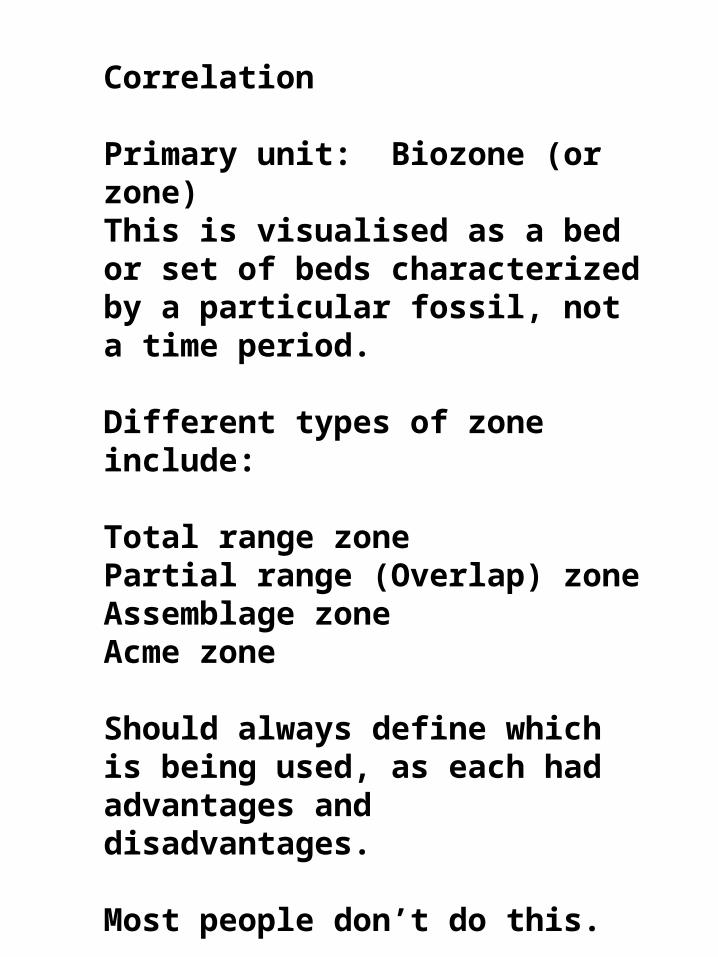
Correlation
Primary unit: Biozone (or zone)This is visualised as a bed or set of beds characterized by a particular fossil, not a time period.
Different types of zone include:
Total range zonePartial range (Overlap) zoneAssemblage zoneAcme zone
Should always define which is being used, as each had advantages and disadvantages.
Most people don’t do this.

Zone fossil
Isograptus
Didymograptus
Tetragraptus
Younger
LowerOrdovici
an
Older
Clonograptus

Chronostratigraphy
Establishes age relationships based on rock sequences to build up a globally applicable timescale.
Divides time equivalent rock packages into:System, series and stage.
Time equivalents arePeriod, epoch and age.

Absolute age tie-points for Lower Palaeozoic

b. Correlating with fossils - evolution vs ecology
Why it works:Evolution changes morphologySpecies disperse
Why it doesn’t workMorphology may not reflect phylogenyLocal variation may not be an evolutionary signalSpecies don’t completely disperseBioturbation
Good zone fossilsEvolve rapidlyHave a wide geographic rangeAre common

c. Calibration of the fossil record
By isotopic dating, usually U-Pb for best accuracy.
About 32 dates for the period 580-380 Ma.
Correlation is often imprecise because sections with appropriate lavas may lack good zone fossils. The Precambrian/Cambrian boundary is a good example of this.
By contrast there are around 50 graptolite biozones for the Silurian (443-417 Ma), so many of these, and their relative lengths remain unconstrained.


d. Confidence limits on stratigraphy
Fossils disappear in most places before they really went extinct.
If fossiliferous horizons are randomly distributed then -
Rc=r
where Rc is the confidence interval for the true end-point of a range and is given by
= [(1-C)-1/(H-1) -1]
where H is the number of fossiliferous horizons that contain the fossil and C is the desired confidence level (say 95%).In other words, real extinction is more likely to be close to the last occurrence in fossiliferous sections (not rocket science but useful)

e. Sequence stratigraphy and fossils
But most sections are not randomly fossiliferous.
Many reasons for this including sea level changes. These often interpreted in the light of sequence stratigraphy.
Sequences are built up from parasequences which are shallowing-upward sedimentary cycles bounded by flooding surfaces.
These packets can be erosional on on another.
Apparent extinctions cluster at flooding sequence boundaries, because they represent times of non-deposition.
Also, sequences reflecting changing sea level juxtapose facies deposited at different water depths and this can lead to multiple repeats of faunas, and apparent extinctions of the more diverse shallow water forms.


3. Palaeobiogeography
a. Modern biogeographyb. Moving organisms - dispersal and vicariance modelsc. Identifying fossil provincesd. Examples
Practical: Fossil identification testBrookes Parsimony analysis
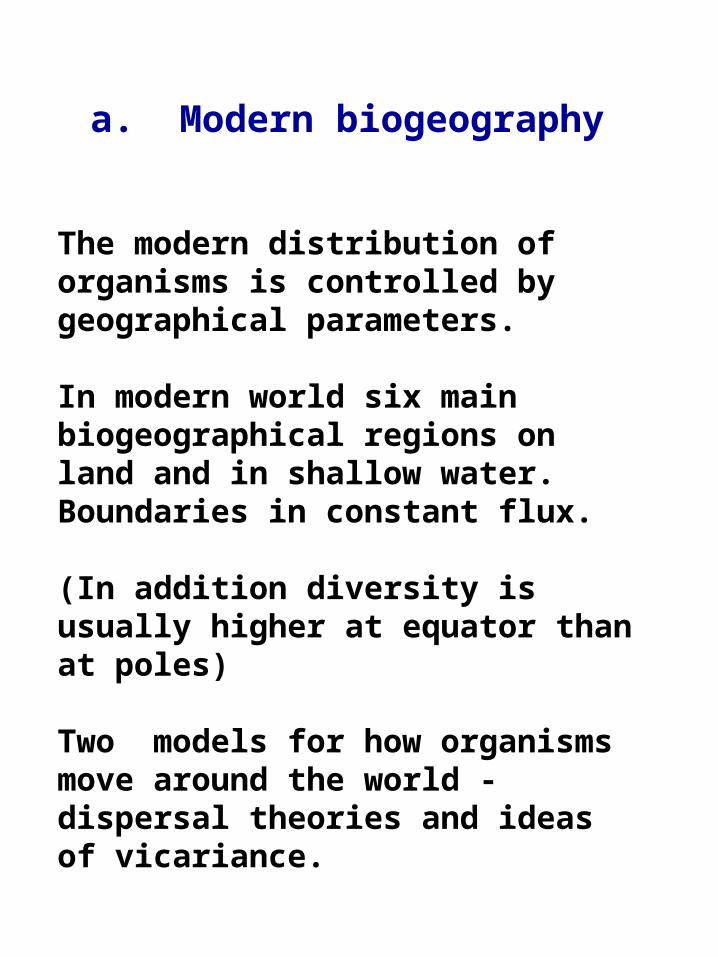
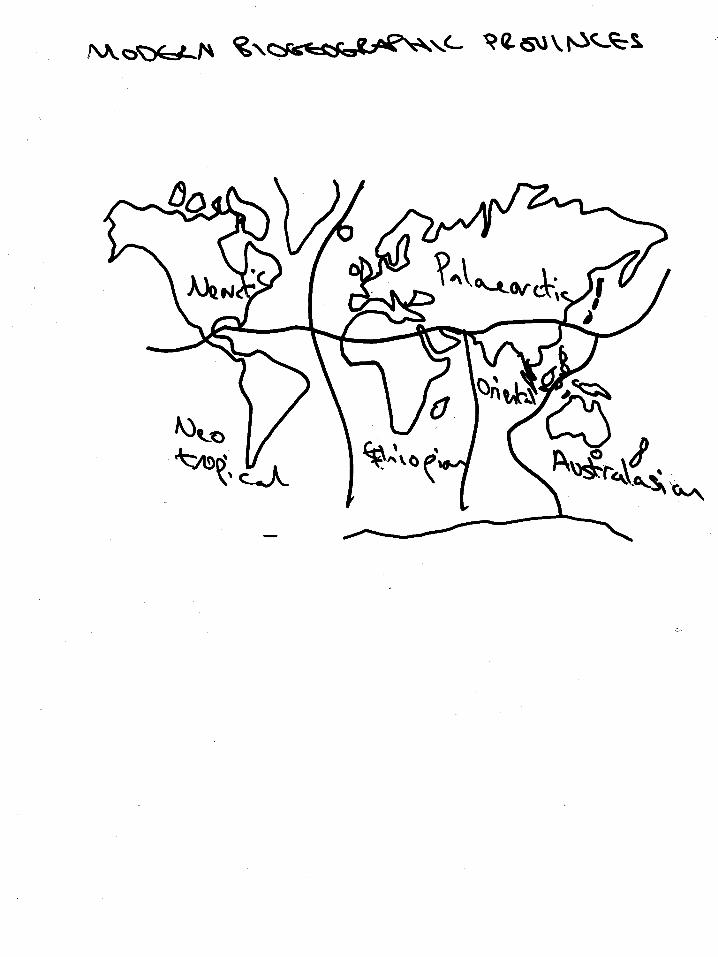
a. Modern biogeography
The modern distribution of organisms is controlled by geographical parameters.
In modern world six main biogeographical regions on land and in shallow water. Boundaries in constant flux.
(In addition diversity is usually higher at equator than at poles)
Two models for how organisms move around the world - dispersal theories and ideas of vicariance.

b. Dispersal
Organisms evolve in one place and migrate to others.
Maps of modern diversity suggest that it remains highest close to the point where organisms originate.
Migration away from this site is via corridors of dispersal, and is impeded by barriers to dispersal.
Corridors often take the form of islands.
Barriers can be permanent, ephemeral or intermittant.
Barriers are recorded by separate evolution in two areas. Barrier removal is recorded by faunal interchange.


b. Vicariance
Organisms stay on one place, but it becomes two or more - that is barriers form.
This is a plate tectonic scenario, but works on smaller scales as well, for example river dissection of uplands.
When two areas are separated, evolution will produce new species in each.
Species evolution therefore mirrors geological evolution of a region.
Offers a powerful tool for geoscientists.

c. Recognizing fossil provinces
Recognizing fossil provinces depends on faunal analysis and having a well constrainted biostratigraphy.
Vicariance techniques can use biotas to explore the geological evolution of a region.
Broader assessments of similarity and difference can identify ancient provinces and hence ancient continents. This only useful on a small scale or in deep time.
d. ExamplesNorth American Cordillera Lower Palaeozoic continental dispositions.


3. Palaeoenvironments
a. Temporal constraintsb. Bathymetryc. Oxygend. Atmospheric CO2
e. Climate from plants
Practical: Practical testWeb-based analysis of Cretaceous climate

a. Temporal constraints
Particular organisms or ecosystems reflect particular palaeoenvironments, but these change through time.
Eg. Colonisation of land extended utility of fossils to terrestrial environments.
|Reefs and their inhabitants -Specific implications of modern reef distribution.
Only applicable to zooxanthellae-bearing reef builders? Or generally true?

b. Bathymetry
Relative depth indicators - not a direct depth control but indirect changes in eg salinity, O2, temperature, energy)eg Welsh Basinichnofacies
Photic zone - absolute indicator, but turbidity is a factor.
CCD - eg agglutinated forams become dominant over calcareous forms.But oxygen also a control at depth.
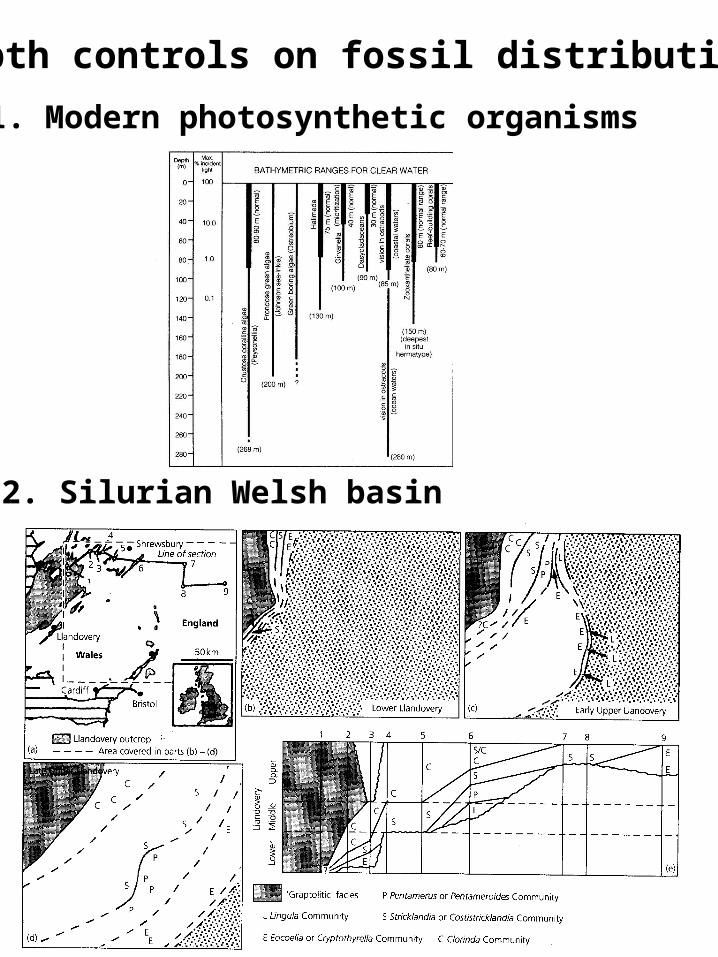
Depth controls on fossil distribution
1. Modern photosynthetic organisms
2. Silurian Welsh basin

c. Oxygen
Oceans have been oxygenated at depth since the late Proterozoic, but levels have increased with time.
Secular variations are related to icehouse/greenhouse states.
Local conditions can contribute to low oxygen levels.
Palaeontology mainly contributes by providing a recognition of adaptations to aerobic respiration in low oxygen tolerances.
c. Animals designed for low O2
Low metabolic rates - slow, long lived, small.Efficient blood circulatory systems. Eg. Blood arks (bivalves).Flattened or thread like bodies eg paper clamsTolerance of H2S and symbiosis woth sulphur reducing bacteria eg olenid trilobitesPlanktic larvae eg larval beds in Kimmeridge Clay.
General faunal characteristics can be useful as well. Eg presence of deep burrows.

Characteristics of assemblages fromspecific oxygenation states

d. Atmospheric CO2
Secular changes in CO2 have occurred throughout the Phanerozoic, and probably most of the Precambrian
Some of these are caused by biota, most are recorded by fossils.
Most accurate record is in the number of stomata, compared with nearlest living relative (NLR)

Estimates of palaeo-CO2 from stomatal indices plotted against a calculated curve.

e. Fossil climate from plants
Most useful feature is leaf morphology - controlled by temperature and water availability ie local climate. Univariate methods mainly entire/non-entire marginsMultivariate methods eg CLAMP (climate leaf analysis multivariate program) also factor in things like leaf size and presence of diagnostic features like drip-tips.
Also wood anatomy - ring porousity, presence of annual growth rings

Using leaves to estimate climatic variables
5. Taphonomy
a. Fossilized materialsb. How things fossilizec. Preservation bias - information loss and gaind. Lagerstatten
Practical: Fossil identification testTaphonomic assessment of specimens
a. Fossilized materials
1. DNA - only back to 50K2. Proteins - perhaps back to 100K. ? Ordovician collagen?3. Lipids - constitute most chemical fossils4. Bacteria - ubiquitous but impossible to classify5. Plant tissues - high levels of bias result from original composition6. Animal cuticles - as above7. Shells - reflect conditions of postmortem transport and burial8. Bones - ditto

5. Plant tissues - high levels of bias result from original composition

8. Bones - reflect conditions of postmortem transport and burial

8. Bones - reflect conditions of postmortem transport and burial
b. How things fossilize
1. Death2. Decay - usually rapid, especially in presence of oxygen. Retarded by aridity and low temperatures3. Bioerosion - boring, rasping, fungal infestation. Highest in shallow, highly productive areas with low rates of sedimentation. Informative about these palaeoceanographic parameters(4. Preservation on or under microbial mats)5. Transport - almost ubiquitous. By physical or biological agents. But, mostly transport within habitat - studies suggest death assemblages have high spatial fidelity with local living fauna.6. Time averaging - controlled by sedimentation rate and shell destruction rate.7. Burial - and post-depositional chemical and physical effects.

3. Bioerosion - boring, rasping, fungal infestation. Highest in shallow, highly productive areas with low rates of sedimentation. Informative about these palaeoceanographic parameters

(4. Preservation on or under microbial mats)

6. Time averaging - controlled by sedimentation rate and shell destruction rate.


c. Preservation bias
1. What is the quality of the fossil record and how does bias occur? See table
a. Bias due to variety of biological materials.Eg For living intertidal macrobenthos off Washington State -100% of robust shelled forms known from fossils73% of fragile shelled species0% of shell-less invertebrates
b. Bias linked to postmortem environmentBiggest divide between land and sea.More on the detail of this in practical
c. Secular trends - Precambrian/Cambrian boundaryCalcite/aragonite seas.


d. Lagerstatten
Extraordinary fossil occurrences.Konzentrat-lagerstattenKonservat-lagerstatten
eg Flies in amberHunsruck Slate
All geological periods, most environments.
Windows on the past
But what degree of bias?