Geography Trends Report - Q2 2013 - Preview Deck
19
Copyright © 2013, Everest Global, Inc. EGR-2013-8-PD-0918 April-June 2013 Market Vista: Buyer Geography Trends – Preview Deck Global Services Trends in Q2 2013
-
Upload
everest-group -
Category
Documents
-
view
213 -
download
0
description
Everest Group's Buyer Geography Trends reports provide insights into outsourcing and offshoring trends in U.S.& Canada, Europe, Rest of the world. Each Buyer Geography Trends report provides region-specific data and insights into outsourcing transaction activity, Global In-house Center (GIC) developments for buyers in that region, service provider market share, and details on key outsourcing transactions
Transcript of Geography Trends Report - Q2 2013 - Preview Deck
Copyright © 2013, Everest Global, Inc.
EGR-2013-8-PD-0918
April-June 2013
Market Vista: Buyer Geography Trends – Preview Deck
Global Services Trends in Q2 2013
Copyright © 2013, Everest Global, Inc.
EGR-2013-8-PD-0918 2
Our research offerings for global services
Subscription information
This report is included in
the following
subscription(s)
– Market Vista
In addition to published
research, a subscription
may include analyst
inquiry, data cuts, and
other services
If you want to learn
whether your organization
has a subscription
agreement or request
information on pricing and
subscription options,
please contact us:
– +1-214-451-3110
1 Banking, financial services, and insurance
Finance & accounting
Procurement
Human resources
Recruitment process
Service provider intelligence Global sourcing
PricePoint
Contact center
Transaction Intelligence
Healthcare information technology
Information technology
Cloud Vista
BFSI1 business process
BFSI1 information technology
Market Vista
Global services tracking across functions, sourcing models, locations, and service providers –
industry tracking reports also available
Custom research capabilities
Benchmarking | Pricing, delivery model, skill portfolio
Peer analysis | Scope, sourcing models, locations
Locations | Cost, skills, sustainability, portfolio
Tracking services | Service providers, locations, risk
Other | Market intelligence, service provider capabilities, technologies, contract assessment
Copyright © 2013, Everest Global, Inc.
EGR-2013-8-PD-0918 3
Table of contents
Product overview
Illustrative contents
Copyright © 2013, Everest Global, Inc.
EGR-2013-8-PD-0918 4
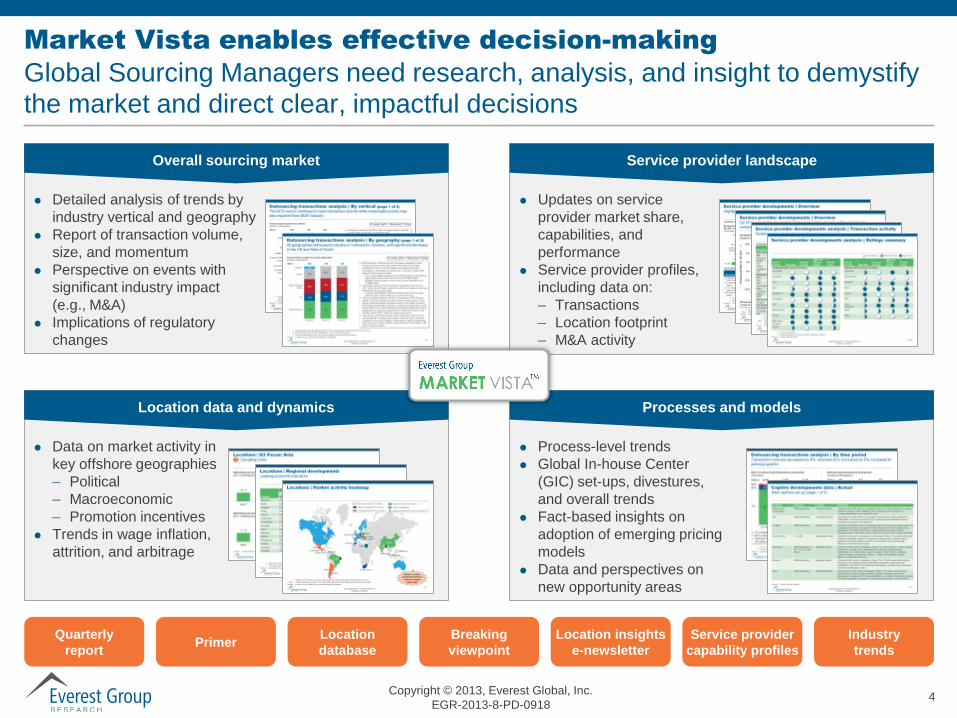
Market Vista enables effective decision-making
Global Sourcing Managers need research, analysis, and insight to demystify the market and direct clear, impactful decisions
Location data and dynamics
Data on market activity in
key offshore geographies
– Political
– Macroeconomic
– Promotion incentives
Trends in wage inflation,
attrition, and arbitrage
Overall sourcing market
Detailed analysis of trends by
industry vertical and geography
Report of transaction volume,
size, and momentum
Perspective on events with
significant industry impact
(e.g., M&A)
Implications of regulatory
changes
Service provider landscape
Updates on service
provider market share,
capabilities, and
performance
Service provider profiles,
including data on:
– Transactions
– Location footprint
– M&A activity
Processes and models
Process-level trends
Global In-house Center
(GIC) set-ups, divestures,
and overall trends
Fact-based insights on
adoption of emerging pricing
models
Data and perspectives on
new opportunity areas
Quarterly
report Primer
Location
database
Breaking
viewpoint
Location insights
e-newsletter
Service provider
capability profiles
Industry
trends
Copyright © 2013, Everest Global, Inc.
EGR-2013-8-PD-0918 5
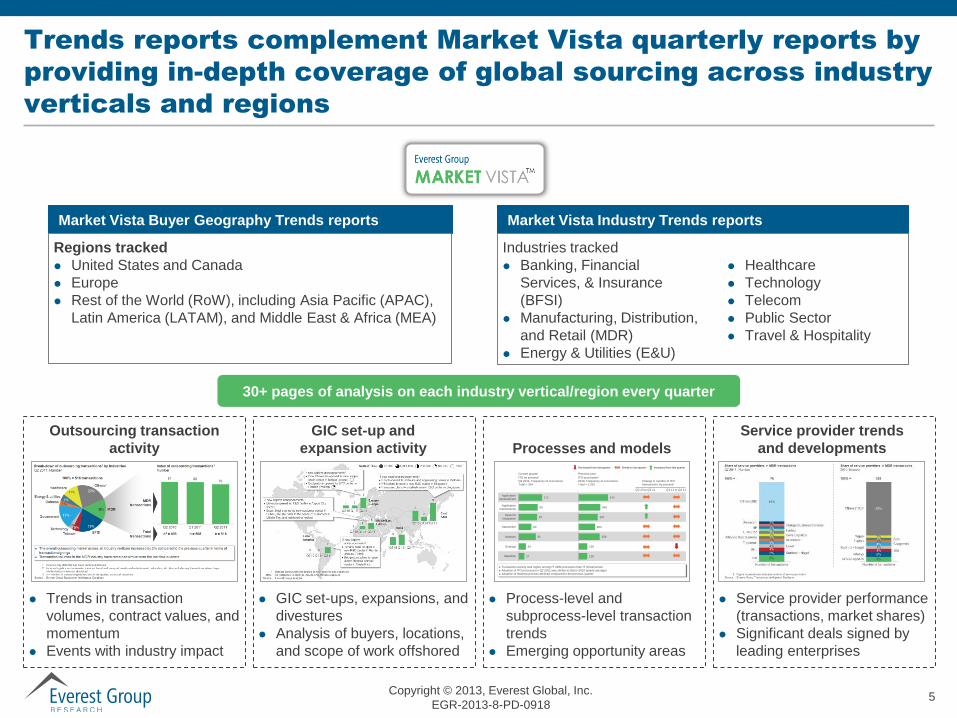
Trends reports complement Market Vista quarterly reports by
providing in-depth coverage of global sourcing across industry
verticals and regions
Outsourcing transaction
activity
GIC set-up and
expansion activity Processes and models
Service provider trends
and developments
Trends in transaction
volumes, contract values, and
momentum
Events with industry impact
GIC set-ups, expansions, and
divestures
Analysis of buyers, locations,
and scope of work offshored
Process-level and
subprocess-level transaction
trends
Emerging opportunity areas
Service provider performance
(transactions, market shares)
Significant deals signed by
leading enterprises
30+ pages of analysis on each industry vertical/region every quarter
Transaction activity was higher among IT ADM processes than IT infrastructure
Adoption of ITO processes in Q2 2011 was similar to that in 2010 (yearly average)
Adoption of Desktop process declined compared to the previous quarter
ITO by process1
Q2 2011; Frequency of occurrence
Total = 354
111
90
87
60
81
34
27
Application
development
Application
maintenance
Systems
integration
Datacenter
Network
Desktop
Helpdesk
ITO by process1
2010; Frequency of occurrence
Total = 1,381
472
348
307
263
339
139
138
Change in number of ITO
transactions, by process1
Current quarter Previous year
Q2 10 to Q2 11 Q1 11 to Q2 11
Decreased from last quarter Similar to last quarter Increased from last quarter
Market Vista Industry Trends reports Market Vista Buyer Geography Trends reports
Regions tracked
United States and Canada
Europe
Rest of the World (RoW), including Asia Pacific (APAC),
Latin America (LATAM), and Middle East & Africa (MEA)
Industries tracked
Banking, Financial
Services, & Insurance
(BFSI)
Manufacturing, Distribution,
and Retail (MDR)
Energy & Utilities (E&U)
Healthcare
Technology
Telecom
Public Sector
Travel & Hospitality
Copyright © 2013, Everest Global, Inc.
EGR-2013-8-PD-0918 6
Table of contents
Product overview
Illustrative contents
Copyright © 2013, Everest Global, Inc.
EGR-2013-8-PD-0918 7
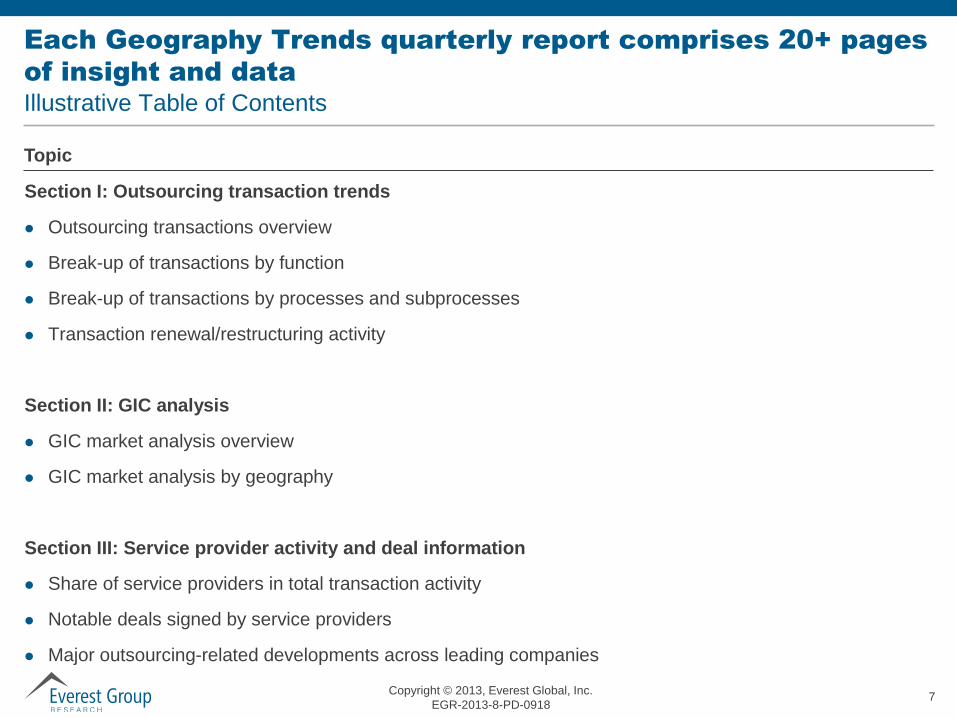
Each Geography Trends quarterly report comprises 20+ pages
of insight and data
Illustrative Table of Contents
Section I: Outsourcing transaction trends
Outsourcing transactions overview
Break-up of transactions by function
Break-up of transactions by processes and subprocesses
Transaction renewal/restructuring activity
Section II: GIC analysis
GIC market analysis overview
GIC market analysis by geography
Section III: Service provider activity and deal information
Share of service providers in total transaction activity
Notable deals signed by service providers
Major outsourcing-related developments across leading companies
Topic
Copyright © 2013, Everest Global, Inc.
EGR-2013-8-PD-0918 8
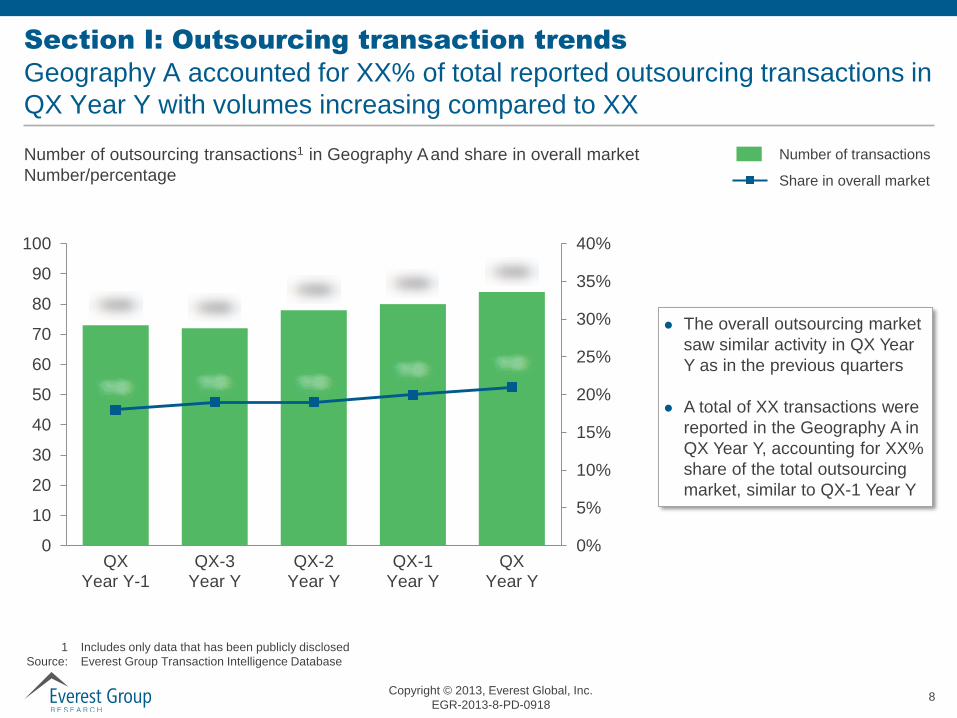
Section I: Outsourcing transaction trends
Geography A accounted for XX% of total reported outsourcing transactions in
QX Year Y with volumes increasing compared to XX
Number of outsourcing transactions1 in Geography A and share in overall market
Number/percentage
1 Includes only data that has been publicly disclosed
Source: Everest Group Transaction Intelligence Database
XX% XX% XX% XX% XX%
0%
5%
10%
15%
20%
25%
30%
35%
40%
0
10
20
30
40
50
60
70
80
90
100
QXYear Y-1
QX-3Year Y
QX-2Year Y
QX-1Year Y
QXYear Y
The overall outsourcing market
saw similar activity in QX Year
Y as in the previous quarters
A total of XX transactions were
reported in the Geography A in
QX Year Y, accounting for XX%
share of the total outsourcing
market, similar to QX-1 Year Y
Number of transactions
Share in overall market

Copyright © 2013, Everest Global, Inc.
EGR-2013-8-PD-0918 9
Section I: Outsourcing transaction trends
Transaction volumes XXXX across both ITO and BPO functions
XX% XX% XX% XX% XX%
XX%
XX% XX% XX% XX%
XX% XX%
QXYear Y-1
QX-3Year Y
QX-2Year Y
QX-1Year Y
QXYear Y
QXYear Y2Overall
Break-down of Geography A transactions by function
Number of transactions
ITO
BPO
Both
100% =
Source: Everest Group Transaction Intelligence Database
Geography A
A total of XX ITO
transactions were reported in
QX Year Y in the Geography
A, same as in QX-1 Year Y
A total of XX BPO
transactions were signed in
QX Year Y, as compared to
XX in QX-1 Year Y
Increase was seen in
transactions having both
BPO and ITO components in
QX Year Y
Copyright © 2013, Everest Global, Inc.
EGR-2013-8-PD-0918 10
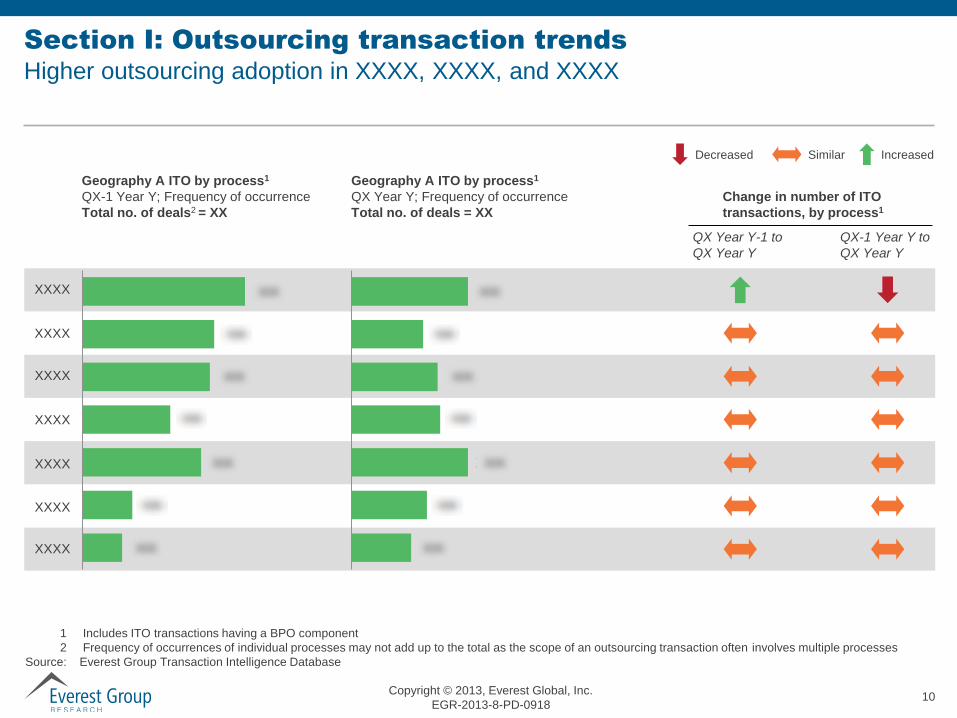
Section I: Outsourcing transaction trends
Higher outsourcing adoption in XXXX, XXXX, and XXXX
1 Includes ITO transactions having a BPO component
2 Frequency of occurrences of individual processes may not add up to the total as the scope of an outsourcing transaction often involves multiple processes
Source: Everest Group Transaction Intelligence Database
Geography A ITO by process1
QX-1 Year Y; Frequency of occurrence
Total no. of deals2 = XX
XXXX
XXXX
XXXX
XXXX
XXXX
XXXX
XXXX
Geography A ITO by process1
QX Year Y; Frequency of occurrence
Total no. of deals = XX
Change in number of ITO
transactions, by process1
QX Year Y-1 to
QX Year Y
QX-1 Year Y to
QX Year Y
XX
XX
XX
XX
XX
XX
XX
XX
XX
XX
XX
XX
XX
XX
Decreased Similar Increased
Copyright © 2013, Everest Global, Inc.
EGR-2013-8-PD-0918 11
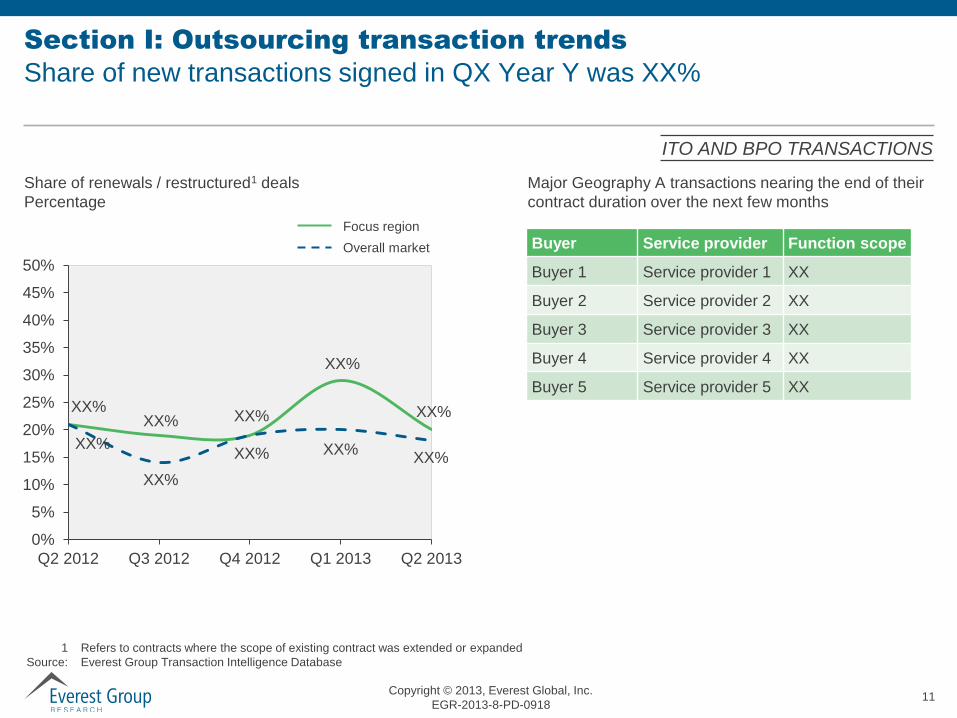
Section I: Outsourcing transaction trends
Share of new transactions signed in QX Year Y was XX%
Share of renewals / restructured1 deals
Percentage
ITO AND BPO TRANSACTIONS
Major Geography A transactions nearing the end of their
contract duration over the next few months
1 Refers to contracts where the scope of existing contract was extended or expanded
Source: Everest Group Transaction Intelligence Database
XX%
XX%
XX%
XX%
XX% XX% XX%
XX% XX% XX%
0%
5%
10%
15%
20%
25%
30%
35%
40%
45%
50%
Q2 2012 Q3 2012 Q4 2012 Q1 2013 Q2 2013
Focus region
Overall market Buyer Service provider Function scope
Buyer 1 Service provider 1 XX
Buyer 2 Service provider 2 XX
Buyer 3 Service provider 3 XX
Buyer 4 Service provider 4 XX
Buyer 5 Service provider 5 XX
Copyright © 2013, Everest Global, Inc.
EGR-2013-8-PD-0918 12
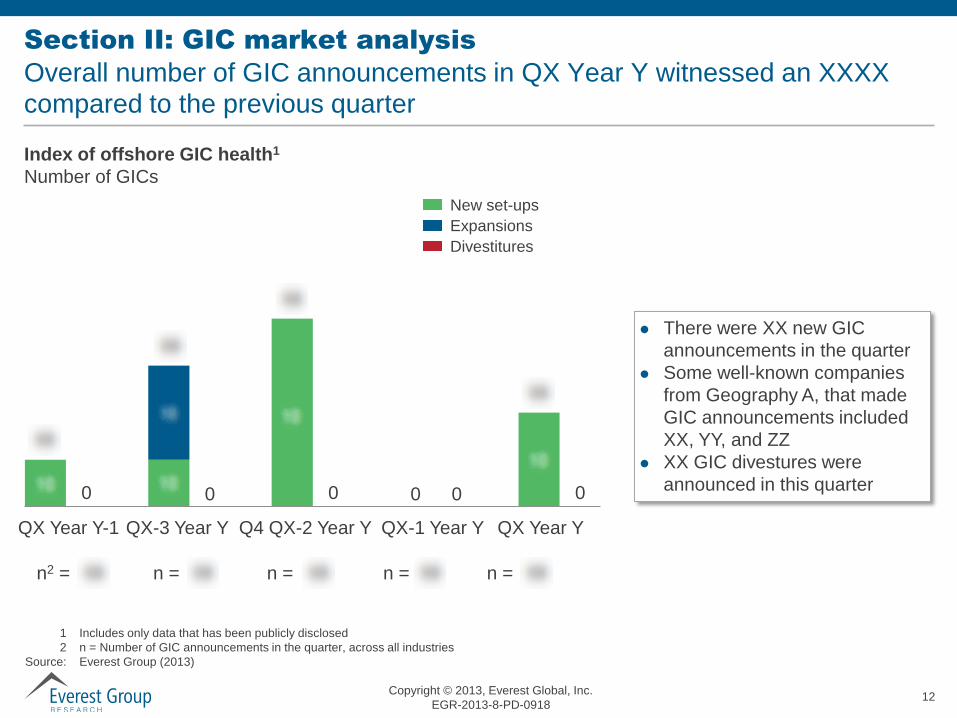
Section II: GIC market analysis
Overall number of GIC announcements in QX Year Y witnessed an XXXX compared to the previous quarter
X 0
X 0
X
0 0 0
X
0
X
QX Year Y-1 QX-3 Year Y Q4 QX-2 Year Y QX-1 Year Y QX Year Y
Index of offshore GIC health1
Number of GICs
New set-ups
Expansions
Divestitures
n2 = XX n = XX n = XX n = XX n = XX
1 Includes only data that has been publicly disclosed
2 n = Number of GIC announcements in the quarter, across all industries
Source: Everest Group (2013)
There were XX new GIC
announcements in the quarter
Some well-known companies
from Geography A, that made
GIC announcements included
XX, YY, and ZZ
XX GIC divestures were
announced in this quarter

Copyright © 2013, Everest Global, Inc.
EGR-2013-8-PD-0918 13
GIC set-ups1 | By region
GIC activity was concentrated in XXXX and XXXX
1 Indicates announcements related to actual GICs set-ups and expansion
Note: All references to GICs include only offshore GICs
Source: Everest Group analysis
XX XX
XX
QX YearY-1
QX-1Year Y
QX YearY
XX
XX
XX
QX YearY-1
QX-1Year Y
QX YearY
Latin America
Eastern Europe
East Asia
India
XX
XX
XX
QX YearY-1
QX-1Year Y
QX YearY
XX
XX
XX
QX YearY-1
QX-1Year Y
QX YearY
XX
XX XX
QX YearY-1
QX-1Year Y
QX YearY
XX new GIC announcements1
XXXX opened its shared business service
center in XXXX
XXXX opened its new customer service
center in XXXX
XX new GIC announcements1
XXXX opened its new customer
service center in XXXX
XX new GIC announcements1
XXXX opened its new shared
services center in XXXX
XX new GIC announcements1
XXXX opened a new R&D
center in XXXX
Middle East and Africa
XX new GIC
announcements1
XXXX opened its
R&D center in XXXX

Copyright © 2013, Everest Global, Inc.
EGR-2013-8-PD-0918 14
Section III: Service provider activity and deal information
Share of service providers in transaction activity
100% =
Share of service providers in transactions
QX Year Y; Number
Share of service providers in transactions
Year Y-1; Number
100% =
1 Figure in parenthesis indicate number of service providers
Source: Everest Group Transaction Intelligence Database
7%
7%
5% 5% 5% 4% 4% 4% 4% 4% 3% 3% 3%
44%
Number of transactions
Service provider 6 Service provider 5
Service provider 4
Service provider 3
Service provider 1
Service provider 2
Service provider 7 Service provider 8
Service provider 9 Service provider 10
Service provider 11 Service provider 12
Service provider 13
Others (XX)1
12%
9%
5% 4% 4% 4% 4% 3% 3% 3% 3% 3% 3%
43%
Number of transactions
Service provider 6 Service provider 5
Service provider 4 Service provider 3
Service provider 1
Service provider 2
Service provider 7 Service provider 8
Service provider 9 Service provider 10
Service provider 11 Service provider 12
Service provider 13
Others (XX)1
Copyright © 2013, Everest Global, Inc.
EGR-2013-8-PD-0918 15
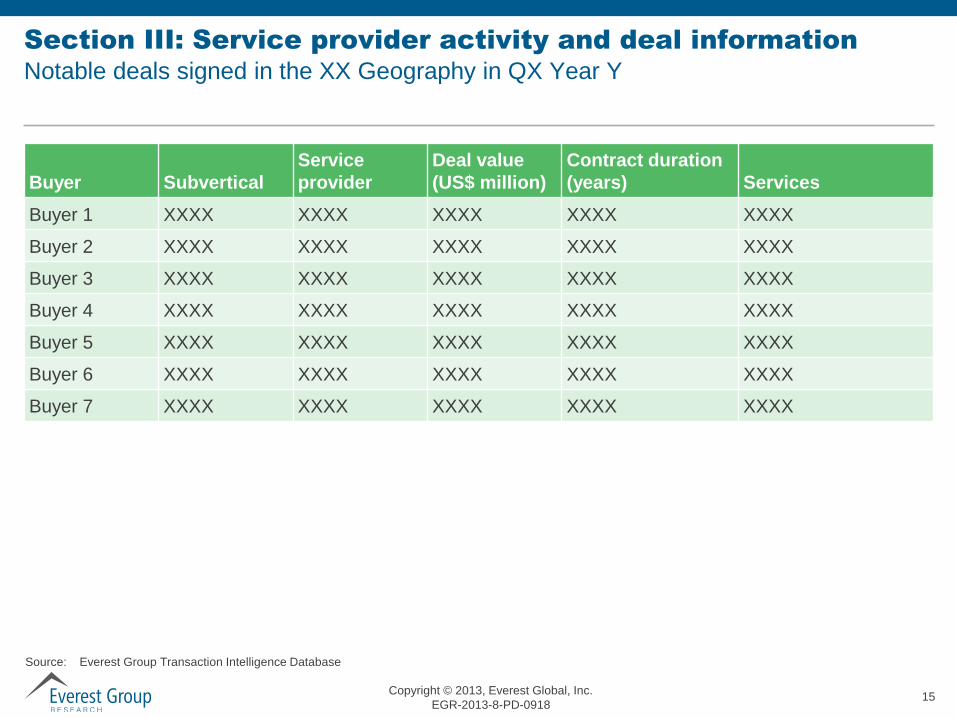
Section III: Service provider activity and deal information
Notable deals signed in the XX Geography in QX Year Y
Buyer Subvertical
Service
provider
Deal value
(US$ million)
Contract duration
(years) Services
Buyer 1 XXXX XXXX XXXX XXXX XXXX
Buyer 2 XXXX XXXX XXXX XXXX XXXX
Buyer 3 XXXX XXXX XXXX XXXX XXXX
Buyer 4 XXXX XXXX XXXX XXXX XXXX
Buyer 5 XXXX XXXX XXXX XXXX XXXX
Buyer 6 XXXX XXXX XXXX XXXX XXXX
Buyer 7 XXXX XXXX XXXX XXXX XXXX
Source: Everest Group Transaction Intelligence Database
Copyright © 2013, Everest Global, Inc.
EGR-2013-8-PD-0918 16
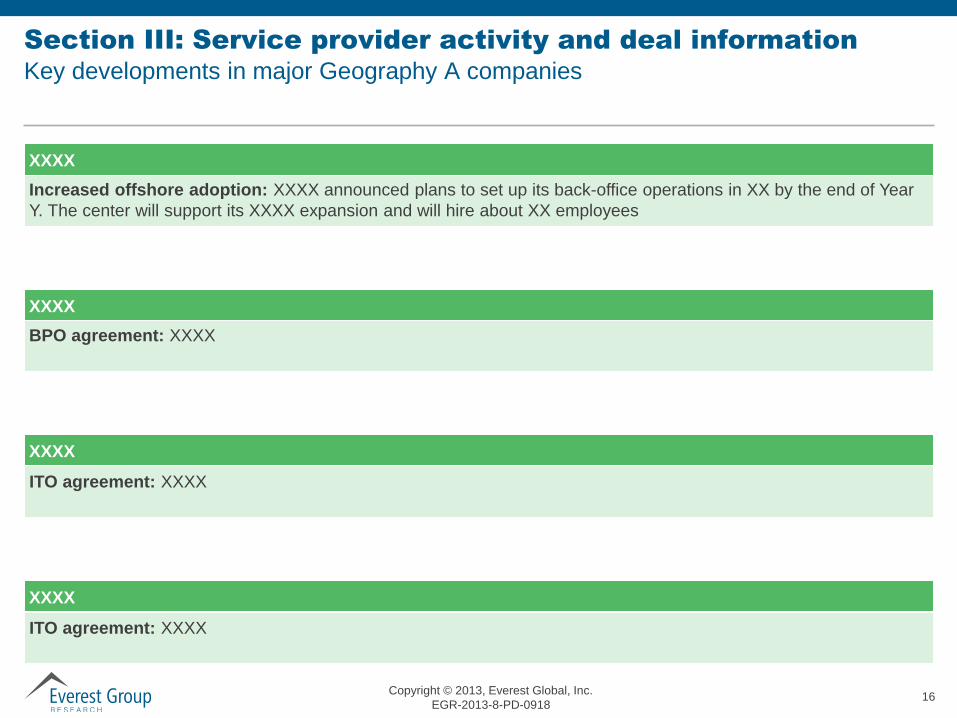
Section III: Service provider activity and deal information
Key developments in major Geography A companies
Increased offshore adoption: XXXX announced plans to set up its back-office operations in XX by the end of Year
Y. The center will support its XXXX expansion and will hire about XX employees
XXXX
BPO agreement: XXXX
XXXX
ITO agreement: XXXX
XXXX
ITO agreement: XXXX
XXXX
Copyright © 2013, Everest Global, Inc.
EGR-2013-8-PD-0918 17
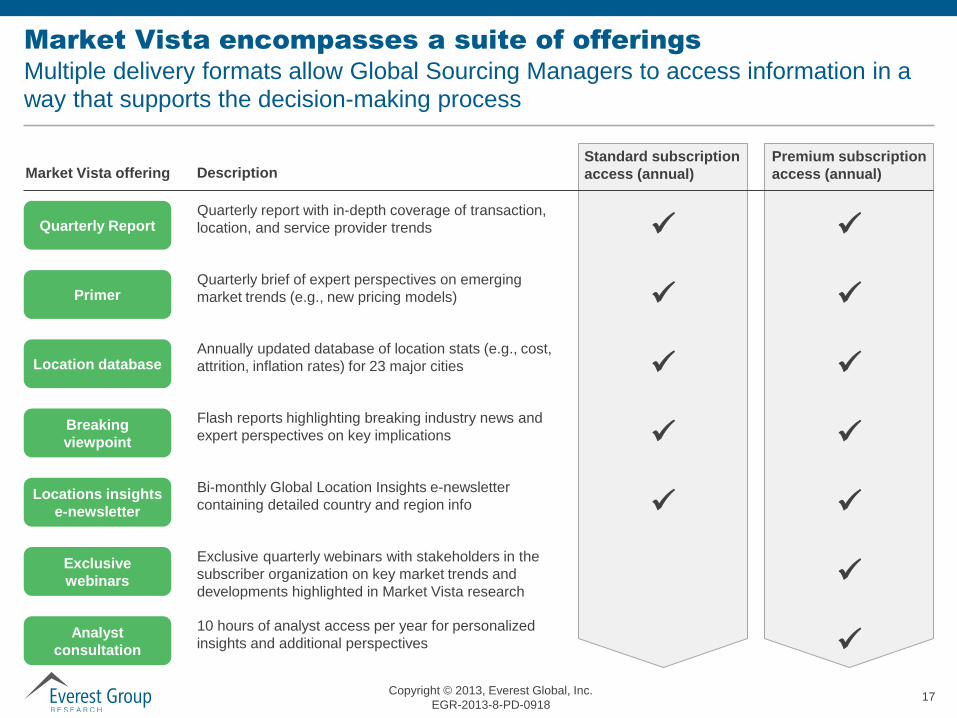
Market Vista encompasses a suite of offerings
Multiple delivery formats allow Global Sourcing Managers to access information in a way that supports the decision-making process
Market Vista offering Description Standard subscription
access (annual)
Premium subscription
access (annual)
Quarterly report with in-depth coverage of transaction,
location, and service provider trends
Primer Quarterly brief of expert perspectives on emerging
market trends (e.g., new pricing models)
Location database Annually updated database of location stats (e.g., cost,
attrition, inflation rates) for 23 major cities
Breaking
viewpoint
Flash reports highlighting breaking industry news and
expert perspectives on key implications
Locations insights
e-newsletter
Bi-monthly Global Location Insights e-newsletter
containing detailed country and region info
Quarterly Report
Exclusive quarterly webinars with stakeholders in the
subscriber organization on key market trends and
developments highlighted in Market Vista research
10 hours of analyst access per year for personalized
insights and additional perspectives
Exclusive
webinars
Analyst
consultation
Copyright © 2013, Everest Global, Inc.
EGR-2013-8-PD-0918 18
Appendix: Additional research references
For more information on this and other research published by the Everest Group, please contact us:
H. Karthik, Vice President – Global Sourcing:
Salil Dani, Practice Director:
Anurag Srivastava, Practice Director:
Shyam Sundar Amara, Knowledge Associate:
Everest Group
Two Galleria Tower
13455 Noel Road, Suite 2100
Dallas, TX 75240
Phone: +1-214-451-3110
E-mail: [email protected]
The following documents are recommended for additional insight on the topic covered in this Research Report. The recommended documents
either provide additional details on the topic or complementary content that may be of interest
1. Market Vista: Q2 2013 (EGR-2013-8-R-0907); 2013. This report includes data, analysis and insights on transaction trends, information on major deals,
GIC market dynamics, and fact-base for offshoring destinations in Asia. Also included is the Standard Locations Database that tracks 23 leading
offshore locations
2. Industry Trends reports: Trends for Q1 2013. These reports provide industry-specific data, developments, and insights that enable global sourcing
managers to navigate through the complexity, and make clear, effective decisions, contextualized and suited to their specific industry. These reports
provides a deep-dive into the transaction activity, GIC developments, service provider market share, and key outsourcing transactions specific to the
industry. Industries covered include: Banking, Financial Services, and Insurance (BFSI); Manufacturing, Distribution, and Retail (MDR); Energy and
Utilities (E&U); Healthcare; Technology; Telecom; Public Sector; and Travel and Hospitality
3. Buyer Geography Trends reports: Trends for Q1 2013. These reports provide data, developments, and insights on outsourcing and offshoring
trends for a particular buyer geography/region. These reports provide the research and analysis that enable users to navigate through complexity and
make clear, effective decisions suited to their focus region. These reports provide detailed information on transaction activities, Global In-house Center
(GIC) developments, service providers’ market shares, and key outsourcing transactions specific to particular regions. Regions covered include: U.S.
and Canada; Europe; and Rest of the World
Blogs
www.sherpasinblueshirts.com
www.gainingaltitudeinthecloud.com
@EverestGroup
@Everest_Cloud
Stay connected
Websites
www.everestgrp.com
research.everestgrp.com
Dallas (Headquarters)
+1-214-451-3000
New York
+1-646-805-4000
Toronto
+1-647-557-3475
London
+44-207-129-1318
Delhi
+91-124-284-1000
At a glance
With a fact-based approach driving outcomes, Everest Group counsels
organizations with complex challenges related to the use and delivery of the
next generation of global services
Through its practical consulting, original research, and industry resource
services, Everest Group helps clients maximize value from delivery strategies,
talent and sourcing models, technologies, and management approaches
Established in 1991, Everest Group serves users of global services, providers
of services, country organizations, and private equity firms in six continents
across all industry categories