Geography and Climate - Census and Statistics … · Geography Hong Kong is ... Hong Kong in the...
4
Geography Hong Kong is situated at the south-eastern tip of the mainland of China, with a total area of about 1 104 square kilometres covering Hong Kong Island, Kowloon and the New Territories and Islands. Meteorological Observations Normals (1971–2000) Whole January July year 2010 Air temperature (°C) Mean maximum 18.6 31.3 25.6 25.8 Mean 16.1 28.7 23.1 23.2 Mean minimum 14.1 26.7 21.1 21.2 Mean relative humidity (%) 73 81 78 80 Total rainfall (mm) 24.9 374.4 2 382.7 2 371.7 Total bright sunshine (hours) 141.7 214.9 1 842.9 1 709.3 Mean wind speed (km/h) 25.4 21.9 23.9 22.6 Hong Kong in the Asia Pacific Region Geography and Climate
Transcript of Geography and Climate - Census and Statistics … · Geography Hong Kong is ... Hong Kong in the...
Geography
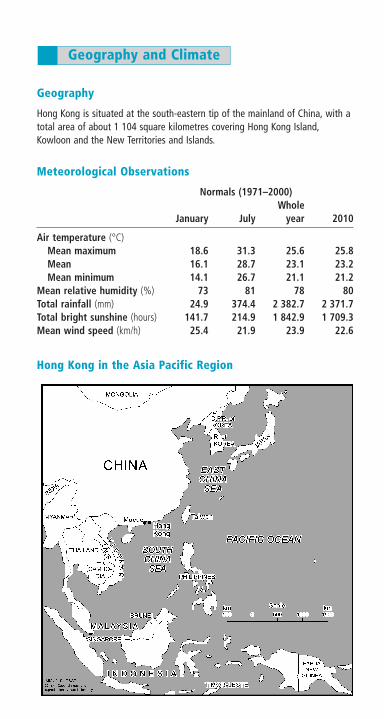
Hong Kong is situated at the south-eastern tip of the mainland of China, with atotal area of about 1 104 square kilometres covering Hong Kong Island,Kowloon and the New Territories and Islands.
Meteorological Observations
Normals (1971–2000)Whole
January July year 2010
Air temperature (°C)Mean maximum 18.6 31.3 25.6 25.8Mean 16.1 28.7 23.1 23.2Mean minimum 14.1 26.7 21.1 21.2
Mean relative humidity (%) 73 81 78 80Total rainfall (mm) 24.9 374.4 2 382.7 2 371.7Total bright sunshine (hours) 141.7 214.9 1 842.9 1 709.3Mean wind speed (km/h) 25.4 21.9 23.9 22.6
Hong Kong in the Asia Pacific Region
Geography and Climate
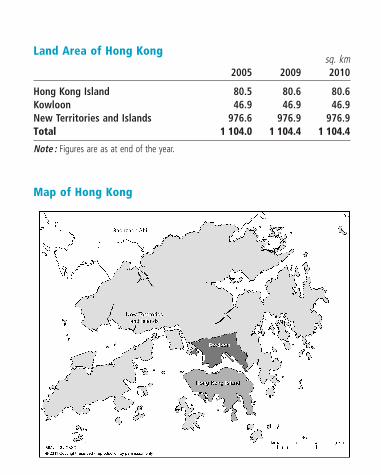
Land Area of Hong Kongsq. km
2005 2009 2010
Hong Kong Island 80.5 80.6 80.6Kowloon 46.9 46.9 46.9New Territories and Islands 976.6 976.9 976.9Total 1 104.0 1 104.4 1 104.4
Note : Figures are as at end of the year.
Map of Hong Kong
Contents (cont’d.) Page
Health 41Expectation of Life at Birth by Sex 41Registered Deaths and Death Rate by Leading Cause of Death 41Infant Mortality Rate 41Hospital Beds and Selected Types of Registered Healthcare Professionals 42
Social Welfare 43Social Security 43
Law and Order 43Reported Crimes by Type of Offence 43Persons Arrested for Crime by Type of Offence 43
General Notes1. Figures in brackets refer to percentage changes over the same period in
preceding year and are calculated based on unrounded figures.
2. There may be a slight discrepancy between the sum of individual itemsand the total as shown in the tables owing to rounding.
Special NotesΔ A revised version of Hong Kong Standard Industrial Classification (HSIC),
i.e. HSIC Version 2.0, was released in October 2008 to replace HSIC Version1.1. Statistics by economic activities are compiled based on HSIC Version 2.0starting from the reference period of 2009. Backcasted series of thosestatistics under HSIC Version 2.0 are also made available as appropriate.Figures compiled based on HSIC Version 2.0 are presented in this booklet.Please refer to the feature article entitled “Revision of Hong Kong StandardIndustrial Classification” published in the November 2008 issue of the HongKong Monthly Digest of Statistics for details on the revision of HSIC.
** The statistics are compiled based on data collected in the GeneralHousehold Survey from January to December of the year concerned as wellas the mid-year population estimates by District Council district compiledjointly by the Census and Statistics Department and an inter-departmentalWorking Group on Population Distribution Projections.
SymbolsThe following symbols are used throughout the booklet :# Provisional figures/estimates@ Figures are subject to revision later on* Revised figures— Not applicableN.A. Not yet available
7