Geochemistry Geophysics Geosystems -...
31
Interaction between small-scale mantle diapirs and a continental root P. van Thienen and A. P. van den Berg Department of Theoretical Geophysics, University of Utrecht, P. O. Box 80.021, 3508 TA Utrecht, Netherlands ([email protected]; [email protected]) J. H. de Smet Department of Theoretical Geophysics, University of Utrecht, P. O. Box 80.021, 3508 TA Utrecht, Netherlands Now at Portfolio Modelling, ING Credit Risk Management, P. O. Box 1800, 1000 BV Amsterdam, Netherlands. ( [email protected]) J. van Hunen Department of Theoretical Geophysics, University of Utrecht, P. O. Box 80.021, 3508 TA Utrecht, Netherlands Now at Department of Physics, University of Colorado, 390 UCB, Boulder, CO 80309-0390, USA. ( [email protected]) M. R. Drury Department of Structural Geology, University of Utrecht, P. O. Box 80.021, 3508 TA Utrecht, Netherlands ([email protected]) [1] A possible mechanism for adding material to a continental root is by means of upwellings from the convecting mantle subject to pressure release partial melting. We present results of numerical modeling of the interaction of melting diapirs with continental roots in an Archean setting characterized by a mantle potential temperature of 1750°C in a two-dimensional (2-D) Cartesian geometry. In an extension of earlier work [de Smet et al., 2000b] we have investigated the influence of mantle rheology on the behavior of diapirs. We have in particular looked at the difference in behavior of diapirs using a composite rheology combining both grain size sensitive diffusion creep and dislocation creep mechanisms. We have used the grain size, here taken to be uniform, as a control parameter to obtain model cases with varying contribution from the two creep mechanisms. The diapirs in the composite rheology model rise much faster than they do in a purely Newtonian model. Observed diapiric ascent times from 230 km depth to the top of the ascent path at about 80 km depth are approximately 1 Myr for a Newtonian model (averaged 14 cm/yr) compared to about 50 thousand years for a composite rheology model (averaged 3 m/yr) with the same parameters for the Newtonian component. This clearly indicates the large impact of the dislocation creep component of the viscous deformation process. We have also investigated the effect of an increase in the viscosity due to dehydration during partial melting. This increase has a strong influence on the development of rising diapirs. The ascent velocity and lateral spreading of the diapirs at the end of their ascent are effectively reduced when a viscosity increase by a factor of 10 is applied, and the effect becomes stronger for larger factors. Average vertical velocities range from 1.4 cm/yr for a factor 10 to 2 mm/yr for a factor 200. The most striking result of the viscosity increase due to dehydration is the reduction of the ascent velocity, thereby stretching the characteristic timescale of the diapiric intrusion process to a value between 5 and 50 Myr for dehydration viscosity prefactor values of 10 and 200, respectively. In contrast with the strong difference between the Newtonian and the composite rheology models, small differences are found in the G 3 G 3 Geochemistry Geophysics Geosystems Published by AGU and the Geochemical Society AN ELECTRONIC JOURNAL OF THE EARTH SCIENCES Geochemistry Geophysics Geosystems Article Volume 4, Number 2 18 February 2003 8301, doi:10.1029/2002GC000338 ISSN: 1525-2027 Copyright 2003 by the American Geophysical Union 1 of 31
Transcript of Geochemistry Geophysics Geosystems -...

Interaction between small-scale mantle diapirsand a continental root
P. van Thienen and A. P. van den BergDepartment of Theoretical Geophysics, University of Utrecht, P. O. Box 80.021, 3508 TA Utrecht, Netherlands([email protected]; [email protected])
J. H. de SmetDepartment of Theoretical Geophysics, University of Utrecht, P. O. Box 80.021, 3508 TA Utrecht, Netherlands
Now at Portfolio Modelling, ING Credit Risk Management, P. O. Box 1800, 1000 BV Amsterdam, Netherlands.( [email protected])
J. van HunenDepartment of Theoretical Geophysics, University of Utrecht, P. O. Box 80.021, 3508 TA Utrecht, Netherlands
Now at Department of Physics, University of Colorado, 390 UCB, Boulder, CO 80309-0390, USA.( [email protected])
M. R. DruryDepartment of Structural Geology, University of Utrecht, P. O. Box 80.021, 3508 TA Utrecht, Netherlands([email protected])
[1] A possible mechanism for adding material to a continental root is by means of upwellings from the
convecting mantle subject to pressure release partial melting. We present results of numerical modeling of
the interaction of melting diapirs with continental roots in an Archean setting characterized by a mantle
potential temperature of 1750�C in a two-dimensional (2-D) Cartesian geometry. In an extension of earlier
work [de Smet et al., 2000b] we have investigated the influence of mantle rheology on the behavior of
diapirs. We have in particular looked at the difference in behavior of diapirs using a composite rheology
combining both grain size sensitive diffusion creep and dislocation creep mechanisms. We have used the
grain size, here taken to be uniform, as a control parameter to obtain model cases with varying contribution
from the two creep mechanisms. The diapirs in the composite rheology model rise much faster than they do
in a purely Newtonian model. Observed diapiric ascent times from 230 km depth to the top of the ascent
path at about 80 km depth are approximately 1 Myr for a Newtonian model (averaged 14 cm/yr) compared
to about 50 thousand years for a composite rheology model (averaged 3 m/yr) with the same parameters for
the Newtonian component. This clearly indicates the large impact of the dislocation creep component of
the viscous deformation process. We have also investigated the effect of an increase in the viscosity due to
dehydration during partial melting. This increase has a strong influence on the development of rising
diapirs. The ascent velocity and lateral spreading of the diapirs at the end of their ascent are effectively
reduced when a viscosity increase by a factor of 10 is applied, and the effect becomes stronger for larger
factors. Average vertical velocities range from 1.4 cm/yr for a factor 10 to 2 mm/yr for a factor 200. The
most striking result of the viscosity increase due to dehydration is the reduction of the ascent velocity,
thereby stretching the characteristic timescale of the diapiric intrusion process to a value between 5 and 50
Myr for dehydration viscosity prefactor values of 10 and 200, respectively. In contrast with the strong
difference between the Newtonian and the composite rheology models, small differences are found in the
G3G3GeochemistryGeophysics
Geosystems
Published by AGU and the Geochemical Society
AN ELECTRONIC JOURNAL OF THE EARTH SCIENCES
GeochemistryGeophysics
Geosystems
Article
Volume 4, Number 2
18 February 2003
8301, doi:10.1029/2002GC000338
ISSN: 1525-2027
Copyright 2003 by the American Geophysical Union 1 of 31

overall dynamics between the composite rheological models, characterized by different values of the
uniform grain size. The composite rheological models exhibit self-regulating behavior where substantial
differences between the relative contributions of the two creep components result in very similar effective
viscosities, due to a local dominance of dislocation creep at high stresses and corresponding similar flow
dynamics. Stress levels and P,T paths in the modeling results are consistent with estimates obtained from
Precambrian peridotite bodies which are interpreted to have originated from asthenospheric diapirism.
Components: 13,000 words, 17 figures, 5 tables, 2 videos.
Keywords: continental roots; numerical modeling; mantle diapirs; Archean; creep mechanisms; water.
Index Terms: 3210 Mathematical Geophysics: Modeling; 3902 Mineral Physics: Creep and deformation; 8120
Tectonophysics: Dynamics of lithosphere and mantle—general; 8121 Tectonophysics: Dynamics, convection currents and
mantle plumes; 8160 Tectonophysics: Evolution of the Earth: Rheology—general.
Received 4 March 2002; Revised 26 July 2002; Accepted 5 December 2002; Published 18 February 2003.
van Thienen, P., A. P. van den Berg, J. H. de Smet, J. van Hunen, and M. R. Drury, Interaction between small-scale mantle
diapirs and a continental root, Geochem. Geophys. Geosyst. 4(2), 8301, doi:10.1029/2002GC000338, 2003.
————————————
Theme: Thermochemical Convection in the Earth’s InteriorGuest Editor: Peter van Keken, Louis Moresi, and Adrian Lenardic
1. Introduction
[2] Numerical modeling experiments have shown
that mantle diapirs could be important agents in the
growth of continental roots during the Archean and
Proterozoic [de Smet et al., 1998]. These mantle
diapirs are generally on a scale of 50 to 100 km and
penetrate an existing root while producing melt,
and a complementary depleted low density residue,
thus adding depleted material to the continental
root. Plumes rising through the mantle are strongly
influenced by the type of rheology.
[3] The two important deformation mechanisms in
the upper mantle are diffusion creep and dislocation
creep [Karato and Wu, 1993]. Diffusion creep takes
place through diffusion of mass between grain
boundaries. The strain rate increases linearly with
applied stress, and decreases in a power law fashion
with the grain size. Dislocation creep, on the other
hand, takes place through the transport of disloca-
tions in the crystal structure. It has a power law
relation between applied stress and resulting strain
rate (nonlinear), and it is insensitive to grain size
[Karato and Wu, 1993]. The viscosity correspond-
ing to dislocation creep flow decreases with
increasing stress, a phenomenon known as shear-
thinning. For the present mantle, dislocation creep
is generally the dominant mechanism in the asthe-
nosphere, whereas diffusion creep dominates in the
lithospheric mantle and in the deeper upper mantle
and lower mantle [Karato et al., 1995; van den Berg
and Yuen, 1996]. Since olivine is the weakest major
phase in mantle peridotite, the rheology of the
upper mantle is probably dominated by olivine
[Karato and Wu, 1993]. Next to the microphysical
approach to mantle rheology, the inversion of
glacial rebound data also gives information on the
viscosity of the mantle. Using this approach, Lam-
beck et al. [1998] have found the upper mantle
viscosity to be about 3–4 � 1020 Pas. The hotter
Archean upper mantle, however, may have had a
viscosity several orders of magnitude lower than
this figure due to the strong temperature depend-
ence of both diffusion creep and dislocation creep.
Furthermore, the temperature dependence of the
dislocation creep mechanism as expressed in the
activation energy parameter of the rheological flow
is higher than for the diffusion creep component.
From this one can predict a greater predominance of
the dislocation creep component under higher tem-
perature conditions, representative for the early
GeochemistryGeophysicsGeosystems G3G3
van thienen et al.: small-scale mantle diapirs 10.1029/2002GC000338
2 of 31

Earth. This has motivated us to extend our previous
work on growth mechanisms of continental roots,
based on purely diffusion creep models [de Smet et
al., 1998, 1999, 2000a, 2000b; de Smet, 1999], with
a detailed investigation of more complete viscous
rheology including also the rheological effect of
dislocation creep flow and sensitivity for the degree
of dehydration induced by partial melting.
[4] Nonlinear rheology can greatly enhance the
velocity of plumes [Weinberg and Podladchikov,
1994; Larsen et al., 1997; Larsen and Yuen, 1997;
van Keken, 1997] relative to a Newtonian rheology
case, and can therefore more effectively transport
heat up to shallow lithospheric levels. Another
important effect of nonlinear rheology is the gen-
eration of localized high strain rates, which may
result in viscous heating, with a lubricating effect
through the temperature dependence of the rheol-
ogy [van den Berg and Yuen, 1997; Larsen et al.,
1999]. Combined, these two effects can cause
regions of high temperature at shallow depths,
which may induce secondary melting and crustal
diapirism [Campbell and Hill, 1988]. On the other
hand, melting lowers the temperature by means of
latent heat consumption, and may also increase the
viscosity of the residue directly. This is due to the
fact that at low degrees of partial melting, water
tends to concentrate in the melt phase, effectively
drying the residue. Experiments have shown that
water has a weakening effect [e.g., Chopra and
Paterson, 1981], and from these observations,
Karato [1986] concluded that at low degrees of
partial melting, the strength of the residual matrix
is increased by melting. This increase of viscosity
of the residual depleted peridotite could be as high
as a factor of 100 to 180 [Hirth and Kohlstedt,
1996]. The importance of this effect for plumes has
been ascertained by Ito et al. [1999] and Ito [2001].
Karato and Jung [1998] find that this dehydration
effect does not only influence the viscosity, but is
also connected to the low seismic velocity and high
attenuation in the asthenosphere.
[5] Samples of cratonic lithosphere are found as
xenoliths in kimberlite intrusions [Nixon and Boyd,
1973] and as larger bodies in some orogenic belts
[Brueckner and Medaris, 1998; van Roermund and
Drury, 1998]. It is proposed that many of these
mantle rocks are emplaced into the lithosphere by
diapirs from the convecting sublithospheric mantle
[Nicolas, 1986] in a variety of geodynamic envi-
ronments [Green and Gueguen, 1983; Nicolas et
al., 1987; Fabries et al., 1991]. The PT paths
derived from some cratonic peridotites from the
Norwegian Western Gneiss Region [van Roermund
and Drury, 1998; Drury et al., 2001] imply that
these rocks were part of diapirs that intruded
cratonic lithosphere of Archean to early Protero-
zoic age (the cooling age of these rocks is 1.7–1.8
Ga, but the Sm-Nd model age indicates a depletion
age of 2.5–3.0 Ga). Drury et al. [2001] have
shown that the PT path of these peridotites is
consistent with PT paths of diapiric upwellings
calculated from the thermochemical convection
models of de Smet [1999] and de Smet et al.
[1999].
[6] In this paper, we present results of numerical
modeling experiments which were devised to
model the interaction of diapirs with the continental
root, and we investigate in particular the sensitivity
of the model for the rheological parameterization.
We place the models in an Archean setting by
prescribing a potential mantle temperature of
1750�C. We determine the effect of varying the
rheological flow law from Newtonian diffusion
creep only, into a composite law combining both
grain size sensitive Newtonian diffusion creep and
power law (grain size independent) dislocation
creep. Different grain sizes are used to test for
varying strengths of the diffusion creep component
(dislocation creep is grain size independent). Fur-
thermore, we investigated the effect of dehydration
during partial melting. This extends earlier work by
de Smet et al. [1998, 1999, 2000a, 2000b] and de
Smet [1999] based on purely Newtonian rheology.
[7] The potential temperature of 1750�C which we
use is relatively high and may be representative of
the earlier half of the Archean. Parametric cooling
models for the Earth of Richter [1985] show
mantle potential temperatures for the Archean of
about 1450 to 1700 centigrade. However, the high
MgO contents of Archean komatiites point to
higher potential temperatures, up to 1800�C for
2.7 Ga old Belingwe komatiites and even 1900�Cfor 3.45 Ga old Barberton komatiites [Nisbet et al.,
GeochemistryGeophysicsGeosystems G3G3
van thienen et al.: small-scale mantle diapirs 10.1029/2002GC000338van thienen et al.: small-scale mantle diapirs 10.1029/2002GC000338
3 of 31

1993]. Melting experiments of Walter [1998] show
that Archean komatiites can be formed by dry
batch melting of pyrolite at pressures of 7 to 10
GPa. Extrapolation along an adiabat of the solidus
temperature (using the solidus of Herzberg and
Zhang [1996]) at these pressures shows that this
corresponds to potential temperatures in the range
of 1700 to 1800 centigrade. These temperatures
probably represent plume temperatures in a cooler
mantle. For the current mantle, estimates for the
excess temperature of plumes are up to 200 to 250
centigrade [Herzberg and O’Hara, 1998]. In a
hotter Earth, the temperature controlled viscosity
would be lower and therefore also the maximum
horizontal temperature variations would be reduced
[McKenzie and Bickle, 1988; Nisbet et al., 1993] to
about 50–150�C [Nisbet et al., 1993], which puts
our potential temperature of 1750�C within the
range indicated by the komatiites of Nisbet et al.
[1993]. Some authors have suggested that komati-
ites may be formed by hydrous melting [Stone et
al., 1997] at temperatures only about 100�C higher
than present mantle temperatures [Parman et al.,
1997]. Arndt et al. [1998] however conclude that
most komatiites were the product of dry melting.
The potential temperature of 1750�C of our models
is also consistent with the results of the numerical
models of de Smet et al. [2000b] which form the
starting point of our investigations.
[8] The analysis of structures and microstructures
in mantle rocks may provide estimates of the
differential stresses and strain rates during high
temperature deformation associated with diapir
upwelling in a cratonic lithosphere. We use this
information to compare our model results to the
peridotites from western Norway mentioned above,
which are interpreted as a natural example of a
Precambrian asthenosphere diapir [Drury et al.,
2001].
[9] In the work of de Smet et al. [2000b], small-
scale diapirs are generated in a self-consistent way
in hot upwelling limbs of large-scale (�1000 km)
mantle convection cells. Here we take a different
approach and zoom in on a smaller region sur-
rounding a single uprising diapir and follow the
detailed evolution during its ascent into and within
the chemically distinct mantle root.
2. Numerical Model Setup
2.1. Description of the Numerical Model
[10] We have used a 2-D Cartesian thermochemical
convection code including partial melting. An
extended Boussinesq approach was used assuming
infinite Prandtl number, including viscous dissipa-
tion, adiabatic compression and latent heat of
melting. Partial melting is modeled as an (irrever-
sible) increase in the degree of depletion F, which
is defined here as the mass fraction of melt which
is extracted from an initially unmelted material
control volume of mantle material. Since no mate-
rial is actually removed in our model, volumes of
depleted residual material are somewhat overesti-
mated [de Smet, 1999]. Because of the relatively
short timescale of the models (<50 Myr), internal
heating by the decay of radioactive elements was
not included. This model is described by the
following nondimensional equations [de Smet et
al., 1998]. The energy equation (see Table 1 for
explanation of the symbols used):
dT
dt�Di TþT0ð Þw¼r2TþDi
Ra�� DS
cp
dF
dtTþT0ð Þ ð1Þ
The incompressibility condition and the nondimen-
sional momentum equation:
r ~u ¼ 0 ð2Þ
r h r~uþr~uT� �� �
�rDp ¼ RaT þ RbFð Þz ð3Þ
Evolution of the degree of depletion is described
by the following equation:
dF
dt¼ S P; T ;Fð Þ ð4Þ
The source function S in equation (4) is used to
describe the rate of partial melting, applying a
simple parameterization of the melting phase
diagram of mantle peridotite in terms of a solidus
and liquidus. S is defined by means of expressing
the differential dF in terms of pressure and
temperature differentials as described in more detail
in Appendix A of de Smet et al. [1998]. We use two
different parameterizations of the solidus and the
liquidus. The first one has a linear and parallel
liquidus and solidus, based on data presented by
Takahashi and Kushiro [1983] (up to 3.5 GPa, so
GeochemistryGeophysicsGeosystems G3G3
van thienen et al.: small-scale mantle diapirs 10.1029/2002GC000338
4 of 31

we are extrapolating at higher pressures). The
second uses a third-order polynomial parameteriza-
tion, based on data by Herzberg and Zhang [1996].
Our isobaric melting curve, which is based on data
presented by Jaques and Green [1980], is linear in
both cases [Vlaar and van den Berg, 1991; de Smet
et al., 1998].
[11] Two deformation mechanisms are included in
the models: diffusion creep (linear) and dislocation
creep (nonlinear). We test models which use the
diffusion creep component exclusively (models
N1–N3), as well as models with a composite
rheology (models C1–C5), combining the diffu-
sion creep and dislocation creep mechanisms (see
Tables 2–4 for details). An extra effect also
included in some models (models D1–D3) is the
effect of dehydration by partial melting. The mod-
els will be described in more detail below.
[12] Our composite rheology models combine both
the diffusion creep and the dislocation creep mech-
anisms [see also van den Berg et al., 1993]. Their
combined effect is defined through a superposition
of the corresponding strain rates:
eij ¼ eij1 þ eij2 ¼1
h1þ 1
h2
� �tij ð5Þ
Table 1. Symbols of the Energy and Momentum Equations (Equations (1)–(3)), the Transport Equation (4), and theStrain Equation (5)
Symbol Property Definition Value/Unit
cp heat capacity at constant pressure 1000/1250 Jkg�1 K�1
Di dissipation number (agh)/cp 0.09408eij strain rate tensor @jui + @iuj s�1
e second invariant of the strain rate tensor [(1/2)eijeij]1/2 s�1
F degree of depletiong acceleration due to gravity 9.8 ms�2
h length scale 400 � 103 mRa thermal Rayleigh number (r0aDTgh
3)/(kh0) 1.24 � 106
Rb compositional Rayleigh number (drgh3)/(kh0) 1.42 � 106
S melt productivity function s�1
DS entropy change upon full differentiation 300 Jkg�1 K�1
t time sT temperature �CT0 nondimensional surface temperature 273/DTDT temperature scale 1923�Cw vertical velocity ms�1
z unit vector in vertical (downward) directiona thermal expansion coefficient 3 � 10�5 K�1
�T relative amplitude of thermal perturbation dT/T(z)h viscosity Pash0 reference viscosity 1020 Pask thermal diffusivity 10�6 m2 s�1
r0 reference density 3416 kgm�3
dr density difference upon full depletion @r/@F 226 kgm�3
tij deviatoric stress tensor heij Pat second invariant of the deviatoric stress tensor [(1/2)tijtij]
1/2 Pa� viscous dissipation he2 Jm�3 s�1
Table 2. Symbols of the Equations Describing theRheology (Equations (7) and (8))a
Symbol Property Value/Unit
A strain rate prefactor s�1
B effective viscosity prefactor Pas or Pa3.25sb length of Burgers vector 5 � 10�10 md grain size mE activation energy Jmol�1
m grain size exponent 2.5, 0n stress exponent 1.0, 3.25P pressure PaR gas constant 8.3144 Jmol�1 K�1
T temperature KV activation volume m3 mol�1
m shear modulus 80 � 109 Pat second invariant of deviatoric
stress tensorPa
aValues of the viscosity prefactors A and B and grain size and stress
exponents m and n are specified in Table 3. Two units are specified forthe viscosity prefactor, the first being applicable to diffusion creep, andthe second to nonlinear dislocation creep.
GeochemistryGeophysicsGeosystems G3G3
van thienen et al.: small-scale mantle diapirs 10.1029/2002GC000338
5 of 31
with the subscript 1 indicating diffusion creep and
2 indicating dislocation creep, and the effective
viscosity given by
h ¼ 1
h1þ 1
h2
� ��1
ð6Þ
The corresponding viscosity components hk are
defined by the dimensional Dorn equation:
ek ¼ Ak
tm
� �nk b
d
� �mk
exp �Ek þ PVk
RT
� �; k ¼ 1; 2 ð7Þ
We assume a constant grain size d in equation (7)
in the diffusion creep component. This is used as a
control parameter to distinguish between model
cases with different partitioning between the two
creep mechanisms.
[13] Equation (7) can be transformed into a vis-
cosity expression [see van den Berg and Yuen,
1998]:
hk ¼ Bk expEk þ PVk
RT
� �t1�nk ; k ¼ 1; 2 ð8Þ
For values of n unequal to unity, hk introduces a
nonlinearity through equation (6) in the momentum
equation (3) [van den Berg et al., 1993].
[14] Depending on local values of temperature,
pressure and shear stress, one of the two creep
mechanisms in equation (5) is dominant. We use
the grain size as a control parameter for the tran-
sition between these domains. The transition stress
tt at which both mechanisms are equally important
for a specific temperature and pressure can be
calculated by equating the viscosity components
in equation (5), using equation (8), resulting in:
tn�1t ¼ B2
B1
expðE2 � E1Þ þ PðV2 � V1Þ
RT
� �ð9Þ
As shown in Table 3, both DE = E2 � E1 and DV =
V2 � V1 are positive for the parameters we use.
Therefore, the temperature and pressure depen-
dence of the parameter ttn�1 is similar to the P,T
dependence of the viscosity components, with a
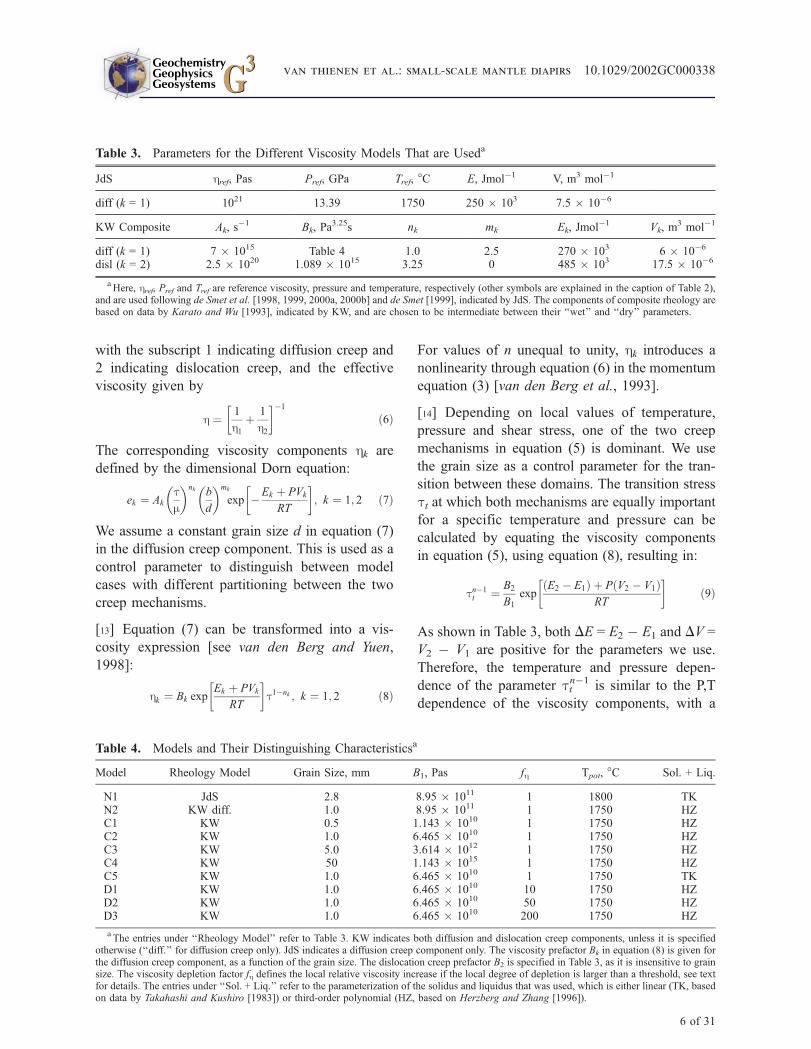
Table 3. Parameters for the Different Viscosity Models That are Useda
JdS href, Pas Pref, GPa Tref, �C E, Jmol�1 V, m3 mol�1
diff (k = 1) 1021 13.39 1750 250 � 103 7.5 � 10�6
KW Composite Ak, s�1 Bk, Pa
3.25s nk mk Ek, Jmol�1 Vk, m3 mol�1
diff (k = 1) 7 � 1015 Table 4 1.0 2.5 270 � 103 6 � 10�6
disl (k = 2) 2.5 � 1020 1.089 � 1015 3.25 0 485 � 103 17.5 � 10�6
aHere, href, Pref and Tref are reference viscosity, pressure and temperature, respectively (other symbols are explained in the caption of Table 2),
and are used following de Smet et al. [1998, 1999, 2000a, 2000b] and de Smet [1999], indicated by JdS. The components of composite rheology arebased on data by Karato and Wu [1993], indicated by KW, and are chosen to be intermediate between their ‘‘wet’’ and ‘‘dry’’ parameters.
Table 4. Models and Their Distinguishing Characteristicsa
Model Rheology Model Grain Size, mm B1, Pas fh Tpot, �C Sol. + Liq.
N1 JdS 2.8 8.95 � 1011 1 1800 TKN2 KW diff. 1.0 8.95 � 1011 1 1750 HZC1 KW 0.5 1.143 � 1010 1 1750 HZC2 KW 1.0 6.465 � 1010 1 1750 HZC3 KW 5.0 3.614 � 1012 1 1750 HZC4 KW 50 1.143 � 1015 1 1750 HZC5 KW 1.0 6.465 � 1010 1 1750 TKD1 KW 1.0 6.465 � 1010 10 1750 HZD2 KW 1.0 6.465 � 1010 50 1750 HZD3 KW 1.0 6.465 � 1010 200 1750 HZ
aThe entries under ‘‘Rheology Model’’ refer to Table 3. KW indicates both diffusion and dislocation creep components, unless it is specified
otherwise (‘‘diff.’’ for diffusion creep only). JdS indicates a diffusion creep component only. The viscosity prefactor Bk in equation (8) is given forthe diffusion creep component, as a function of the grain size. The dislocation creep prefactor B2 is specified in Table 3, as it is insensitive to grainsize. The viscosity depletion factor fh defines the local relative viscosity increase if the local degree of depletion is larger than a threshold, see textfor details. The entries under ‘‘Sol. + Liq.’’ refer to the parameterization of the solidus and liquidus that was used, which is either linear (TK, basedon data by Takahashi and Kushiro [1983]) or third-order polynomial (HZ, based on Herzberg and Zhang [1996]).
GeochemistryGeophysicsGeosystems G3G3
van thienen et al.: small-scale mantle diapirs 10.1029/2002GC000338
6 of 31
minimum in the asthenosphere [Karato and Wu,
1993]. The expression (9) indicates that the
transition stress decreases for increasing tempera-
ture, which implies that for constant pressure non-
Newtonian creep becomes more important with
increasing temperature. As a consequence of this,
the role of dislocation creep in the hotter early
Earth must have been greater than today.
[15] The set of equations (2), (3), and (4) was
solved using finite element methods and a Predic-
tor-Corrector time integration scheme, described
by van den Berg et al. [1993]. Picard iteration for
the Stokes equation (3) was used to deal with the
nonlinearity arising from the nonlinear rheology.
The finite element meshes used contain approxi-
mately 104 triangular (6 point) elements, with
element sizes ranging from about 24 km in areas
of low flow velocity to approximately 3 km in high
flow velocity areas. The degree of depletion F was
modeled (equation (4)) using a Lagrangian particle
tracer method, using 4 � 105 tracers in a random
(uniform) distribution. Fourth-order Runge-Kutta
time integration is used to advect the particle
tracers with the mantle flow velocity. The trans-
formation of particle tracer field values (the degree
of depletion) to finite element Gauss points uses a
Particle in Cell algorithm [Hockney and Eastwood,
1988]. We tested two models with the tracer
density multiplied by a factor 1.5, which gave no
significantly different results, so we are confident
that the tracer resolution used (4 � 105) is suffi-
cient. We also tested our thermochemical code
using the widely used benchmark given by van
Keken et al. [1997, case 1a].
[16] The depletion-dependence of the viscosity
(dehydration effect) is modeled as a composition
dependent viscosity prefactor fh(F ). This uses a
piecewise linear continuous parameterization: fh =
1 for F < 0.005. For F > 0.05 fh = 10 (model D1 in
Table 3), 50 (model D2), or 200 (model D3). In the
intermediate interval 0.005 < F < 0.05 fh is a linear
function of F, continuous at the interval bounda-
ries. The small width of the transition interval from
fh = 1 to fh = 10, 50 or 200 corresponds to the fact
that most water is expelled already at low degrees
of melting [Karato and Jung, 1998, Figure 3]. The
choice of the magnitude of this prefactor is based
on two observations. The first is experimental
results by Hirth and Kohlstedt [1996], indicating
a viscosity increase by a factor of 100 to 180 upon
dehydration. This gives an upper bound factor of
200. The second observation is evidence for rehy-
dration found in studies of craton xenoliths [Harte,
1983]. Since rehydration would lower the viscosity
again, we have used two, admittedly arbitrary,
lower bound values of 10 and 50. The rheological
parameters which are used are presented in Tables
3 and 4, and the labeling of the different model
cases is defined in Table 4.
[17] For models C1–C5 and D1–D3 (composite
rheology cases), we specified the parameters in
equation (7). We used intermediate values between
the wet and dry parameters of Karato and Wu
[1993, p. 773], since they conclude that ‘‘the
rheology of the. . . subcontinental upper mantle is
between that of dry (water-free) and wet (water-
saturated) olivine,’’ based on the water content of
basalts, infrared spectroscopy of mantle minerals,
laboratory studies of water solubility in olivine and
observations of the electrical conductivity of the
suboceanic upper mantle. Each model run has a
constant grain size, which is varied between the
models from 0.5 to 5 mm. This results in the
effective prefactors Bk of equation (8), the values
of which are specified in Tables 3 and 4. For
models N1–N2 (Newtonian rheology), we speci-
fied a reference viscosity href at a reference pres-
sure Pref and temperature Tref, and activation
energy and volume, following de Smet et al.
[2000a], to allow direct comparison of the results.
[18] The density of mantle material is related to the
degree of depletion F [Jordan, 1979]. In the buoy-
ancy term of the Stokes equation (3), we use a
linearized parameterization of the composition
dependent density [Vlaar and van den Berg,
1991], and the coefficient @r/@F enters the compo-
sitional Rayleigh number Rb, in the momentum
equation (3) [see also de Smet et al., 1998, 2000b].
We assume all melt to be removed instantaneously
to shallower or surface levels, where it can no
longer play a role in the development of the
diapirs. Because of this assumption, we neglect
the buoyancy effect of melt retention, which leads
to an underestimate of the buoyancy term [e.g.,
GeochemistryGeophysicsGeosystems G3G3
van thienen et al.: small-scale mantle diapirs 10.1029/2002GC000338
7 of 31

Scott and Stevenson, 1989; Buck and Su, 1989; Jha
et al., 1994]. This partly cancels the overestimation
of the volume of depleted residue mentioned
above.
[19] For most of the models, we use a third-order
parameterization of the solidus and liquidus in the
melting phase diagram of mantle peridotite [Herz-
berg and Zhang, 1996], which is an improved
version of the first-order approximation (based on
Takahashi and Kushiro [1983]), that is used in
models N1 and C5 only. The former is a more
accurate description of the solidus and liquidus,
especially for melting at depths greater than 100 km.
[20] Since we are working in a 2-D Cartesian
geometry, the structures we are modeling can be
extended in the third dimension, and we are in fact
dealing with a horizontal cylinder rather than a
more or less spherical diapir. In an axisymmetric
geometry, diapir penetration along the axis of
symmetry is easier than in 2-D Cartesian geometry,
and subsequent spreading of the diapir head will be
more pronounced in 2-D Cartesian geometry than
in an axisymmetric geometry. However, we do not
expect these differences to dominate the results of
our model experiments.
2.2. Model Geometry and Initial andBoundary Conditions
[21] We have adopted a 200 � 400 km spatial
domain with a symmetry condition on the vertical
boundaries shown in Figure 1. Because of the
limited aspect ratio of the domain, we have ensured
by running tests with aspect ratios up to 6 times
higher that possible effects of the right hand side
vertical boundary play no significant role in the
results of the modeling experiments. We define an
initial degree of depletion profile starting with F =
0 from 400 to 200 km depth and increasing linearly
to F = 0.35 from 200 to 80 km depth, keeping this
value up to the surface (see Figure 1). This is a
reasonable approximation of the continental roots
as formed by the long term evolution models of de
Smet et al. [1999, 2000b].
[22] As an initial geotherm, we use the minimum
value of the following three functions; (1) an
adiabat ( potential temperature 1750�C), (2) a linear
Figure 1. Model setup is shown in Figure 1a. The rectangular domain is 200 � 400 km and has free slip boundaryconditions except for a no slip to boundary. A symmetry plane is present at x = 0. Next to the representation of thecomputational domain, the initial degree of depletion profile is plotted in Figure 1b. The solidus and liquidusparameterizations used are shown in Figure 1c (TK: linear, based on Takahashi and Kushiro [1983]; HZ: third-orderpolynomial, based on Herzberg and Zhang [1996]) with the most commonly used perturbed (geotherm 1) andbackground (geotherm 2) initial geotherms, see text for details.
GeochemistryGeophysicsGeosystems G3G3
van thienen et al.: small-scale mantle diapirs 10.1029/2002GC000338
8 of 31

profile from 0�C at the surface to the adiabat at 100
km depth, with a gradient @T/@z = 17.9 K/km, and
(3) the solidus of mantle peridotite (see Figure 1).
[23] The mantle diapir which is the subject of
investigation is initiated here by adding a Gaussian
circular shaped thermal perturbation to the local
background temperature. We use a perturbation
with a radius (defined as the 2s (2 standard
deviations) distance from the maximum) of 48
km at 230 km depth and x = 0 with an amplitude
�T of 5% of the local background temperature
(approximately 95�C), see also Figure 1. This is
in accordance with thermal anomalies found by de
Smet et al. [2000b] in mantle convection models of
continental root growth. In their model, a thermal
perturbation originating from deeper levels of the
mantle crosses the solidus, starts melting and
accelerates due to increasing depletion related
buoyancy. Since these original models by de Smet
et al. [2000b] employ a purely Newtonian rheol-
ogy, the self-consistent generation of these plumes
in a composite rheology and thus the choice of our
initial condition is an extrapolation. The results are
sensitive to the amplitude and radius of the initial
temperature perturbation (as will be illustrated in
Figures 14 and 15 below). In case the upper part of
the initial perturbation is above the solidus temper-
ature, the local degree of depletion is adjusted
accordingly, creating an initial depletion.
[24] All boundaries of the model are impermeable.
The top boundary has a no slip condition, the
others are free slip. Thermal boundary conditions
are zero centigrade temperature at the top boun-
dary, 1923�C at the bottom (consistent with the
potential temperature of 1750�C), and insulating
vertical boundaries.
[25] In comparing the different results, it should be
kept in mind that in all cases the same initial
condition for the starting diapir is used (apart from
model N1, which has the same relative perturbation
of the temperature field but a higher potential
temperature).
2.3. Model Parameters
[26] Detailed parameters of the different models are
specified in Tables 3 and 4. Further physical
parameters are given in Tables 1 and 2. We note
that two different values of the specific heat cphave been used. The lower value of 1000 J kg�1
K�1 is used to compare our results directly to
previous results from de Smet et al. [1998], model
N1 in section 3.2. In all other cases we use a
constant cp = 1250 J kg�1 K�1, based on data of
Fei et al. [1991], resulting in a slightly reduced
adiabatic gradient. We also consider two values of
the potential temperature characterizing the adia-
bats used in the initial background temperature in
our models. In the comparison case N1 we use a
higher value of 1800 centigrade representative for
the results of de Smet et al. [1998]. In all other
models a reduced potential temperature Tp = 1750
centigrade is used. This lower temperature would
cause a lower degree of melting. However, this is
countered by the use of the improved third order
parameterization of solidus and liquidus (see sec-
tion 2.1), which allows melting at depths greater
than 200 km at lower temperatures than the linear
parameterization.
3. Results of Numerical Modeling
[27] In this section we present the results of our
numerical models. First the results of linear rheol-
ogy models N1 and N2 will be presented, fol-
lowed by the composite rheology models C1–C5.
For each of these, snapshots of temperature, com-
position, and viscosity and profiles of the compo-
sition and the temperature are shown. The
transition between the two viscosity components
will be described, illustrated by viscosity ratio
plots and deformation maps. Subsequently, the
effect of dehydration will be shown in the results
of models D1–D3, again presenting snapshots and
profiles of temperature and compositions and
snapshots of viscosity. Finally, ascent velocities
for the diapirs and, in more detail, P,T paths and
stress and strain rate histories for individual tracers
will be presented.
3.1. General Characteristics
[28] In general terms (and ignoring timescales),
the development of all diapir models is compa-
GeochemistryGeophysicsGeosystems G3G3
van thienen et al.: small-scale mantle diapirs 10.1029/2002GC000338
9 of 31
rable. (This is illustrated in Figures 2–7 and 10–
12, which show a zoom-in window of part of the
computational domain around the rising diapir.
Note that the computational domain has been
enlarged by adding the region x < 0 by symmet-
ric extension around x = 0. Snapshots are shown
of a rising diapir with time increasing upward
labeled in the left hand column. Snapshots of
degree of depletion, temperature and viscosity as
well as profiles of the degree of depletion and
temperature are shown in different columns a
through e.)
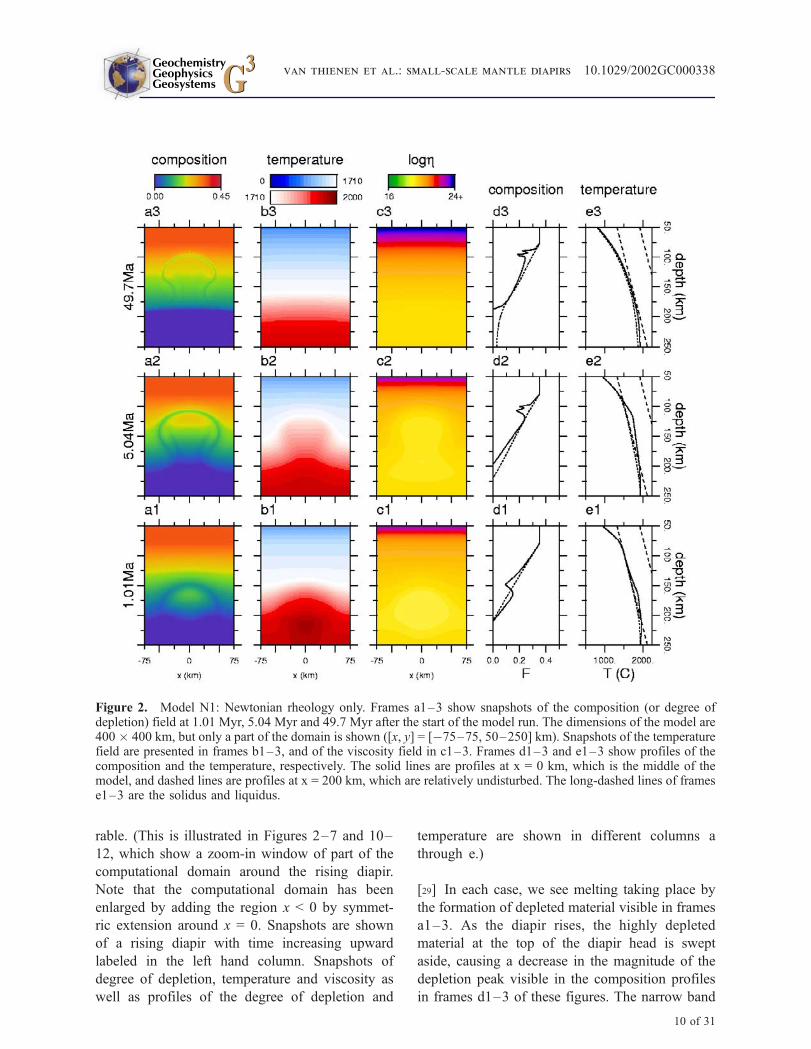
[29] In each case, we see melting taking place by
the formation of depleted material visible in frames
a1–3. As the diapir rises, the highly depleted
material at the top of the diapir head is swept
aside, causing a decrease in the magnitude of the
depletion peak visible in the composition profiles
in frames d1–3 of these figures. The narrow band
Figure 2. Model N1: Newtonian rheology only. Frames a1–3 show snapshots of the composition (or degree ofdepletion) field at 1.01 Myr, 5.04 Myr and 49.7 Myr after the start of the model run. The dimensions of the model are400 � 400 km, but only a part of the domain is shown ([x, y] = [�75–75, 50–250] km). Snapshots of the temperaturefield are presented in frames b1–3, and of the viscosity field in c1–3. Frames d1–3 and e1–3 show profiles of thecomposition and the temperature, respectively. The solid lines are profiles at x = 0 km, which is the middle of themodel, and dashed lines are profiles at x = 200 km, which are relatively undisturbed. The long-dashed lines of framese1–3 are the solidus and liquidus.
GeochemistryGeophysicsGeosystems G3G3
van thienen et al.: small-scale mantle diapirs 10.1029/2002GC000338
10 of 31

of low depletion initially surrounding the diapir
head is stretched and thinned, reducing its visibil-
ity. The temperature snapshots show a decline of
the thermal perturbation back to the background
temperature field.
3.2. Linear Rheology Results
[30] Results of a case with linear rheology model
N1 are presented in Figure 2. The degree of deple-
tion snapshots (frames a1–3) show the diapir devel-
oping a clear mushroom shape of some 100 km in
diameter, quite similar to the diapir examined by de
Smet et al. [1998], which developed self-consis-
tently in a convecting upper mantle model. Corre-
sponding temperature snapshots are shown in
Figure 2b1–3. The figures illustrate the develop-
ment of the decaying temperature anomaly of the
hot diapir. The final snapshot at approximately 50
Myr shows the thermal anomaly has disappeared.
The viscosity snapshots (c1–3) show a relatively
uniform field in a large part of the domain, with a
somewhat lower viscosity down to about 1019 Pas
inside the diapir resulting from the thermal pertur-
Figure 3. Model N2: Newtonian rheology. Only a part of the domain is shown ([x, y] = [�75–75, 50–50] km).Frames a1–4 show the composition field and frames b1–3 show the temperature field at 1.01 Myr, 5.04 Myr and49.7 Myr after the start of the model run. Snapshots of the viscosity field are presented in frames c1–3. Profiles ofcomposition and temperature are presented in frames d1–3 and e1–3, respectively. For an explanation of line types,see caption of Figure 2.
GeochemistryGeophysicsGeosystems G3G3
van thienen et al.: small-scale mantle diapirs 10.1029/2002GC000338
11 of 31

bation. The degree of depletion in the melting diapir
reaches a value of about 0.25.
[31] Vertical profiles of the composition (degree of
depletion F) and temperature are shown in frames
d1–3 and e1–3, respectively. The solid lines corre-
sponding to centerline profiles at x = 0 reveal the
magnitude of the rising perturbation of the compo-
sition and temperature constituting the diapir, with
respect to the background model which is repre-
sented by the dotted curves, corresponding to verti-
cal profiles at x = 200 km, which is a relatively
undisturbed part of the model. The dashed curves in
Figure 2e1–3 showing the Takahashi and Kushiro
type solidus and liquidus used in the model illustrate
the changing meltings conditions as the diapir rises
through the mantle. The results reproduce closely
the previous results obtained by de Smet et al. [1998]
for a larger model where diapirs of a similar scale are
generated in a self-consistent way in upwelling lines
of large-scale mantle convection cells.
[32] Figure 3 shows the results of model N2 with
slightly different rheology parameters (following
Karato and Wu [1993], see Table 3, Newtonian
component only), and somewhat modified values
Figure 4. Model C1: Composite rheology. Only a part of the domain is shown ([x, y] = [�75–75, 50–250] km).Frames a1–3 show the composition field and frames b1–3 show the temperature field at 10.1 ka, 50.4 ka and 497 kaafter the start of the model run. Snapshots of the viscosity field are presented in frames c1–3. Profiles of compositionand temperature are presented in frames d1–3 and e1–3, respectively. For an explanation of line types, see caption ofFigure 2.
GeochemistryGeophysicsGeosystems G3G3
van thienen et al.: small-scale mantle diapirs 10.1029/2002GC000338
12 of 31
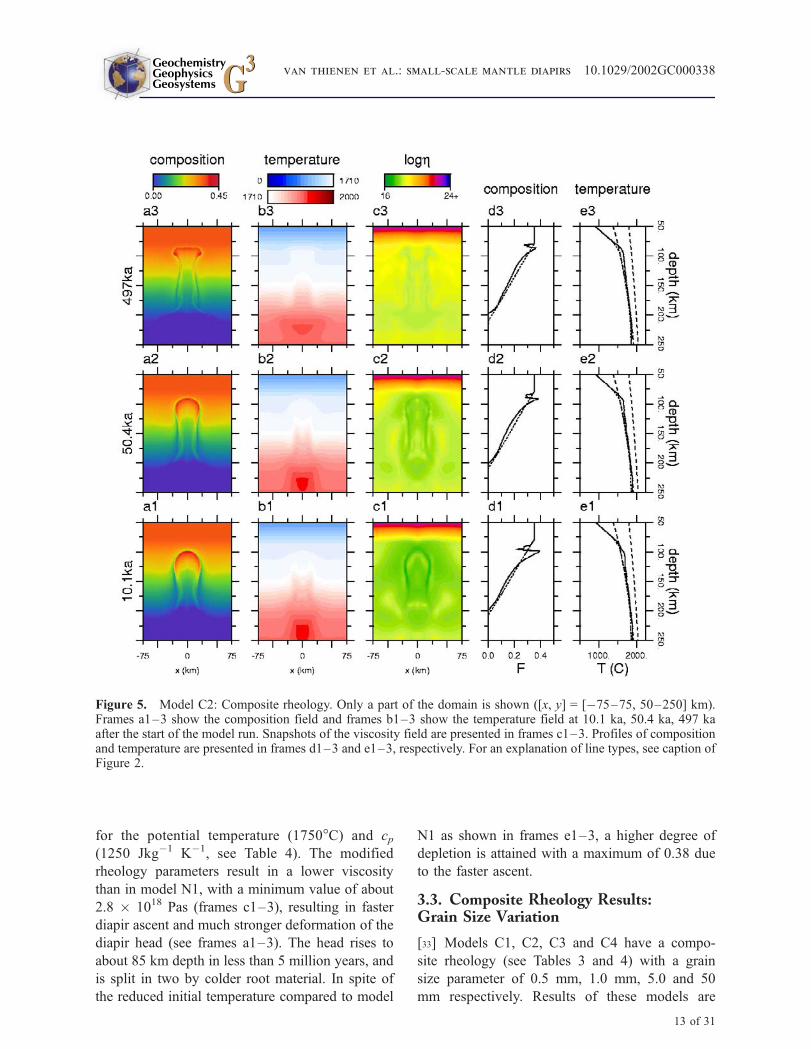
for the potential temperature (1750�C) and cp(1250 Jkg�1 K�1, see Table 4). The modified
rheology parameters result in a lower viscosity
than in model N1, with a minimum value of about
2.8 � 1018 Pas (frames c1–3), resulting in faster
diapir ascent and much stronger deformation of the
diapir head (see frames a1–3). The head rises to
about 85 km depth in less than 5 million years, and
is split in two by colder root material. In spite of
the reduced initial temperature compared to model
N1 as shown in frames e1–3, a higher degree of
depletion is attained with a maximum of 0.38 due
to the faster ascent.
3.3. Composite Rheology Results:Grain Size Variation
[33] Models C1, C2, C3 and C4 have a compo-
site rheology (see Tables 3 and 4) with a grain
size parameter of 0.5 mm, 1.0 mm, 5.0 and 50
mm respectively. Results of these models are
Figure 5. Model C2: Composite rheology. Only a part of the domain is shown ([x, y] = [�75–75, 50–250] km).Frames a1–3 show the composition field and frames b1–3 show the temperature field at 10.1 ka, 50.4 ka, 497 kaafter the start of the model run. Snapshots of the viscosity field are presented in frames c1–3. Profiles of compositionand temperature are presented in frames d1–3 and e1–3, respectively. For an explanation of line types, see caption ofFigure 2.
GeochemistryGeophysicsGeosystems G3G3
van thienen et al.: small-scale mantle diapirs 10.1029/2002GC000338
13 of 31

presented in Figures 4, 5, 6 and 7, respectively.
Note that snapshot times are different from those
in Figure 2. The development of the degree of
depletion field is also shown in Animation 1.
Frames a1–3 show the development of the
degree of depletion field, which reaches a value
of about 0.38 in the diapir head. Initially the
diapir shows very rapid ascent (1500 m/yr), but
strongly decelerates, dropping below 1 cm/yr
after 150 ka. These four models show only
slightly different ascent velocities (slower for
larger grain size), which will be discussed in
section 3.7. The viscosity field (frames c1–3)
shows large local variations because of the strain
rate dependence, showing a minimum of compa-
rable magnitude (6.7 � 1016 Pas to 8.5 � 1016
Pas for models C1 to C4) in each case. A
horseshoe shaped zone characterized by high
strain rate and (through the strain rate dependence
of dislocation creep) low viscosity forms around
the diapir facilitating the rise of the diapir with a
much higher velocity compared to the Newtonian
model. While minimum viscosities are quite sim-
ilar for the different cases C1 to C4, the mantle
Figure 6. Model C3: Composite rheology. Only a part of the domain is shown ([x, y] = [�75–75, 50–250] km).Frames a1–3 show the composition field and frames b1–3 show the temperature field at 10.1 ka, 50.4 ka and 497 kaafter the start of the model run. Snapshots of the viscosity field are presented in frames c1–3. Profiles of compositionand temperature are presented in frames d1–3 and e1–3, respectively. For an explanation of line types, see caption ofFigure 2.
GeochemistryGeophysicsGeosystems G3G3
van thienen et al.: small-scale mantle diapirs 10.1029/2002GC000338
14 of 31

and root material surrounding the diapir shows
much higher viscosities for larger grain sizes,
since the strain rate in these regions is much
smaller than in the narrow low viscosity region
directly bordering the diapiric head. The fact that
characteristic timescales in these four models are
quite similar despite the large variation in grain
size and consequently the relative importance of
the deformation mechanisms shows a self-regu-
lating mechanism to be operative, producing
similar viscosity minima and corresponding
velocities and ascent times. Even for the smallest
grain size, stresses locally become sufficiently
large to become greater than the transition stress
and the dislocation creep mechanism becomes
dominant. As stresses drop during the ascent,
they get close to the transition stress and the
diffusion creep mechanism starts to play a more
important role.
[34] Here we have to keep in mind that the
models are based on a constant grain size and
taking into account grain size variation may
change this conclusion [Kameyama et al.,
Figure 7. Model C4: Composite rheology. Only a part of the domain is shown ([x, y] = [�75–75, 50–250] km).Frames a1–3 show the composition field and frames b1–3 show the temperature field at 10.1 ka, 50.4 ka, 497 kaafter the start of the model run. Snapshots of the viscosity field are presented in frames c1–3. Profiles of compositionand temperature are presented in frames d1–3 and e1–3, respectively. For an explanation of line types, see caption ofFigure 2.
GeochemistryGeophysicsGeosystems G3G3
van thienen et al.: small-scale mantle diapirs 10.1029/2002GC000338
15 of 31

1997]. However, experimental results of de
Bresser et al. [1998, 2001] indicate that signifi-
cant weakening by grain size reduction can only
take place if the grain size reduction is [de
Bresser et al., 2001, p. 28] ‘‘caused by a process
other than dynamic recrystallization.’’ de Bresser
et al. [2001, p. 28] do find that the effect of
temperature on recrystallized grain size ‘‘cannot
be neglected a priori.’’ In the upper mantle the
grain size is expected to be controlled either by
dynamic recrystallization [Karato et al., 1980;
Karato and Wu, 1993] or by secondary phase
content [Drury and Fitz Gerald, 1998, Figure
11.7f]. For dynamic recrystallization the grain
size will depend strongly on the stress (smaller
grains at higher stress) with a weaker dependence
on temperature (smaller grains at higher temper-
ature) and water content (larger grains at higher
water content) [Karato et al., 1980; Ross et al.,
1980; van der Wal et al., 1993; de Bresser et al.,
1998, 2001; Jung and Karato, 2001]. At low
stress and high temperature the olivine grain size
will be controlled by secondary phase size and
content [Drury and Fitz Gerald, 1998]. In this
case the grain size will depend strongly on the
degree of depletion, which determines the second
phase content. This is a subject of continuing
research.
[35] Model C1 (composite rheology after Karato
and Wu [1993], see Tables 3 and 4) was calculated
also using the linear parameterization of solidus
and liquidus based on Takahashi and Kushiro
[1983] (which was also used in model N1) instead
of the third-order polynomial parameterization
based on Herzberg and Zhang [1996] (also used
in models N2 and C1-4, see also section 2.1 and
Figure 1), which gives us model C5. Because of
the linear parameterization, which has considerably
higher solidus and liquidus temperatures at greater
depths (>100 km), the thermal perturbation which
should have developed into a diapir does not
penetrate the root at all, and produces very little
melt. This result underlines the key role of compo-
sitional differentiation. The generation of depleted
peridotite causes compositional buoyancy which
further drives the upward movement of the diapir.
In this way it provides a self-accelerating mecha-
nism which allows mantle diapirs to penetrate an
existing continental root.
3.4. Viscosity Component Ratios
[36] The relative importance of the two deforma-
tion mechanisms which are included in the com-
posite rheology is illustrated by Figure 8,
showing the logarithmic ratio of dislocation creep
viscosity over diffusion creep viscosity (both
defined in equation (8)) for the entire domain
(dashed rectangle shows the zoom-in part shown
in Figures 4–7) for models C1, C2, C3 and C4,
respectively. Note that the mechanism which has
the lowest effective viscosity for the local con-
ditions dominates the local deformation. Minima
of the viscosity ratio h2/h1 are visible in the
diapir and its surroundings. These are produced
by the high stresses and strain rates at these
locations which cause a reduction of the non-
linear dislocation creep viscosity component,
resulting in a decrease of the effective viscosity
(equation (6)). The increase of this ratio with
time for each model illustrates the decrease of
strain rates during the diapir ascent, which causes
strain rate dependent dislocation creep viscosities
to increase. Another feature of this figure is the
greater dominance of dislocation creep for larger
grain sizes, which is the result of the grain size
dependence of the diffusion creep component
(higher viscosity for larger grains). We note here
that the grain size dependence of our rheological
models characterized by constant grain size rep-
resents a simplified version of the stress, temper-
ature, water content and secondary phase
dependent grain size in nature [Karato et al.,
1980; van der Wal et al., 1993; de Bresser et al.,
2001; Drury and Fitz Gerald, 1998; Jung and
Karato, 2001]. A constant grain size model may
indeed be a good approximation for the unde-
pleted sublithospheric mantle [Drury and Fitz
Gerald, 1998], although, in the lithopshere grain
size variation with depth would occur related to
variations in the degree of depletion. Kameyama
et al. [1997] and Braun et al. [1999] have
investigated 1-D models including dynamic grain
size evolution exhibiting strong localization.
However, the rheological effect of dynamic
GeochemistryGeophysicsGeosystems G3G3
van thienen et al.: small-scale mantle diapirs 10.1029/2002GC000338
16 of 31

recrystallization remains uncertain and controver-
sial [Rutter and Brodie, 1988; de Bresser et al.,
1998, 2001]. Including dynamic grain size evo-
lution in 2-D models is a subject for further
research both in terms of the modeling and the
microphysical aspects.
3.5. Deformation Maps
[37] In Figure 9, the logarithmic transition stress ttdefined in equation (9) is contoured as a function
of temperature and pressure (depth), for four differ-
ent values of the grain size corresponding to
models C1–4. Geotherms at x = 0 (through the
diapir) and x = 200 km (undisturbed) are included
as well. At stresses higher than tt, dislocation creepis dominant, at lower stress diffusion creep pre-
vails. The variation of the grain size directly
controls the diffusion component of the viscosity,
resulting in different magnitudes of the transition
stress for equal P,T-conditions. As the figure
clearly shows, a larger grain size decreases the
transition stress tt from about 1 MPa in the region
of the diapir, as illustrated by the geotherms
included in the figure, for a grain size of 0.5 mm
to less than 104 Pa for a grain size of 50 mm. These
features relate to the viscosity ratios which are
presented in Figure 8. For model C1 with a 0.5
Figure 8. Models C1, C2, C3, C4: Composite rheology. The dashed square indicates the region which is shown inFigures 4–6. The logarithmic ratio of non-Newtonian to Newtonian component viscosity of the composite rheologyat 10.1 ka, 50.4 ka and 497 ka is presented in frames a1–3 for model C1, frames b1–3 for model C2, frames c1–3 formodel C3 and frames d1–3 for model C4.
GeochemistryGeophysicsGeosystems G3G3
van thienen et al.: small-scale mantle diapirs 10.1029/2002GC000338
17 of 31

mm grain size, stresses in the diapiric region are
approximately of the same magnitude as the tran-
sition stress, causing the viscosity ratio of the two
creep components to be roughly 1. For increasingly
larger grain sizes in models C2–4, the transition
stress drops more and more below the actual stress
levels observed in the diapirs, and the viscosity
ratio becomes lower, down to about 10�6 for
model C4 with grain size of 50 mm.
3.6. Dehydration and Viscosity
[38] The effect of dehydration due to partial melting
on the rheology is investigated in models D1–3.
The dehydration prefactor in the viscosity applied
in these models is used irrespective of the dominant
creep mechanism. This is justified by experimental
results [Karato, 1986; Mei and Kohlstedt, 2000a,
2000b], indicating similar increases in creep veloc-
ity due to hydration for both diffusion creep and
dislocation creep.
[39] In model D1, the viscosity is multiplied by
a factor 10 when the degree of depletion
becomes higher than a threshold value, as
described in the model section (2.1). The results
of this viscosity prefactor are illustrated in
Figure 10. Frames c1–3 show the viscosity
500 1000 1500 2000 2500temperature (C)
12.0
9.0
6.0
3.0
0.0
pres
sure
(G
Pa)
0.5 mm
1918
1716
1514
1312
1110
9
8
7
6
5
500 1000 1500 2000 2500temperature (C)
12.0
9.0
6.0
3.0
0.01 mm
1918
1716
1514
1 312
1110
98
7
6
5
1918
1716
1514
1 312
1110
98
7
6
5
89.6 km
179 km
269 km
358 km
dep
th (km)
500 1000 1500 2000 2500
12.0
9.0
6.0
3.0
0.0
pres
sure
(G
Pa)
5 mm
1817
1615
1413
1 211
109
8
7
6
5
4
181 7
1615
1413
1 211
109
8
7
6
5
4
181 7
1615
1413
1 211
109
8
7
6
5
4
500 1000 1500 2000 2500
12.0
9.0
6.0
3.0
0.050 mm
1716
1514
1312
1110
98
7
6
5
4
3
171 6
1514
1312
1110
98
7
6
5
4
3
171 6
1514
1312
1110
98
7
6
5
4
3
171 6
1514
1312
1110
98
7
6
5
4
3
89.6 km
179 km
269 km
358 km
depth (km
)
Figure 9. Models C1, C2, C3, C4: Composite rheology. Deformation maps are shown for the composite rheologymodels used (0.5 mm, 1.0 mm, 5.0 mm and 50 mm grain size) and geotherms at x = 0 (diapir center, red lines) andx = 200 km (undisturbed background, black lines) at t = 10.1 ka. Contours show the (logarithmic) stress tt at whichdislocation creep viscosity is equal to diffusion creep viscosity. At a higher stress than tt, dislocation creep is thedominant deformation mechanism.
GeochemistryGeophysicsGeosystems G3G3
van thienen et al.: small-scale mantle diapirs 10.1029/2002GC000338
18 of 31

field, in which the effect is clearly recognizable
in the viscosity contrast around 200 km depth
which coincides with the bottom of the (chem-
ical) root. The development of the diapir is
illustrated in frames a1–3, which show the
degree of depletion. The diapir develops a mush-
room shape during its ascent to about 90 km
depth, where the head flattens. The diapir rea-
ches a minimum depth in about 10 Myr. The
maximum degree of depletion attained is 0.39,
as shown in frames d1–3.
[40] The dehydration prefactor in the viscosity
model is increased to 50 in model D2, of which
results are presented in Figure 11, and in Anima-
tion 2. Again the effect of the viscosity prefactor is
clearly visible in the viscosity snapshots (frames
c1–3). The diapir now rises more slowly (com-
pared to model D1). It develops a similar mush-
room shape, though it takes more time. The diapir
head rises to about 100 km depth, which is reached
in about 25 Myr. The maximum degree of deple-
tion Fmax = 0.39 is similar to that of model D1.
Figure 10. Model D1: Composite rheology, fh = 10. Only a part of the domain is shown ([x, y] = [�75–75, 50–250] km). Frames a1–3 show the composition field and frames b1–3 show the temperature field at 1.01 Myr, 5.04Myr and 49.7 Myr after the start of the model run. Snapshots of the viscosity field are presented in frames c1–3.Profiles of composition and temperature are presented in frames d1–3 and e1–3, respectively. For an explanation ofline types, see caption of Figure 2.
GeochemistryGeophysicsGeosystems G3G3
van thienen et al.: small-scale mantle diapirs 10.1029/2002GC000338
19 of 31

[41] Figure 12 shows results of model D3, which
has a dehydration prefactor of 200 in the viscosity
equation, slightly higher than the upper limit of
180 given by Hirth and Kohlstedt [1996]. This
results in a strong viscosity contrast at the base of
the lithospheric root at 200 km depth (see frames
c1–3), where now also the shape of the melting
diapir can be recognized in the viscosity fields, and
a very slow penetration of the diapir into the root.
The diapir head flattens during its ascent and has
reached a depth of about 125 km at 49.7 Myr
(frame a3), where the ascent velocity is less than
1 mm/yr and still dropping.
3.7. Ascent Velocities
[42] Time series of the vertical velocity were
calculated for a number of monitor tracer particles
to determine the ascent velocity of the diapiric
head. Representative results are presented in Fig-
ure 13. Two stages can be discerned for each
model. During the initial stage, the diapir rises at
Figure 11. Model D2: Composite rheology, fh = 50. Only a part of the domain is shown ([x, y] = [�75–75, 50–250] km). Frames a1–3 show the composition field and frames b1–3 show the temperature field at 1.01 Myr, 5.04Myr and 49.7 Myr after the start of the model run. Snapshots of the viscosity field are presented in frames c1–3.Profiles of composition and temperature are presented in frames d1–3 and e1–3, respectively. For an explanation ofline types, see caption of Figure 2.
GeochemistryGeophysicsGeosystems G3G3
van thienen et al.: small-scale mantle diapirs 10.1029/2002GC000338
20 of 31

a more or less constant velocity. At some point the
diapir starts to slow down as it encounters stiffer
resistance.
[43] Model N1 (frame a) shows an ascent velocity
which is several centimeters per year for about the
first 10 million years, with a maximum of just
over 10 cm/yr in the initial phase. Model N2,
which has a somewhat weaker rheology, shows
rapid ascent in the order of meters per year in the
initial phase, but the velocity drops below 1 m/yr
around 180 ka.
[44] The composite rheology models C1, C2 and
C3 show similar shapes of the velocity evolution
(Figure 13b), however with much higher velocities
compared to model cases N1 and N2, with a high
maximum value in the initial stage of nearly 1500
m/yr and values of several 100 m/yr during the first
500 years of the run. The velocity drops to about
100 m/yr at 1 ka and 1 cm/yr at 150 ka. Note that
three almost identical curves are shown in Figure
13b, illustrating the self-regulating effect of the
composite rheology, resulting in very similar ascent
velocities for very different overall viscosities.
Figure 12. Model D3: Composite rheology, fh = 200. Only a part of the domain is shown ([x, y] = [�75–75, 50–250] km). Frames a1–3 show the composition field and frames b1–3 show the temperature field at 1.01 Myr, 5.04Myr and 49.7 Myr after the start of the model run. Snapshots of the viscosity field are presented in frames c1–3.Profiles of composition and temperature are presented in frames d1–3 and e1–3, respectively. For an explanation ofline types, see caption of Figure 2.
GeochemistryGeophysicsGeosystems G3G3
van thienen et al.: small-scale mantle diapirs 10.1029/2002GC000338
21 of 31

[45] The maximum vertical velocity for the dehy-
dration models D1, D2 and D3 is 16 m/yr, 50 cm/
yr and 8 cm/yr, respectively, attained in the early
stages of diapir ascent (Figure 13c). The influence
of the dehydration prefactor in the viscosity equa-
tion is evident from the lower ascent velocities
compared to the composite rheology models. Com-
pared to the composite rheology model C1, initial
ascent velocities are 2 to 4 orders of magnitude
lower. Velocities drop off to approximately 1 cm/yr
at 1.2 Myr, 1.6 Myr and 2.7 Myr, respectively, and
continue to drop to negligible levels.
[46] We have tested the sensitivity of the model to
the amplitude of the thermal perturbation which
initiates the diapirs. Figure 14 shows three series of
3 snapshots of the degree of depletion field of a
composite rheology model with grain size 1 mm
and with three different perturbation amplitudes �Tof 3%, 4% and 5%, respectively, of the background
10-3 10-2 10-1 100 101
time (ka)
10-1
100
101
102
103
v tra
cer (
m/y
r)
b) Composite rheology models
C1-4
10-3 10-2 10-1 100 101
time (Ma)
10-3
10-2
10-1
100
101
v tra
cer (
m/y
r)
c) Dehydration models
D1D2D3
10-3 10-2 10-1 100 101
time (Ma)
10-3
10-2
10-1
100
v tra
cer (
m/y
r)
a) Newtonian models
N1N2
Figure 13. Time series of the vertical velocity of selected monitor tracers. Note the different time and velocityscales used in Figures 13a, 13b and 13c.
GeochemistryGeophysicsGeosystems G3G3
van thienen et al.: small-scale mantle diapirs 10.1029/2002GC000338
22 of 31

temperature, which is approximately 1850 centi-
grade. The frames show the results to be quite
sensitive to the amplitude of the initial perturbation.
[47] The maximum root mean square velocity Vrms[see van den Berg et al., 1993] values observed have
been plotted as a function of the relative amplitude
�T of the thermal perturbation in Figure 15. The
maximum Vrms which was observed during a model
run (generally during the initial phase of diapir
ascent, illustrated in Figure 13) has been included
in frame a, for three different model cases (compo-
site 1mm(model case C2), dehydration 1mm with
fh = 50 (model case D2), and Newtonian 1mm
(model case N2)). The curves in Figure 15a are
shaped as the bottom end of a sigmoidal curve
Figure 14. Diapir development for different values �T = dT/T(z) of the amplitude of the thermal perturbation whichinitiates the diapir. Values are fractions of the background temperature, which is about 1850 centigrade at the locationof the initial perturbation. The other model parameters are the same as in case C2 (represented in the third column, seealso Figure 5). The colour contours indicate the degree of depletion F.
GeochemistryGeophysicsGeosystems G3G3
van thienen et al.: small-scale mantle diapirs 10.1029/2002GC000338
23 of 31

(although the shape is less pronounced in the New-
tonian case) revealing a transition between two
different regimes. The lower amplitude part with a
small slope represents cases where the diapir does
not fully penetrate the continental root. The upper
part with a larger slope corresponds to cases where
the initial perturbation is greater than the critical
value resulting in penetrating diapirs. Clearly, the
transition between these regimes shifts to higher
amplitudes �T considering successively stronger
rheologies from composite C2, to Newtonian N2
to hydration dependent composite D2.
[48] Figure 15b shows the relation between the 2s(2 standard deviations) radius of the thermal per-
turbation at a constant perturbation amplitude �T of5% of the background temperature. The linear
relation in log-log space is quite clear.
3.8. P,T Paths
[49] P,T paths of selected monitor tracers have been
plotted in Figure 16, where separate tracers are
indicated by different colours. Tracers were selected
on the basis of penetration to shallow depths and to
show the variation of different paths to shallower
levels. A P,T path inferred from cratonic peridotites
[Drury et al., 2001] has been included as a solid
black line. Only one composite model is shown
(C2), as the paths for the same tracers are quite
similar in the other composite models. Although the
timescales of the diapiric processes are vastly
different for the different models, the resulting P,T
paths are roughly the same for the cases shown, and
similar to the inferred cratonic peridotite path by
Drury et al. [2001] and model results by de Smet et
al. [2000b] and Drury et al. [2001]. Such a sim-
ilarity between paths derived from numerical mod-
els for diapirism and paths inferred for natural
cratonic peridotites was also noted by Drury et al.
[2001]. Some models show more cooling to lower
temperatures (N2, D1) than other models (C2) but
this is mainly caused by the running time of the
different models, ranging from 497 ka for the
composite models to 49.7 Myr for the Newtonian
and dehydration models. The short length of the
cooling leg (almost horizontal line) of the paths in
10-2 10-1
perturbation amplitude εT
10-2
10-1
100
101
102
vrm
s max
(m
/yr)
a) r=48 km
N2: Newtonian 1mmC2: Composite 1mmD2: Dehydration f=50, 1mm
101 102
perturbation radius r (km)
10-2
10-1
100
101
102
b) εT=5%
Figure 15. Variation of diapir ascent (measured as the maximum root mean square velocity of the domain) as afunction of: (a) the perturbation amplitude �T = dT/T(z) at a constant 2s (2 standard deviations) radius of 48 km; (b)the radius of the initial perturbation (2s) at a constant �T of 5%.
GeochemistryGeophysicsGeosystems G3G3
van thienen et al.: small-scale mantle diapirs 10.1029/2002GC000338
24 of 31
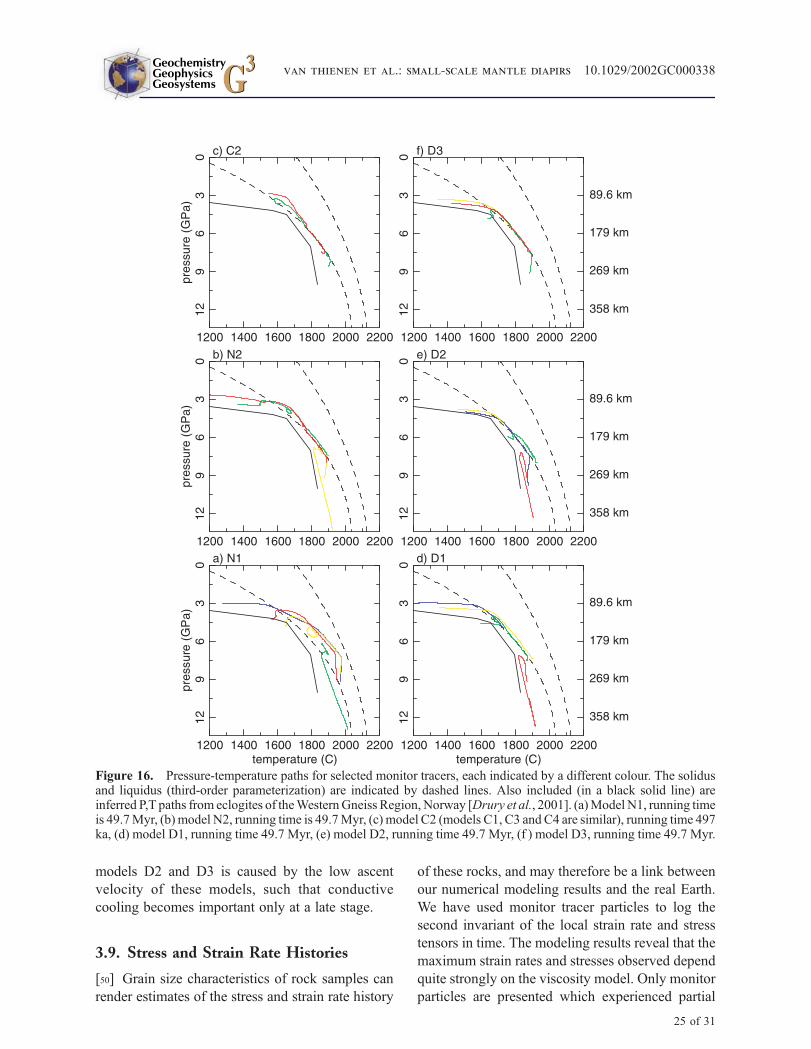
models D2 and D3 is caused by the low ascent
velocity of these models, such that conductive
cooling becomes important only at a late stage.
3.9. Stress and Strain Rate Histories
[50] Grain size characteristics of rock samples can
render estimates of the stress and strain rate history
of these rocks, and may therefore be a link between
our numerical modeling results and the real Earth.
We have used monitor tracer particles to log the
second invariant of the local strain rate and stress
tensors in time. The modeling results reveal that the
maximum strain rates and stresses observed depend
quite strongly on the viscosity model. Only monitor
particles are presented which experienced partial
a) N1
1200 1400 1600 1800 2000 2200temperature (C)
129
63
0pr
essu
re (
GP
a)
b) N2
1200 1400 1600 1800 2000 2200
129
63
0pr
essu
re (
GP
a)
c) C2
1200 1400 1600 1800 2000 2200
129
63
0pr
essu
re (
GP
a)
89.6 km
179 km
269 km
358 km
d) D1
1200 1400 1600 1800 2000 2200temperature (C)
129
63
089.6 km
179 km
269 km
358 km
e) D2
1200 1400 1600 1800 2000 2200
129
63
0
89.6 km
179 km
269 km
358 km
f) D3
1200 1400 1600 1800 2000 2200
129
63
0
Figure 16. Pressure-temperature paths for selected monitor tracers, each indicated by a different colour. The solidusand liquidus (third-order parameterization) are indicated by dashed lines. Also included (in a black solid line) areinferred P,T paths from eclogites of theWesternGneiss Region, Norway [Drury et al., 2001]. (a)Model N1, running timeis 49.7Myr, (b) model N2, running time is 49.7Myr, (c) model C2 (models C1, C3 and C4 are similar), running time 497ka, (d) model D1, running time 49.7 Myr, (e) model D2, running time 49.7 Myr, (f ) model D3, running time 49.7 Myr.
GeochemistryGeophysicsGeosystems G3G3
van thienen et al.: small-scale mantle diapirs 10.1029/2002GC000338
25 of 31

melting, and which were part of the diapir. Max-
imum strain rate and stress values which were
observed are presented in Table 5, and the stress
and strain rate versus depth for selected tracer
particles are plotted in Figure 17. The maximum
stresses observed which are listed in Table 5 vary by
less than one order of magnitude. The maximum
strain rates, however, vary over nearly five orders of
magnitude. The Newtonian models N1 and N2 have
maximum strain rates of 7.53 � 10�14s�1 and
1.62 � 10�12s�1, respectively. This difference is
caused by the smaller grain size and therefore lower
viscosity of the latter model. The four composite
rheologymodels C1–4 show very similar maximum
strain rate values, much higher (3–5 orders of
magnitude) than those observed for the Newtonian
models, just over 1 � 10�9s�1. Here, the effect of
the nonlinear component of the rheology becomes
apparent. As can be expected, the dehydration
models show lower strain rates because of their
higher viscosities, ranging from 1.75 � 10�11s�1
to 3.16 � 10�13s�1 for models D1 to D3.
4. Discussion and Conclusions
[51] Comparison of the results of models N1 and
N2 versus models C1–4 show that the addition of a
nonlinear creep component to the Newtonian dif-
fusion creep component of the rheology model
strongly increases the ascent velocity and thus
reduces the characteristic emplacement timescale
for a diapir considerably to less than a conservative
hundred thousand years. The results of model C5
(relative to model C1) show that a third-order
parameterization of solidus and liquidus, based
on Herzberg and Zhang [1996] (used in models
N2, C1–4 and D1–3), strongly favors diapir
development relative to a linear parameterization.
The latter third-order parameterization allows for
melting at lower temperatures for depths greater
than about 200 km than the former linear, thus
facilitating melting at these depths. Depletion-
induced compositional buoyancy further drives
the upward movement of the diapir, thus providing
a self-accelerating mechanism for diapir intrusion
into and within a continental root. This illustrates
the importance of compositional differentiation in
the evolution of mantle diapirs.
[52] The results of all models show locally sharp
variations in the degree of depletion, most readily
observable in the degree of depletion profiles
(frames d1–3) of the model result Figures 2–7
and 10–12. Numerical models have indicated that
these sharp compositional variations in the litho-
sphere resulting from mantle diapirism of the kind
investigated here may act as seismic P-wave reflec-
tors [de Smet et al., 1999]. Possibly, the sheetlike
structures of flattened diapir heads, as predicted by
some of our models for a composite rheology, will
be detectable in the uppermost mantle by seismic
methods as have been applied in recent mantle
reflection seismic studies [e.g., Pavlenkova and
Yegorkin, 1983; Ellis et al., 1996; Pavlenkova et
al., 1996].
[53] Another aspect related to direct observables is
the seismic anisotropy which may be created by the
deformation processes included in our models [see,
e.g., Tommasi et al., 1999]. Silver et al. [2001] find
evidence for preservation of Archean mantle defor-
mation in small or vertically incoherent seismic
anisotropy in their region of study (Kaapvaal and
Zimbabwe cratons).
[54] The results of the modeling experiments show
that a relatively large variations in grain size (two
orders of magnitude, which translates to five orders
of magnitude in the diffusion creep viscosity pre-
factor through the grain size exponent m = 2.5)
have a limited effect on the dynamics of the diapirs
modeled in this work. Although the dominant
Table 5. Maximum Observed Values for the SecondInvariant of the Strain Rate Tensor and the SecondInvariant of the Stress Tensor, Respectivelya
Model Maximum Strain Rate, s�1 Maximum Stress, Pa
N1 7.53 � 10�14 1.21 � 106
N2 1.62 � 10�12 4.90 � 106
C1 1.28 � 10�9 3.68 � 106
C2 1.25 � 10�9 3.66 � 106
C3 1.25 � 10�9 3.66 � 106
C4 1.25 � 10�9 3.66 � 106
D1 1.75 � 10�11 5.43 � 106
D2 5.93 � 10�13 7.27 � 106
D3 3.16 � 10�13 7.97 � 106
aOnly monitor tracers that have undergone partial melting during
the model run have been considered.
GeochemistryGeophysicsGeosystems G3G3
van thienen et al.: small-scale mantle diapirs 10.1029/2002GC000338
26 of 31

creep mechanism clearly shifts from diffusion
creep to dislocation creep as a result of increasing
the grain size parameter, the overall dynamics of
the different cases are roughly similar. Detailed
analysis of snapshots of the viscosity field reveals a
localized zone of high stress and strain rate and low
viscosity surrounding the diapiric head. Roughly
the same viscosity minima are found in this local-
ized deformation zone for the different composite
rheology cases, indicating that a self-regulating
mechanism is operative, controlling the ascent.
[55] Concerning the effect of dehydration on the
rheology, we have found that this has a strong
effect on diapir dynamics. Although two of the
three depletion viscosity factors are smaller than
those reported by Hirth and Kohlstedt [1996]
(factor 100–180), it is quite apparent from the
1 2 3 4 5 6 7stress (MPa)
300
200
100
dept
h (k
m)
d) D21 2 3 4 5 6 7
300
200
100
dept
h (k
m)
c) C21 2 3 4 5 6 7
300
200
100
dept
h (k
m)
b) N21 2 3 4 5 6 7
300
200
100
dept
h (k
m)
a) N1
10-1510-1410-1310-1210-1110-10 10-9
secinv strainrate (s-1)
300
200
100
h) D210-1510-1410-1310-1210-1110-10 10-9
300
200
100
g) C210-1510-1410-1310-1210-1110-10 10-9
300
200
100
f) N210-1510-1410-1310-1210-1110-10 10-9
300
200
100
e) N1
Figure 17. Paths for selected tracers of model(s) N1, N2, C2 and D2 in stress-depth space and strain rate–depthspace, respectively. Figures 17a–17d show the stress as a function of depth for these models, and Figures 17e–17hshow the second invariant of the strain rate as a function of depth for selected monitor particle tracers.
GeochemistryGeophysicsGeosystems G3G3
van thienen et al.: small-scale mantle diapirs 10.1029/2002GC000338
27 of 31
results of models D1, D2 and D3 (Figures 10, 11
and 12) that even the effect of a relatively small
dehydration factor (as low as 10) is considerable.
This smaller factor may by justified by assuming
that the material becomes ( partially) rehydrated
by mobile volatile phases originating from other
areas of partial melting, since studies of craton
xenoliths show evidence for rehydration [Harte,
1983]. The fact that peridotites have been
emplaced in the Archean at depths of up to 100
km [Drury et al., 2001], and that this depth is not
reached by the diapir model with maximum
dehydration prefactor fh = 200 (model D3, Figure
12) suggests that during the Archean the rheology
of the cratonic lithosphere was not completely
dry. The model case C2 is used as a reference
(Figure 5) in the investigation of the effect of the
viscosity factor fh. The shape of the diapir head,
the vertical velocity of the diapir and the level to
which the diapir penetrates are all strongly influ-
enced by this dehydration factor. With increasing
viscosity factor, the shape tends to be more
mushroom-like, the ascent velocity of the diapir
decreases and the penetrating power is diminished
as well.
[56] The different experiments which we have
conducted have yielded diapirs showing ascent
velocities of several centimeters per year for purely
Newtonian model N1 and dehydration model D3
(factor 200) up to several hundred meters per year
for the composite rheology models C1, C2, C3 and
C4. Although these high end values seem extreme,
other workers have reported high velocities in non-
Newtonian mantle models. Larsen et al. [1997] and
Larsen and Yuen [1997] report ascent velocities for
non-Newtonian diapirs over 10 m/yr.Weinberg and
Podladchikov [1994] showed that a diapir may rise
with velocities of 10–100 m/yr into the middle or
upper crust if the wall rock exhibits power law
behavior, and Solomatov and Moresi [2000] find
velocities of several meters per year for cold
plumes formed in a stagnant lid regime convection
model. The very high ascent velocities in our
models are also facilitated by weakening of the
surrounding rock by a large strain rate and a power
law rheology (the dislocation creep component), as
can be observed in frames c1–3 of Figures 4–7.
[57] A comparison of stress and strain rate histories
obtained in this study with geological observations
might help to constrain models of mantle diapirism
in view of the large uncertainty in the model
parameters applied. Structures and microstructures
in these mantle rocks provide some independent
control on the conditions of deformation during
diapir upwelling in cratonic lithosphere. The differ-
ential stress during high temperature deformation
can be estimated from the dynamic recrystallized
grain size. If the temperature during deformation is
known then strain rates can be estimated from the
stress and temperature estimates.
[58] The stress and strain rate histories within the
model diapirs show relatively high initial strain
rates (up to 10�10 to 10�9 s�1 for model C2, see
Figure 17 and Table 5) and stress levels (2–7
MPa). The dynamic recrystallized grain size pro-
duced during the initial diapir intrusion should be
around 1 to 15 mm. As upwelling continues stress
and strain rate decrease overall, although many
tracers experience a strain rate and stress pulse at
shallow depths with stress levels up to 1 MPa. The
last stages of deformation at shallow depth occur
with decreasing stress and strain rate at stress levels
less than 1 to 0.5 MPa. The decaying strain rates
can be related to the cooling of the diapir as it
accretes into the lithosphere. If the dynamic recrys-
tallized grain size remained ‘‘in equilibrium’’ with
the stress in the final stages of deformation then a
grain size between 1.5–10 cm would be expected.
This estimate of the dynamically recrystallized
grain size is based on an experimental calibration
for olivine with low water content over a temper-
ature range of 1100–1650C [Karato et al., 1980;
van der Wal et al., 1993]. As the diapir cools down
the stress and strain rate decrease to very low
values such that the material will become
‘‘annealed.’’ In this situation the grain size will
be modified by static recrystallization with the
grain size depending on the amount of residual
strain in the grains, the time of annealing and the
temperature during annealing.
[59] In the cratonic peridotites from Norway and
kimberlite xenoliths the average grain sizes are in
the range of 0.5 to 10 mm [Ave Lallemant et al.,
1980; van Roermund et al., 2001]. The micro-
GeochemistryGeophysicsGeosystems G3G3
van thienen et al.: small-scale mantle diapirs 10.1029/2002GC000338
28 of 31
structures of the Norwegian peridotites are consis-
tent with significant static recrystallization as strain
free grains (1–4 mm) have replaced much larger
deformed grains (1–10 cm diameter). Similar
trends are found in kimberlite xenoliths and in
the spinel peridotites from the North Pyrenean fault
zone [Fabries et al., 1991]. The large grain sizes
found as relict grains in the cratonic peridotites are
consistent with the grain size to be expected from
the numerical models. The large grain sizes (1–30
cm) found as relict grains in the cratonic peridotites
are consistent with the dynamic recrystallized grain
size predicted (1.5–10 cm) from the stress levels in
the numerical models for the last stage of defor-
mation. The static recrystallized microstructure of
cratonic peridotites is also consistent with the
thermomechanical history of diapirs in the numer-
ical models. In the Norwegian peridotites, how-
ever, the recrystallized grain size is smaller than the
initial grain size which suggests a more complex
history with a second deformation and recrystalli-
zation cycle, possibly related to later subduction
and exhumation, supercilious on the coarse micro-
structure produced by diapiric intrusion.
[60] Rough estimates of the strain rates during the
high temperature history of the Norwegian cratonic
peridotites can be made from stress and temper-
ature estimates combined with experimental flow
laws. For a stress of 0.5 MPa and a temperature
range of 1350–1600�C estimated from early min-
eral assemblies [van Roermund and Drury, 1998;
Drury et al., 2001] strain rates in the range of 7 �10�15 to 1.4 � 10�12 s�1 are indicated for dry
olivine and 1.4 � 10�12 to 2.0 � 10�10 s�1 for wet
olivine [Chopra and Paterson, 1984]. This broad
range of strain rates is compatible with strain rates
obtained from the numerical models (Figure 17)
during the last stages of diapir intrusion into the
lithosphere.
[61] Note that local strain rates in the diapir can be
very high and much higher than strain rates
expected from typical plate tectonic rates. Some
spectacularly sheared xenoliths are found in kim-
berlites [Nixon and Boyd, 1973; Boullier and
Nicolas, 1973] and estimates of deformation con-
ditions imply very high stress and strain rates
[Goezte, 1978; Mercier, 1979]. Kimberlite magma-
tism may be associated with diapirs in the modern
mantle [Green and Gueguen, 1983; Haggerty,
1994]. These diapirs would be quite different from
those modeled in this study, if only because the
potential temperature of the mantle is of the order
of 300 centigrade lower, which strongly increases
viscosities. However, we note that the very high
strain rates and stress levels estimated for the
sheared xenoliths could be consistent with defor-
mation during diapiric intrusion, although this
would need to be tested with models which include
wet melting in a modern mantle.
Acknowledgments
[62] We thank Michel Jacobs for helpful discussions con-
cerning thermodynamic aspects of the work and David Yuen
and Alison Leitch for their constructive reviews of the
manuscript.
References
Arndt, N., C. Ginibre, C. Chauvel, F. Albarede, M. Cheadle,
C. Herzberg, G. Jenner, and Y. Lahay, Were komatiites wet?,
Geology, 26, 739–742, 1998.
Ave Lallemant, H. G., N. L. Carter, J.-C. C. Mercier, and J. V.
Ross, Rheology of the uppermost mantle: Inferences from
peridotite xenoliths, Tectonophysics, 70, 1–27, 1980.
Boullier, A.-M., and A. Nicolas, Texture and fabric of perido-
tite nodules from kimberlite at Mothae, Thaba Putsoa and
Kimberley, in Lesotho Kimberlites, pp. 57–66, Lesotho Natl.
Dev. Corp., Meseru, Lesotho, 1973.
Braun, J., J. Chery, A. Poliakov, D. Mainprice, A. Vauchez,
A. Tomassi, and M. Daignieres, A simple parameterization
of strain localization in the ductile regime due to grain size
reduction: A case study for olivine, J. Geophys. Res., 104,
25,167–25,181, 1999.
Brueckner, H. K., and L. G. Medaris, A tale of two orogens:
The contrasting T-P-t history and geochemical evolution of
mantle in high and ultra-high pressure metamorphic terranes
of the Norwegian Caledonides and the Czech Variscides,
Schweiz. Mineral. Petrogr. Mitt., 78, 293–307, 1998.
Buck, W. R., and W. Su, Focused mantle upwelling below
mid-ocean ridges due to feedback between viscosity and
melting, Geophys. Res. Lett., 16(7), 641–644, 1989.
Campbell, I. H., and R. I. Hill, A two-stage model for the
formation of the granite-greenstone terrains of the Kalgoor-
lie-Norseman area, Western Australia, Earth Planet. Sci.
Lett., 90, 11–25, 1988.
Chopra, P. N., and M. S. Paterson, The experimental deforma-
tion of dunite, Tectonophysics, 78, 453–473, 1981.
Chopra, P., and M. S. Paterson, The role of water in the de-
formation of dunite, J. Geophys. Res., 89, 7861–7876, 1984.
de Bresser, J. H. P., C. J. Peach, J. P. J. Reijs, and C. J. Spiers,
On dynamic recrystallization during solid state flow: Effects
GeochemistryGeophysicsGeosystems G3G3
van thienen et al.: small-scale mantle diapirs 10.1029/2002GC000338
29 of 31

of stress and temperature, Geophys. Res. Lett., 25(18),
3457–3460, 1998.
de Bresser, J. H. P., J. H. ter Heege, and C. J. Spiers, Grain size
reduction by dynamic recrystallization: Can it result in major
rheological weakening?, Int. J. Earth Sci., 90(1), 28–45,
2001.
de Smet, J. H., The evolution of the continental upper mantle:
Numerical modelling of thermo-chemical convection includ-
ing partial melting, Ph.D. thesis, University of Utrecht,
Utrecht, Netherlands, 1999.
de Smet, J. H., A. P. van den Berg, and N. J. Vlaar, Stability
and growth of continental shields in mantle convection mod-
els including recurrent melt production, Tectonophysics, 296,
15–29, 1998.
de Smet, J. H., A. P. van den Berg, and N. J. Vlaar, The
evolution of continental roots in numerical thermo-chemical
mantle convection models including differentiation by partial
melting, Lithos, 48, 153–170, 1999.
de Smet, J. H., A. P. van den Berg, N. J. Vlaar, and D. A. Yuen,
A characteristics-based method for solving the transport
equation and its application to the process of mantle differ-
entiation and continental root growth, Geophys. J. Int., 140,
651–659, 2000a.
de Smet, J. H., A. P. van den Berg, and N. J. Vlaar, Early
formation and long-term stability of continents resulting
from decompression melting in a convecting mantle, Tecto-
nophysics, 322, 19–33, 2000b.
Drury, M. R., and J. D. Fitz Gerald, Mantle rheology: Insights
from laboratory experiments on mineral deformation and
transformation, in The Earth’s Mantle, pp. 503–559, Cam-
bridge Univ. Press, New York, 1998.
Drury, M. R., H. L. M. van Roermund, D. A. Carswell, J. H. de
Smet, A. P. van den Berg, and N. J. Vlaar, Emplacement of
deep upper mantle rocks into cratonic lithosphere by convec-
tion and diapiric upwelling, J. Petrol., 42, 131–140, 2001.
Ellis, R. M., Z. Hajnal, and M. G. Bostock, Seismic studies on
the trans-Hudson orogen of Western Canada, Tectonophy-
sics, 262, 35–50, 1996.
Fabries, J., J. P. Lorand, J. L. Bodinier, and C. Dupuy, Evolution
of the upper mantle beneath the Pyrenees: Evidence from
orogenic spinel lherzolite massifs, J. Petrol., 32, 55–76, 1991.
Fei, Y., H. Mao, and B. O. Mysen, Experimental determination
of element partitioning and calculation of phase relations in
the MgO-FeO-SiO2 system at high pressure and high tem-
perature, J. Geophys. Res., 96, 2157–2169, 1991.
Goezte, C., Sheared lherzolites from the point of view of rock
mechanics, Geology, 3, 172–173, 1978.
Green, H. W., and Y. Gueguen, Deformation of peridotite in
the mantle and extraction by kimberlite: A case history docu-
mented by fluid and solid precipitates in olivine, Tectono-
physics, 92, 71–92, 1983.
Haggerty, S. E., Superkimberlites: A geodynamic diamond
window to the Earth’s core, Earth Planet. Sci. Lett., 122,
57–69, 1994.
Harte, B., Mantle peridotites and processes: The kimberlite
sample, in Continental Basalts and Mantle Xenoliths, edited
by C. J. Hawkesworth and M. J. Norry, pp. 46–91, Birkhau-
ser Boston, Cambridge, Mass., 1983.
Herzberg, C., and M. J. O’Hara, Phase equilibrium constraints
on the origin of basalts, picrites and komatiites, Earth Sci.
Rev., 44(1–2), 39–79, 1998.
Herzberg, C., and J. Zhang, Melting experiments on anhydrous
peridotite KLB-1: Compositions of magmas in the upper
mantle and the transition zone, J. Geophys. Res., 101,
8271–8295, 1996.
Hirth, G., and D. L. Kohlstedt, Water in the oceanic upper
mantle: Implications for rheology, melt extraction and the
evolution of the lithosphere, Earth Planet. Sci. Lett., 144,
93–108, 1996.
Hockney, R. W., and J. W. Eastwood, Computer Simulation
Using Particles, Inst. of Phys., Philadelphia, Pa., 1988.
Ito, G., Reykjanes ‘V’ shaped ridges originating from a pulsing
and dehydrating mantle plume, Nature, 411, 681–684, 2001.
Ito, G., Y. Shen, G. Hirth, and C. J. Wolfe, Mantle flow, melt-
ing, and dehydration of the Iceland mantle plume, Earth
Planet. Sci. Lett., 165, 81–96, 1999.
Jaques, A. L., and D. H. Green, Anhydrous melting of perido-
tite at 0–15 Kb pressure and the genesis of tholeiitic basalts,
Contrib. Mineral. Petrol., 73, 287–310, 1980.
Jha, K., E. M. Parmentier, and J. P. Morgan, The role of mantle-
depletion and melt-retention buoyancy in spreading-center
segmentation, Earth Planet. Sci. Lett., 125, 221–234, 1994.
Jordan, T. H., Mineralogies, densities, and seismic velocities of
garnet lherzolites and their geophysical implications, in The
Mantle Sample: Inclusions in Kimberlites and Other Volca-
nics, pp. 1–14, AGU, Washington, D.C., 1979.
Jung, H., and S.-I. Karato, Effects of water on dynamically
recrystallized grain-size of olivine, J. Struct. Geol., 23,
1337–1344, 2001.
Kameyama, M., D. A. Yuen, and H. Fujimoto, The interaction
of viscous heating with grain-size dependent rheology in the
deformation of localized slip zones, Geophys. Res. Lett.,
24(20), 2523–2526, 1997.
Karato, S., Does partial melting reduce the creep strength of
the upper mantle?, Nature, 319, 309–310, 1986.
Karato, S.-I., and H. Jung, Water, partial melting and the origin
of the seismic low velocity and high attenuation zone in the
upper mantle, Earth Planet. Sci. Lett., 157, 193–207, 1998.
Karato, S.-I., and P. Wu, Rheology of the upper mantle: A
synthesis, Science, 260, 771–778, 1993.
Karato, S.-I., M. Toriumi, and T. Fujii, Dynamic recrystalliza-
tion of olivine single crystals during high-temperature creep,
Geophys. Res. Lett., 7(9), 649–652, 1980.
Karato, S., S. Q. Zhang, and H. R. Wenk, Superplasticity in the
Earth’s lower mantle: Evidence from seismic anisotropy and
rock physics, Science, 270, 458–461, 1995.
Lambeck, K., C. Smither, and P. Johnston, Sea-level change,
glacial rebound and mantle viscosity for northern Europe,
Geophys. J. Int., 134, 102–144, 1998.
Larsen, T. B., and D. A. Yuen, Ultrafast upwelling bursting
through the upper mantle, Earth Planet. Sci. Lett., 146, 393–
399, 1997.
Larsen, T. B., D. A. Yuen, J. L. Smedsmo, and A. V. Malevsky,
Generation of fast timescale phenomena in thermo-mechan-
ical processes, Phys. Earth Planet. Inter., 102, 213–222,
1997.
GeochemistryGeophysicsGeosystems G3G3
van thienen et al.: small-scale mantle diapirs 10.1029/2002GC000338
30 of 31
Larsen, T. B., D. A. Yuen, and M. Storey, Ultrafast mantle
plumes and implications for flood basalt volcanism in the
northern Atlantic region, Tectonophysics, 311, 31–43, 1999.
McKenzie, D. P., and M. J. Bickle, The volume and composi-
tion of melt generated by extension of the lithosphere,
J. Petrol., 29(3), 625–679, 1988.
Mei, S., and D. L. Kohlstedt, Influence of water on plastic
deformation of olivine aggregates, 1, Diffusion creep regime,
J. Geophys. Res., 105, 21,457–21,469, 2000a.
Mei, S., and D. L. Kohlstedt, Influence of water on plastic
deformation of olivine aggregates, 2, Dislocation creep re-
gime, J. Geophys. Res., 105, 21,471–21,481, 2000b.
Mercier, J.-C. C., Peridotite xenoliths and the dynamics of
kimberlite intrusions, in The Mantle Sample: Inclusions in
Kimberlites and Other Volcanics, edited by F. R. Boyd and
H. O. Meyer, pp. 197–212, AGU, Washington, D. C.,
1979.
Nicolas, A., Structure and petrology of peridotites: Clues to
their geodynamic environment, Rev. Geophys., 24, 875–895,
1986.
Nicolas, A., F. Lucazeau, and R. Bayer, Peridotite xenoliths in
Massif Central basalts, France: Textural and geophysical
evidence for asthenospheric diapirism, in Mantle Xenoliths,
edited by P. H. Nixon, pp. 563–574, Wiley-Intersci., New
York, 1987.
Nisbet, E. G., M. J. Cheadle, N. T. Arndt, and M. J. Bickle,
Constraining the potential temperature of the Archaean man-
tle: A review of the evidence from komatiites, Lithos, 30,
291–307, 1993.
Nixon, P. H., and F. R. Boyd, Petrogenesis of the granular and
sheared ultrabasic nodule suite in kimberlites, in Lesotho
Kimberlites, edited by P. H. Nixon, pp. 48–56, Lesotho Natl.
Dev. Corp., Meseru, Lesotho, 1973.
Parman, S. W., J. C. Dann, T. L. Grove, and M. J. de Wit,
Emplacement conditions of komatiite magmas from the 3.49
Ga Komati formation, Barberton Greenstone Belt, South
Africa, Earth Planet. Sci. Lett., 150, 303–323, 1997.
Pavlenkova, N. I., and A. V. Yegorkin, Upper mantle hetero-
geneity in the northern part of Eurasia, Phys. Earth Planet.
Inter., 33, 180–193, 1983.
Pavlenkova, N. I., G. A. Pavlenkova, and L. N. Solodilov,
High velocities in the uppermost mantle of the Siberian Cra-
ton, Tectonophysics, 262, 51–65, 1996.
Richter, F. M., Models for the Archean thermal regime, Earth
Planet. Sci. Lett., 73, 350–360, 1985.
Ross, J. V., H. G. Ave Lallemant, and N. L. Carter, Stress
dependence of recrustallized-grain and subgrain size in oli-
vine, Tectonophysics, 70, 39–61, 1980.
Rutter, E. H., and K. Brodie, The role of tectonic grain size
reduction in the rheological stratification of the lithosphere,
Geol. Rundsch., 77(1), 295–308, 1988.
Scott, D. R., and D. J. Stevenson, A self-consistent model of
melting, magma migration and buoyancy-driven circulation
beneath mid-ocean ridges, J. Geophys. Res., 94, 2973–2988,
1989.
Silver, P. G., S. S. Gao, and K. H. Liu, Mantle deformation
beneath southern Africa, Geophys. Res. Lett., 28(13), 2493–
2496, 2001.
Solomatov, V. S., and L.-N. Moresi, Scaling of time-dependent
stagnant lid convection: Application to small-scale convec-
tion on Earth and other terrestrial planets, J. Geophys. Res.,
105, 21,795–21,817, 2000.
Stone, W. E., E. Deloule, M. S. Larson, and C. M. Lesher,
Evidence for hydrous high-MgO melts in the Precambrian,
Geology, 25, 143–146, 1997.
Takahashi, E., and I. Kushiro, Melting of dry peridotite at high
pressures and basalt magma genesis, Am. Mineral., 68, 859–
879, 1983.
Tommasi, A., B. Tikoff, and A. Vauchez, Upper mantle tec-
tonics: Three-dimensional deformation, olivine crystallo-
graphic fabrics and seismic properties, Earth Planet. Sci.
Lett., 168, 173–186, 1999.
van den Berg, A. P., and D. A. Yuen, Is the lower-mantle
rheology Newtonian today?, Geophys. Res. Lett., 23(16),
2033–2036, 1996.
van den Berg, A. P., and D. A. Yuen, The role of shear heating
in lubricating mantle flow, Earth Planet. Sci. Lett., 151, 33–
42, 1997.
van den Berg, A. P., and D. A. Yuen, Modelling planetary
dynamics by using the temperature at the core-mantle bound-
ary as a control variable: Effects of rheological layering on
mantle heat transport, Phys. Earth Planetary Inter., 108,
219–234, 1998.
van den Berg, A. P., P. E. van Keken, and D. A. Yuen, The
effects of a composite non-Newtonian and Newtonian rheol-
ogy on mantle convection, Geophys. J. Int., 115, 62–78,
1993.
van der Wal, D., P. Chopra, M. Drury, and J. Fitz Gerald,
Relationships between dynamically recrystallized grain size
and deformation conditions in experimentally deformed oli-
vine rocks, Geophys. Res. Lett., 20(14), 1479–1482, 1993.
van Keken, P. E., Evolution of starting mantle plumes: A
comparison between numerical and laboratory experiments,
Earth Planet. Sci. Lett., 148, 1–11, 1997.
van Keken, P. E., S. D. King, H. Schmeling, U. R. Christensen,
D. Neumeister, and M.-P. Doin, A comparison of methods
for the modeling of thermochemical convection, J. Geophys.
Res., 102, 22,477–22,495, 1997.
van Roermund, H. L. M., and M. R. Drury, Ultra-high pressure
(P > 6 GPa) garnet peridotites in western Norway: Exhuma-
tion of mantle rocks from more than 185 km, Terra Nova, 10,
295–301, 1998.
van Roermund, H. L. M., M. Drury, A. Barnhoorn, and A. de
Ronde, Relict majoritic garnet microstructures from ultra-
deep orogenic peridotites in western Norway, J. Petrol.,
42, 117–130, 2001.
Vlaar, N. J., and A. P. van den Berg, Continental evolution and
archaeo-sea-levels, in Glacial Isostasy, Sea-Level and Man-
tle Rheology, pp. 637–662, Kluwer Acad., Norwell, Mass.,
1991.
Walter, M. J., Melting of garnet peridotite and the origin of
komatiite and depleted lithosphere, J. Petrol., 39, 29–60,
1998.
Weinberg, R. F., and Y. Podladchikov, Diapiric ascent of mag-
mas through power law crust and mantle, J. Geophys. Res.,
99, 9543–9559, 1994.
GeochemistryGeophysicsGeosystems G3G3
van thienen et al.: small-scale mantle diapirs 10.1029/2002GC000338
31 of 31