Geochemical provenance and spatial distribution of ... · PDF fileThe dental and skeletal...
15
Available online at www.scholarsresearchlibrary.com Scholars Research Library Archives of Applied Science Research, 2012, 4 (1):292-306 (http://scholarsresearchlibrary.com/archive.html) ISSN 0975-508X CODEN (USA) AASRC9 292 Scholars Research Library Geochemical provenance and spatial distribution of fluoride in Groundwater in parts of Raniganj coal field, West Bengal, India S. Gupta*, D. Mondal and A. Bardhan Department of Environmental Science, The University of Burdwan, West Bengal, India _____________________________________________________________________________ ABSTRACT Present research work undertakes the hydro-geochemical characterization as well as demarcation of fluoride (F - ) contaminated area by means of GIS modeling. F - concentration in the study area ranges from 0.20 mg/l to 1.67 mg/l with a mean of 0.72 mg/l. Among the twenty six (26) collected samples from water table sedimentary aquifer of study area 54% samples have F - concentration <0.6 mg/l; and 8% of the samples have concentration >1.5 thereby unsuitable for drinking purpose. Majority of the water samples fall under the category of Ca-Mg-Cl followed by Ca-HCO 3 type hydrofacies. Fluoride has a significant (p<.05) positive correlation with bicarbonate (HCO 3 - ) ion and it also shows a positive correlation with sodium (Na + ) but higher negative correlation with calcium (Ca 2+ ). This may be attributed to ion-exchange process where Ca 2+ ions in water may react with clay minerals (sodium- montmorillonite) to release Na + ion in groundwater. All the groundwater samples have Ca 2+ <<HCO 3 - thereby reflects its precipitation as carbonate. Ion exchange between Ca 2+ and Na + due to the movement of groundwater in the weathering zone may also result in high F - associated with high Na + and low Ca 2+ concentration. Gibb’s ratio suggests that majority of high-fluoride groundwater samples are mainly attributed to weathering of rocks. Activity diagram between Ca 2+ vs. F - suggests that all the water samples are unsaturated with respect to fluorite. Raniganj sandstone, containing 248mg/kg of total F - may be the major contributor of F - in the water-table aquifer of the study area. Output of GIS based thematic map reveals that fluoride distribution may also structurally controlled. Key words: Hydro geochemistry; Fluoride; Ion-exchange; GIS; Raniganj coal field; West Bengal. ______________________________________________________________________________ INTRODUCTION Most of the fluoride contaminated zones in the world have been identified in sedimentary aquifers that are made up of fluoride-bearing minerals derived from granite parent rocks [1] during chemical weathering, especially in arid and semi-arid environments [2,3]. The fluoride ion contributes over 95% of the total fluoride present in drinking water [4]. The occurrence of
-
Upload
truongdung -
Category
Documents
-
view
218 -
download
2
Transcript of Geochemical provenance and spatial distribution of ... · PDF fileThe dental and skeletal...

Available online at www.scholarsresearchlibrary.com
Scholars Research Library
Archives of Applied Science Research, 2012, 4 (1):292-306 (http://scholarsresearchlibrary.com/archive.html)
ISSN 0975-508X
CODEN (USA) AASRC9
292 Scholars Research Library
Geochemical provenance and spatial distribution of fluoride in Groundwater in parts of Raniganj coal field, West Bengal, India
S. Gupta*, D. Mondal and A. Bardhan
Department of Environmental Science, The University of Burdwan, West Bengal, India _____________________________________________________________________________ ABSTRACT Present research work undertakes the hydro-geochemical characterization as well as demarcation of fluoride (F-) contaminated area by means of GIS modeling. F- concentration in the study area ranges from 0.20 mg/l to 1.67 mg/l with a mean of 0.72 mg/l. Among the twenty six (26) collected samples from water table sedimentary aquifer of study area 54% samples have F- concentration <0.6 mg/l; and 8% of the samples have concentration >1.5 thereby unsuitable for drinking purpose. Majority of the water samples fall under the category of Ca-Mg-Cl followed by Ca-HCO3 type hydrofacies. Fluoride has a significant (p<.05) positive correlation with bicarbonate (HCO3
-) ion and it also shows a positive correlation with sodium (Na+) but higher negative correlation with calcium (Ca2+). This may be attributed to ion-exchange process where Ca2+ ions in water may react with clay minerals (sodium-montmorillonite) to release Na+ ion in groundwater. All the groundwater samples have Ca2+<<HCO3
- thereby reflects its precipitation as carbonate. Ion exchange between Ca2+ and Na+ due to the movement of groundwater in the weathering zone may also result in high F- associated with high Na+ and low Ca2+ concentration. Gibb’s ratio suggests that majority of high-fluoride groundwater samples are mainly attributed to weathering of rocks. Activity diagram between Ca2+ vs. F- suggests that all the water samples are unsaturated with respect to fluorite. Raniganj sandstone, containing 248mg/kg of total F- may be the major contributor of F- in the water-table aquifer of the study area. Output of GIS based thematic map reveals that fluoride distribution may also structurally controlled. Key words: Hydro geochemistry; Fluoride; Ion-exchange; GIS; Raniganj coal field; West Bengal. ______________________________________________________________________________
INTRODUCTION
Most of the fluoride contaminated zones in the world have been identified in sedimentary aquifers that are made up of fluoride-bearing minerals derived from granite parent rocks [1] during chemical weathering, especially in arid and semi-arid environments [2,3]. The fluoride ion contributes over 95% of the total fluoride present in drinking water [4]. The occurrence of
S. Gupta et al Arch. Appl. Sci. Res., 2012, 4 (1):292-306 ______________________________________________________________________________
293 Scholars Research Library
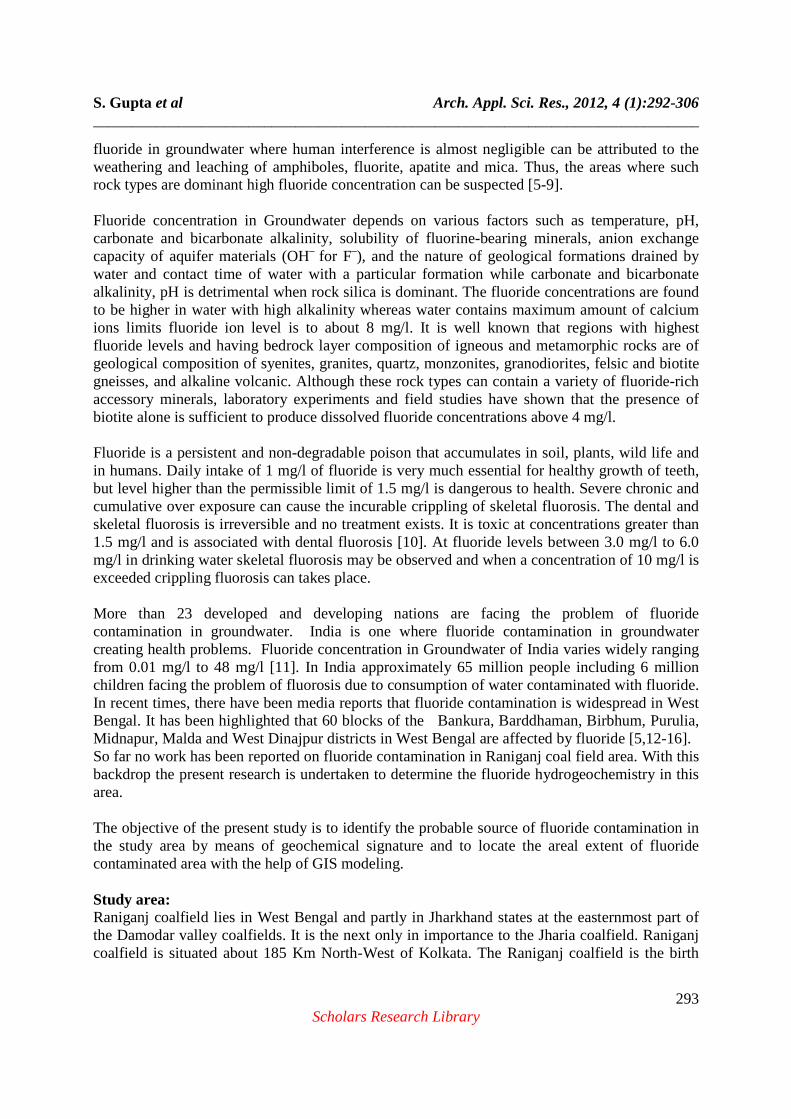
fluoride in groundwater where human interference is almost negligible can be attributed to the weathering and leaching of amphiboles, fluorite, apatite and mica. Thus, the areas where such rock types are dominant high fluoride concentration can be suspected [5-9]. Fluoride concentration in Groundwater depends on various factors such as temperature, pH, carbonate and bicarbonate alkalinity, solubility of fluorine-bearing minerals, anion exchange capacity of aquifer materials (OH– for F–), and the nature of geological formations drained by water and contact time of water with a particular formation while carbonate and bicarbonate alkalinity, pH is detrimental when rock silica is dominant. The fluoride concentrations are found to be higher in water with high alkalinity whereas water contains maximum amount of calcium ions limits fluoride ion level is to about 8 mg/l. It is well known that regions with highest fluoride levels and having bedrock layer composition of igneous and metamorphic rocks are of geological composition of syenites, granites, quartz, monzonites, granodiorites, felsic and biotite gneisses, and alkaline volcanic. Although these rock types can contain a variety of fluoride-rich accessory minerals, laboratory experiments and field studies have shown that the presence of biotite alone is sufficient to produce dissolved fluoride concentrations above 4 mg/l. Fluoride is a persistent and non-degradable poison that accumulates in soil, plants, wild life and in humans. Daily intake of 1 mg/l of fluoride is very much essential for healthy growth of teeth, but level higher than the permissible limit of 1.5 mg/l is dangerous to health. Severe chronic and cumulative over exposure can cause the incurable crippling of skeletal fluorosis. The dental and skeletal fluorosis is irreversible and no treatment exists. It is toxic at concentrations greater than 1.5 mg/l and is associated with dental fluorosis [10]. At fluoride levels between 3.0 mg/l to 6.0 mg/l in drinking water skeletal fluorosis may be observed and when a concentration of 10 mg/l is exceeded crippling fluorosis can takes place. More than 23 developed and developing nations are facing the problem of fluoride contamination in groundwater. India is one where fluoride contamination in groundwater creating health problems. Fluoride concentration in Groundwater of India varies widely ranging from 0.01 mg/l to 48 mg/l [11]. In India approximately 65 million people including 6 million children facing the problem of fluorosis due to consumption of water contaminated with fluoride. In recent times, there have been media reports that fluoride contamination is widespread in West Bengal. It has been highlighted that 60 blocks of the Bankura, Barddhaman, Birbhum, Purulia, Midnapur, Malda and West Dinajpur districts in West Bengal are affected by fluoride [5,12-16]. So far no work has been reported on fluoride contamination in Raniganj coal field area. With this backdrop the present research is undertaken to determine the fluoride hydrogeochemistry in this area. The objective of the present study is to identify the probable source of fluoride contamination in the study area by means of geochemical signature and to locate the areal extent of fluoride contaminated area with the help of GIS modeling. Study area: Raniganj coalfield lies in West Bengal and partly in Jharkhand states at the easternmost part of the Damodar valley coalfields. It is the next only in importance to the Jharia coalfield. Raniganj coalfield is situated about 185 Km North-West of Kolkata. The Raniganj coalfield is the birth

S. Gupta et al Arch. Appl. Sci. Res., 2012, 4 (1):292-306 ______________________________________________________________________________
294 Scholars Research Library
place of coal mining in the India and mining operation in this coalfield started in the year 1774. The Raniganj coalfield area covers about 1530 km2, spreading over Burdwan, Birbhum, Bankura and Purulia districts in West Bengal and Dhanbad district in Jharkhand. The area is surrounded on all the three sides by perennial rivers viz., Damodar, Ajoy and Barakar and plenty of rainfall, there appears to be substantial Groundwater potential in the area. The present study area ( part of the Raniganj Coalfield ) shown in the (Fig 1) is situated between latitude 23°37′ N and 23.62° N and longitude 87°08′ E and 87.13° E with an average elevation of 91 meters (29 feet). Spatial variation of altitude (Fig 2) shows that the northern part of the study area represents a higher elevation with respect to the south-eastern part.
INDIA
WEST BENGAL
BURDWAN DISTRICT
RANIGANJ COALFIELD AREA
Fig 1: Location map of study area
Fig 2: Spatial variation of altitude in Raniganj Coal field area

S. Gupta et al Arch. Appl. Sci. Res., 2012, 4 (1):292-306 ______________________________________________________________________________
295 Scholars Research Library
Fig 3: Geological map of Raniganj Coal field area
Table 1: Geological succession of Raniganj Coal field area
Geological area Formation Major lithology
Recent River alluvium Unconformity Sand, clay and lime stone
Jurassic to Cretaceous
Rajmahal Trap or Intrappeans
Dolerite, mice peridotite ,dykes and sills
Upper Triassic Supra Panchet Unconformity
Sand stone and shales
Lower Triassic Panchet series Medium to coarse grained feldspathic sandstone and red clay
Upper Permian Raniganj measures Fine to medium grained sand stone, sandy/micaceous shale, coal seams, siltstone and carbonaceous shale
Middle Permian Iron stone shale Carbonaceous shales containing nodules of clays Lower Permian Barakar measures Massive sand stones and grits with shale beds and coal seams Upper Carboniferous
Talchir series Unconformity
Tillites to boulder conglomerate, yellowish green sandstone, etc.
Archaean Metamorphic rocks with igneous intrusive
Granite, granite gneiss, hornblende schist, pegmatite and veins of quartz
Geology of the study area: The study area mainly comprised of Lower Gondwana group of rocks in the Permian era and underlain by Archaean metamorphic which are exposed in the North-Western part of the area. Two major faults traverse the area, one trending NNE-SSW in the Western part and other NNW-SSE direction in the eastern part (Fig 3). Geological formations (Table 1) of the area consist of dark grey and black micaceous shale, siltstone, and sandstone along with thin to moderately thick ironstone bands. The ironstone bands are bluish grey or brown to reddish brown in colour, hard and compact basaltic rocks. Lithology of the area is represented by course to medium grained sandstone with siltstone, carbonaceous and grey

S. Gupta et al Arch. Appl. Sci. Res., 2012, 4 (1):292-306 ______________________________________________________________________________
296 Scholars Research Library
shale and coal seam. Groundwater occurs under phreatic conditions in the weathered and fractured zones. The depth to water table ranges from 5.6 to 12.1 m below the ground surface.
MATERIALS AND METHODS
Sampling techniques and analytical details: Water samples were collected from 26 different locations (Table 2) of well at Raniganj coalfield area for detail hydro geochemistry analysis of that water. pH, temperature and electrical conductance were measured immediately after collection of samples by portable meters. For analysis of the other hydrogeochemical parameter the groundwater samples were collected in polyethylene bottles. The bottles were rinsed before sampling and tightly sealed after collection and labeled in the field. Samples were collected after pumping the well for at least 10 to 15 minutes. Other than previously mentioned parameters Analysis was carried out for - total dissolved solid (TDS), total hardness (TH), alkalinity (TA), carbonate (CO3
2-), bicarbonate (HCO3
-), sodium (Na+), potassium (K+), calcium (Ca2+), magnesium (Mg2+), total iron (Fe), chloride (Cl-), sulphate (SO4
2-), nitrate-N (NO3-), phosphate (PO4
3-), silica (SiO2) and fluoride (F-
) as per standard methods [17].
Table 2: Sampling point with location details
Sample Number Location Details Latitude Longitude S1 Mangalpur 23d37'10.8" 87d08'45.8" S2 Ronai (sporting club) 23d36'52.8" 87d08'01.7" S3 Girijapara 23d36'07.1" 87d06'55.8" S4 Sahebganj 23d35'30.6" 87d07'08.0" S5 Ballavpur 23d35'01.1" 87d07'16.2" S6 Egra(opposite shiksa sadan) 23d36'11.4" 87d06'16.5" S7 Natun Egra 23d36'01.9" 87d06'12.3" S8 Narankuri 23d35'29.1" 87d05'58.8" S9 Siarsol Rajbari 23d37'46.8" 87d06'44.1" S10 Ranisayer more 23d38'52.5" 87d05'58.9" S11 Bijpur Shiksanikatan vidyapith 23d39'35.7" 87d05'53.5" S12 Kadamdanga 23d38'42.6" 87d05'53.3" S13 Puranmol colliery 23d37'29.1" 87d05'42.0" S14 Damoda(colony no. 2) 23d37'05.8" 87d05'58.8" S15 Kakardanga 23d36'35.7" 87d05'42.1" S16 Amritnagar 23d37'10.9" 87d05'24.5" S17 Harabhanga 23d36'46.5" 87d03'52.8" S18 Damalia 23d36'10.2" 87d07'37.6" S19 Nimcha 23d37'34.0" 87d04'34.8" S20 Nimcha Gram 23d38'19.3" 87d05'28.9" S21 Belebathan 23d38'37.5" 87d04'05.4" S22 J.K.Nagar(Kamarpara) 23d38'52.0" 87d03'39.9" S23 Chalbalpur 23d38'43.7" 87d03'18.4" S24 Bogra 23d39'43.4" 87d03'57.1" S25 Amrasota 23d38'22.5" 87d07'23.4" S26 Banshara 23d38'07.1" 87d07'54.0"
Soil samples were collected from vertical surfaces of Bansra underground mine in a regular interval and were kept in a plastic zipper bag and were transported to laboratory for further

S. Gupta et al Arch. Appl. Sci. Res., 2012, 4 (1):292-306 ______________________________________________________________________________
297 Scholars Research Library
analysis of water soluble fluoride (FH2O), Calcium chloride extractable fluoride (FCaCl2) and Total fluoride (FTotal). Statistical Analysis of the Experimental Data: The Pearson correlation among F and other ions in irrigation water was calculated by using the following formula [18]:
Where X and Y are two variables, with means X and Y respectively with standard deviations SX and SY. Significance of observed correlation co-efficient (r) was tested by using student t-test. GIS Methodology: Digital Elevation Model (DEM) DEM is generated on the basis of sampling points, stored as a point layer along with attribute such as F-. DEM is generated by using VEDIMINT algorithm in the Geomatica V.10.1software. The output DEM is represented as a zonation map of the said parameter. The algorithm consist of three major steps plus and optical step for processing 2D features. In the first step, input vector points (F- concentration with respect to different location) are re-projected to the raster coordinates and burned into the raster buffer, with the elevations generated due to different concentration of the said parameters interpolated linearly between vector nodes. 2D layers are ignored in this stage. If multiple elevation values are scanned into a single pixel, the maximum value is assigned the pixel, and the pixel is marked as a cliff. In the second step, the elevation at each DEM pixel is interpolated from the source elevation data. The interpolation process is based on an algorithm called Distance Transform. Interpolation is made between the source elevations and elevations at equal-distance points from source locations. If 2D vector layers are present, they are scan converted into a flag buffer during the optional step. The 2D features are also initialized to prepare for use in the smoothing stage. In step 3, a finite difference method is used to iteratively smooth the DEM grid. The algorithm uses over relaxation technique to accelerate the convergence. During the iterations, the source elevation values are never changed, while the interpolated values are updated based on the neighborhood values. Inverse Distance Interpolation (IDINT) technique Inverse distance interpolation is used to read the gray level values for the arbitrary number of pixel locations in order to generate a raster image based upon interpolation between the specified gray levels. This method of interpolation combines the idea of Thiessen polygon with the gradual change of trend surface. It considers weighted moving average. Weights are computed from a linear function of distance between sets of points and the points to be predicted. In this method the size of the starting radius is specified, which defines the starting search area for interpolation points around grid point.

S. Gupta et al Arch. Appl. Sci. Res., 2012, 4 (1):292-306 ______________________________________________________________________________
298 Scholars Research Library
Table 3: Physico-chemical analysis of water samples (All the units are expressed in mg/l except pH, EC and WL)
*N.D stands for not detected range
Location Tem(0
C) pH EC(µS/cm) WL( m) TDS TA TH Ca2+ Mg2+ Na+ K+ Fe2+ CO3
- HCO3- Cl- SO4
2- NO3- PO4
3- SiO24- F-
S1 21.60 7.88 1360 10.2 810 420 730 84 126.88 132.26 17.64 0.233 180 240 139.957 79.35 0.795 0.011 2.551 1.02 S2 20.60 7.58 1540 6.6 912 160 830 294 23.18 136.8 21.62 0.107 80 80 299.907 110.488 0.404 0.018 4.025 0.202 S3 20.20 7.65 1380 5.87 785 330 670 176.4 55.876 145.08 23.46 0.236 ND 330 229.929 98.374 3.661 0.012 2.346 0.483 S4 20.10 7.74 1250 0.93 704 420 560 151.2 44.408 84.16 17.22 0.116 ND 420 129.96 81.545 0.254 0.018 2.044 1.67 S5 20.60 7.57 1250 6.25 700 280 430 100.8 43.432 154.3 28.72 0.094 ND 280 199.938 62.114 2.338 0.02 2.32 0.358 S6 24.20 8.12 740 7.8 399 330 440 92.4 50.996 140.78 16.24 0.133 ND 330 29.991 43.984 0.374 0.008 2.473 0.907 S7 25.20 7.72 1680 5.24 1018 310 760 285.6 11.224 116.88 4.7 0.1 ND 310 189.941 154.472 1.01 0.011 2.413 0.576 S8 27.10 7.62 860 2.89 470 250 320 84 26.84 102.46 5.74 0.223 ND 250 49.985 55.691 3.245 0.021 3.088 0.618 S9 22.3 7.51 1450 8.45 827 170 800 193.2 77.348 92.5 15.36 0.113 80 90 179.944 128.943 2.355 0.03 2.771 0.277 S10 26.5 7.44 1130 4.14 637 270 530 134.4 47.336 126.66 23.48 0.1 ND 220 129.96 61.626 3.468 0.018 2.298 1.19 S11 24.9 7.53 1480 5.75 857 220 720 159.6 78.324 111.14 36.56 0.107 60 270 249.923 138.211 2.798 0.02 2.618 0.526 S12 23.8 7.59 290 2.98 144 50 170 42 15.86 23.84 3.7 0.107 ND 50 9.997 33.902 0.082 0.035 1.966 0.225 S13 24.2 7.66 810 2.08 445 280 390 84 43.92 136.12 12.78 0.094 ND 280 19.994 63.333 3.141 0.022 2.048 0.616 S14 28.1 7.86 1420 3.38 825 410 630 100.8 92.232 120.3 8.96 0.097 80 330 139.957 139.35 2.866 0.024 2.842 1.3 S15 24.1 7.8 570 3.2 300 120 250 84 9.76 96.14 7.58 0.116 ND 120 29.991 36.911 1.856 0.041 2.943 1.01 S16 24.7 7.59 1100 2.71 612 280 470 142.8 27.572 114.48 20.4 0.149 ND 280 39.988 144.472 4.229 0.014 3.032 0.419 S17 25.4 7.45 520 8.87 275 80 240 84 7.32 128.58 6.88 0.097 ND 80 39.988 45.366 4.607 0.016 3.092 0.269 S18 26.4 7.63 1460 11.5 623 260 680 193.2 48.068 123.48 6.68 0.1 ND 100 99.969 95.772 2.024 0.018 3.379 0.388 S19 25.6 7.86 1200 5.79 695 210 500 109.2 55.388 142.84 10.72 0.091 ND 210 119.963 125.772 0.202 0.042 1.999 0.778 S20 26.7 7.51 920 3.46 500 170 310 58.8 39.772 154.98 20.24 0.97 ND 170 89.972 45.528 3.008 0.008 2.163 1.62 S21 25.6 7.77 1120 5.2 619 230 460 117.6 40.504 104.34 1.78 0.107 80 150 119.963 106.098 3.446 0.018 1.917 0.443 S22 25.9 7.38 1440 5.9 813 420 550 159.6 36.844 118.6 3.48 0.11 ND 420 169.947 76.911 3.507 0.014 2.432 1.277 S23 25.3 7.65 1120 6.1 625 260 510 176.4 16.836 94.38 5.34 0.126 ND 260 119.963 73.496 3.176 0.013 3.04 0.525 S24 25.6 7.59 770 0.65 414 260 330 75.6 34.404 82.1 5.94 0.116 ND 260 69.978 23.659 3.61 0.012 2.186 0.896 S25 20.5 7.4 1840 8.2 1070 180 810 176.4 90.036 123.52 28.6 0.11 ND 180 459.857 54.553 0.868 0.025 2.156 0.547 S26 19.3 8 1320 5.94 715 330 510 109.2 57.828 99.64 35.84 0.1 60 270 99.969 134.309 3.498 0.013 2.171 0.512
S. Gupta et al Arch. Appl. Sci. Res., 2012, 4 (1):292-306 ______________________________________________________________________________
299 Scholars Research Library
RESULTS AND DISCUSSION
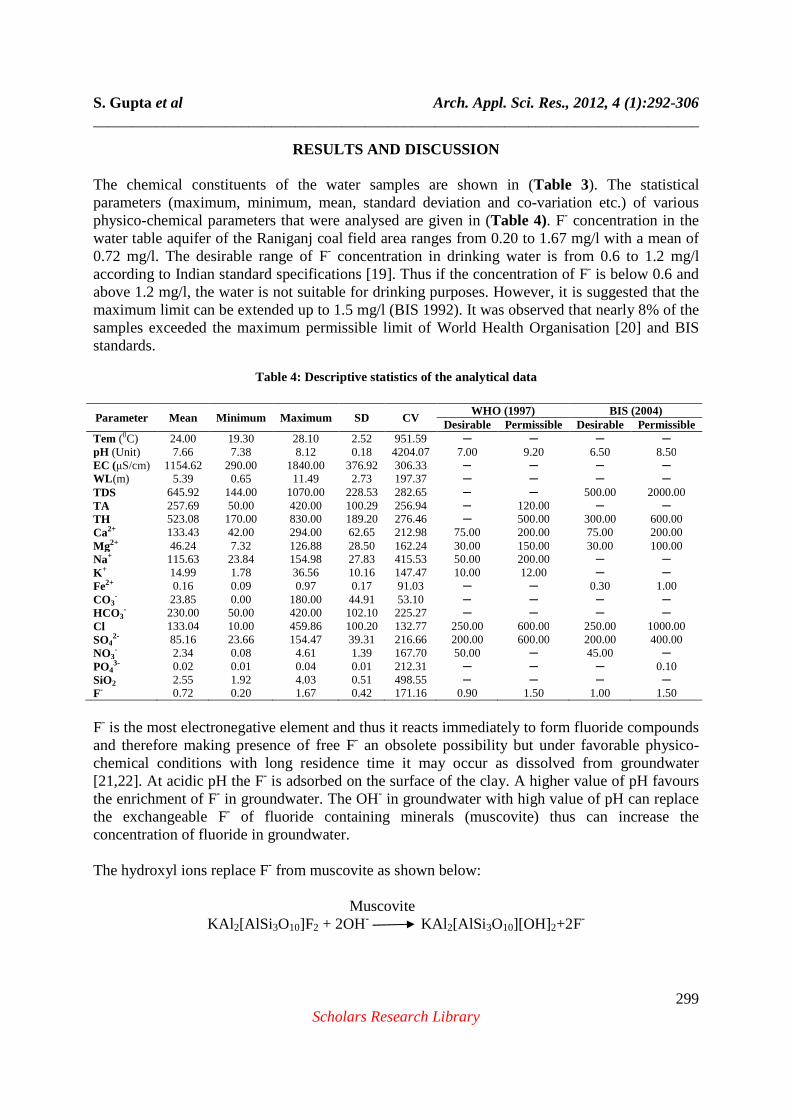
The chemical constituents of the water samples are shown in (Table 3). The statistical parameters (maximum, minimum, mean, standard deviation and co-variation etc.) of various physico-chemical parameters that were analysed are given in (Table 4). F- concentration in the water table aquifer of the Raniganj coal field area ranges from 0.20 to 1.67 mg/l with a mean of 0.72 mg/l. The desirable range of F- concentration in drinking water is from 0.6 to 1.2 mg/l according to Indian standard specifications [19]. Thus if the concentration of F- is below 0.6 and above 1.2 mg/l, the water is not suitable for drinking purposes. However, it is suggested that the maximum limit can be extended up to 1.5 mg/l (BIS 1992). It was observed that nearly 8% of the samples exceeded the maximum permissible limit of World Health Organisation [20] and BIS standards.
Table 4: Descriptive statistics of the analytical data
F- is the most electronegative element and thus it reacts immediately to form fluoride compounds and therefore making presence of free F- an obsolete possibility but under favorable physico-chemical conditions with long residence time it may occur as dissolved from groundwater [21,22]. At acidic pH the F- is adsorbed on the surface of the clay. A higher value of pH favours the enrichment of F- in groundwater. The OH- in groundwater with high value of pH can replace the exchangeable F- of fluoride containing minerals (muscovite) thus can increase the concentration of fluoride in groundwater. The hydroxyl ions replace F- from muscovite as shown below: Muscovite
KAl 2[AlSi3O10]F2 + 2OH- KAl 2[AlSi 3O10][OH]2+2F-
Parameter Mean Minimum Maximum SD CV WHO (1997) BIS (2004)
Desirable Permissible Desirable Permissible Tem (0C) 24.00 19.30 28.10 2.52 951.59 ─ ─ ─ ─ pH (Unit) 7.66 7.38 8.12 0.18 4204.07 7.00 9.20 6.50 8.50 EC (µS/cm) 1154.62 290.00 1840.00 376.92 306.33 ─ ─ ─ ─ WL(m) 5.39 0.65 11.49 2.73 197.37 ─ ─ ─ ─ TDS 645.92 144.00 1070.00 228.53 282.65 ─ ─ 500.00 2000.00 TA 257.69 50.00 420.00 100.29 256.94 ─ 120.00 ─ ─ TH 523.08 170.00 830.00 189.20 276.46 ─ 500.00 300.00 600.00 Ca2+ 133.43 42.00 294.00 62.65 212.98 75.00 200.00 75.00 200.00 Mg2+ 46.24 7.32 126.88 28.50 162.24 30.00 150.00 30.00 100.00 Na+ 115.63 23.84 154.98 27.83 415.53 50.00 200.00 ─ ─ K+ 14.99 1.78 36.56 10.16 147.47 10.00 12.00 ─ ─ Fe2+ 0.16 0.09 0.97 0.17 91.03 ─ ─ 0.30 1.00 CO3
- 23.85 0.00 180.00 44.91 53.10 ─ ─ ─ ─ HCO3
- 230.00 50.00 420.00 102.10 225.27 ─ ─ ─ ─ Cl 133.04 10.00 459.86 100.20 132.77 250.00 600.00 250.00 1000.00 SO4
2- 85.16 23.66 154.47 39.31 216.66 200.00 600.00 200.00 400.00 NO3
- 2.34 0.08 4.61 1.39 167.70 50.00 ─ 45.00 ─ PO4
3- 0.02 0.01 0.04 0.01 212.31 ─ ─ ─ 0.10 SiO2 2.55 1.92 4.03 0.51 498.55 ─ ─ ─ ─ F- 0.72 0.20 1.67 0.42 171.16 0.90 1.50 1.00 1.50
S. Gupta et al Arch. Appl. Sci. Res., 2012, 4 (1):292-306 ______________________________________________________________________________
300 Scholars Research Library
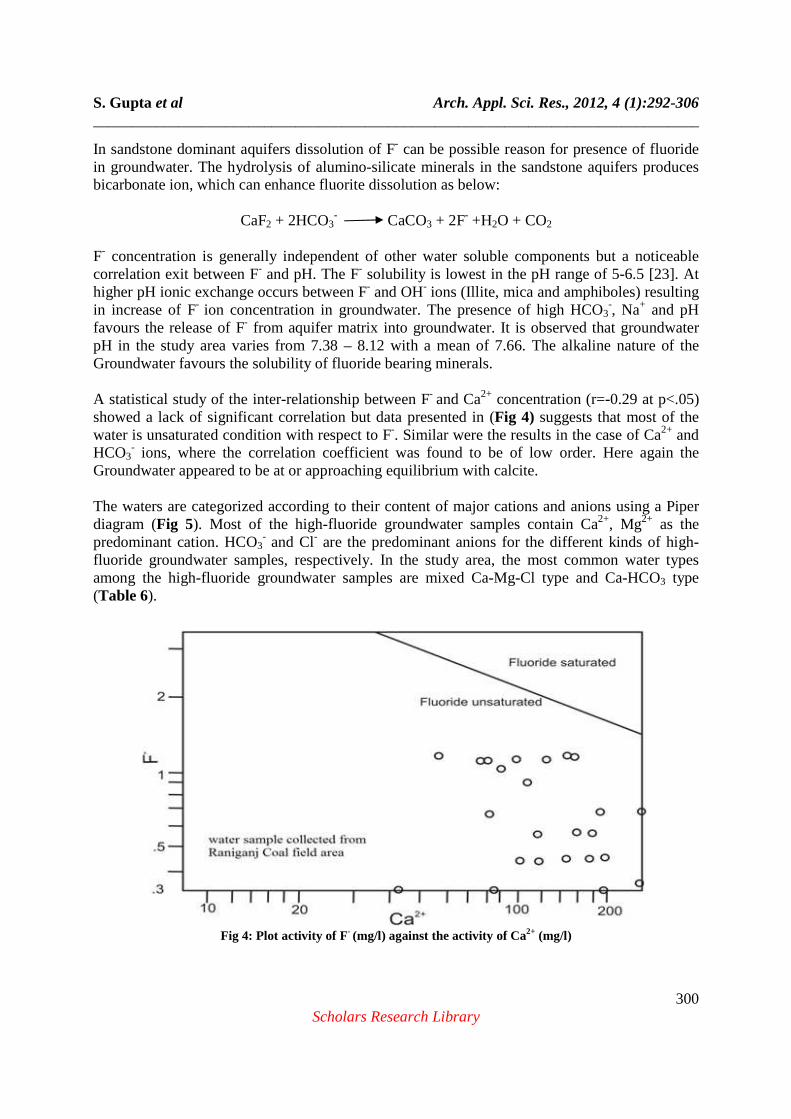
In sandstone dominant aquifers dissolution of F- can be possible reason for presence of fluoride in groundwater. The hydrolysis of alumino-silicate minerals in the sandstone aquifers produces bicarbonate ion, which can enhance fluorite dissolution as below:
CaF2 + 2HCO3- CaCO3 + 2F- +H2O + CO2
F- concentration is generally independent of other water soluble components but a noticeable correlation exit between F- and pH. The F- solubility is lowest in the pH range of 5-6.5 [23]. At higher pH ionic exchange occurs between F- and OH- ions (Illite, mica and amphiboles) resulting in increase of F- ion concentration in groundwater. The presence of high HCO3
-, Na+ and pH favours the release of F- from aquifer matrix into groundwater. It is observed that groundwater pH in the study area varies from 7.38 – 8.12 with a mean of 7.66. The alkaline nature of the Groundwater favours the solubility of fluoride bearing minerals. A statistical study of the inter-relationship between F- and Ca2+ concentration (r=-0.29 at p<.05) showed a lack of significant correlation but data presented in (Fig 4) suggests that most of the water is unsaturated condition with respect to F-. Similar were the results in the case of Ca2+ and HCO3
- ions, where the correlation coefficient was found to be of low order. Here again the Groundwater appeared to be at or approaching equilibrium with calcite. The waters are categorized according to their content of major cations and anions using a Piper diagram (Fig 5). Most of the high-fluoride groundwater samples contain Ca2+, Mg2+ as the predominant cation. HCO3
- and Cl- are the predominant anions for the different kinds of high-fluoride groundwater samples, respectively. In the study area, the most common water types among the high-fluoride groundwater samples are mixed Ca-Mg-Cl type and Ca-HCO3 type (Table 6).
Fig 4: Plot activity of F- (mg/l) against the activity of Ca2+ (mg/l)

S. Gupta et al Arch. Appl. Sci. Res., 2012, 4 (1):292-306 ______________________________________________________________________________
301 Scholars Research Library
Fig 5: Trilinear diagram for representing the analysis of Groundwater quality (piper diagram)
The HCO3
-/Ca2+ ratio at all the places is found to be greater than 1, suggesting favorability of chemical conditions for the fluoride dissolution processes [24]. Further it is noticed that the ratio of Na+/Ca2+ at 42% of all sampling locations is greater than 1 indicating low calcium activity. A high concentration of sodium favours dissolution of fluoride bearing minerals at higher pH [25]. Samples with more than 1.5 mg/l F- concentration present a negative correlation between F- concentration and Na+/(Ca2+ +Mg2+) or Cl-/(HCO3
- +SO42-) ratio, while the F- concentration is
approximately in direct proportion to Na+/(Ca2++Mg2+) ratio for the majority of data points and negative proportion to Cl-/(HCO3
- +SO42-) ratio. It implies that the increases in F- concentration
of high-fluoride groundwater samples with more than 1.5 mg/l are mainly attributed to the dissolution of some fluorine minerals with respect to chemical weathering. Gibbs [26] proposed a diagram to understand the relationship of chemical components of waters from their respective aquifer lithologies. Three distinct fields, namely precipitation dominance, evaporation dominance, and rock dominance areas are shown in the Gibbs diagram (Fig 6) Gibb’s ratios are calculated with the formulae given below:
Gibb’s Ratio I (for anion) = Cl / (Cl + HCO3) Gibb’s Ratio II (for cation) = Na +K/ (Na + K + Ca)
where all ions are expressed in meq/l.

S. Gupta et al Arch. Appl. Sci. Res., 2012, 4 (1):292-306 ______________________________________________________________________________
302 Scholars Research Library
Fig 6: Mechanism controlling the chemistry of groundwater
Fig 7: Spatial variation of water level in Raniganj Coal field area Gibbs ratios for the study area samples are plotted against their respective total dissolved solids to know whether the Groundwater chemistry is due to rock dominance or evaporation dominance or precipitation dominance. Almost all the samples fall at the margin of rock-weathering and evaporation dominance area suggesting that majority of high-fluoride groundwater samples are mainly attributed to rock weathering with minor contribution by evaporation.

S. Gupta et al Arch. Appl. Sci. Res., 2012, 4 (1):292-306 ______________________________________________________________________________
303 Scholars Research Library
Fig 8: Fluoride zonation map of Raniganj Coal field area The anthropogenic origin of fluoride in the study area can completely be ruled out as the area has neither industries nor much human settlements except very few in both the side of National Highway #2 so as to consider the discharge from these as potential source of fluoride input in groundwater as contaminant. Thus high concentration of fluoride is geogenic in origin, i.e. local hydro-geological conditions in the area are responsible for its higher concentration in groundwater. The F- content of groundwater varies greatly depending on geological settings, type of rocks and climate. Another major possibility of F- enrichment can be attributed to evaporation. Since the study area lies in semiarid environment and the temperature in summers is very high and rainfall is very less so due to evaporation the groundwater becomes oversaturated with calcite thus precipitating calcite which in turn reduces calcium content and thus promotes dissolution of fluorite. F- ion is positively correlated with calcium ions before the water is saturated with fluorite. After over saturation the concentration of Ca2+ ions overrides the solubility limit of fluorite as fluorite dissolution is suppressed by common ion effect and the correlation between the two ions (Ca2+ and F-) becomes negative [21]. An examination of the chemical analysis data highlights the following features in Groundwaters containing high fluoride content: 1.High fluoride Groundwaters are generally associated with low calcium content, there being a negative correlation between the two ions. This is reasonable in view of the low solubility of fluorite. 2.High fluoride Groundwater is generally associated with high bicarbonate ions (r=0.52, p<.05). 3.All most all the water samples are unsaturated with respect to fluorite.
S. Gupta et al Arch. Appl. Sci. Res., 2012, 4 (1):292-306 ______________________________________________________________________________
304 Scholars Research Library
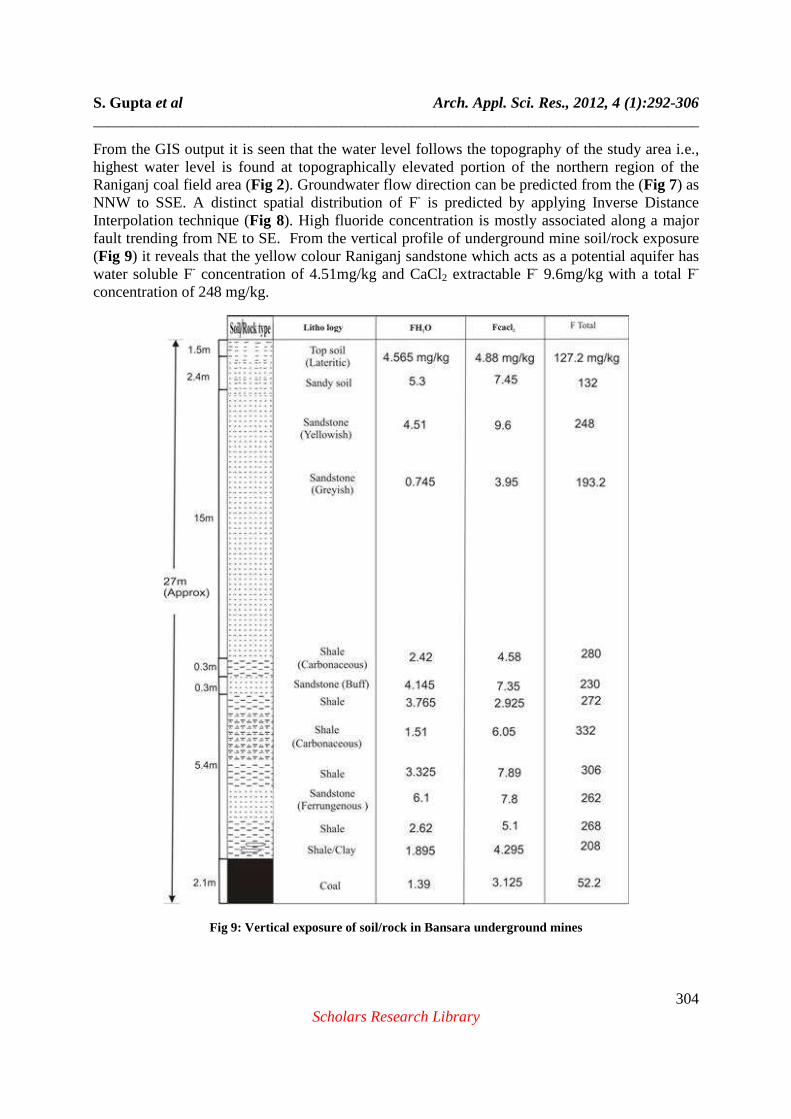
From the GIS output it is seen that the water level follows the topography of the study area i.e., highest water level is found at topographically elevated portion of the northern region of the Raniganj coal field area (Fig 2). Groundwater flow direction can be predicted from the (Fig 7) as NNW to SSE. A distinct spatial distribution of F- is predicted by applying Inverse Distance Interpolation technique (Fig 8). High fluoride concentration is mostly associated along a major fault trending from NE to SE. From the vertical profile of underground mine soil/rock exposure (Fig 9) it reveals that the yellow colour Raniganj sandstone which acts as a potential aquifer has water soluble F- concentration of 4.51mg/kg and CaCl2 extractable F- 9.6mg/kg with a total F-
concentration of 248 mg/kg.
Fig 9: Vertical exposure of soil/rock in Bansara underground mines

S. Gupta et al Arch. Appl. Sci. Res., 2012, 4 (1):292-306 ______________________________________________________________________________
305 Scholars Research Library
CONCLUSION
Ion–exchange within Raniganj Sandstone and to some extent evaporation are the major contributing factors of fluoride contamination in the Raniganj coal field area. Activity of the F- ion is also highly unsaturated with respect to fluorite. GIS modeling also shows that apart from geogenic source fluoride concentration in groundwater also controlled structurally. Acknowledgement The authors wish to thank Dr A.R.Ghosh (Associate Professor) and Dr N.K.Mondal (Assistant Professor), Department of Environmental Science, The University of Burdwan, for their constant support and valuable suggestions during the course of the investigation. Sincere thanks are also due to all the anonymous reviewers of this manuscript. Authors also express their deep sense of gratitude and offer sincere thanks to University Grants Commission (UGC) for providing financial assistance to fulfill the research project.
REFERENCES
[1] G.T.Chae, S.T.Yun, M.J. Kwon, Y.S. Kim, and B.Mayer, Geochem. J., 2006, 40, 95 -102. [2] W.M. Edmunds, and P.L. Smedley, In: O. Selinus (Ed.), Fluoride in natural waters. Essentials of medical geology, 2005,Burlington, MA: Elsevier Academic Press., 301-329 [3] W.M.Edmunds, In: H. Nash and G.J.H. Mccall (Eds.),Characterization of groundwaters in semi-arid and arid zones using minor elements., Groundwater quality ,1994,New York,Chapman and Hall,19-30. [4] P.L.Smedley, In: Selinus, O. (Ed), Fluoride in natural waters. Essentials ofmedical geology. Elsevier Academic Press, 2005, Burlington. [5] D.P.R. Sharma and S.L.N.Rao, Bull. Environ Conta Toxico, 1997, 58,241–247. [6] D.K. Nordstrom, J.W. Ball , R.J. Donahoe, and D. Whittemore, Geochim et Cosmochim Acta, 1989, 53,1727–1740. [7] D.Banks, C. Reimann , O. Røyset , H. Skarphagen, and O.M. Sæther, Appl Geochem,1995, 10,1–16. [8] B. Gizaw, J Afr Earth Sci, 1996, 22, 391–402. [9] B. Frengstad, D. Banks, and U. Siewers, The Science of the Total Environment, 2001, 277, 101–117. [10]H.A. Harper, V.W. Rodwell, and P.A. Mayes, Review of physiological chemistry. Lange Medical Publications, California, 1979. [11] S. Gupta, S. Banergee, R. Saha, J.K. Dutta., and N. Mondal, Research Report Fluoride, 2006,39, 318-320. [12] R.N.V. Rao, N. Rao, R.D. Schuiling, Environ geo., 1993, 21, 84-89. [13]A.N. Deshmukh, P.M. Wadaskar, and D.B. Malpe, In :A. N. Deshmukh, D. B. Yedekar, & K. K. K. Nair (Eds.),Fluorine in environment. Fluorine in environment in Gondwana Geological Magazine, 1995, 9, 1–20. [14] B.K. Wodeyar, and G. Sreenivasan, Curr. Sci., 1996, 70, 71–73. [15] B. Das, J. Talukdar, S. Sarma, B. Gohain, R.K. Dutta, H.B. Das, and S.C. Das, Curr. Sci., 2003, 85, 657-661. [16] N. Subba Rao, Environ. Moni. Asses. , 2008, 152, 47–60.

S. Gupta et al Arch. Appl. Sci. Res., 2012, 4 (1):292-306 ______________________________________________________________________________
306 Scholars Research Library
[17]American Public Health Association (APHA), Standard Methods for Examination of Water and Wastewater, nineteenth ed. American Public Health Association (APHA), Washington DC, 1998. [18] N.Gurumani, An Introduction to Biostatistics, 2nd revised edition. MJP Publishers, Chennai, India, 2005. [19]Bureau of Indian Standard (BIS), Indian standard specifications for drinking water. IS: 10500,1992. [20]World Health Organization (WHO), Guidelines for drinking water quality, 3rd edn. WHO, Geneva, 2004, 1, 515. [21] B.K. Handa, Geochemistry and genesis of fluoride containing groundwater in India. Groundwater, 1975, 13, 275–281. [22] P. R. Salve, A. Maurya, P. S. Kumbhare, D. S. Ramteke, and S. R. Wate, Bul. Environ. Contam. Toxicol.,2008, 81,289–293 [23] D. C. Adriano, Trace elements in the terrestrial environment. Springer, New York, 1986. [24] V. Saxena, and S. Ahmed, Environ. Geol., 2003, 43,731–736. [25]E. Shaji, J. V. Binduand, D. S. Thambi, Curr. Sci., 2007, 92, 240–245. [26] R. J. Gibbs, Sci. J., 1970, 170, 795–840.