Geochemical Evaluation of Heavy Metal Impact on the Stream ...
14
© MAY 2020 | IRE Journals | Volume 3 Issue 11 | ISSN: 2456-8880 IRE 1702307 ICONIC RESEARCH AND ENGINEERING JOURNALS 149 Geochemical Evaluation of Heavy Metal Impact on the Stream Sediments of Ajakanga Area, Ibadan, Southwestern Nigeria ROLAND ANTHONY ISIBOR 1 , JOSEPH AYOFE ADEROGBIN 2 , ODUNAYO JUMOKE OYEBODE 3 1, 2, 3 Department of Earth Sciences, Faculty of Natural Sciences, Ajayi Crowther University, Oyo, Oyo state, Nigeria Abstract- Ten sediment samples were collected from Ajakanga stream in Ibadan in order to determine concentration, spatial distribution and assess the pollution status of the heavy metals, Zn, Cr, Co, Pb, Cu and Ni.The samples were analyzed using the Inductively Couple Plasma Mass Spectrometer. The mean concentrations are 66.750ppm for Zn, 37.833ppm for Cr, 23.083ppm for Co, 18.750ppm for Pb, 14.583ppm for Cu and 12.000ppm for Ni. To assess pollution in the sediments, sediment quality guideline were applied. The mean concentrations of Pb, Cu, Ni and Zn were below the USEPA guideline, while that for Cr exceeded that of the guideline. Based on evaluation using geoaccumulation index, all the metals have low to moderate contamination, while the enrichment factor showed that the entire content of Ni and Cr in the stream sediments were derived from natural sources.Pb, Zn, Cu and Co concentrations in the sediments have anthropogenic input.Ni and Cr are deficient to minimally enriched in the sediments. Cu and Co are moderately enriched, while Pb and Zn are significantly enriched.The contamination factor for Cu, Ni, Pb, Co and Cr is low, while that of Zn is moderate. Contamination degree calculated for the stream sediments also indicated a low degree of contamination. The ecological risk index and potential ecological risk index is low,indicating that the risk of potential contamination of Ajakanga stream sediments with the current concentration of Cu, Ni, Pb, Zn, Co and Cr is low. Indexed Terms- Stream sediment, Pollution, Ajakanga, Geoaccumulation index, Enrichment factor, Ecological risk index I. INTRODUCTION Sediments are considered to be the most important sinks for the heavy metals in the aquatic environment [1]. As a result these metals commonly have higher concentration in the sediments than in the water column [2, 3, 4, 5, 6]. These metals can be derived from both natural and anthropogenic sources. Natural processes include chemical leaching of bedrocks, stream and river basins, and runoff from banks [7], while anthropogenic sources include mining operations, disposal of industrial and domestic wastes and application of biocides for pest control [8]. Recent studies have shown that contaminants such as heavy metals pose substantial risks to humans and benthic communities [9,10, 11, 12, 13, 14, 15]. Heavy metal pollution of sediments is of major concern because of their toxicity, ability to accumulate in aquatic biota and their non-degradable nature [4, 10, 16, 17, 18]. The effect of anthropogenic activities on the aquatic environment is that it alters the physical and chemical properties of both water and sediment. This may lead to a potentially dangerous concentration of the metals in the media. Consequently, this work will assess the pollution of the aquatic environment of Ajakanga stream, Ibadan, Southwestern Nigeria by potentially toxic heavy metals such as Cu, Pb, Zn, Co, Ni and Cr, using pollution indices such as Geoaccumulation index, Enrichment factor, Contamination Factor, Contamination Degree, and ecological risk indices such as Ecological risk index and Potential ecological risk index.
Transcript of Geochemical Evaluation of Heavy Metal Impact on the Stream ...

© MAY 2020 | IRE Journals | Volume 3 Issue 11 | ISSN: 2456-8880
IRE 1702307 ICONIC RESEARCH AND ENGINEERING JOURNALS 149
Geochemical Evaluation of Heavy Metal Impact on the
Stream Sediments of Ajakanga Area, Ibadan,
Southwestern Nigeria
ROLAND ANTHONY ISIBOR1, JOSEPH AYOFE ADEROGBIN2, ODUNAYO JUMOKE OYEBODE3
1, 2, 3 Department of Earth Sciences, Faculty of Natural Sciences, Ajayi Crowther University, Oyo, Oyo
state, Nigeria
Abstract- Ten sediment samples were collected from
Ajakanga stream in Ibadan in order to determine
concentration, spatial distribution and assess the
pollution status of the heavy metals, Zn, Cr, Co, Pb,
Cu and Ni.The samples were analyzed using the
Inductively Couple Plasma Mass Spectrometer. The
mean concentrations are 66.750ppm for Zn,
37.833ppm for Cr, 23.083ppm for Co, 18.750ppm for
Pb, 14.583ppm for Cu and 12.000ppm for Ni. To
assess pollution in the sediments, sediment quality
guideline were applied. The mean concentrations of
Pb, Cu, Ni and Zn were below the USEPA guideline,
while that for Cr exceeded that of the guideline.
Based on evaluation using geoaccumulation index,
all the metals have low to moderate contamination,
while the enrichment factor showed that the entire
content of Ni and Cr in the stream sediments were
derived from natural sources.Pb, Zn, Cu and Co
concentrations in the sediments have anthropogenic
input.Ni and Cr are deficient to minimally enriched
in the sediments. Cu and Co are moderately
enriched, while Pb and Zn are significantly
enriched.The contamination factor for Cu, Ni, Pb,
Co and Cr is low, while that of Zn is moderate.
Contamination degree calculated for the stream
sediments also indicated a low degree of
contamination. The ecological risk index and
potential ecological risk index is low,indicating that
the risk of potential contamination of Ajakanga
stream sediments with the current concentration of
Cu, Ni, Pb, Zn, Co and Cr is low.
Indexed Terms- Stream sediment, Pollution,
Ajakanga, Geoaccumulation index, Enrichment
factor, Ecological risk index
I. INTRODUCTION
Sediments are considered to be the most important
sinks for the heavy metals in the aquatic environment
[1]. As a result these metals commonly have higher
concentration in the sediments than in the water
column [2, 3, 4, 5, 6].
These metals can be derived from both natural and
anthropogenic sources. Natural processes include
chemical leaching of bedrocks, stream and river
basins, and runoff from banks [7], while
anthropogenic sources include mining operations,
disposal of industrial and domestic wastes and
application of biocides for pest control [8].
Recent studies have shown that contaminants such as
heavy metals pose substantial risks to humans and
benthic communities [9,10, 11, 12, 13, 14, 15].
Heavy metal pollution of sediments is of major
concern because of their toxicity, ability to accumulate
in aquatic biota and their non-degradable nature [4, 10,
16, 17, 18].
The effect of anthropogenic activities on the aquatic
environment is that it alters the physical and chemical
properties of both water and sediment. This may lead
to a potentially dangerous concentration of the metals
in the media. Consequently, this work will assess the
pollution of the aquatic environment of Ajakanga
stream, Ibadan, Southwestern Nigeria by potentially
toxic heavy metals such as Cu, Pb, Zn, Co, Ni and Cr,
using pollution indices such as Geoaccumulation
index, Enrichment factor, Contamination Factor,
Contamination Degree, and ecological risk indices
such as Ecological risk index and Potential ecological
risk index.
© MAY 2020 | IRE Journals | Volume 3 Issue 11 | ISSN: 2456-8880
IRE 1702307 ICONIC RESEARCH AND ENGINEERING JOURNALS 150
II. MATERIALS AND METHODS
2.1 Description of the Study Area
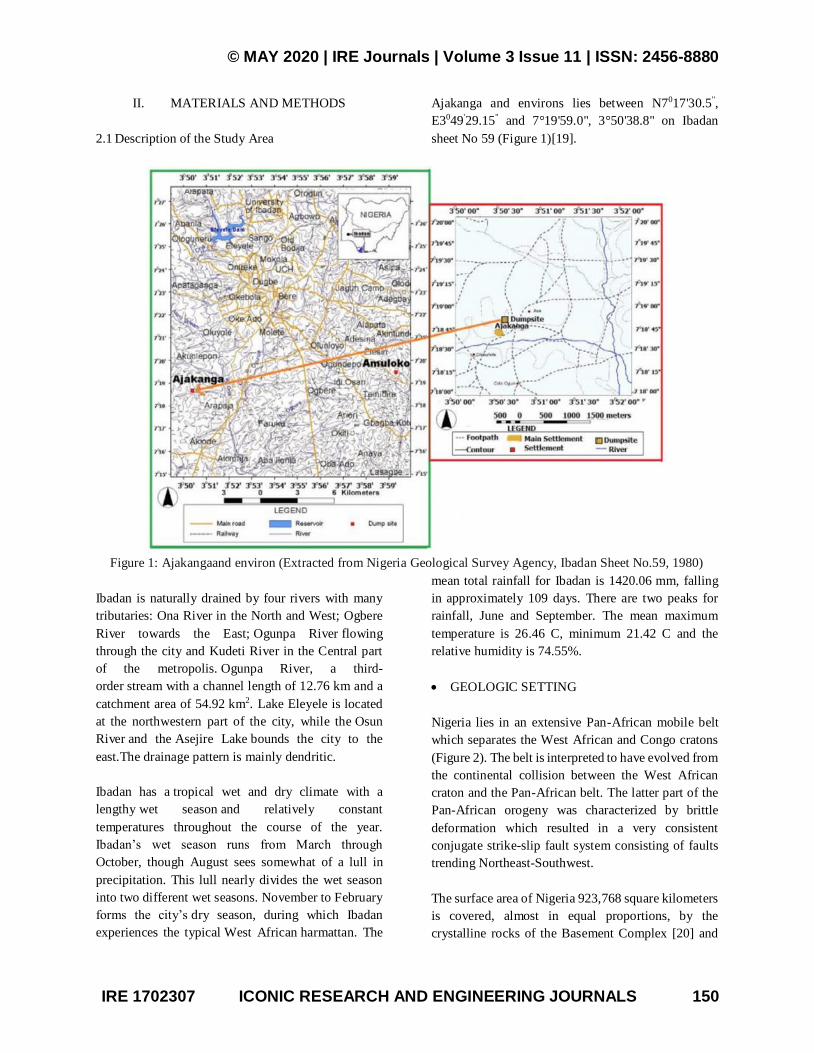
Ajakanga and environs lies between N7017'30.5",
E3049'29.15" and 7°19'59.0'', 3°50'38.8'' on Ibadan
sheet No 59 (Figure 1)[19].
Figure 1: Ajakangaand environ (Extracted from Nigeria Geological Survey Agency, Ibadan Sheet No.59, 1980)
Ibadan is naturally drained by four rivers with many
tributaries: Ona River in the North and West; Ogbere
River towards the East; Ogunpa River flowing
through the city and Kudeti River in the Central part
of the metropolis. Ogunpa River, a third-
order stream with a channel length of 12.76 km and a
catchment area of 54.92 km2. Lake Eleyele is located
at the northwestern part of the city, while the Osun
River and the Asejire Lake bounds the city to the
east.The drainage pattern is mainly dendritic.
Ibadan has a tropical wet and dry climate with a
lengthy wet season and relatively constant
temperatures throughout the course of the year.
Ibadan’s wet season runs from March through
October, though August sees somewhat of a lull in
precipitation. This lull nearly divides the wet season
into two different wet seasons. November to February
forms the city’s dry season, during which Ibadan
experiences the typical West African harmattan. The
mean total rainfall for Ibadan is 1420.06 mm, falling
in approximately 109 days. There are two peaks for
rainfall, June and September. The mean maximum
temperature is 26.46 C, minimum 21.42 C and the
relative humidity is 74.55%.
GEOLOGIC SETTING
Nigeria lies in an extensive Pan-African mobile belt
which separates the West African and Congo cratons
(Figure 2). The belt is interpreted to have evolved from
the continental collision between the West African
craton and the Pan-African belt. The latter part of the
Pan-African orogeny was characterized by brittle
deformation which resulted in a very consistent
conjugate strike-slip fault system consisting of faults
trending Northeast-Southwest.
The surface area of Nigeria 923,768 square kilometers
is covered, almost in equal proportions, by the
crystalline rocks of the Basement Complex [20] and
© MAY 2020 | IRE Journals | Volume 3 Issue 11 | ISSN: 2456-8880
IRE 1702307 ICONIC RESEARCH AND ENGINEERING JOURNALS 151
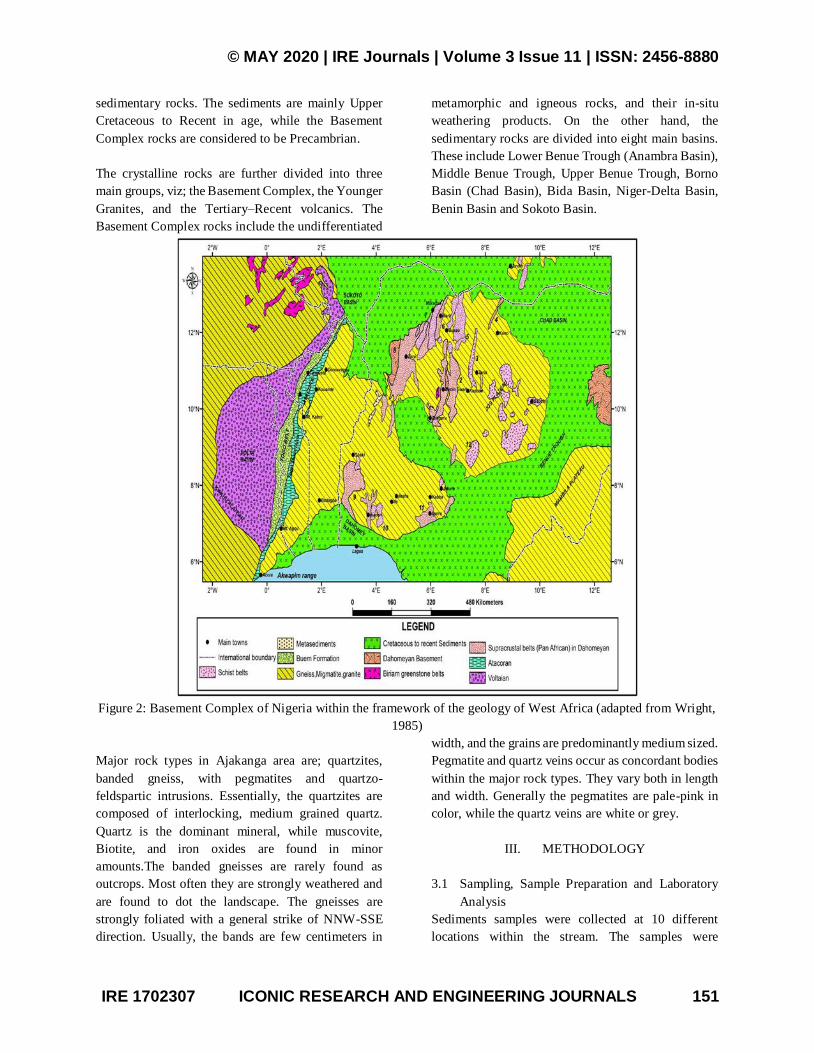
sedimentary rocks. The sediments are mainly Upper
Cretaceous to Recent in age, while the Basement
Complex rocks are considered to be Precambrian.
The crystalline rocks are further divided into three
main groups, viz; the Basement Complex, the Younger
Granites, and the Tertiary–Recent volcanics. The
Basement Complex rocks include the undifferentiated
metamorphic and igneous rocks, and their in-situ
weathering products. On the other hand, the
sedimentary rocks are divided into eight main basins.
These include Lower Benue Trough (Anambra Basin),
Middle Benue Trough, Upper Benue Trough, Borno
Basin (Chad Basin), Bida Basin, Niger-Delta Basin,
Benin Basin and Sokoto Basin.
Figure 2: Basement Complex of Nigeria within the framework of the geology of West Africa (adapted from Wright,
1985)
Major rock types in Ajakanga area are; quartzites,
banded gneiss, with pegmatites and quartzo-
feldspartic intrusions. Essentially, the quartzites are
composed of interlocking, medium grained quartz.
Quartz is the dominant mineral, while muscovite,
Biotite, and iron oxides are found in minor
amounts.The banded gneisses are rarely found as
outcrops. Most often they are strongly weathered and
are found to dot the landscape. The gneisses are
strongly foliated with a general strike of NNW-SSE
direction. Usually, the bands are few centimeters in
width, and the grains are predominantly medium sized.
Pegmatite and quartz veins occur as concordant bodies
within the major rock types. They vary both in length
and width. Generally the pegmatites are pale-pink in
color, while the quartz veins are white or grey.
III. METHODOLOGY
3.1 Sampling, Sample Preparation and Laboratory
Analysis
Sediments samples were collected at 10 different
locations within the stream. The samples were

© MAY 2020 | IRE Journals | Volume 3 Issue 11 | ISSN: 2456-8880
IRE 1702307 ICONIC RESEARCH AND ENGINEERING JOURNALS 152
collected at reasonably distance from one another
(Figure 3).Samples were collected and kept in tagged
sample bag and GPS coordinates of each sample
locations were recorded (Table 1).
Figure 3: Stream sediment sample locations
TABLE 1: Stream Sediment Sample Location
Coordinates.
Sample
ID
Northings
Easting
Elevation
(m)
L1 7° 18' 33.5" 3° 50' 20.4" 144
L2 7° 18' 35.8" 3° 50' 23.0" 152
L3 7° 18' 38.3" 3° 50' 32.4" 144
L4 7° 18' 43.3" 3° 50' 33.3" 142
L5 7° 18' 25.4" 3 ° 50' 15.1" 154
L6 7° 18' 08.2" 3° 50' 13.8" 172
L7 7° 17' 49.7" 3° 50' 47.8" 155
L8 7° 18' 06.2" 3° 49' 48.1" 168
L9 7° 19' 17.6" 3° 50' 53.7" 155
L10 7° 19' 21.7" 3° 50' 57.6" 155
The sediments were air dried in the laboratory. And
sieved through a <0.075mm sieve to obtain fine
grained samples for chemical analysis. To prevent
contamination, after a sample from a location was
sieved, the sieve and the pan were thoroughly brushed
out and cleaned with acetone before another sample
was put in for sieving and this was done all through
the sample preparation. The shaking was done by a
mechanical sieve shaker and then the sieved portion
(<0.075mm) was collected and fraction packed into air
tight polythene bag which was later sent to ACME
laboratories, Vancouver, Canada for geochemical
analysis. Inductively coupled plasma–mass
spectrometry (ICP-MS) was used to measure the
concentration of each metal in the sample.
3.2 Statistical Analysis
The range, mean, and standard deviation calculation
were carried out using Microsoft excel 2013 Program.
3.3 Pollution and Ecological Risk Indices
The index of geo-accumulation (Igeo) enable the
assessment of contamination by comparing the current
and pre-industrial concentration originally used with
bottom sediment [21]; it can also be applied to the
assessment of soil contamination. The method
assesses the degree of metal pollution in term of
enrichment classes (Table 2) based on the increasing
numerical values of the index. It is computed using the
equation below.
Igeo = log2Cn/1.5Bn
Where:
Cn is the measured concentration of the element in the
politic sediment fraction (<2mm) and Bn is the
geochemical background value/average shale
concentration. The constant 1.5 allows for analysis of
natural fluctuations in the content of a given substance
in the environment and very small anthropogenic
influences.
Table 2:Class of Index of Geo-accumulation (Igeo)
I geo
Class
I geo Value Contaminated Level
0 I geo≤0 Uncontaminated
1 0<Igeo≤1 Uncontaminated or
moderately
Contaminated
2 1<Igeo≤2 Moderately
Contaminated
3 2<Igeo≤3 Moderately or Strongly
Contaminated
4 3<Igeo≤4 Strongly Contaminated

© MAY 2020 | IRE Journals | Volume 3 Issue 11 | ISSN: 2456-8880
IRE 1702307 ICONIC RESEARCH AND ENGINEERING JOURNALS 153
5. 4<Igeo≤5 Strongly or Extremely
Contaminated
6 Igeo>5 Extremely Contaminated
The enrichment factor was calculated using the
formula:
EF= (Cx/Cref)
(Bx / Bref)
where:
Cx = content of the examined element in the examined
environment,
Cref = content of the examined element in the
reference environment,
Bx = content of the reference element in the examined
environment and
Bref= content of the reference element in the reference
environment.
Enrichment Factor is categories into five classes [22]
(Table 3).
Table 3:Categories of Enrichment Factor
EF < 2 deficiency to minimal enrichment
EF 2-5 moderate enrichment
EF 5-20 significant enrichment
EF 20-40 very high enrichment
EF > 40 extremely high enrichment
The assessment of soil contamination was also carried
out using the contamination factor (Cif) and the degree
of contamination (Cd) (Tables 4 and 5). The (C if) is the
single element index; the sum of contamination factors
for all elements examined represents the Cd of the
environments and all four classes are recognized [23].
Table 3 shows the different contamination factors
class and level. The equation is shown below:
Cif=Ci
0/Cin
Where Ci0 is the mean content of metals from at least
five sampling sites and C in is the pre-industrial
concentration of the individual’s metal.
Table 4: Class of Contamination Factor (C if) [23]
CifClass Contamination factor Level
Cif< 1 Low contamination factor indicating
low contamination
1<Cif< 3 Moderate Contamination factor
3 <Cif<
6
Considerable Contamination factor
6 <Cif Very High Contamination factor
The Cd is defined as the sum of Cif species specified
by Hakanson L. (1980)
The Cd is aimed at providing a measure of the degree
of overall contamination in surface layers in a
particular sampling site. The Cd was divided into four
groups as given in Table 4.
Table 5: Class of contamination degree(Cd ) [23]
Cd Class Contamination factor Level
Cd< 8 Low degree of contamination
8 < Cd< 16 Moderate degree of contamination
16 < Cd<
32
Considerable degree of
contamination
32 > Cd< 8 Very High degree of Contamination
The ecological risk index (Eri) evaluates the toxicity of
trace elements in sediment and has been extensively
applied to soils [24].
Eri = Tr
i x Cfi
Where, Triis toxicity coefficient, and has the following
values; Cd = 30, As = 10, Co = 5, Cu = 5, Ni = 5, Pb
= 5, Cr = 2, Zn = 1. [23].
Cfiis contamination factor.
The potential ecological risk index (RI) reflects the
general status of pollution as a result of the combined
presence of the total heavy metal analyzed.
IV. RESULTS AND DISCUSSION
4.1 Concentration of Heavy metals in Ajakanga
Stream sediments
The concentrations and statistical summary of the
heavy metals concentrations are presented in Table 6.
Table 6: Heavy Metal Concentration in the Sediments
of Ajakanga Stream
Cu(p
pm)
Ni(p
pm)
Pb(p
pm)
Zn(p
pm)
Co(p
pm)
Cr(p
pm)
L1 16 16 18 63 36 39
L2 13 12 12 38 11 30
L3 17 17 20 64 29 58
L4 12 13 11 57 14 26
L5 12 10 13 83 21 39
L6 20 11 43 63 34 49
L7 18 16 23 75 36 58

© MAY 2020 | IRE Journals | Volume 3 Issue 11 | ISSN: 2456-8880
IRE 1702307 ICONIC RESEARCH AND ENGINEERING JOURNALS 154
L8 7 9 6 27 13 22
L9 16 11 19 130 20 30
L1
0 17 6 11 44 16 23
Ma
x 20 17 43 130 36 58
Mi
n 7 6 6 27 11 22
Me
an
14.5
8
12.0
0
18.7
5
66.7
5
23.0
8
37.8
3
To
tal 148 121 176 644 230 374
Cif
0.26
5
0.21
8
0.34
1
1.21
3
0.41
9
0.68
8
Eri
1.32
6
1.09
1
1.70
5
6.06
8
2.09
8
3.43
9
R.I
.
15.7
27
Cd
3.14
5
Results showed that Cu ranged from 7.00 to 20.00 ppm
with mean value of 14.58ppm (Figure 4). Zn ranged
from 27.00 to 130.00 ppm, with a mean value of
66.75ppm(Figure 5). Co ranged from 11.00 to 36.00
ppm, with a mean of 23.08ppm (Figure 6). Cr ranged
from 22.00 to 58.00 ppm with a mean value of 37.83
ppm (Figure 7).
Pb ranged from 6.00 to 43.00 ppm, with a mean value
of 18.75 ppm (Figure 8). Ni ranged from 6.00 to
16.00ppm, with a mean value of 12.00 ppm (Figure 9).
The concentration of the heavy metals in the soil is of
the order Zn>Cr>Co>Pb>Cu>Ni.
Figure 4: Concentration of copper (ppm).
Figure 5: concentration of Zn (ppm)
Figure 6: concentration of cobalt (ppm)
Figure 7: concentration of chromium (ppm)

© MAY 2020 | IRE Journals | Volume 3 Issue 11 | ISSN: 2456-8880
IRE 1702307 ICONIC RESEARCH AND ENGINEERING JOURNALS 155
Figure 8: concentration of lead (ppm)
Figure 9: concentration of nickel (ppm)
Compared to the U.S. Environmental Protection
Agency’s (EPA) Sediment Quality Guidelines
(SQGs), the concentrations of Pb in nine locations are
<40, and >40<60 in one location (Table 7). This
indicated that 90%, and 10% of the sediments is non-
polluted and moderately polluted respectively by Pb.
Cr concentration in two locations are <25 and >25<75
in eight locations, indicating that 20% and 80% of the
sediments is non-polluted and moderately polluted
respectively by Cr. Concentration of Cu in all
locations is <25, indicating that the sediments are not
polluted at all by Cu. Also Ni concentrations in all
locations is <20, indicating that the sediments are not
polluted at all by Ni. Only in one location is the
concentration of Zn < 90. In all other location Zn range
from >90<200, indicating that 10% and 90% of the
sediments is non-polluted and moderately polluted
respectively by Zn. In general, compared with the
USEPA Sediment Quality Guidelines [25] , the
sediments are non – moderately polluted by the
analyzed heavy metals
Table 7: USEPA Sediment Quality Guidelines (SQG)
Metal
(ppm)
Non
Pollut
ed
Mode
rately
Pollut
ed
Hea
vily
Poll
uted
Curren
t Study
Range(
ppm)
Curre
nt
Study
Mean
(ppm)
Pb <40
40 -
60 >60 6 - 43
18.75
0
Cr <25
25 -
75 >75 22 - 58
37.83
3
Cu <25
25 -
50 >50 7 - 20
14.58
3
Ni <20
20 -
50 >50 6 - 17
12.00
0
Zn <90
90 -
200
>20
0
27 -
130
66.75
0
Co - - - 11 - 36
23.08
3
4.2 Assessment of metal pollution in the soil
The following pollution and ecological risk indices
were employed in assessing the soil pollution status.
The index of geoaccumulation, enrichment factor,
contamination factor, contamination degree,
ecological risk index, and potential ecological risk
index.
4.2.1 Geoaccumulation Index
Geoaccumulation index allows the assessment of soil
contamination with heavy metals compared with its
content in the A or O horizons [26] referenced to a
specific geochemical background [21]. It is considered
as an accurate index in the evaluation of the degree of
contamination of environmental media [26, 27, 28, 29,
30]. The calculated index of geoaccumulation for the
heavy metals in Ajakanga stream sediment is
presented in Table 8.
Table 8: Index of Geoaccumulation for the sediments of Ajakanga stream
Igeo Cu Igeo Ni IgeoPb Igeo Zn Igeo Co Igeo Cr
L1 0.058 0.043 0.289 0.181 0.289 0.078
L2 0.047 0.032 0.193 0.109 0.088 0.060
© MAY 2020 | IRE Journals | Volume 3 Issue 11 | ISSN: 2456-8880
IRE 1702307 ICONIC RESEARCH AND ENGINEERING JOURNALS 156
L3 0.062 0.045 0.321 0.183 0.233 0.116
L4 0.044 0.035 0.177 0.163 0.112 0.052
L5 0.044 0.027 0.209 0.238 0.169 0.078
L6 0.073 0.029 0.690 0.181 0.273 0.098
L7 0.066 0.043 0.369 0.215 0.289 0.116
L8 0.026 0.024 0.096 0.077 0.104 0.044
L9 0.058 0.029 0.305 0.373 0.161 0.060
L10 0.062 0.016 0.177 0.126 0.128 0.046
Max 0.073 0.045 0.690 0.373 0.289 0.116
Min 0.026 0.016 0.096 0.077 0.088 0.044
Mean 0.054 0.032 0.283 0.185 0.185 0.075
Total 0.540 0.324 2.825 1.846 1.846 0.750
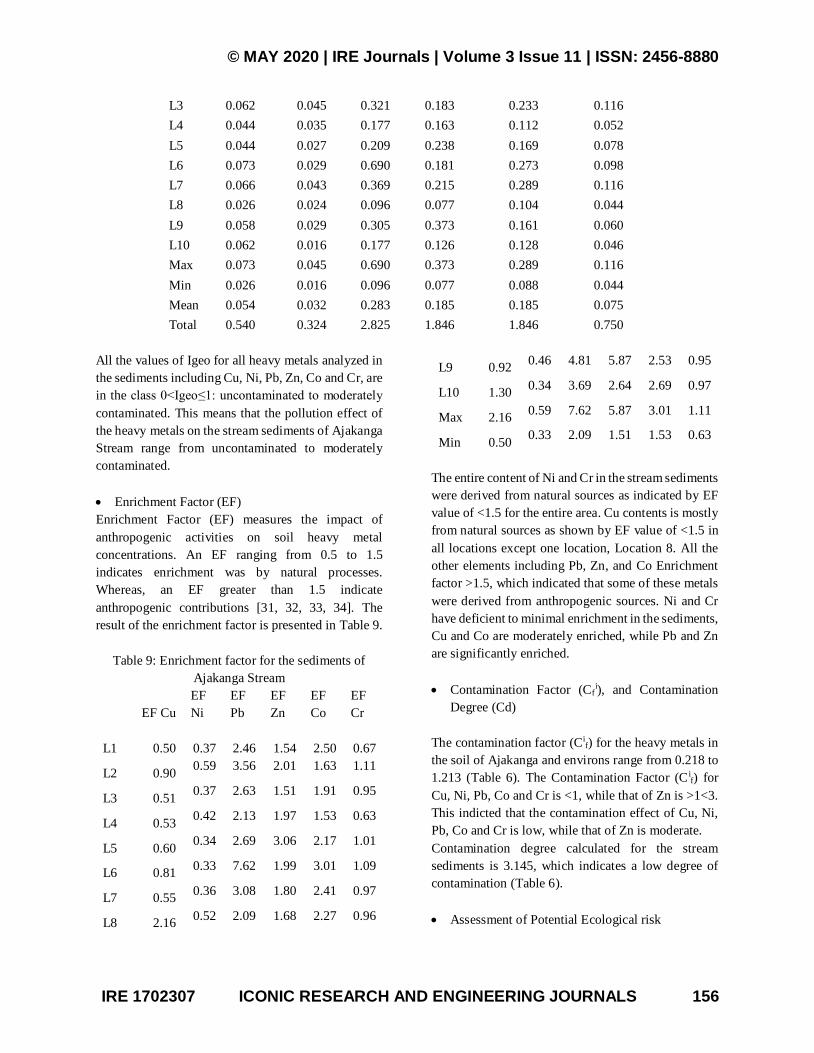
All the values of Igeo for all heavy metals analyzed in
the sediments including Cu, Ni, Pb, Zn, Co and Cr, are
in the class 0<Igeo≤1: uncontaminated to moderately
contaminated. This means that the pollution effect of
the heavy metals on the stream sediments of Ajakanga
Stream range from uncontaminated to moderately
contaminated.
Enrichment Factor (EF)
Enrichment Factor (EF) measures the impact of
anthropogenic activities on soil heavy metal
concentrations. An EF ranging from 0.5 to 1.5
indicates enrichment was by natural processes.
Whereas, an EF greater than 1.5 indicate
anthropogenic contributions [31, 32, 33, 34]. The
result of the enrichment factor is presented in Table 9.
Table 9: Enrichment factor for the sediments of
Ajakanga Stream
EF Cu
EF
Ni
EF
Pb
EF
Zn
EF
Co
EF
Cr
L1 0.50
0.37
2.46
1.54
2.50
0.67
L2 0.90 0.59 3.56 2.01 1.63 1.11
L3 0.51 0.37 2.63 1.51 1.91 0.95
L4 0.53 0.42 2.13 1.97 1.53 0.63
L5 0.60 0.34 2.69 3.06 2.17 1.01
L6 0.81 0.33 7.62 1.99 3.01 1.09
L7 0.55 0.36 3.08 1.80 2.41 0.97
L8 2.16 0.52 2.09 1.68 2.27 0.96
L9 0.92 0.46 4.81 5.87 2.53 0.95
L10 1.30 0.34 3.69 2.64 2.69 0.97
Max 2.16 0.59 7.62 5.87 3.01 1.11
Min 0.50 0.33 2.09 1.51 1.53 0.63
The entire content of Ni and Cr in the stream sediments
were derived from natural sources as indicated by EF
value of <1.5 for the entire area. Cu contents is mostly
from natural sources as shown by EF value of <1.5 in
all locations except one location, Location 8. All the
other elements including Pb, Zn, and Co Enrichment
factor >1.5, which indicated that some of these metals
were derived from anthropogenic sources. Ni and Cr
have deficient to minimal enrichment in the sediments,
Cu and Co are moderately enriched, while Pb and Zn
are significantly enriched.
Contamination Factor (Cfi), and Contamination
Degree (Cd)
The contamination factor (Cif) for the heavy metals in
the soil of Ajakanga and environs range from 0.218 to
1.213 (Table 6). The Contamination Factor (C if) for
Cu, Ni, Pb, Co and Cr is <1, while that of Zn is >1<3.
This indicted that the contamination effect of Cu, Ni,
Pb, Co and Cr is low, while that of Zn is moderate.
Contamination degree calculated for the stream
sediments is 3.145, which indicates a low degree of
contamination (Table 6).
Assessment of Potential Ecological risk

© MAY 2020 | IRE Journals | Volume 3 Issue 11 | ISSN: 2456-8880
IRE 1702307 ICONIC RESEARCH AND ENGINEERING JOURNALS 157
The ecological risk index (Eri) and the potential
ecological risk index (RI) were employed to determine
the potential risk of the concentration of the heavy
metals to the ecological system of Ajakangastream as
a whole (Table 6).
The calculated ecological risk index (Eri) showed that
all the heavy metal analyzed in the stream sediments
fall below 40 (Eri<40). This shows that the
contamination of Ajakanga stream sediments by Cu,
Ni, Pb, Zn, Co and Cr is low.
The potential ecological risk index (RI) for the area is
15.727 (Table 6), indicating that the risk of potential
contamination of Ajakanga stream sediments with the
current concentration of Cu, Ni, Pb, Zn, Co and Cr is
low.
4.3 Spatial Distribution of the Metals in the Soil of
Ajakanga and environs
The graphical representation of the spatial distribution
of the metals in the studied area is shown in figure 10
to figure 15.Cu spatial distribution map shows that
Copper has its highest concentration of 20ppm in L6,
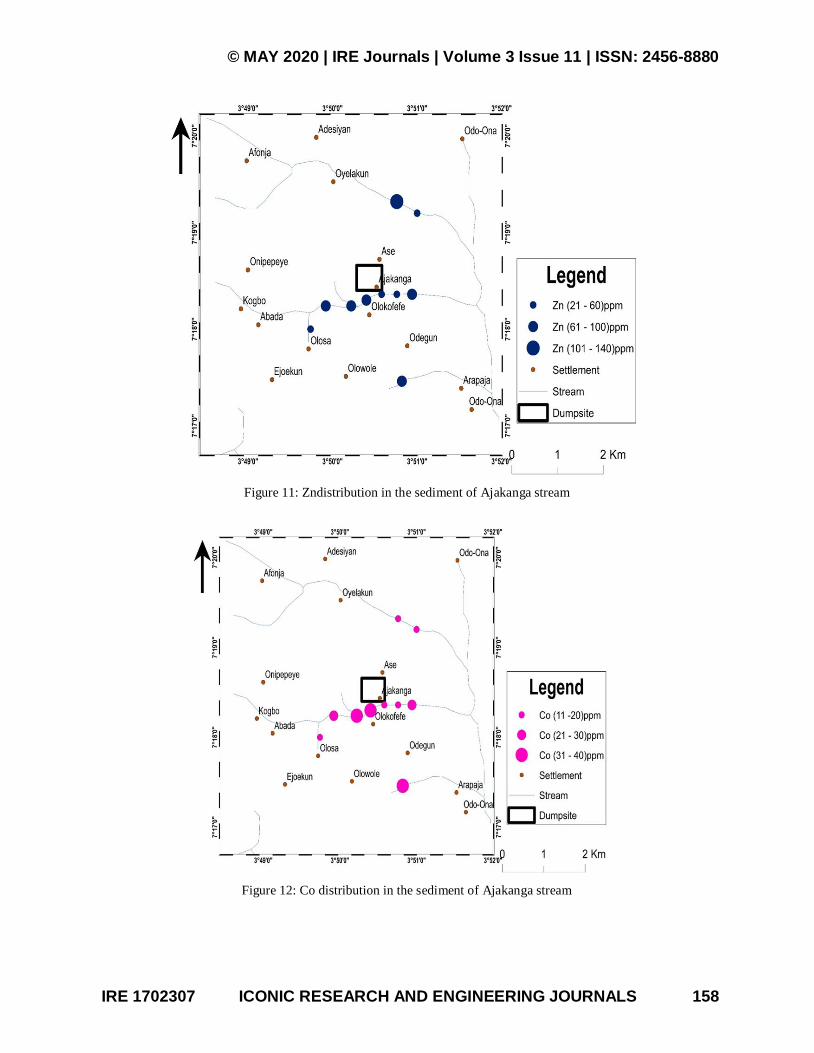
and the minimum concentration of 7ppm in L8.Zn
spatial distribution map shows that Zinc has its highest
concentration of 130ppm in L9 and the minimum
concentration 27ppm in L8. Co spatial distribution
map shows that Cobalt has its highest concentration of
36ppm in L1 and the minimum concentration of
11ppm in L2. Cr spatial distribution map shows that
Chromium has its highest concentration of 58ppm in
L3 and the minimum concentration of 22ppm in,
L8.Pb spatial distribution map shows that Lead has its
highest concentration of 43ppm in L6, and the least
concentration 6ppm in L8. Ni spatial distribution map
shows that Nickel has its highest concentration of
17ppm in L3 and the minimum concentration of 6ppm
in L10.
Figure 10: Cu distribution in the sediment of Ajakanga stream
© MAY 2020 | IRE Journals | Volume 3 Issue 11 | ISSN: 2456-8880
IRE 1702307 ICONIC RESEARCH AND ENGINEERING JOURNALS 158
Figure 11: Zndistribution in the sediment of Ajakanga stream
Figure 12: Co distribution in the sediment of Ajakanga stream

© MAY 2020 | IRE Journals | Volume 3 Issue 11 | ISSN: 2456-8880
IRE 1702307 ICONIC RESEARCH AND ENGINEERING JOURNALS 159
Figure 13: Cr distribution in the sediment of Ajakanga stream
Figure 14: Pb distribution in the sediments of Ajakanga stream

© MAY 2020 | IRE Journals | Volume 3 Issue 11 | ISSN: 2456-8880
IRE 1702307 ICONIC RESEARCH AND ENGINEERING JOURNALS 160
Figure 15: Ni distribution in the sediment of Ajakanga stream
CONCLUSION
Analysis of the geochemical results of the Ajakanga
stream sediments samples showed that the average
concentration of the heavy metals varied significantly
and decrease in the order ofZn>Cr>Co>Pb>Cu>Ni.
In general, compared with the United States
Environmental Protection Agency’s (EPA) Sediment
Quality Guidelines (SQGs), the sediments are non to
moderately polluted by the analyzed heavy metals.The
result of the geoaccumulation index showed that the
pollution effect of the heavy metals on the stream
sediments of Ajakanga stream range from
uncontaminated to moderately contaminated, while
the enrichment factor showed that the entire content of
Ni and Cr in the stream sediments were derived from
natural sources. Cu contents are mainly from natural
sources a very low percentage are from anthropogenic
source. The enrichment factor for all the other metals
which includePb, Zn, and Co indicated a major
contribution from anthropogenic sources. Moreover,
the enrichment factor showed that Ni and Cr have
deficient to minimal enrichment in the sediments, Cu
and Co are moderately enriched, while Pb and Zn are
significantly enriched.
The calculated ecological risk index (Eri) showed that
all the heavy metal analyzed in the stream sediments
fall below 40 (Eri<40). This shows that the
contamination of Ajakanga stream sediments by Cu,
Ni, Pb, Zn, Co and Cr is low, which is in agreement
with the potential ecological risk index (RI) for the
area which indicated that the risk of potential
contamination of Ajakanga stream sediments with the
current concentration of Cd, Cu, Ni, Pb, Zn, As, Co
and Cr is low.
REFERENCES
[1] Bettinentti,R. C. Giarei and A. Provini, “A
Chemical Analysis and Sediment Toxicity
Bioassays to Assess the Contamination of River
Lambro (Northern Italy),” Archives of
Environmental Contamination and Toxicology,
Vol. 45, No. 1, 2003, pp. 72-78.
[2] Li, X., Shen, Z., Wai, O.W., Li, Y.S., 2001.
Chemical forms of Pb, Zn and Cu in the sediment
profiles of the Pearl River estuary. Mar. Pollut.
Bull. 42, 215–223.
[3] Xia, P., Meng, X., Yin, P., Cao, Z., Wang, X.,
2011. Eighty-year sedimentary record of heavy
metal inputs in the intertidal sediments from the

© MAY 2020 | IRE Journals | Volume 3 Issue 11 | ISSN: 2456-8880
IRE 1702307 ICONIC RESEARCH AND ENGINEERING JOURNALS 161
Nanliu River estuary, Beibu gulf of south China
Sea. Environ. Pollut. 159, 92–99.
[4] Wang, Y., Hu, J., Xiong, K., Huang, X., Duan, S.,
2012. Distribution of heavy metals in core
sediments from Baihua Lake. Procedia Environ.
Sci. 16, 51–58.
[5] Mashiatullah, A., Chaudhary, M., Ahmad, N.,
Ahmad, N., Javed, T., Ghaffar, A., 2015.
Geochemical assessment of metal pollution and
ecotoxicology in sediment cores along Karachi
coast, Pakitstan. Environ. Monit. Assess. 187.
[6] Jahan S, and Strezov V, 2018. Comparison of
pollution indices for the assessment of heavy
metals in the sediments of seaports of NSW,
Australia. Marine Pollution Bulletin 128 (2018)
295–306.
[7] Raju,K. V. R. Somashekar and K. Prakash, “Heavy
Metal Status of Sediment in River Cauvery,
Karnataka,” Environmental Monitoring and
Assessment, Vol. 184, No. 1, 2012, pp. 361-373.
doi:10.1007/s10661-011-1973-2
[8] Chakravarty, M. and Patgiri, A. “Metal Pollution
Assessment in Sediments of the Dikrong River, N.
E. India,” Journal of Human Ecology, Vol. 27, No.
1, 2009, pp. 63-67.
[9] Benson, N.U., Asuquo, F.E., Williams, A.B.,
Essien, J.P., Ekong, C.I., Akpabio, O., Olajire,
A.A., 2016a. Source evaluation and trace metal
contamination in benthic sediments from
equatorial ecosystems using multivariate statistical
techniques. PLoS ONE, 11(6), 1-19.
[10] Benson, N.U., Anake, W.U., Essien, J.P. Enyong,
P.A., Olajire, A.A., 2016b. Distribution and risk
assessment of trace metals in Leptodiusexarata,
surface water and sediments from Douglas Creek,
Qua Iboe estuary. J. Taibah University for Science,
11 (3), 434 – 449.
[11] Lin, Y.C., Chang-Chien, G.P., Chiang, P.C., Chen,
W.H., Lin, Y.C., 2013. Multivariate analysis of
heavy metal contaminations in seawater and
sediments from a heavily industrialized harbor in
Southern Taiwan. Mar. Pollut. Bull., 76(1-2), 266-
275.
[12] Liu, J., Wu, H., Feng, J., Li, Z., Lin, G., 2014.
Heavy metal contamination and ecological risk
assessments in sediments and zoobenthos of
selected mangrove ecosystems, South China.
Catena, 119, 136-142.
[13] Maanan, M., Saddik, M., Maanan, M., Chaibi, M.,
Assobhei, O., Zourarah, B., 205. Environmental
and ecological risk assessment of heavy metals in
sediments of nador lagoon, Morocco. Ecol. Indic.,
48, 616-626.
[14] Saleem, M., Iqbal. J., Shah. M.H., 2015
Geochemical speciation, anthropogenic
contamination, risk assessment and source
identification of selected metals in freshwater
sediments – A case study from Mangla lake,
Pakistan. Environ. Nanotechnol. Monit. Manage.,
4, 27-36.
[15] Tornero, V., Anas, A.M., Blasco, J., 2014. Trace
element contamination in the Guadalquivir River
Estuary Ten years after the Aznacollar mine spill.
Mar. Pollut. Bull, 86(1-2), 349-360.
[16] Diaz-de Alba, M., Galindo-Riano, M.D.,
Casanueva-Marenco, M.J., Garcia-Vargas, M.,
Kosore, C.M., 2011. Assessment of the metal
pollution, potential toxicity and speciation of
sediment from Algeciras Bay (South of Spain)
using chemometric tools. J. Hazard Mater., 190,
177-187.
[17] Pejman, A., Bidhendi, N.G., Ardestani, M., Saeedi,
M., Baghvand, A., 2015. A new index for assessing
heavy metals contamination in sediments: A case
study, Ecol. Indic., 58, 365-373.
[18] Zhang, W., Lin. X., Cheng, H., Zeng, E.Y., 2012.
Heavy metal pollution insediments of typical
mariculture zone in South China. Mar. Pollut. Bull.
64, 712-720.
[19] Nigerian Geological Survey Agency, 1980.
[20] Wright, J.B. (1985). Geology and mineral
resources of West Africa., London: George Allen
& Unwin.
[21] Muller G. 1969: Index of geoaccumulation in
sediments of the Rhine River Geol. J. 2(3): 108-
118.
[22] Sutherland RA (2000) Bed sediment-associated
trace metals in an urban stream, Oahu, Hawaii.
Environmental Geology 39: 611-637.
[23] Hakanson, L. 1980, “An ecological risk index for
the aquatic pollution control, a

© MAY 2020 | IRE Journals | Volume 3 Issue 11 | ISSN: 2456-8880
IRE 1702307 ICONIC RESEARCH AND ENGINEERING JOURNALS 162
sedimentologicalapproach”. Water Res. 14, 975 –
165.
[24] Liang, J., Liu, J.Y., Yuan, X.Z., Zeng, G.M., Lai,
X., Li, X.D., Wu, H.P., Yuan, Y.J., Li, F. 2015.
Spatial and temporal variation of heavy metal risk
and source in sediments of Dongting lake wetland,
mid – south China. J. Environ. Sci. Health, 50, 100
– 108.
[25] U.S. Environmental Protection Agency (USEPA)
Guideline for the Pollutional Classification of
Great Lakes Harbor Sediments, Region V, Chicago
Illinois (1977).
[26] Kowalska, J., Mazurek, R., Gasiorek, M. and
Zaleski, T. 2018. Pollution indices as useful tools
for the comprehensive evaluation of the degree of
soil contamination – A review. Environ Geochem
Health, 40: 2395 – 2420.
[27] Begum, K., Mohiuddin, K.M., Zakir, H.M.,
Moshfigur Rahman, M., and NazmulHasan, M.
2014. Heavy metal pollution and major nutrient
elements assessment in the soils of Bogra city in
Bangladesh. Canadian Chemical Transactions, 3,
316 – 326.
[28] Karim, Z., Qureshi, B.A. and Mumtaz, M. 2015.
Geochemical baseline determination and pollution
assessment of heavy metals in urban soils of
Karachi, Pakistan. Ecological Indicators, 48, 358 –
364.
[29] Li, M.S., and Yang, S.X. 2008. Heavy metal
contamination in soils and phytoaccumulation in
sediments and macrobenthos in coastal wetlands
induced by freshwater releases: A case study in the
Yellow River Delta, China. Marine Pollution
Bulletin, 103, 227 – 239.
[30] Sayadi, M.H., Shabani, M. and Ahmadpour, N.
2015. Pollution index and ecological risk of heavy
metals in the surface soils of Amir – Ad Area in
Birjand City, Iran. Health Scope, 4, 121 – 137.
[31] Elias, P., and Gbadegesin, A. 2011. Spatial
relationships in urban land use, soils and heavy
metal concentrations in Lagos Mainland area.
Journal of Applied Sciences and Environmental
Management, 15, 391 – 399.
[32] Zhang, J., and Liu, C.L. 2002. Riverine
composition and estuarine geochemistry of
particulate metals in China: Weathering features,
anthropogenic impact and chemical fluxes.
Estuarine Coastal Shelf Science, 54, 1051 – 1070.
[33] Dung, T.T.T., Cappuyns, V., Swennen, R., and
Phung, N.K. 2013. From geochemical background
determination to pollution assessment of heavy
metals in sediments and soils. Reviews in
environmental Science and Biotechnology, 12, 335
– 353.
[34] Kowalska, J., Mazurek, R., Gsiorek, M., Setlak,
M., Zaleski, T. and Waroszewski, J. 2016. Soil
pollution indices conditioned by medieval
metallurgical activity: A case study from Krakow
(Poland). Environmental Pollution, 218, 1023 -
1036.


![Screening Assessment Petroleum Sector Stream …Screening Assessment Petroleum Sector Stream Approach Heavy Fuel Oils [Site-Restricted] Chemical Abstracts Service Registry Numbers](https://static.fdocuments.us/doc/165x107/5f06128e7e708231d41626d7/screening-assessment-petroleum-sector-stream-screening-assessment-petroleum-sector.jpg)