Geocarto Paper (4)
16
Hypsometric analysis of Kali River Basin, Karnataka, India, using geographic information system Vipin Joseph Markose and K.S. Jayappa* Department of Marine Geology, Mangalore University, Mangalagangothri, Mangalore 574199, India (Received 5 September 2010; final version received 25 July 2011) Hypsometric analysis is useful for understanding the geomorphic stages of a river basin. Hypsometric parameters have been evaluated and curves are prepared for all the 20 sub-basins of Kali River. Thirteen sub-basins are found to be under younger geomorphic stages with high hypsometric integral (Ea) values and subjected to recent tectonic activities. The remaining seven sub-basins are approaching mature stage and subjected to more erosion and less impacted by recent tectonic activities. Six sub-basins with lower hypsometric head values (50.56) indicate least effect of diffusive processes and another six sub-basins with medium hypsometric head values (0.60–0.68) depict moderate diffusive erosion. The remaining eight sub-basins with higher hypsometric head values (40.75) indicate highest diffusive processes at their upper reaches. Lower (50.28) and higher (40.44) hypsometric toe values indicate minimum and maximum mass accumulation respectively at the sub-catchment mouth. Keywords: hypsometric analysis; Kali River; geomorphic stages; geographical information system 1. Introduction Hypsometry means relative proportion of an area at different elevations within a region and hypsometric curve depicts distribution of area with respect to altitude (Strahler 1952). Hypsometric analysis has been used to understand various forcing factors on basin topography. Weissel et al. (1994) suggest that hypsometry may reflect the interaction between tectonics and erosion and could provide a valuable geomorphic index in order to constrain the relative importance of these processes. Hypsometry may be expressed quantitatively as an integral called the ‘hypsometric integral’ (Ea). Ea represents the area under the hypsometric curve. Strahler (1952) interpreted shapes of hypsometric curves by analyzing numerous drainage basins and classified the basins as youth (convex upward curves), mature (S-shaped curves which are concave upwards at high elevations and convex downwards at low elevations) and peneplain or distorted (concave upward curves). Hypsometric integral value can be used as an estimator of erosion status of watershed leading to prioritization of watershed for soil and water conservation measures (Singh et al. 2008). Singh (2008) made an attempt to study the statistical relation between *Corresponding author. Email: [email protected] Geocarto International Vol. 26, No. 7, November 2011, 553–568 ISSN 1010-6049 print/ISSN 1752-0762 online Ó 2011 Taylor & Francis http://dx.doi.org/10.1080/10106049.2011.608438 http://www.tandfonline.com Downloaded by [Mangalore University Library] at 01:52 17 November 2011
description
geocarto
Transcript of Geocarto Paper (4)
Hypsometric analysis of Kali River Basin, Karnataka, India,
using geographic information system
Vipin Joseph Markose and K.S. Jayappa*
Department of Marine Geology, Mangalore University, Mangalagangothri,Mangalore 574199, India
(Received 5 September 2010; final version received 25 July 2011)
Hypsometric analysis is useful for understanding the geomorphic stages of a riverbasin. Hypsometric parameters have been evaluated and curves are preparedfor all the 20 sub-basins of Kali River. Thirteen sub-basins are found to be underyounger geomorphic stages with high hypsometric integral (Ea) values andsubjected to recent tectonic activities. The remaining seven sub-basins areapproaching mature stage and subjected to more erosion and less impacted byrecent tectonic activities. Six sub-basins with lower hypsometric head values(50.56) indicate least effect of diffusive processes and another six sub-basins withmedium hypsometric head values (0.60–0.68) depict moderate diffusive erosion.The remaining eight sub-basins with higher hypsometric head values (40.75)indicate highest diffusive processes at their upper reaches. Lower (50.28) andhigher (40.44) hypsometric toe values indicate minimum and maximum massaccumulation respectively at the sub-catchment mouth.
Keywords: hypsometric analysis; Kali River; geomorphic stages; geographicalinformation system
1. Introduction
Hypsometry means relative proportion of an area at different elevations within aregion and hypsometric curve depicts distribution of area with respect to altitude(Strahler 1952). Hypsometric analysis has been used to understand various forcingfactors on basin topography. Weissel et al. (1994) suggest that hypsometry mayreflect the interaction between tectonics and erosion and could provide a valuablegeomorphic index in order to constrain the relative importance of these processes.Hypsometry may be expressed quantitatively as an integral called the ‘hypsometricintegral’ (Ea). Ea represents the area under the hypsometric curve. Strahler (1952)interpreted shapes of hypsometric curves by analyzing numerous drainage basinsand classified the basins as youth (convex upward curves), mature (S-shaped curveswhich are concave upwards at high elevations and convex downwards at lowelevations) and peneplain or distorted (concave upward curves). Hypsometricintegral value can be used as an estimator of erosion status of watershed leading toprioritization of watershed for soil and water conservation measures (Singh et al.2008). Singh (2008) made an attempt to study the statistical relation between
*Corresponding author. Email: [email protected]
Geocarto International
Vol. 26, No. 7, November 2011, 553–568
ISSN 1010-6049 print/ISSN 1752-0762 online
� 2011 Taylor & Francis
http://dx.doi.org/10.1080/10106049.2011.608438
http://www.tandfonline.com
Dow
nloa
ded
by [
Man
galo
re U
nive
rsity
Lib
rary
] at
01:
52 1
7 N
ovem
ber
2011

hypsometric integral and area of watersheds. Several studies have shown thathypsometric integrals correspond to lithological resistance and/or tectonic upliftrates (Lifton and Chase 1992, Hurtrez and Lucazeau 1999, Chen et al. 2003).Hypsometric integrals are also known to be sensitive to variables related tomorphometry of the basin, such as basin area and relief (Hurtrez et al. 1999, Chenet al. 2003), basin planform, and the grid or basin perimeter based system that isapplied (Lifton and Chase 1992, Willgoose and Hancock 1998). Bishop et al. (2002)found that the hypsometric integral helps in explaining the erosion taken place in thewatershed during the past, due to hydrologic processes and land degradation. Liftonand Chase (1992) tested the influence of varying uplift rates on hypsometry, from anumerical model of landscape development, showing that the hypsometric integralwas positively correlated to uplift rate. Hurtrez et al. (1999) investigated thesensitivity of hypsometry to digital elevation models (DEMs) of different resolutionsand assessed the influence of varying drainage area on hypsometry in Siwalik Hills ofcentral Nepal. The shape of the hypsometric curves and the Ea values providevaluable information not only on erosional stage of the basin, but also on tectonic,climatic and lithological factors of the basin (Moglen and Bras 1995, Willgoose andHancock 1998, Huang and Niemann 2006). All the above views reveal thathypsometric analysis provides valuable information on landform evolution andtectonics. The scope of the study is limited to the evaluation of hypsometricparameters which provides valuable information on the type of erosive processesoperating in the Western Ghat regions. The geographic information system (GIS)approach was used to obtain hypsometric information and to calculate theassociated parameters.
2. Study area
The Kali River – one of the west flowing rivers of Karnataka – which originates inthe Western Ghat at an altitude of 900 m is a seventh order basin with a length of184 km. It covers a total drainage area of 4837 km2, extending from 1484301.800 to15833044.900 N latitudes and 7480507.6300 to 74857039.0500 E longitudes in UttaraKannada district of northern Karnataka, India forms the study area (Figure 1). Theland mass of the river basin is situated between 0 and 1040 m above msl (Figure 2).The river flows initially towards east, then turns westward and joins the Arabian Seanear Karwar. In its course, the river loses about 350 (420–70) m elevation throughwaterfalls between 90 and 105 km from the origin (Figure 3). The climate of thestudy area is humid tropical along the coastal zone where the mean annualprecipitation is around 3900 mm. The Kali River is composed of well developeddrainage network ranging from first to seventh order streams (Figure 4). The majorsub-basins of Kali River are: Kannadgal, Daogi, Nagihari halla and Maradi (fourthorder streams); Barchi nadi, Bennemone, Birkol halla, Bargi halla, Karkia halla,Vadi halla, Bare halla, Shivapura halla, Kaiga, Kaneri and Nagi nadi (fifth orderstreams); Thatihalla, Sarkalihalla, Naiti holle and Vaki halla (sixth order streams);and Pandheri nadi is a seventh order stream.
3. Geology and geomorphic setting
The Kali River drainage basin is composed of various lithological units of Archeanage of Dharwar Super-group of rocks. The basin forms the western Dharwar Craton
554 V.J. Markose and K.S. Jayappa
Dow
nloa
ded
by [
Man
galo
re U
nive
rsity
Lib
rary
] at
01:
52 1
7 N
ovem
ber
2011

of south Indian Shield and exhibits NNW–SSE trending structures. Greywacke inthe upstream and granodioritic to tonalitic gneisses in the downstream segment ofthe catchment are traversed by number of dykes and overlain by laterite andalluvium (Figure 5(A)). The intensive igneous activity by way of dyke intrusions,presence of ptygmatic, criss-cross pegmatite intrusions and highly folded graniticgneisses are the evidences of high shearing of the area. The dykes are oriented inNNW–SSE, NW–SE, NNE–SSW and NEE–SWW directions (Figure 5(B)). Theschistosity is well developed in NE–SW direction within ferruginous quartzites. Therocks have been folded into a series of isoclinal antiforms and synforms. The riverflows down to Ghat escarpment near Karwar via two water gaps and cut across twosuccessive parallel Banded Ferrugenues Quartizite ridges that form N–S trendingbuttonhole structure. The main river course and its tributaries are controlled by
Figure 1. Location map of Kali River basin.
Geocarto International 555
Dow
nloa
ded
by [
Man
galo
re U
nive
rsity
Lib
rary
] at
01:
52 1
7 N
ovem
ber
2011

lineaments at different locations. The lineaments are oriented in NW–SE, NNE–SSW and NEE–SWW directions (Figure 5(C)). It is reported that the magmaticbodies of the Ghats canyon area near Karwar are partially metamorphosed layeredintrusions in which the foliation exhibits a steep easterly dip (Vasudev andRanganathan 1994). In Dandeli area a few km inland from the escarpment, the
Figure 2. Elevation distribution map of Kali River.
Figure 3. Longitudinal profile of Kali River.
556 V.J. Markose and K.S. Jayappa
Dow
nloa
ded
by [
Man
galo
re U
nive
rsity
Lib
rary
] at
01:
52 1
7 N
ovem
ber
2011

phyllites dip consistently eastward at an angle of 528 and form hogback ridges(Durg 1969).
The major part of the Kali River basin (except a narrow coastal strip and plaintableland areas on eastern part) is found in hilly regions of the Western Ghat.Considering the great height of the Ghat scarp, Valdiya (2001) opines that the mega-feature cannot be just ascribed to isostatic uplift, but to neotectonic resurgence.
4. Materials and methods
Topographic maps (1:50,000 scale) of the study area published by the Survey ofIndia were georeferenced with Universal Transverse Mercator projection (WGS1984, Zone 43 N) using ArcGIS 9.3 software. The drainage lines were digitized andstream ordering was done in accordance with Strahler’s (1957) method. The entirearea has been divided into 20 sub-basins with fourth to seventh orders and theirboundaries were digitized using ArcGIS 9.3 software. The contours were digitized inGIS environment and elevation values as well as area enclosed between the contourand each sub-basin boundaries were calculated. The feature classes containing thesevalues were used to plot the hypsometric curve. Many geomorphologists haveclassified hypsometric curve on the basis of shape geometry. Using the hypotheticalhypsometric curve of Sinha Roy (2002), various parameters such as hypsometricintegral (Ea), maximum concavity (Eh), coordinates of slope inflection point (I)given by a* and h* and normalized height of hypsometric curve (h) were calculated(Figure 6). Similarly three types – youthful, mature and old stage – of landformshave been classified by Strahler (1952, 1964) based on hypsometric curves and
Figure 4. Drainage map of Kali River basin.
Geocarto International 557
Dow
nloa
ded
by [
Man
galo
re U
nive
rsity
Lib
rary
] at
01:
52 1
7 N
ovem
ber
2011

hypsometric integral. Hypsometric curves characterized by downward concave curvewith hypsometric integral (Ea) values4 0.60 indicate youthful condition orinequilibrium phase, ‘S’ shape curves without any evident of concavity havingintermediate Ea values between 0.35 and 0.60 indicate mature or equilibrium stage,and the curves with upward concavity and Ea values5 0.35 indicate old ormonadnock stage (Figure 7). The downward concave part of right hand side of thehypsometric curve is called toe, upward concave part of left hand side of the curve ishead and upward concave segment in the centre of the curve between toe and head iscalled body (Willgoose and Hancock 1998, Figure 7).
Figure 5. Geology map of Kali River basin (A); general trend of dykes (B) andlineaments (C).
558 V.J. Markose and K.S. Jayappa
Dow
nloa
ded
by [
Man
galo
re U
nive
rsity
Lib
rary
] at
01:
52 1
7 N
ovem
ber
2011
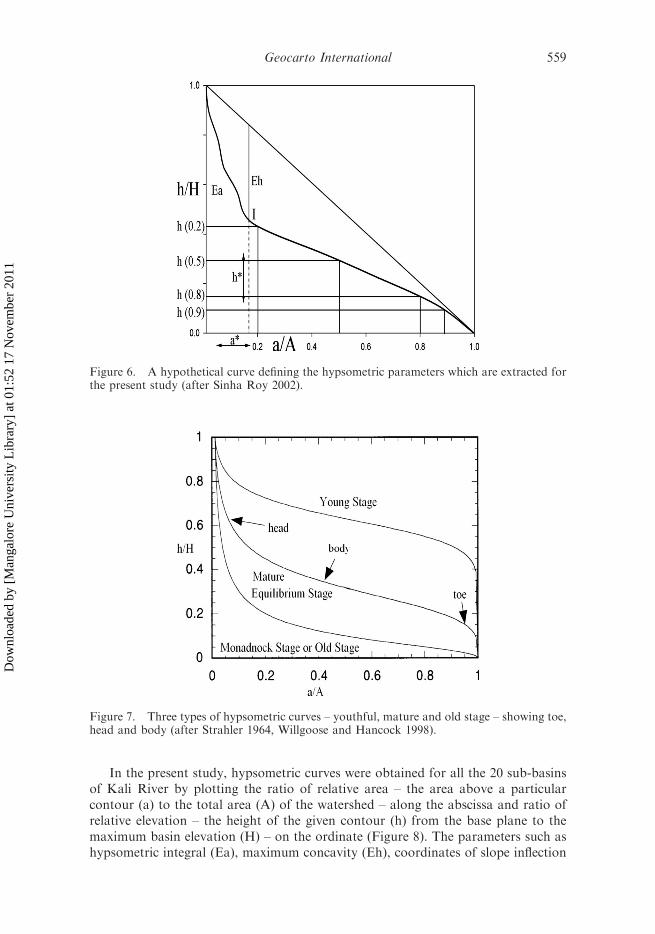
In the present study, hypsometric curves were obtained for all the 20 sub-basinsof Kali River by plotting the ratio of relative area – the area above a particularcontour (a) to the total area (A) of the watershed – along the abscissa and ratio ofrelative elevation – the height of the given contour (h) from the base plane to themaximum basin elevation (H) – on the ordinate (Figure 8). The parameters such ashypsometric integral (Ea), maximum concavity (Eh), coordinates of slope inflection
Figure 6. A hypothetical curve defining the hypsometric parameters which are extracted forthe present study (after Sinha Roy 2002).
Figure 7. Three types of hypsometric curves – youthful, mature and old stage – showing toe,head and body (after Strahler 1964, Willgoose and Hancock 1998).
Geocarto International 559
Dow
nloa
ded
by [
Man
galo
re U
nive
rsity
Lib
rary
] at
01:
52 1
7 N
ovem
ber
2011
point (I) given by a* and h*, normalized height of hypsometric curve (h) at 0.2, 0.5,0.8 and 0.9 (20%, 50%, 80% and 90%) which provide the elevations relative tomaximum height that cover the specific proportion of the catchment area werecalculated (Table 1).
5. Results and discussions
Results of the study are discussed under the sub-headings – hypsometric curve shape,hypsometric head and toe and hypsometric integral and slope inflection point.
5.1. Hypsometric curve shape
For all the 20 sub-basins of Kali River, hypsometric parameters are calculated andhypsometric curves have been prepared (Table 1, Figure 9). Hypsometric curves aredistinguished into three groups based on their shape. The first group is characterizedby concave upward curves with an average Ea value of 0.32 representing mature tolate mature stage of landforms. The second group of curves is characterized byconcave–convex shape with an average Ea value of 0.51 representing fluvial andslope wash processes of landforms. The third group of curves is characterized byconcave downward and convexity in the toe part with high Ea values (average 0.63)represents youthful stage of landforms.
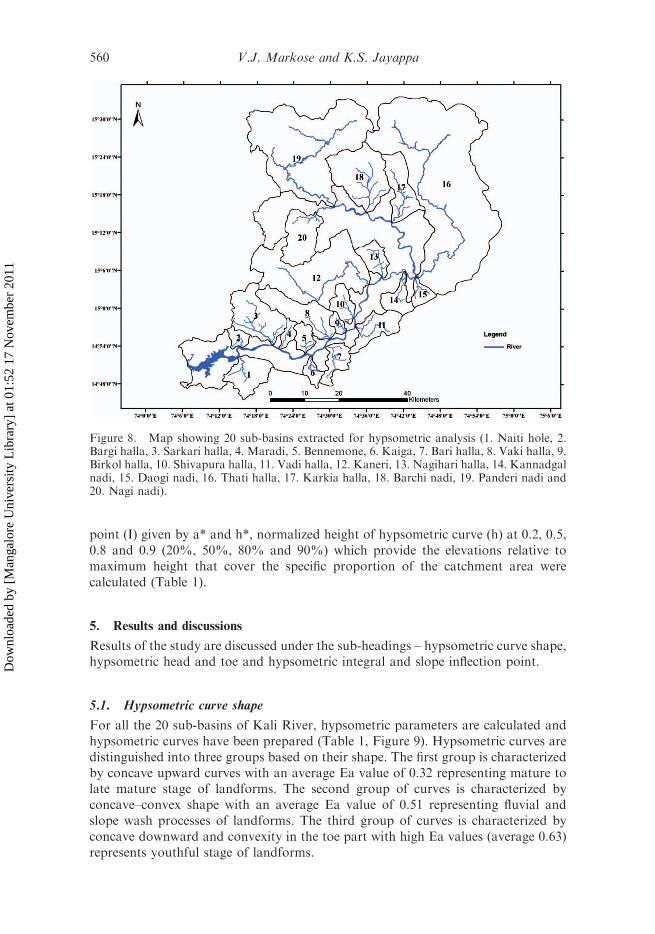
Figure 8. Map showing 20 sub-basins extracted for hypsometric analysis (1. Naiti hole, 2.Bargi halla, 3. Sarkari halla, 4. Maradi, 5. Bennemone, 6. Kaiga, 7. Bari halla, 8. Vaki halla, 9.Birkol halla, 10. Shivapura halla, 11. Vadi halla, 12. Kaneri, 13. Nagihari halla, 14. Kannadgalnadi, 15. Daogi nadi, 16. Thati halla, 17. Karkia halla, 18. Barchi nadi, 19. Panderi nadi and20. Nagi nadi).
560 V.J. Markose and K.S. Jayappa
Dow
nloa
ded
by [
Man
galo
re U
nive
rsity
Lib
rary
] at
01:
52 1
7 N
ovem
ber
2011

Hypsometric curves of Naiti hole, Bargi halla, Sarkari halla, Karkia halla, Barchinadi, Panderi nadi and Nagi nadi sub-basins (Nos. 1–3 and 17–20) belong to firstgroup. Of these, Karkia halla, Panderi nadi and Nagi nadi show downwardconcavity in the toe side. All these seven sub-basins show high relative relief whichindicates high internal dissection and steep slope. Karkia halla, Barchi nadi, Panderinadi and Nagi nadi are located in the upper part and the remaining three are locatedin the lower part of the Kali River basin (Figure 8). Shape of this type of curvesindicates that the fluvial process is dominated in the catchment which is evidencedby fluvial deposits and incision of bed rock (Figure 10(A) and (B)). Chattopadhyayet al. (2006) suggest that concave hypsometric curve is an indicator of an areapredominated by erosion and the eroded materials are accumulated in thedownstream. Hypsometric curves of Maradi, Bennemone, Kaiga, Bari halla, Vakihalla, Birkol halla and Shivapura halla (Nos. 4–10) belong to second group. Thistype of curve indicates that upper part of the sub-basins is favourable for dominanceof slope wash, may be due to the lithological differences (Ciccacci et al. 1992).Hypsometric curves of Vadi halla, Kaneri, Nagihari halla, Kannadgal nadi, Daoginadi and Thati halla (Nos. 11–16) belong to third group. These sub-basins (exceptThati halla) are found to be located in the scrap regions of Western Ghat (Table 1;Figures 8 and 9).
Table 1. Hypsometric parameters – hypsometric integral (Ea), normalized height ofhypsometric curve (h) at 0.2, 0.5, 0.8 and 0.9, maximum concavity (Eh) and coordinates ofslope inflection point (I) given by a* and h* – of all the 20 sub-basins of Kali River.
S.No. Name
Area(sq. km) Ea
Height of hypsometriccurve (h)
Eh
Coordinatesof (I)
at 0.2 at 0.5 at 0.8 at 0.9 a* h*
1 Naiti hole 105.90 0.30 0.56 0.29 0.10 0.06 0.22 0.23 0.722 Bargi halla 26.77 0.30 0.55 0.19 0.04 0.02 0.29 0.41 0.233 Sarkari
halla172.65 0.39 0.60 0.41 0.13 0.08 0.21 0.09 0.72
4 Maradi 24.35 0.47 0.68 0.60 0.15 0.06 70.20 0.1 0.925 Bennemone 38.86 0.51 0.80 0.56 0.17 0.06 70.12 0.42 0.706 Kaiga 27.47 0.50 0.79 0.62 0.08 0.0 70.13 0.61 0.527 Bari halla 61.26 0.56 0.67 0.58 0.52 0.18 70.34 0.89 0.508 Vaki halla 147.20 0.53 0.95 0.56 0.02 0.0 70.31 0.42 0.899 Birkol halla 19.37 0.54 0.82 0.54 0.28 0.12 70.12 0.5 0.6210 Shivapura
halla54.77 0.53 0.78 0.57 0.24 0.14 70.09 0.60 0.50
11 Vadi halla 96.62 0.64 0.80 0.64 0.54 0.40 70.40 0.9 0.112 Kaneri 426.66 0.56 0.65 0.55 0.45 0.41 70.32 0.98 0.4013 Nagihari
halla60.65 0.70 0.82 0.75 0.63 0.42 70.42 0.80 0.64
14 Kannadgalnadi
57.63 0.60 0.68 0.61 0.54 0.50 70.40 0.1 0.50
15 Daogi nadi 34.03 0.63 0.83 0.67 0.44 0.33 70.28 0.5 0.2816 Thati halla 1205.95 0.48 0.63 0.46 0.33 0.26 70.19 0.90 0.117 Karkia halla 126.65 0.36 0.52 0.32 0.21 0.16 0.36 0.08 0.9618 Barchi nadi 232.61 0.30 0.45 0.31 0.10 0.05 0.32 0.18 0.519 Panderi nadi 663.4 0.32 0.40 0.33 0.21 0.16 0.5 0.09 0.4220 Nagi nadi 137.33 0.31 0.45 0.26 0.15 0.07 0.37 0.21 0.41
Geocarto International 561
Dow
nloa
ded
by [
Man
galo
re U
nive
rsity
Lib
rary
] at
01:
52 1
7 N
ovem
ber
2011

5.2. Hypsometric head and toe
The values of hypsometric head and toe have significant importance of landscapeevolution. It is observed that higher the hypsometric head i.e. h (0.2), greater isthe influence of diffusive processes at the upper reaches of the sub-catchment. On theother hand, higher the hypsometric toe i.e. h (0.8), greater is the mass accumulation
Figure 9. Hypsometric curves of twenty sub-basins. Concave upward curves (Nos. 1–3 and17–20) belong to first group, downward concave curves (Nos. 4–10) belong to second groupand concave downward curves with convexity in the toe part (Nos. 11–16) belong to thirdgroup.
562 V.J. Markose and K.S. Jayappa
Dow
nloa
ded
by [
Man
galo
re U
nive
rsity
Lib
rary
] at
01:
52 1
7 N
ovem
ber
2011

at the sub-catchment mouth, derived mainly through fluvial transport (SinhaRoy 2002). Based on hypsometric head (h at 0.2), it has been observed that the sub-basins – Naiti hole, Bargi halla, Karkia halla, Barchi nadi, Panderi nadi and Naginadi – belonging to first group with lower values of hypsometric head (50.56)indicate least diffuse processes at the upper reaches of these sub-basins, whereas thesub-basins – Bennemone, Kaiga, Vaki halla, Birkol halla and Shivapura halla – ofsecond group, and Nagihari halla, Vadi halla and Daogi nadi sub-basins of thirdgroup with higher hypsometric head (40.75) indicate predominant diffusiveprocesses at the upper reaches of these sub-basins. The remaining six sub-basins –Sarkari halla (first group), Maradi, Bari halla (second group), Kaneri, Kannadgalnadi and Thati halla (third group) – with moderate values (0.60–0.68) of hypsometrichead indicate moderate diffusive erosion at the upper reaches.
Considering the toe values, those belonging to second group except Bari halla,show lower values (50.28) indicating minimum mass accumulation at the sub-catchment mouth. All the sub-basins belonging to third group (except Thati halla)show higher values (40.44), indicating greater mass accumulation at the sub-catchment mouth. Shape of toe reflects the form of lateral contribution and thedegree of branching within the catchment (Willgoose and Hancock 1998). Increasedbranching at toe region leads to development and enlargement in size of toecatchment.
Figure 10. (A) Fluvial deposits indicating dominance of fluvial process; (B) Bedrock incisionin the Kaneri river bed; (C) Folds in the middle part of Kaneri River and (D) Parallel joints aremanifestations of neotectonics.
Geocarto International 563
Dow
nloa
ded
by [
Man
galo
re U
nive
rsity
Lib
rary
] at
01:
52 1
7 N
ovem
ber
2011

5.3. Hypsometric integral and slope inflection point
Hypsometric integral controls the shape of a hypsometric curve and thereby providesclues for landform evolution (Sinha Roy 2002). Normally, downward concavehypsometric curves show higher hypsometric integral. All the 20 sub-basins areclassified into four groups based on the hypsometric integral values. Six sub-basinsnamely Naiti hole, Bargi halla, Karkia halla, Barchi nadi, Panderi nadi and Naginadi (Nos. 1, 2 and 17–20) with Ea values 50.36 belong to first group. Naiti holeand Bargi halla sub-basins are located near to the coast and remaining ones are inthe upper part of the basin. Three sub-basins – Sarkari halla, Maradi and Thati halla(Nos. 3, 4, and 16) – with an average Ea value of 0.44 belong to second group. Sevensub-basins – Bennemone, Kaiga, Bari halla, Vaki halla, Birkol halla, Shivapura hallaand Kaneri (Nos. 5–10 and 12) – with an average Ea value of 0.52 belong to thirdgroup. The remaining four sub-basins – Vadi halla, Nagihari halla, Kannadgal nadiand Daogi nadi (Nos. 11, 13–15) – with an average Ea value of 0.64 come underfourth group (Table 1).
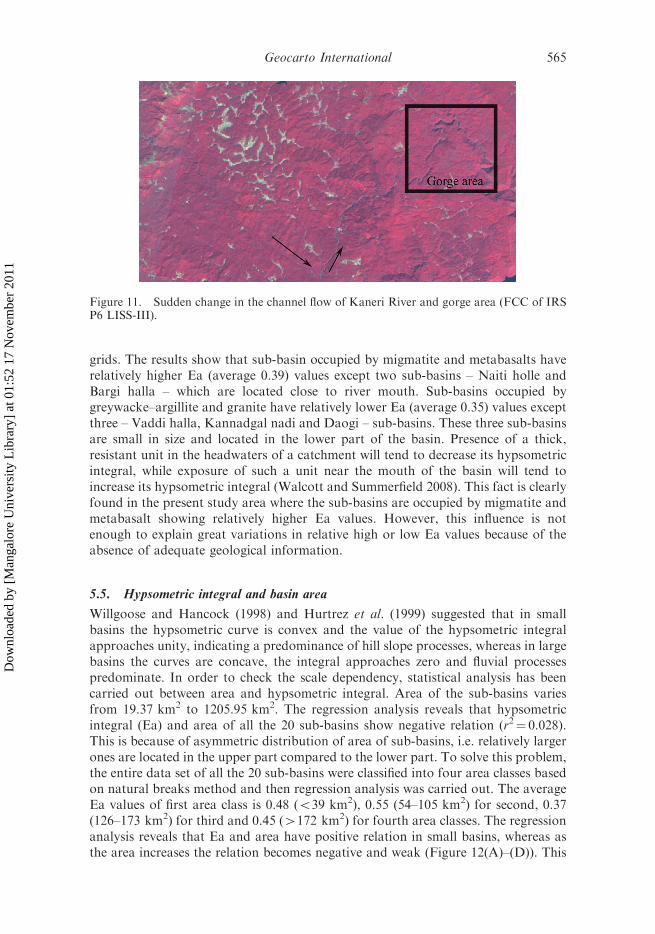
High values of Ea are possibly related to young, active tectonics and low valuesof Ea are related to older landscapes that have been more eroded and less impactedby recent tectonic activities (Hamdouni et al. 2008). Lower Ea values also indicatemass removal of materials by erosion and older landforms. Sudden change inchannel configuration and presence of gorges in middle part of Kaneri River is anindication of the tectonic control of this region (Figure 11). Incised channels, foldsand parallel joints in the middle part of Kaneri River were observed during the fieldstudies (Figure 10(B)–(D)).
The position of maximum concavity (Eh) of sub-basins show mixed character(Table 1). Eh values of the seven sub-basins of first group (Figure 8) are positive,which indicates mature stage of landforms and more eroded upland areas. Whereasthose belonging to second and third groups show negative Eh values, indicatingyoung landforms and less eroded upland areas.
As far as one of the slope inflection points i.e. a* values are considered, eightsub-basins (Nos. 1, 3, 4, 14, 17–20) show lower values (50.23), seven sub-basins(Nos. 2, 5, 6, 8–10 and 15) show moderate values (0.41–0.61) and the remaining fivesub-basins (Nos. 7, 11–13 and 16) show higher values (40.8). Regarding anotherslope inflection point (h*) values are considered, four sub-basins (Nos. 2, 11, 15 and16) show lower values (50.28), eight sub-basins (Nos. 6, 7, 10, 12, 14 and 18–20)show moderate values (0.40–0.52) and the remaining eight sub-basins (Nos. 1, 3–5, 8,9, 13 and 17) show higher values (40.62). Lower the value of a*, greater is the extentof subduced topography approaching Davision style of peneplain and lower thevalue of h*, higher is the degree of peneplanation (Sinha Roy 2002).
5.4. Potential lithological controls
Lithological variations can potentially affect the hypsometry of drainage basins incomplex ways (Walcott and Summerfield 2008). In our study area, there are twomain spatial scales at which significant lithological variations are evident. Upper partof the basin consists of greywacke–argillite and granite, whereas lower part of thebasin consists of migmatite and granodioritic to tonallite gneisses. We computedarea of main lithology, i.e. lithology that appears most often and calculated itspercentage sub-basin wise. Perez-Pena et al. (2009) have followed similar method;but instead of calculating main lithology for sub-basin, they have used regular square
564 V.J. Markose and K.S. Jayappa
Dow
nloa
ded
by [
Man
galo
re U
nive
rsity
Lib
rary
] at
01:
52 1
7 N
ovem
ber
2011
grids. The results show that sub-basin occupied by migmatite and metabasalts haverelatively higher Ea (average 0.39) values except two sub-basins – Naiti holle andBargi halla – which are located close to river mouth. Sub-basins occupied bygreywacke–argillite and granite have relatively lower Ea (average 0.35) values exceptthree – Vaddi halla, Kannadgal nadi and Daogi – sub-basins. These three sub-basinsare small in size and located in the lower part of the basin. Presence of a thick,resistant unit in the headwaters of a catchment will tend to decrease its hypsometricintegral, while exposure of such a unit near the mouth of the basin will tend toincrease its hypsometric integral (Walcott and Summerfield 2008). This fact is clearlyfound in the present study area where the sub-basins are occupied by migmatite andmetabasalt showing relatively higher Ea values. However, this influence is notenough to explain great variations in relative high or low Ea values because of theabsence of adequate geological information.
5.5. Hypsometric integral and basin area
Willgoose and Hancock (1998) and Hurtrez et al. (1999) suggested that in smallbasins the hypsometric curve is convex and the value of the hypsometric integralapproaches unity, indicating a predominance of hill slope processes, whereas in largebasins the curves are concave, the integral approaches zero and fluvial processespredominate. In order to check the scale dependency, statistical analysis has beencarried out between area and hypsometric integral. Area of the sub-basins variesfrom 19.37 km2 to 1205.95 km2. The regression analysis reveals that hypsometricintegral (Ea) and area of all the 20 sub-basins show negative relation (r2¼ 0.028).This is because of asymmetric distribution of area of sub-basins, i.e. relatively largerones are located in the upper part compared to the lower part. To solve this problem,the entire data set of all the 20 sub-basins were classified into four area classes basedon natural breaks method and then regression analysis was carried out. The averageEa values of first area class is 0.48 (539 km2), 0.55 (54–105 km2) for second, 0.37(126–173 km2) for third and 0.45 (4172 km2) for fourth area classes. The regressionanalysis reveals that Ea and area have positive relation in small basins, whereas asthe area increases the relation becomes negative and weak (Figure 12(A)–(D)). This
Figure 11. Sudden change in the channel flow of Kaneri River and gorge area (FCC of IRSP6 LISS-III).
Geocarto International 565
Dow
nloa
ded
by [
Man
galo
re U
nive
rsity
Lib
rary
] at
01:
52 1
7 N
ovem
ber
2011

confirms that the hypsometric integral is controlled by basin area in small sub-basinsrather than larger ones.
6. Conclusion
In order to understand the type of erosive processes and relative age of land forms,hypsometric analysis has been carried out for all the 20 sub-basins of Kali Riverbasin. Several parameters [hypsometric integral (Ea), maximum concavity (Eh),coordinates of slope inflection point (I) given by a* and h* and normalized height ofhypsometric curve (h)] were extracted from the hypsometric curves and used forunderstanding the landform characteristics. Hypsometric parameters provide strongindication regarding tectonic activities in the sub-basins which has been confirmedduring the field observations. Seven sub-basins (Naiti hole, Bargi halla, Sarkarihalla, Karkia halla, Barchi nadi, Panderi nadi and Nagi nadi) belonging to firstgroup of Kali River catchment show upward concave hypsometric curve with low Eavalues (average 0.32) indicating mature to late mature topography. These sevensub-basins (except Sarkari halla) with lower values of hypsometric head indicate lessdiffuse processes at their upper reaches and approaching the equilibrium stage oflandform evolution. The remaining 13 sub-basins show downward concave curvewith high Ea values (average 0.55) indicating fluvial and slope wash processes oflandforms. These 13 sub-basins fall in the younger stage of landform evolution.Statistical relation between the area and Ea values reveals that Ea is controlled byarea of smaller sub-basins rather than larger ones. As far as lithology is concerned,
Figure 12. Statistical relation between area and hypsometric integral of sub-basins of fourarea classes. Note that positive relation exits in class 1 (A) and negative relation in class 2, 3and 4 (B, C and D).
566 V.J. Markose and K.S. Jayappa
Dow
nloa
ded
by [
Man
galo
re U
nive
rsity
Lib
rary
] at
01:
52 1
7 N
ovem
ber
2011
sub-basins occupied by migmatite and metabasalt show relatively higher Ea valuescompared to those sub-basins occupied by greywacke–argillite.
Five sub-basins – Bennemone, Kaiga, Vaki halla, Birkol halla and Shivapurahalla - of second group and three sub-basins – Nagihari halla, Vadi halla and Daoginadi – of third group with higher hypsometric head values indicate dominanceof diffusive processes in their upper reaches. Only one sub-basin, i.e. Bari halla ofsecond group with high toe value indicates greater mass accumulation by fluvialtransport and all other sub-basins of this group show lower values (50.28)indicating minimum mass accumulation at their mouth. Four sub-basins – Vadihalla, Nagihari halla, Kannadgal nadi and Daogi nadi – belonging to third groupshow higher toe values (40.44) depicting greater mass accumulation at their mouth.
Acknowledgements
The authors wish to thank the University Grants Commission (UGC) of New Delhi forproviding the financial assistance in the form of a Major Research Project (No.F.33-45/2007(SR)). The authors also acknowledge both the anonymous reviewers for their commentsand suggestions which improved the quality of the manuscript.
References
Bishop, M.P., et al., 2002. Geomorphic change in high mountains: a western Himalayanperspective. Global and Planetary Change, 32, 311–329.
Chattopadhyay, S., Sajikumar, S., and Chattopadhyay, M., 2006. Landscape evolution inparts of Vamanapuram drainage basin, Kerala – a hypsometric approach. Journal ofGeological Society of India, 68, 841–856.
Chen, Y.C., Sung, Q., and Cheng, K., 2003. Along-strike variations of morphotectonicfeatures in the Western Foothills of Taiwan: tectonic implications based on stream-gradient and hypsometric analysis. Geomorphology, 56, 109–137.
Ciccacci, S., et al., 1992. Relation between Morphometric characteristics and denudationalprocesses in some drainage basins of Italy. Annals of Geomorphology, 36, 53–67.
Durg, N.L., 1969. A structural study of the phyllites near Dandeli, Mysore state. QuarterlyJournal of Geology, Mining and Metallurgical Society of India, 41, 153–156.
Hamdouni, R.El., et al., 2008. Assessment of relative active tectonics, Southwest Border ofSierra Nevada (southern Spain). Geomorphology, 96 (1–2), 150–173.
Huang, X.J. and Niemann, J.D., 2006. Modelling the potential impacts of ground waterhydrology on long-term drainage basin evolution. Earth Surface Processes and Landforms,31, 1802–1823.
Hurtrez, J.E. and Lucazeau, F., 1999. Lithological control on relief and hypsometry in theHerault drainage basin (France), Comptes Rendues Academie des Sciences de la terre etdes planets. Earth and Planetary Sciences, 328 (10), 687–694.
Hurtrez, J.E., Sol, C., and Lucazeau, F., 1999. Effect of drainage area on hypsometry from ananalysis of small-scale drainage basins in the Siwalik Hills (central Nepal). Earth SurfaceProcesses and Landforms, 24, 799–808.
Lifton, N.A. and Chase, C.G., 1992. Tectonic, climatic and lithologic influences on landscapefractal dimension and hypsometry: implications for landscape evolution in the San GabrielMountains, California. Geomorphology, 5, 77–114.
Moglen, G.E. and Bras, R.L., 1995. The effect of spatial heterogeneities on geomorphicexpression in a model of basin evolution. Water Resources Research, 31, 2613–2623.
Singh, O., Sarangi, A., and Sharma, M.C., 2008. Hypsometric integral estimation methodsand its relevance on erosion status of North-Western lesser Himalayan watersheds. WaterResource Management, 22, 1545–1560.
Singh, T., 2008. Hypsometric analysis of watersheds developed on actively deforming Mohandanticlinal ridge, NW Himalaya. Geocarto International, 2, 417–427.
Perez-Pena, J.V., et al., 2009. Differentiating geology and tectonics using a spatialautocorrelation technique for the hypsometric integral. Journal of Geophysical Research –Earth Surface, 114, F02018.
Geocarto International 567
Dow
nloa
ded
by [
Man
galo
re U
nive
rsity
Lib
rary
] at
01:
52 1
7 N
ovem
ber
2011
Sinha Roy, S., 2002. Hypsometry and landform evolution: a case study in the Banas drainagebasin, Rajasthan, with implications for Aravalli uplift. Journal of Geological Society ofIndia, 60, 7–26.
Strahler, A.N., 1952. Hypsometric (area-altitude) analysis of erosional topography. Bulletin ofGeological Society of America, 63, 1117–1142.
Strahler, A.N., 1957. Quantitative analysis of watershed Geomorphology. Transactions of theAmerican Geophysical Union, 38, 913–920.
Strahler, A.N., 1964. Quantitative geomorphology of drainage basins and channel networks.In: Chow V.T., ed. Handbook of applied hydrology. New York: McGraw Hill, 439–476.
Valdiya, K.S., 2001. Tectonic resurgence of the Mysore plateau and surrounding regions incratonic southern India. Current Science, 81, 1068–1089.
Vasudev, V.N. and Ranganathan, N., 1994. Vanadium and sulphide-bearing titaniferousmagnetite bodies in Western Dharwar craton. In: B.M. Ravindra and N. Ranganathan,eds. Geokarnataka. Bangalore: Karnataka Assistant Geologist’s Association, Departmentof Mines and Geology, 168–181.
Walcott, R.C. and Summerfield, M.A., 2008. Scale dependence of hypsometric integrals: ananalysis of southeast African basins. Geomorphology, 96, 174–186.
Weissel, J.K., Pratson, L.F., and Malinverno, A., 1994. The length-scaling properties oftopography. Journal of Geophysical Research, 99, 13997–14012.
Willgoose, G.R. and Hancock, G., 1998. Revisiting the hypsometric curve as an indicator ofform and process in transport-limited catchment. Earth Surface Processes and Landforms,23, 611–623.
568 V.J. Markose and K.S. Jayappa
Dow
nloa
ded
by [
Man
galo
re U
nive
rsity
Lib
rary
] at
01:
52 1
7 N
ovem
ber
2011