Geo-engineering classification with deterioration ...
19
Geo-engineering classiBcation with deterioration assessment of basalt hill cut slopes along NH 66, near Ratnagiri, Maharashtra, India ANURAG NIYOGI 1 ,KRIPAMOY SARKAR 1, *, ASHOK KUMAR SINGH 1 and T N SINGH 2 1 Department of Applied Geology, Indian Institute of Technology (Indian School of Mines), Dhanbad 826 004, India. 2 Department of Earth Sciences, Indian Institute of Technology Bombay, Mumbai 400 076, India. *Corresponding author. e-mail: [email protected] MS received 1 October 2019; revised 25 January 2020; accepted 29 January 2020 Western Ghats (WG) in India is endowed with one of the most distinctive and picturesque mountainous landscapes. The region encounters unprecedented rain and non-engineered excavations (especially along highway cut slopes), that turns out to be detrimental to the stability of rock and soil slopes. The present research focuses on accounting the vulnerability condition of rock slopes of differential deterioration intensities along National Highway corridor 66 (NH 66) at Ratnagiri–Sangameshwar (RS) stretch. Rock mass and associated slope stability condition were encapsulated, and studied locations were classiBed using different geo-engineering classiBcation (GEC) systems such as RMR (Rock Mass Rating), SMR (Slope Mass Rating), CSMR (Continuous Slope Mass Rating), GSI (Geological Strength Index) and RDA (Rock slope Deterioration Assessment). The study introduces a new class in RDA for igneous rocks that are susceptible to high deterioration. Some useful insights have been added and discussed in the light of deterioration-induced block failures which have been integrated with detailed kinematic analysis. The present study recommends that RDA would prove more eDcient and informative in the preliminary stage of slope stability investigation for high deterioration susceptible igneous rock masses as compared to other geo-engineering systems. Keywords. Western Ghats; geo-engineering classiBcation; kinematic analysis; highway cut slopes. 1. Introduction The importance of geo-engineering classiBcation (GEC) of rock-mass has already been well recog- nised. The advent of slope based rock mass classi- Bcation system has cut down the valuable time of geoscientist and geotechnical engineers for the proper decision-making process. Many of the pre- vious researchers have acknowledged the signifi- cance of discontinuity related failures in rock engineering projects (Selby 1980; Hoek and Bray 1981; Sarkar et al. 2016; Basahel and Mitri 2017; Kundu et al. 2017; Siddique et al. 2017; Pradhan et al. 2018) where rock, as well as discontinuity parameters primarily govern the stability condi- tion. Basalts are solidiBed lava Cow that forms a competent rock possessing high compressive strength. A type of it known as blocky lava (Aa lava) inherit fractures and joints. It depends upon a conjuncture of factors, both physical and miner- alogical, that interacts with the environment. Basalts are generally composed of minerals like J. Earth Syst. Sci. (2020)129 115 Ó Indian Academy of Sciences https://doi.org/10.1007/s12040-020-1378-0
Transcript of Geo-engineering classification with deterioration ...

Geo-engineering classiBcation with deteriorationassessment of basalt hill cut slopes along NH 66,near Ratnagiri, Maharashtra, India
ANURAG NIYOGI1, KRIPAMOY SARKAR
1,*, ASHOK KUMAR SINGH1
and T N SINGH2
1Department of Applied Geology, Indian Institute of Technology (Indian School of Mines), Dhanbad 826 004, India.2Department of Earth Sciences, Indian Institute of Technology Bombay, Mumbai 400 076, India.*Corresponding author. e-mail: [email protected]
MS received 1 October 2019; revised 25 January 2020; accepted 29 January 2020
Western Ghats (WG) in India is endowed with one of the most distinctive and picturesque mountainouslandscapes. The region encounters unprecedented rain and non-engineered excavations (especially alonghighway cut slopes), that turns out to be detrimental to the stability of rock and soil slopes. The presentresearch focuses on accounting the vulnerability condition of rock slopes of differential deteriorationintensities along National Highway corridor 66 (NH 66) at Ratnagiri–Sangameshwar (RS) stretch. Rockmass and associated slope stability condition were encapsulated, and studied locations were classiBedusing different geo-engineering classiBcation (GEC) systems such as RMR (Rock Mass Rating), SMR(Slope Mass Rating), CSMR (Continuous Slope Mass Rating), GSI (Geological Strength Index) and RDA(Rock slope Deterioration Assessment). The study introduces a new class in RDA for igneous rocks thatare susceptible to high deterioration. Some useful insights have been added and discussed in the light ofdeterioration-induced block failures which have been integrated with detailed kinematic analysis. Thepresent study recommends that RDA would prove more eDcient and informative in the preliminary stageof slope stability investigation for high deterioration susceptible igneous rock masses as compared to othergeo-engineering systems.
Keywords. Western Ghats; geo-engineering classiBcation; kinematic analysis; highway cut slopes.
1. Introduction
The importance of geo-engineering classiBcation(GEC) of rock-mass has already been well recog-nised. The advent of slope based rock mass classi-Bcation system has cut down the valuable time ofgeoscientist and geotechnical engineers for theproper decision-making process. Many of the pre-vious researchers have acknowledged the signifi-cance of discontinuity related failures in rockengineering projects (Selby 1980; Hoek and Bray
1981; Sarkar et al. 2016; Basahel and Mitri 2017;Kundu et al. 2017; Siddique et al. 2017; Pradhanet al. 2018) where rock, as well as discontinuityparameters primarily govern the stability condi-tion. Basalts are solidiBed lava Cow that formsa competent rock possessing high compressivestrength. A type of it known as blocky lava (Aalava) inherit fractures and joints. It depends upon aconjuncture of factors, both physical and miner-alogical, that interacts with the environment.Basalts are generally composed of minerals like
J. Earth Syst. Sci. (2020) 129:115 � Indian Academy of Scienceshttps://doi.org/10.1007/s12040-020-1378-0 (0123456789().,-volV)(0123456789().,-volV)
feldspars, pyroxenes and olivine that are suscepti-ble to deterioration in an open environment as perBowen reaction series of minerals (Bowen 1922).Weathering of basalts leads to various physico-chemico-mechanical changes which invariablydegrade the strength of rock, unlike its fresh andunaltered form (Tugrul and G€urpinar 1997). TheBssured lava Cows, forming the extensive Deccantrap are most likely to incur structural disconti-nuities that are seen with discrete and randomfractures in the rock mass (Niyogi et al. 2016).The highway corridors along WG are experi-
encing severe threat of crumbling unstable geoma-terials with risks to the ecosystem and propertiessurrounding it. National Highway (NH) 66 is abusy highway which commercially connectsMumbai (Panvel) to Goa along with states ofKerala, Tamil Nadu and Karnataka stretchingparallel to the coastal region of western India.Malsej Ghat, Mahabaleshwar, Chiplun, and Puneare reported landslide-struck places in Maharash-tra’s WG region (Singh et al. 2016; Sharma et al.2017). Several researchers have attempted toanalyse the stability condition of slopes in theseareas using different techniques (Kainthola et al.2012; Singh et al. 2013; Sharma et al. 2016). Thephysical observations in the Beld conBrm the spa-tio-temporal deterioration of rock and soil slopesthat have been considered in the present study.Failure mechanism such as rockfall and rockslidewere reported in the region (Ansari et al. 2012;Ahmad et al. 2013; Niyogi et al. 2017). Themajority of slopes are previously failed or in criti-cally stable condition. In order to understand thissituation, rock structural analyses from Beld datawere carried out in the laboratory in order todemonstratively perceive it. Discontinuity-con-trolled slope failures are well followed by thekinematic study, which provides a detailed previewof the potential failure modes.Rock mass rating (RMR) introduced by Bieni-
awski (1973) is a well-established and extensivelyused classiBcation system worldwide for the pastfour decades that was mainly applied in theunderground excavation. It includes six parame-ters, one of which is a correction due to the orien-tation of discontinuities. Use of RMR classiBcationwas emphasized for tunnels with the addition ofBve rock mass parameters to get an RMRbasic
numerical value. Romana (1993) proposed somecorrection factors for slope failure if the disconti-nuities strike and dip are favourable or not. Inpractice, RMR is often applied to quickly assess the
rock mass condition of excavated rock slopes,particularly highway cut slopes.Slope mass rating (SMR), developed by Romana
(1985) is one of the most sought out and widelyaccepted method to characterise the health of theslope. SMR addresses all the shortcomings relatedto RMR, but retains its fundamental structure.Joint orientations are assigned a numerical valuefor rating. Continuous slope mass rating (CSMR)gives a continuous result that SMR, a discreteclassiBcation, is unable to address (Tom�as et al.2007). GSI (Geological Strength Index), introducedby Hoek (1994) proposed a qualitative classiBca-tion based on visual inspection that involves thediscontinuous conditions of the rock mass. It wasinitially developed for the estimation of rock androck mass properties. Associated with other con-ventional stability classiBcation, it does manage touphold the qualitative aspects.Rock deterioration assessment (RDA) has been
developed in the UK, and extensive work has beendone considering all types of rock slopes byNicholson (2000). The striking part of this classi-Bcation system includes the involvement of dete-rioration aspects with types of remedial measuresthat can be chosen accordingly.The present research involves 11 slopes that
were chosen depending upon its vulnerability con-dition along the road cut highway. These slopeswere structurally analysed using kinematic analy-sis that was used to design slope classiBcation.Selected rock slopes were classiBed by RMR, SMR,CSMR, GSI and RDA systems. Supportingempirical methods were provided for correlationbetween most inCuential systems. Deteriorationwas emphasised to demonstrate the weatheringrelated eAects on the slope stability.
2. Study area and geological setting
Ratnagiri is a coastal district of Maharashtrapopularly known as ‘Port city’ linking Mumbai toGoa. The study area lies under SangameshwarTaluka of Ratnagiri district along NH 66. Thishighway remains an epochal source of income forthe locals. Known for its tourist commuters, thesensitivity of road towards natural and man-madehazards is grave. Geologically, the region is a largevoluminous mass of Bssured lava Cow known as‘Deccan Trap’ covering approximately 500,000km2 over west-central India (Krishnan 1953). Hillshere are steep and Cat-topped with rugged
115 Page 2 of 19 J. Earth Syst. Sci. (2020) 129:115
topography (Beane et al. 1986). Slopes of basalticrocks show prominent joint sets and randomlyoriented numerous fractures, varied from amyg-daloidal to vesicular to compacted with differentweathering intensities.With the prime focus on rock mass classiBcation
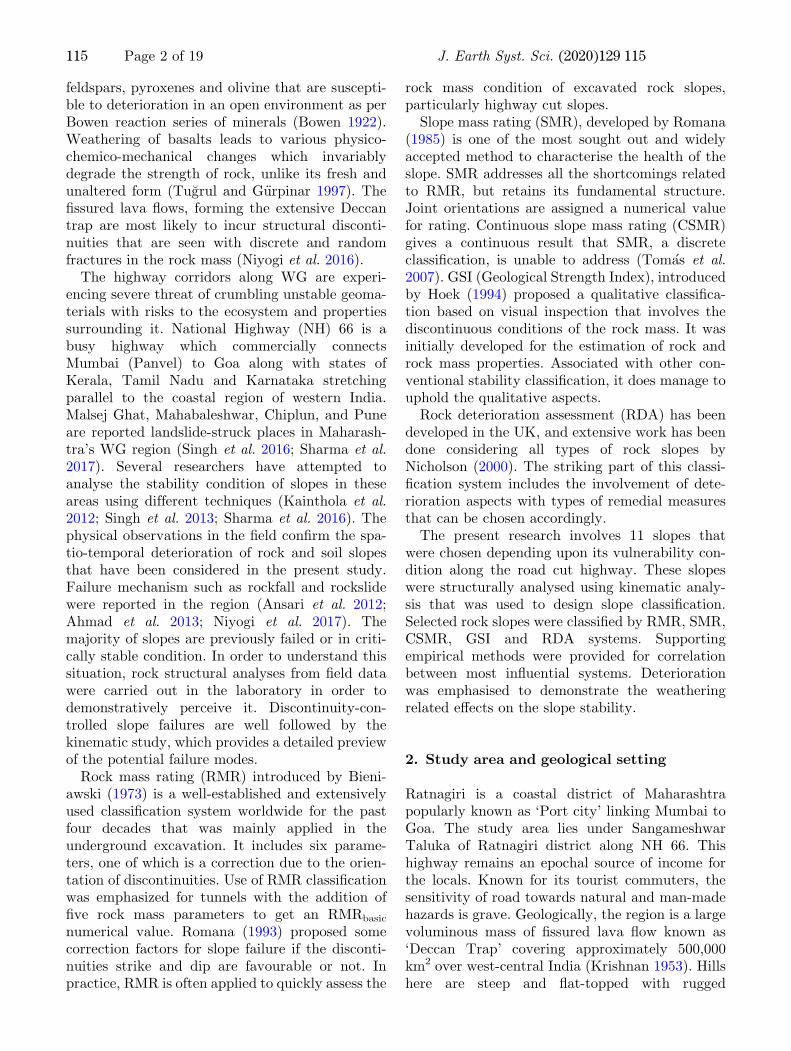
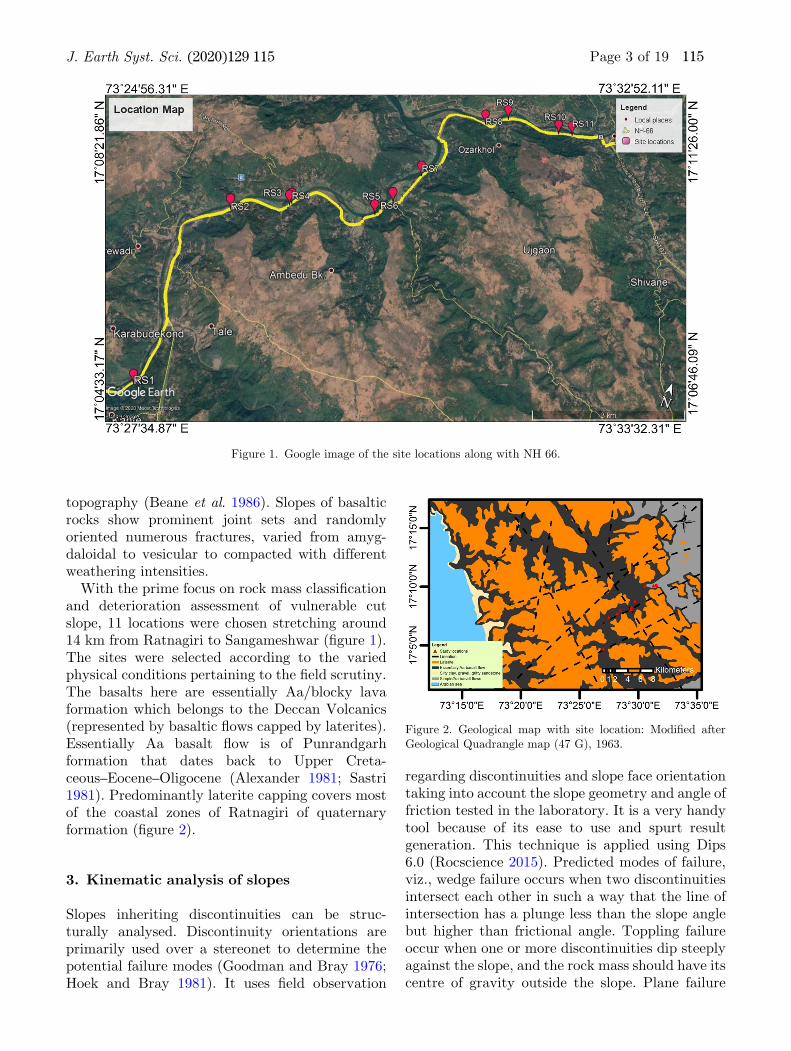
and deterioration assessment of vulnerable cutslope, 11 locations were chosen stretching around14 km from Ratnagiri to Sangameshwar (Bgure 1).The sites were selected according to the variedphysical conditions pertaining to the Beld scrutiny.The basalts here are essentially Aa/blocky lavaformation which belongs to the Deccan Volcanics(represented by basaltic Cows capped by laterites).Essentially Aa basalt Cow is of Punrandgarhformation that dates back to Upper Creta-ceous–Eocene–Oligocene (Alexander 1981; Sastri1981). Predominantly laterite capping covers mostof the coastal zones of Ratnagiri of quaternaryformation (Bgure 2).
3. Kinematic analysis of slopes
Slopes inheriting discontinuities can be struc-turally analysed. Discontinuity orientations areprimarily used over a stereonet to determine thepotential failure modes (Goodman and Bray 1976;Hoek and Bray 1981). It uses Beld observation
regarding discontinuities and slope face orientationtaking into account the slope geometry and angle offriction tested in the laboratory. It is a very handytool because of its ease to use and spurt resultgeneration. This technique is applied using Dips6.0 (Rocscience 2015). Predicted modes of failure,viz., wedge failure occurs when two discontinuitiesintersect each other in such a way that the line ofintersection has a plunge less than the slope anglebut higher than frictional angle. Toppling failureoccur when one or more discontinuities dip steeplyagainst the slope, and the rock mass should have itscentre of gravity outside the slope. Plane failure
Figure 1. Google image of the site locations along with NH 66.
Figure 2. Geological map with site location: ModiBed afterGeological Quadrangle map (47 G), 1963.
J. Earth Syst. Sci. (2020) 129:115 Page 3 of 19 115
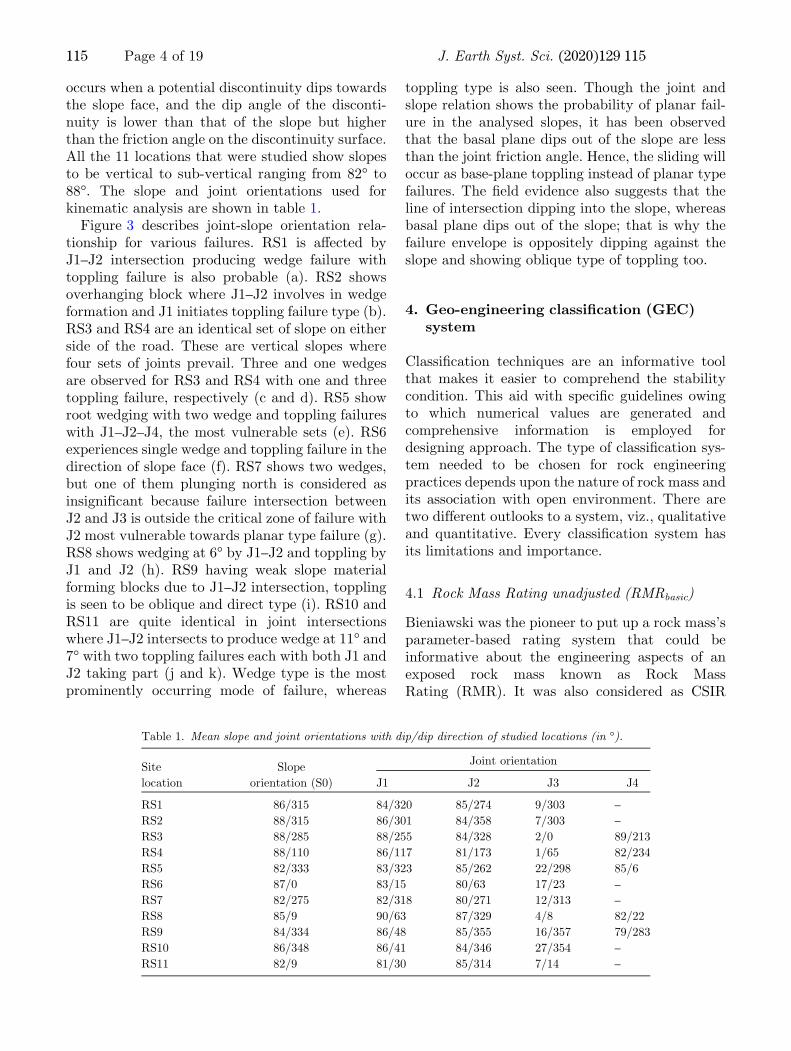
occurs when a potential discontinuity dips towardsthe slope face, and the dip angle of the disconti-nuity is lower than that of the slope but higherthan the friction angle on the discontinuity surface.All the 11 locations that were studied show slopesto be vertical to sub-vertical ranging from 82� to88�. The slope and joint orientations used forkinematic analysis are shown in table 1.Figure 3 describes joint-slope orientation rela-
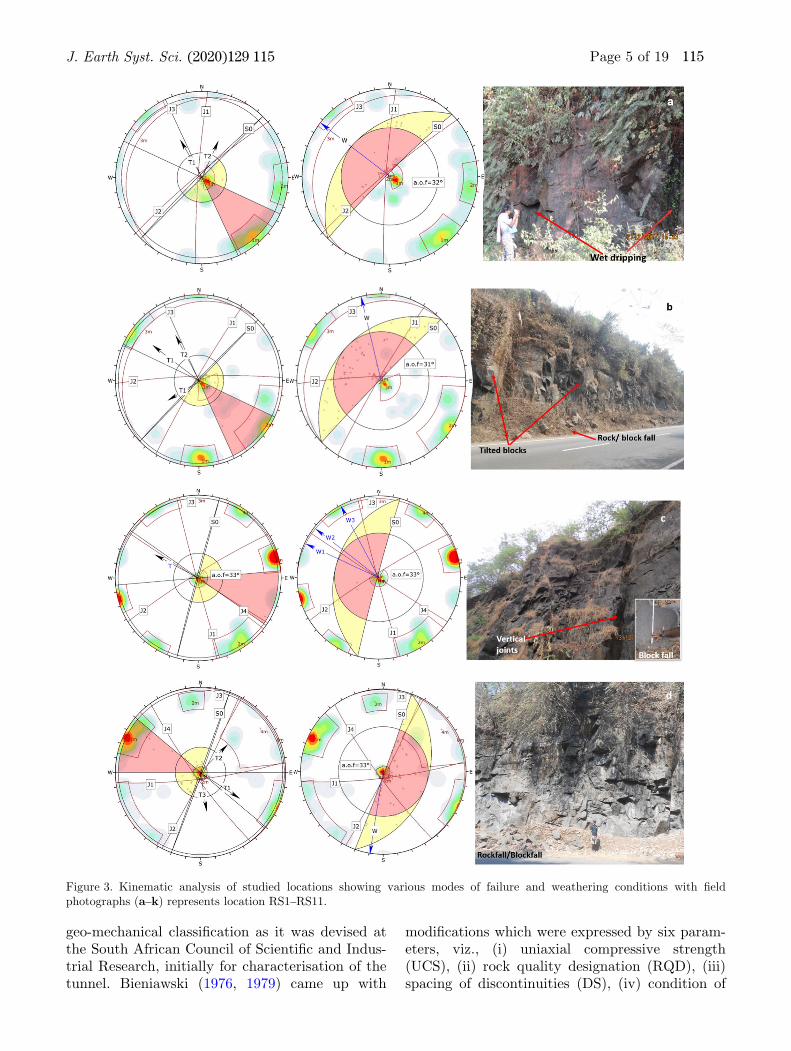
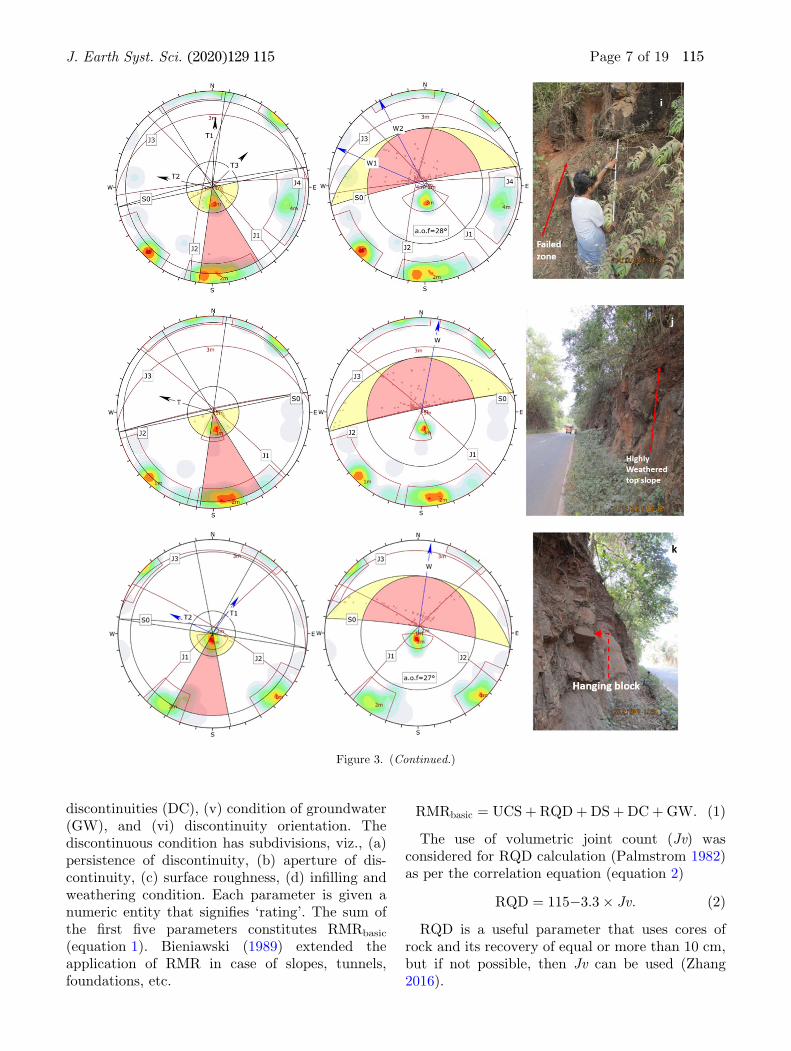
tionship for various failures. RS1 is aAected byJ1–J2 intersection producing wedge failure withtoppling failure is also probable (a). RS2 showsoverhanging block where J1–J2 involves in wedgeformation and J1 initiates toppling failure type (b).RS3 and RS4 are an identical set of slope on eitherside of the road. These are vertical slopes wherefour sets of joints prevail. Three and one wedgesare observed for RS3 and RS4 with one and threetoppling failure, respectively (c and d). RS5 showroot wedging with two wedge and toppling failureswith J1–J2–J4, the most vulnerable sets (e). RS6experiences single wedge and toppling failure in thedirection of slope face (f). RS7 shows two wedges,but one of them plunging north is considered asinsignificant because failure intersection betweenJ2 and J3 is outside the critical zone of failure withJ2 most vulnerable towards planar type failure (g).RS8 shows wedging at 6� by J1–J2 and toppling byJ1 and J2 (h). RS9 having weak slope materialforming blocks due to J1–J2 intersection, topplingis seen to be oblique and direct type (i). RS10 andRS11 are quite identical in joint intersectionswhere J1–J2 intersects to produce wedge at 11� and7� with two toppling failures each with both J1 andJ2 taking part (j and k). Wedge type is the mostprominently occurring mode of failure, whereas
toppling type is also seen. Though the joint andslope relation shows the probability of planar fail-ure in the analysed slopes, it has been observedthat the basal plane dips out of the slope are lessthan the joint friction angle. Hence, the sliding willoccur as base-plane toppling instead of planar typefailures. The Beld evidence also suggests that theline of intersection dipping into the slope, whereasbasal plane dips out of the slope; that is why thefailure envelope is oppositely dipping against theslope and showing oblique type of toppling too.
4. Geo-engineering classiBcation (GEC)system
ClassiBcation techniques are an informative toolthat makes it easier to comprehend the stabilitycondition. This aid with speciBc guidelines owingto which numerical values are generated andcomprehensive information is employed fordesigning approach. The type of classiBcation sys-tem needed to be chosen for rock engineeringpractices depends upon the nature of rock mass andits association with open environment. There aretwo different outlooks to a system, viz., qualitativeand quantitative. Every classiBcation system hasits limitations and importance.
4.1 Rock Mass Rating unadjusted (RMRbasic)
Bieniawski was the pioneer to put up a rock mass’sparameter-based rating system that could beinformative about the engineering aspects of anexposed rock mass known as Rock MassRating (RMR). It was also considered as CSIR
Table 1. Mean slope and joint orientations with dip/dip direction of studied locations (in �).
Site
location
Slope
orientation (S0)
Joint orientation
J1 J2 J3 J4
RS1 86/315 84/320 85/274 9/303 –
RS2 88/315 86/301 84/358 7/303 –
RS3 88/285 88/255 84/328 2/0 89/213
RS4 88/110 86/117 81/173 1/65 82/234
RS5 82/333 83/323 85/262 22/298 85/6
RS6 87/0 83/15 80/63 17/23 –
RS7 82/275 82/318 80/271 12/313 –
RS8 85/9 90/63 87/329 4/8 82/22
RS9 84/334 86/48 85/355 16/357 79/283
RS10 86/348 86/41 84/346 27/354 –
RS11 82/9 81/30 85/314 7/14 –
115 Page 4 of 19 J. Earth Syst. Sci. (2020) 129:115
geo-mechanical classiBcation as it was devised atthe South African Council of ScientiBc and Indus-trial Research, initially for characterisation of thetunnel. Bieniawski (1976, 1979) came up with
modiBcations which were expressed by six param-eters, viz., (i) uniaxial compressive strength(UCS), (ii) rock quality designation (RQD), (iii)spacing of discontinuities (DS), (iv) condition of
Figure 3. Kinematic analysis of studied locations showing various modes of failure and weathering conditions with Beldphotographs (a–k) represents location RS1–RS11.
J. Earth Syst. Sci. (2020) 129:115 Page 5 of 19 115

Figure 3. (Continued.)
115 Page 6 of 19 J. Earth Syst. Sci. (2020) 129:115
discontinuities (DC), (v) condition of groundwater(GW), and (vi) discontinuity orientation. Thediscontinuous condition has subdivisions, viz., (a)persistence of discontinuity, (b) aperture of dis-continuity, (c) surface roughness, (d) inBlling andweathering condition. Each parameter is given anumeric entity that signiBes ‘rating’. The sum ofthe Brst Bve parameters constitutes RMRbasic
(equation 1). Bieniawski (1989) extended theapplication of RMR in case of slopes, tunnels,foundations, etc.
RMRbasic ¼ UCSþ RQDþDSþDCþGW: ð1Þ
The use of volumetric joint count (Jv) wasconsidered for RQD calculation (Palmstrom 1982)as per the correlation equation (equation 2)
RQD ¼ 115�3:3� Jv: ð2Þ
RQD is a useful parameter that uses cores ofrock and its recovery of equal or more than 10 cm,but if not possible, then Jv can be used (Zhang2016).
Figure 3. (Continued.)
J. Earth Syst. Sci. (2020) 129:115 Page 7 of 19 115

Table 2 shows the RMRbasic and its associatedclasses for each slope. Unadjusted ratings ofRMRbasic varies from 47 to 65. Most of the slopescome under a fair condition with RS2, RS3 andRS5 fall under good condition of the rock mass asdescribed by Bieniawski (1993). RS1, RS5 and RS6experiences wet dripping condition at lower partwith RS5 having root wedging.
4.2 Slope Mass Rating (SMR)
SMR came into existence when Romana (1985)recognised and perceived the significance of quan-tiBcation for relative orientation of slope withrespect to discontinuities present in the rock mass.It led to an accurate assessment of different failuretypes by the involvement of four adjustment fac-tors. In yesteryears, several sets of modiBcationswere introduced to quantify the problem faced(Romana 1991, 1993, 1995; Anbalagan et al. 1992;Romana et al. 2001, 2003). Use of RMR basic withadjustment of factors contributed to the formula-tion of SMR (equation 3).
SMR ¼ RMRbasic þ F1 � F2 � F3ð Þ þ F4; ð3Þ
where F1, F2, F3 are adjustment factors dependingupon the relative orientation of slope and discon-tinuity for a different mode of structurally con-trolled failures and F4 is related to excavationmethod. F1 depends upon parallelism between dipdirection of discontinuity and slope face which iscalculated using dip direction of slope and discon-tinuity causing planar and toppling mode of fail-ures, while for wedge mode, dip direction of theslope and the trend of the line formed by theintersection of two discontinuities forming wedge
failure are considered for calculation of F1. F2 refersto dip angle of discontinuity in planar and wedgemode of failure, while for toppling mode it remains1. F3 is related to the relationship between slopeinclination and dip of discontinuity, causing planarand toppling failures.The calculated values of SMR show that most of
the slopes fall under class III and IV, i.e., partiallystable to unstable condition for different modes offailure. Slopes of RS5–RS11 are unstable to par-tially stable because of prominent weatheringcondition. In most cases, the slopes are partiallystable against wedge failure, whereas slopes RS1,RS5, RS7 and RS9 are completely unstable. Con-sidering toppling type of failure, the majority ofslopes come under partially stable condition, butwith the future frame of reference, it cannot beneglected due to its prominence in the area. Planarfailures are not a dominant failure mode in Beldcondition, but RS7 has shown to be completelyunstable. RS5, RS6, RS9 appears to have a higherpossibility of rock topple (table 3).
4.3 Continuous Slope Mass Rating (CSMR)
Tom�as et al. (2007) noticed that the SMR lack incontinuity when real-time Beld condition was con-cerned. It is because of SMR show a discretebehaviour which cannot signify the transitionalchange in class intervals. To cope up with thislimitation, more precise continuous functions weregenerated. The adjustments were formed asaccordance with failure modes.
F1 ¼16
25� 3
500atan
1
10Aj j � 17ð Þ
� �; ð4Þ
Table 2. Ratings for parameters deBning RMRbasic of studied locations.
Site
location UCS RQD DS DC GW RMRbasic
Rock mass
classes
RS1 4 13 15 14 7 53 Fair
RS2 7 13 15 15 15 65 Good
RS3 7 8 15 16 15 61 Good
RS4 7 8 15 13 15 58 Fair
RS5 7 13 15 17 10 62 Good
RS6 4 13 15 9 10 51 Fair
RS7 4 13 10 10 10 47 Fair
RS8 4 13 10 13 15 55 Fair
RS9 2 17 10 8 15 52 Fair
RS10 4 17 15 14 7 57 Fair
RS11 4 13 10 10 15 52 Fair
115 Page 8 of 19 J. Earth Syst. Sci. (2020) 129:115

F2 ¼9
16þ 1
195atan
17
100B � 5
� �: ð5Þ
For wedge failure and planar failure:
F3 ¼ �30þ 1
3atanC ; ð6Þ
and for toppling failure:
F3 ¼ �13� 1
7atan C � 120ð Þ; ð7Þ
where, for wedge failure, A is the angle formedbetween the intersection of the two discontinuities
(the plunge direction) and the slope dip direction.B corresponds to the discontinuity dip (bj) indegrees, for planar failure and toppling and to theplunge (bi) of the wedge failure intersection line. Itsvalid range is for values of B lower than 45�. Forhigher values, F2 is set to 1. C expresses dip rela-tionship and is equivalent to bj – bs for planarfailure, bi – bs for wedge failure and bj + bs fortoppling failure, where bj is the joint dip angle, andbs is the slope dip angle (equations 4–7).It shows a similar result to that of SMR. Most of
the slopes are of class III which falls under partiallystable condition. RS5–RS11 are most vulnerable as
Table 3. Ratings for parameters deBning SMR of studied locations.
Site
location RMRbasic
Failure
types F1 F2 F3 F4 SMR
SMR
class Stability condition
RS1 53 W 0.70 1 �50 0 18 V Completely unstable
T1 0.70 1 0 0 53 III Partially stable
T2 0.15 1 �25 0 49.25 III Partially stable
RS2 65 W 0.15 1 �50 0 57.5 III Partially stable
T1 0.85 1 0 0 65 II Stable
T2 0.70 1 �6 0 60.8 II Stable
T3 0.15 1 �25 0 61.25 II Stable
RS3 61 W1 0.15 1 �60 0 52 III Partially stable
W2 0.15 1 �60 0 52 III Partially stable
T 0.70 1 0 0 61 II Stable
RS4 58 W 0.15 1 �50 0 50.5 III Partially stable
T1 0.70 1 �6 0 53.8 III Partially stable
T2 0.15 1 �25 0 54.25 III Partially stable
T3 0.15 1 �25 0 54.25 III Partially stable
RS5 62 W1 0.70 1 �50 �8 19 V Completely unstable
W2 0.15 0.15 �60 �8 52.65 III Partially stable
T1 1 1 �25 �8 29 IV Unstable
T2 0.15 1 �25 �8 50.25 III Partially stable
RS6 51 W 0.15 1 �50 �8 35.5 IV Unstable
T 0.15 1 �25 �8 35.25 IV Unstable
RS7 47 W1 0.85 1 �50 0 4.5 V Completely unstable
W2 0.15 0.15 �60 0 45.65 III Partially stable
P 0.85 1 �50 0 4.5 V Completely unstable
RS8 55 W1 0.15 1 �50 0 47.5 III Partially stable
W2 0.40 1 �50 0 35 IV Unstable
T1 0.15 1 �25 0 51.25 III Partially stable
T2 0.15 1 �25 0 51.25 III Partially stable
RS9 52 W1 0.15 1 �50 �8 36.5 III Partially stable
W2 0.70 1 �60 �8 2 V Completely unstable
T1 0.70 1 0 �8 44 III Partially stable
T2 0.15 1 �25 �8 40.25 IV Unstable
T3 0.15 1 �25 �8 40.25 IV Unstable
RS10 57 W 0.7 1 �50 0 22 IV Unstable
T 0.15 1 �25 0 53.25 III Partially stable
RS11 52 W 0.4 1 �50 0 32 IV Unstable
T1 0.15 1 �25 0 48.25 III Partially stable
T2 0.15 1 �25 0 48.25 III Partially stable
J. Earth Syst. Sci. (2020) 129:115 Page 9 of 19 115
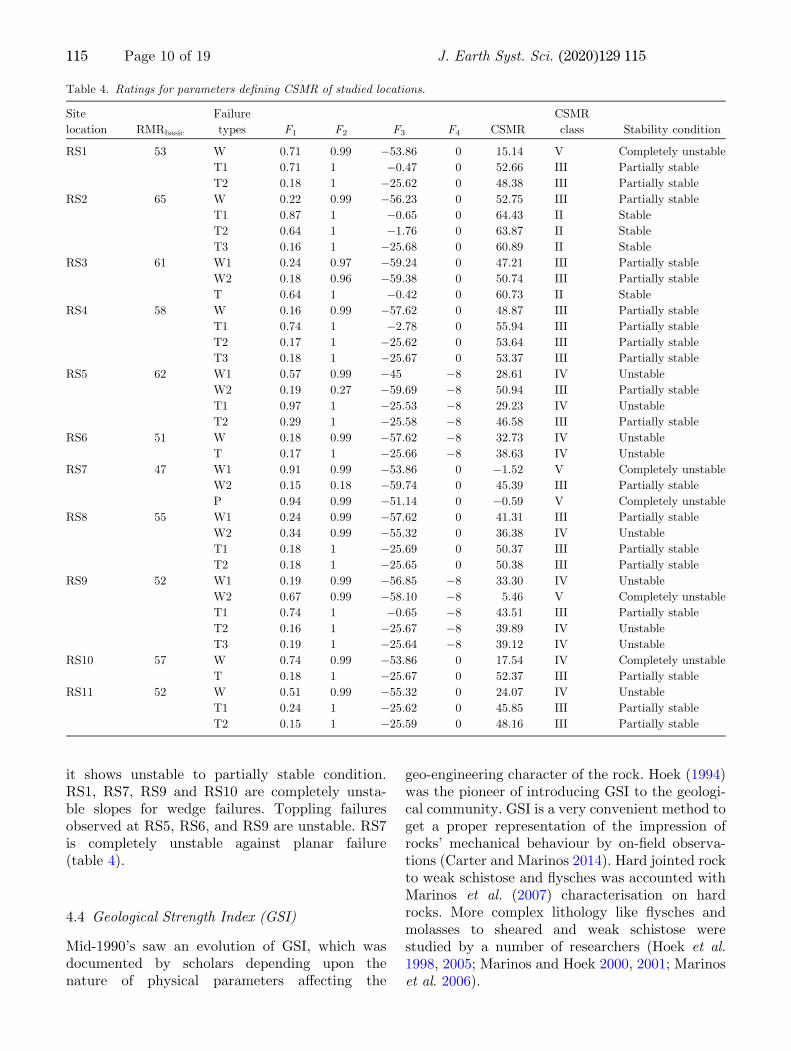
it shows unstable to partially stable condition.RS1, RS7, RS9 and RS10 are completely unsta-ble slopes for wedge failures. Toppling failuresobserved at RS5, RS6, and RS9 are unstable. RS7is completely unstable against planar failure(table 4).
4.4 Geological Strength Index (GSI)
Mid-1990’s saw an evolution of GSI, which wasdocumented by scholars depending upon thenature of physical parameters aAecting the
geo-engineering character of the rock. Hoek (1994)was the pioneer of introducing GSI to the geologi-cal community. GSI is a very convenient method toget a proper representation of the impression ofrocks’ mechanical behaviour by on-Beld observa-tions (Carter and Marinos 2014). Hard jointed rockto weak schistose and Cysches was accounted withMarinos et al. (2007) characterisation on hardrocks. More complex lithology like Cysches andmolasses to sheared and weak schistose werestudied by a number of researchers (Hoek et al.1998, 2005; Marinos and Hoek 2000, 2001; Marinoset al. 2006).
Table 4. Ratings for parameters deBning CSMR of studied locations.
Site
location RMRbasic
Failure
types F1 F2 F3 F4 CSMR
CSMR
class Stability condition
RS1 53 W 0.71 0.99 �53.86 0 15.14 V Completely unstable
T1 0.71 1 �0.47 0 52.66 III Partially stable
T2 0.18 1 �25.62 0 48.38 III Partially stable
RS2 65 W 0.22 0.99 �56.23 0 52.75 III Partially stable
T1 0.87 1 �0.65 0 64.43 II Stable
T2 0.64 1 �1.76 0 63.87 II Stable
T3 0.16 1 �25.68 0 60.89 II Stable
RS3 61 W1 0.24 0.97 �59.24 0 47.21 III Partially stable
W2 0.18 0.96 �59.38 0 50.74 III Partially stable
T 0.64 1 �0.42 0 60.73 II Stable
RS4 58 W 0.16 0.99 �57.62 0 48.87 III Partially stable
T1 0.74 1 �2.78 0 55.94 III Partially stable
T2 0.17 1 �25.62 0 53.64 III Partially stable
T3 0.18 1 �25.67 0 53.37 III Partially stable
RS5 62 W1 0.57 0.99 �45 �8 28.61 IV Unstable
W2 0.19 0.27 �59.69 �8 50.94 III Partially stable
T1 0.97 1 �25.53 �8 29.23 IV Unstable
T2 0.29 1 �25.58 �8 46.58 III Partially stable
RS6 51 W 0.18 0.99 �57.62 �8 32.73 IV Unstable
T 0.17 1 �25.66 �8 38.63 IV Unstable
RS7 47 W1 0.91 0.99 �53.86 0 �1.52 V Completely unstable
W2 0.15 0.18 �59.74 0 45.39 III Partially stable
P 0.94 0.99 �51.14 0 �0.59 V Completely unstable
RS8 55 W1 0.24 0.99 �57.62 0 41.31 III Partially stable
W2 0.34 0.99 �55.32 0 36.38 IV Unstable
T1 0.18 1 �25.69 0 50.37 III Partially stable
T2 0.18 1 �25.65 0 50.38 III Partially stable
RS9 52 W1 0.19 0.99 �56.85 �8 33.30 IV Unstable
W2 0.67 0.99 �58.10 �8 5.46 V Completely unstable
T1 0.74 1 �0.65 �8 43.51 III Partially stable
T2 0.16 1 �25.67 �8 39.89 IV Unstable
T3 0.19 1 �25.64 �8 39.12 IV Unstable
RS10 57 W 0.74 0.99 �53.86 0 17.54 IV Completely unstable
T 0.18 1 �25.67 0 52.37 III Partially stable
RS11 52 W 0.51 0.99 �55.32 0 24.07 IV Unstable
T1 0.24 1 �25.62 0 45.85 III Partially stable
T2 0.15 1 �25.59 0 48.16 III Partially stable
115 Page 10 of 19 J. Earth Syst. Sci. (2020) 129:115
GSI is a charted representation that providesqualitative information on the strength of geoma-terials using different geological conditions thataAect them. These conditions are depicted on thehorizontal and vertical axes of the Beld observation
chart correlation of which deBnes the strengthscenario of the rock slope. With its association, arange of value is put up describing the actualstrength condition of geomaterials. QuantiBcationof GSI chart was attempted by many researchers in
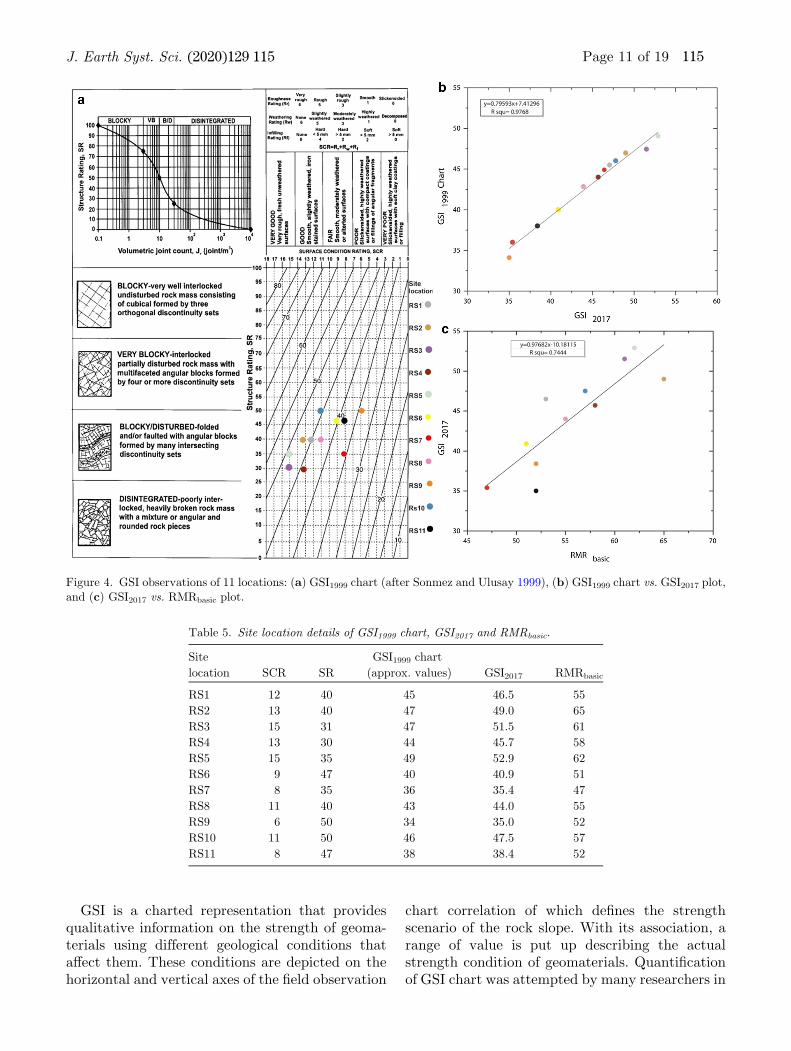
Figure 4. GSI observations of 11 locations: (a) GSI1999 chart (after Sonmez and Ulusay 1999), (b) GSI1999 chart vs. GSI2017 plot,and (c) GSI2017 vs. RMRbasic plot.
Table 5. Site location details of GSI1999 chart, GSI2017 and RMRbasic.
Site
location SCR SR
GSI1999 chart
(approx. values) GSI2017 RMRbasic
RS1 12 40 45 46.5 55
RS2 13 40 47 49.0 65
RS3 15 31 47 51.5 61
RS4 13 30 44 45.7 58
RS5 15 35 49 52.9 62
RS6 9 47 40 40.9 51
RS7 8 35 36 35.4 47
RS8 11 40 43 44.0 55
RS9 6 50 34 35.0 52
RS10 11 50 46 47.5 57
RS11 8 47 38 38.4 52
J. Earth Syst. Sci. (2020) 129:115 Page 11 of 19 115
the past. Sonmez and Ulusay (1999) came up withaxes variables like structural parameter usingvolumetric joint count (Jv) for rating known asstructural rating (SR) and geological discontinuityparameters such as roughness, inBlling materialsand weathering intensity rated as surface conditionrating (SCR). Other variables involve rock blockvolume (Vb) and joint condition factor (JC) (Caiet al. 2004), correlations with RMR (RMR89) andQ-system (Q) (Hoek and Brown 1997).Morelli (2017) brought a more elaborated and
convenient chart using Hoek et al. (2013)approach. It compiles Bve possible correlations atone place, viz., SCR with Jv#, SCR with RQD anddiscontinuity spacing rating (DS), discontinuitycondition (DC) with DS, SCR with spacing ofdiscontinuity (DS) and SCR with RQD/Jn.Equations developed can be used independentlywith ground reality in the Beld and suggested thatSCR remains the most vital part of Bnding the best
suited GSI value. All possibilities of getting a GSIwas performed, and the best correlation was opteddepending upon how exactly it matches withgeoengineering aspects observed in the Beld(equation 8):
GSI2017 ¼ 2:5� SCRð Þ�8:59� ln Jv#� �
; ð8Þ
where SCR = discontinuity roughness rat-ing + discontinuity inBlling rating + discontinuityweathering rating and Jv# = discontinuity volumecount when Jv is 100 or less.GSI values were observed using GSI1999
chart developed by Sonmez and Ulusay (1999).From Bgure 4(a), it is evident that every site fallsunder blocky/disturbed structure condition. Sitelocations RS9 and RS12 show poor surface condi-tion as the slopes are highly weathered. Site loca-tions RS6, RS7, RS8, RS10, RS11 fall under fairsurface condition where slopes are moderate tohighly weathered in Beld observation. RS1, RS2,
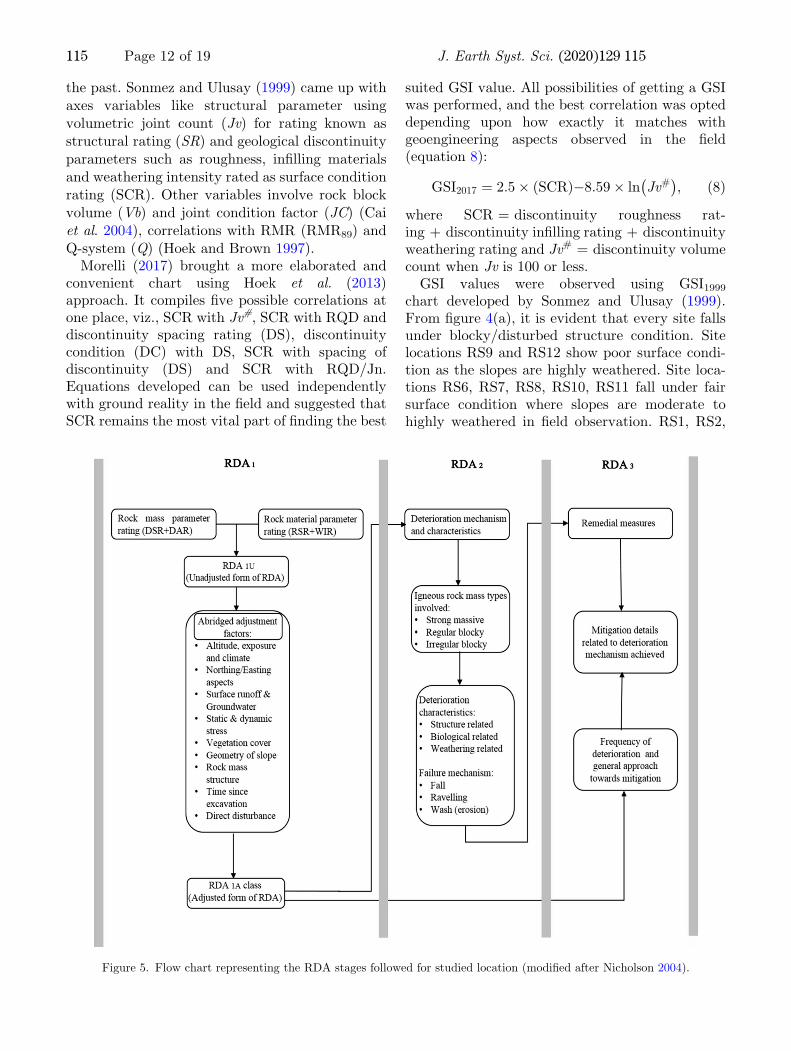
Figure 5. Flow chart representing the RDA stages followed for studied location (modiBed after Nicholson 2004).
115 Page 12 of 19 J. Earth Syst. Sci. (2020) 129:115
and RS4 have slopes in good, whereas RS3 and RS5show very good surface condition (table 5).In order to Bnd the usefulness of the adopted
formulation for getting GSI, two correlations wereestablished. First between GSI2017 equation andvalues achieved by GSI1999 chart (Bgure 4b).Values thus obtained using the chart are theapproximate values. A linear curve Btting givesa near-ideal correlation to derive an equation,that is:
GSI1999 chart ¼ 0:79593�GSI2017 þ 7:41296; ð9Þ
where R2 = 0.97.A second equation was developed between
GSI2017 and RMRbasic that suggest a positive cor-relation via linear Btting from Bgure 4(c), that is:
GSI2017 ¼ 0:97682�RMRbasic�10:18115; ð10Þ
where R2 = 0.74.Equation (9) can enhance the credibility of the
GSI1999 chart as individual empirical values can be
put up for similar rock type and their geologicalstructure condition. Equation (10) can come inhandy in a similar situation.
4.5 Rock slope Deterioration Assessment(RDA)
Nicholson and Hencher (1997) coined the termRDA (rock slope deterioration assessment) thataddresses the deterioration of rock slope undervarying environmental condition. RDA qualiBesfor the present study as it is specifically designed toconsider the non-obvious fractures for classiBca-tion. Chowdhury and Flentje (2002) describedsusceptibility, which can be related to deteriora-tion. The RDA uses the smallest bit of geotechnicaldetails required for establishing GEC. It is theGEC which meticulously addresses the deteriora-tion or simply erosional phenomena aAecting theslopes. Structural orientation related failures arewell understood, but deterioration related dis-lodging was discussed in RDA. The significance of
Table 6. Rock slope susceptibility parameter ratings for RDA1U (modiBed after Nicholson and Hencher 1997).
Discontinuity
spacing
Rating
(max. 35)
Discontinuity
aperture
(mm)
Rating
(max. 15)
Intact rock
strength
(MPa)
Rating
(max. 35) Weathering intensity
Rating
(max. 15)
[2 m 2 Closed-0.1 1 [200 2 Fresh/unweathered (I) 1
600 mm–2 m 8 0.1–0.5 3 100–200 5 Slightly weathered (II) 5
200–600 mm 16 0.5–1.0 7 50–100 10 Moderately weathered
(III)
10
60–200 mm 28 1.0–5.0 13 12.5–50 18 Highly weathered (IV) 14
\60 mm 35 [5.0 15 5–12.5 35 Completely weathered,
Residual soil (V)
15
Table 7. RDA1U rating for studied locations.
Site location
Discontinuity
spacing
rating (DSR)
Discontinuity
aperture
rating (DAR)
Rock strength
rating (RSR)
Weathering
index
rating (WIR) RDA1U
RS1 8 15 18 1 42
RS2 8 15 10 1 34
RS3 8 13 10 1 32
RS4 8 13 10 1 32
RS5 8 15 10 10 43
RS6 8 13 18 10 49
RS7 16 15 18 14 63
RS8 16 13 18 10 57
RS9 16 13 18 14 61
RS10 8 13 18 10 49
RS11 16 15 18 10 59
J. Earth Syst. Sci. (2020) 129:115 Page 13 of 19 115
Table
8.RDA1Awithad
justmen
tfactor
ratingforstudied
location
s.
Site
location
RDA
1U
Adjustmentfactors
(AF)*
RDA
1A=
(RDA
1U+AF)
Aspect,
exposure,
clim
ate
change
(A)
Aspect
(B)
Groundwater
andsurface
runoA
(C)
Static
stress
(D)
Dynamic
stress
(E)
Vegetationcover
(H)
Slope
geometry
(J)
Rock
mass
structure
(K)
Tim
esince
excavation
(L)
Direct
disturbance
(M)
Highly
weathered/
soillike
slope
Rock
cut
slope
RS1
42
11d
21a
21b
12
41b
–53b
�32b
�32b
�11c
11
51
RS2
34
11d
21a
01
12
41b
–53b
�32b
�32b
�11c
31
43
RS3
32
11d
21a
01a
02
41b
–33a
02b
�32b
�11c
11
39
RS4
32
11d
01b
01a
02
41b
–33a
02b
�32b
�11c
11
37
RS5
43
11d
21a
21b
22
41b
–53b
�21c
34
�11c
31
62
RS6
49
11d
41a
21b
22
41b
–23c
32a
�12a
�11c
52
70
RS7
63
11d
21a
21b
22
41b
�21c
–32a
�32b
�11c
31
74
RS8
57
11d
41a
01a
22
41b
–13b
02b
�32b
�11c
31
68
RS9
61
11d
21a
01a
02
41b
�61b
–32a
�32b
�11c
62
67
RS10
49
11d
41a
11a
12
41b
–13b
02b
02b
�11c
11
61
RS11
59
11d
41a
01a
22
41b
�61b
–32a
34
�11c
52
74
*PreBxes
usedforrespectiveadjustmentfactors
are
thesameasin
theabridged
adjustmentfactors
from
Nicholson(2004).
115 Page 14 of 19 J. Earth Syst. Sci. (2020) 129:115

this classiBcation lies in the fact that it pondersaround the critical condition of rock slopes andgenerates a quality based sensitivity analysis. Theclass provides a pathway to a systematic approachtowards hazard mitigation and its maintenancemeasures.RDA comprises of three stages; stage one, i.e.,
RDA1 involves four parameters with their corre-sponding rating, viz., discontinuity spacing rating(DSR), discontinuity aperture rating (DAR), rockstrength rating (RSR) and weathering intensityrating (WIR). A tedious process based on theo-retical Bndings, expected ratings of a value rangedepending on Beld monitoring of slope deteriora-tion with its parameters deBnes the parameter andrating values. Stage two, i.e., RDA2, recognises therelationship between deterioration mechanismsinvolved for speciBc rock type represented bydeterioration characteristics. Stage three, i.e.,RDA3 helps design site-speciBc remedial measuresby clubbing Brst and second stage information(Bgure 5). The unadjusted form of RDA, RDA1U
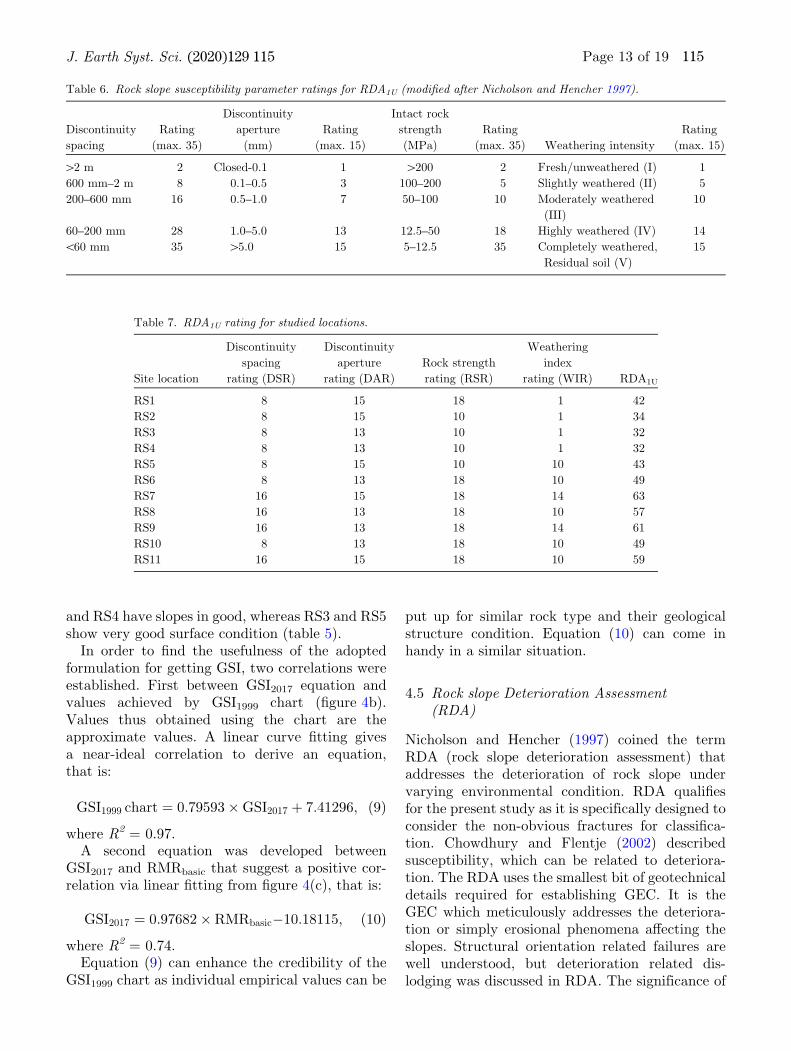
rating is a summation of rock mass and rockmaterial properties providing deterioration sus-ceptibility measurement of the excavated rockmass (table 6).RDA is a classiBcation which makes it a much-
elaborated system of quantiBcation. The mainmotive of introducing it lies in the fact that dete-rioration plays a significant role in the overallframework of stability analysis in the study region.The eAectiveness of this system is pronounced as itinvolves much smaller but significant factors asadjustments in the collective deterioration assess-ment. Site locations were assessed thoroughly, andutmost care was taken to select the adjustment
factors. Locations RS1–RS11 see a variation ofunadjusted RDA1U from 32 to 63 (table 7). Theratings thus achieved follows the equation(equation 11).
RDA1U ¼ DSRþDARþ RSRþWIR: ð11Þ
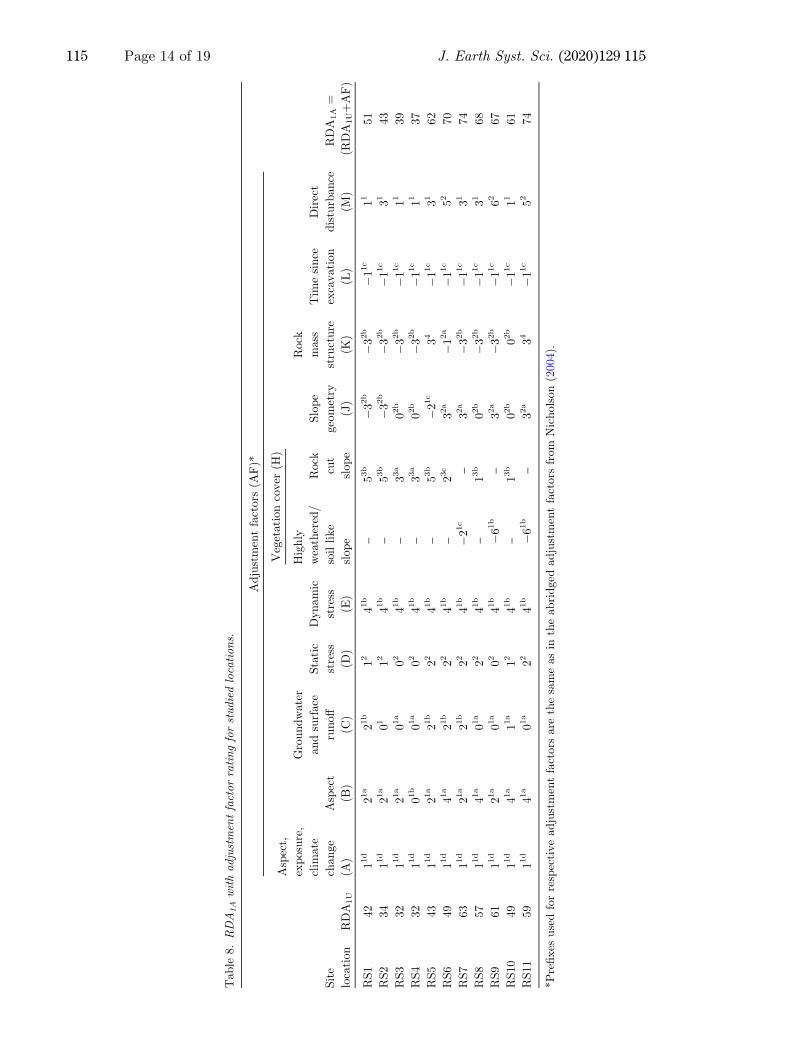
The adjustment factors (AF) are based on altitude,exposure and climate conditions, northing oreasting aspects, groundwater and surface runoA,static and dynamic stress, method of excavation,stabilisation and protective measure, vegetationcover, slope geometry, rock mass structure, timesince excavation and direct disturbance.Adjustments were made on visual observation,and thus ratings were chosen appropriately.Certain AF was excluded, viz., method ofexcavation since the slopes were already existing,stabilisation and protective measure as it was notpresent and time since excavation is not known(table 8). It brings to an adjusted RDA, i.e.,RDA1A, which give a numerical value for thedeterioration aAecting the study area.The RDA achieved by Nicholson (2004) was
extensively employed to study different rock types.It was well documented for igneous rock slope asto how susceptibility classes 2 and 3 are looselyinterconnected with basic RMR showing no prac-tical relation. Previously, correlation for the rockslopes having higher susceptibility towards deteri-oration (class 4 and 5) between RMRbasic andRDA1A were not discussed. However, the presentstudy addresses this issue and signiBes the deteri-orating eAect on rock mass due to differentialweathering. It was noted that environmentaldeterioration has a significant impact on theoverall rating of RDA1. The site locationsRS1–RS2 and RS3–RS4 were classiBed underclasses 2 and 3, respectively, whereas RS5–RS11were classiBed under class 4. It leads to a goodcorrelation between RDA1A vs. RMRbasic (Bgure 6;equation 12).
RDA1A ¼ �0:91086� RMRbasic þ 116:92623:
ð12Þ
The RDA1A class with Beld investigation helpedin working out for RDA2. The primary rock massfound were majorly blocky both in regular andirregular shapes as deBned for class 2 and 3.RS5–RS11, which are class 4 rock slopes, also formregular and irregular blocks with the consequenceof weathering over it. Primarily, deteriorationwould be fall (block, rock, and stone) with
Figure 6. Comparative relation between RDA1A vs. RMRbasic
of selective locations.
J. Earth Syst. Sci. (2020) 129:115 Page 15 of 19 115
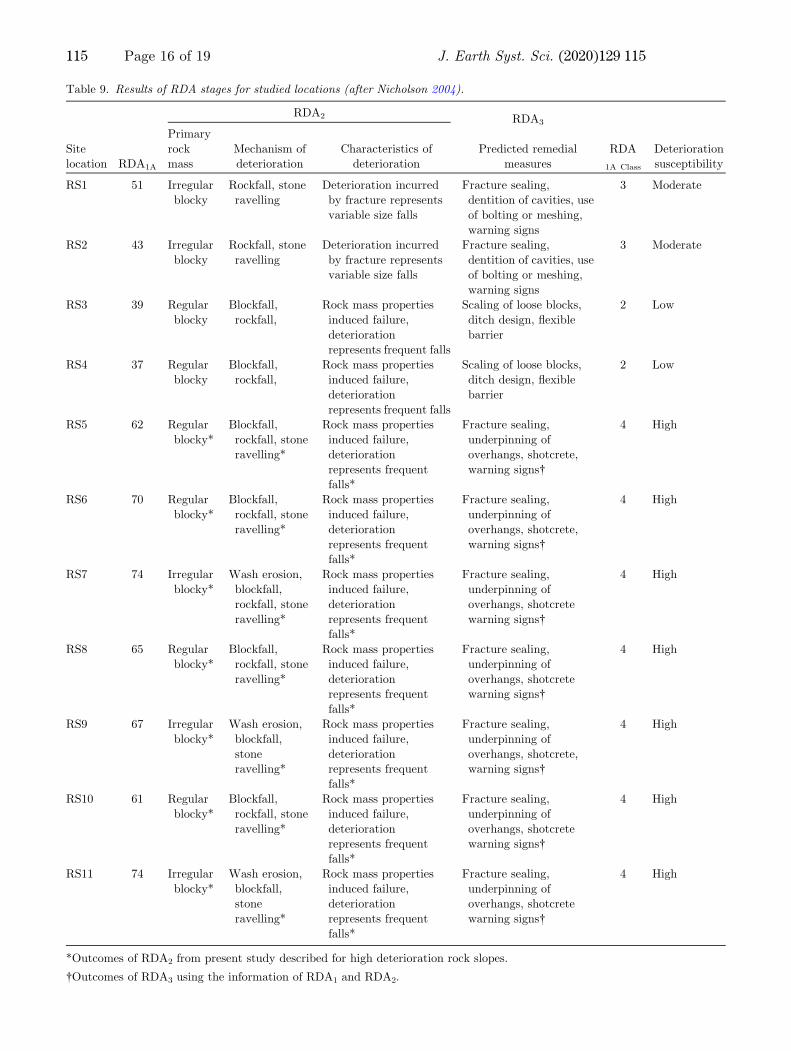
Table 9. Results of RDA stages for studied locations (after Nicholson 2004).
Site
location RDA1A
RDA2 RDA3
RDA
1A Class
Deterioration
susceptibility
Primary
rock
mass
Mechanism of
deterioration
Characteristics of
deterioration
Predicted remedial
measures
RS1 51 Irregular
blocky
Rockfall, stone
ravelling
Deterioration incurred
by fracture represents
variable size falls
Fracture sealing,
dentition of cavities, use
of bolting or meshing,
warning signs
3 Moderate
RS2 43 Irregular
blocky
Rockfall, stone
ravelling
Deterioration incurred
by fracture represents
variable size falls
Fracture sealing,
dentition of cavities, use
of bolting or meshing,
warning signs
3 Moderate
RS3 39 Regular
blocky
Blockfall,
rockfall,
Rock mass properties
induced failure,
deterioration
represents frequent falls
Scaling of loose blocks,
ditch design, Cexible
barrier
2 Low
RS4 37 Regular
blocky
Blockfall,
rockfall,
Rock mass properties
induced failure,
deterioration
represents frequent falls
Scaling of loose blocks,
ditch design, Cexible
barrier
2 Low
RS5 62 Regular
blocky*
Blockfall,
rockfall, stone
ravelling*
Rock mass properties
induced failure,
deterioration
represents frequent
falls*
Fracture sealing,
underpinning of
overhangs, shotcrete,
warning signs�
4 High
RS6 70 Regular
blocky*
Blockfall,
rockfall, stone
ravelling*
Rock mass properties
induced failure,
deterioration
represents frequent
falls*
Fracture sealing,
underpinning of
overhangs, shotcrete,
warning signs�
4 High
RS7 74 Irregular
blocky*
Wash erosion,
blockfall,
rockfall, stone
ravelling*
Rock mass properties
induced failure,
deterioration
represents frequent
falls*
Fracture sealing,
underpinning of
overhangs, shotcrete
warning signs�
4 High
RS8 65 Regular
blocky*
Blockfall,
rockfall, stone
ravelling*
Rock mass properties
induced failure,
deterioration
represents frequent
falls*
Fracture sealing,
underpinning of
overhangs, shotcrete
warning signs�
4 High
RS9 67 Irregular
blocky*
Wash erosion,
blockfall,
stone
ravelling*
Rock mass properties
induced failure,
deterioration
represents frequent
falls*
Fracture sealing,
underpinning of
overhangs, shotcrete,
warning signs�
4 High
RS10 61 Regular
blocky*
Blockfall,
rockfall, stone
ravelling*
Rock mass properties
induced failure,
deterioration
represents frequent
falls*
Fracture sealing,
underpinning of
overhangs, shotcrete
warning signs�
4 High
RS11 74 Irregular
blocky*
Wash erosion,
blockfall,
stone
ravelling*
Rock mass properties
induced failure,
deterioration
represents frequent
falls*
Fracture sealing,
underpinning of
overhangs, shotcrete
warning signs�
4 High
*Outcomes of RDA2 from present study described for high deterioration rock slopes.
�Outcomes of RDA3 using the information of RDA1 and RDA2.
115 Page 16 of 19 J. Earth Syst. Sci. (2020) 129:115
ravelling. RDA3 describes the remedial measurethat can be applied eDcaciously in the Beld underconsideration. Studied locations can be stabilisedby underpinning, fracture sealing, construction ofCexible barriers, designing of ditches in RS1–RS4,scaling of overhanging blocks with shotcreting incase of the weathered face in case of RS5–RS11(table 9). Research investigation shows primarilyregular blocky rock mass with the mostappropriate mechanism of deterioration beingblockfall/rockfall for RS5, RS6, RS8 and RS10with possible wash erosion at RS7, RS9 and RS11.
5. Conclusions
The significance of this paper relies on the resultsgenerated by the classiBcation studies done onbasaltic rock slopes. The deterioration processleads to the progressive degradation of rock massstrength, which increases the differential instabil-ity condition. Kinematic analysis proves to becrucial in achieving failure modes and most sus-ceptible zones eDciently. It serves to be a crucialtool to access the probability of failure. It is notsuitable for random fracture in a rock mass. Thuscritical joint orientations are only evaluated. Thedetected block failures that are governed byunfavourable joint orientations match with thefailure type seen in the Beld condition. Charac-terisation performed shows that RMRbasic repre-sents fair to good class rock slopes that underminethe actual Beld scenario. This result is taken up forSMR and CSMR calculation. SMR, the discreteform, shows that RS1–RS4 is partially stable to-wards wedge type failure and minor chances oftoppling failure may occur. RS5–RS11 are unsta-ble to completely unstable for wedge failure andneeds immediate action. CSMR, the continuousform, gives a Brm agreement to the results ofSMR. These are summed up with GSI observa-tions using Morelli (2017) chart over Somnez andUllusay (1999) chart. A generalised equation isformulated, achieving a good correlation betweenGSI2017 and GSI1999 and serves to be an alterna-tive for RMRbasic values in the Beld. The presentresearch elaborates and suggests some new classesin RDA classiBcation for igneous rock slopes thatare susceptible to high deterioration. A good cor-relation is obtained between RDA and RMRbasic,which implies the impact of weathering as themost inCuential factor in slope instability. SlopeRS1–RS4 conBrms to be regular blocky as it falls
in class 2 and class 3, since these slopes are gov-erned by structure driven failure and observedmechanism may occur as rockfall or blockfall.Thus, bolting or drape meshing with fracturesealing can be considered as eAective remedialmeasure along this busy highway. RS5–RS11 arehigh deterioration slopes for which probable rockmass and deterioration mechanisms are introducedin this paper. The proposed RDA classes forigneous rock slopes were made based on essentialRDA parameters that were well veriBed in theBeld conditions. Primary rock masses have beenobserved from the study are blocky (regular andirregular). RS7, RS9 and RS11 are highly weath-ered rock slopes and thus are the most vulnerablefor which shotcreting and underpinning of over-hangs is necessary to stop weathering fromapproaching its interior parts.Based on the current study, it can be suggested
that RDA performs well for high deteriorationigneous rock masses as compared to other geo-engineering systems. In the preliminary stage ofslope stability analysis, it provides valuable infor-mation regarding weathering related impactincorporated with detailed kinematic analysis.
Acknowledgements
The authors express their sincere gratitude to IndianInstitute of Technology (Indian School of Mines)Dhanbad, for the grant and providing Bnancial sup-port. The authors are also thankful to Rock Scienceand Rock Engineering (RSRE) Laboratory, IndianInstitute of Technology Bombay, for allowing toperform experiments and geotechnical tests.
References
Alexander P O 1981 Age and duration of Deccan volcanism:K–Ar evidence, Deccan volcanism and related basaltprovinces in other parts of the world; J. Geol. Soc. IndiaMemoir 3 224–258.
Ahmad M, Umrao R K, Ansari M K, Singh R and Singh T N2013 Assessment of rockfall hazard along the road cutslopes of State Highway-72, Maharashtra, India; Geomate-rials 3(1) 15–23.
Anbalagan R, Sharma S and Raghuvanshi T K 1992 Rockmass stability evaluation using modiBed SMR approach; In:Proceeding of 6th national symposium on rock mechanics,Bangalore, India, pp. 258–268.
Ansari M K, Ahmad M, Singh R and Singh T N 2012 Rockfallassessment near Saptashrungi Gad temple, Nashik, Maha-rashtra, India; Int. J. Disaster Risk Reduct. 2 77–83.
J. Earth Syst. Sci. (2020) 129:115 Page 17 of 19 115

Basahel H and Mitri H 2017 Application of rock massclassiBcation systems to rock slope stability assessment: Acase study; J. Rock Mech. Geotech. Eng. 9 993–1009.
Beane J E, Turner C A, Hooper P R, Subbarao K V and WalshJ N 1986 Stratigraphy, composition and form of the DeccanBasalts, Western Ghats, India; Bull. Volcanol. 48(1)61–83.
Bieniawski Z T 1973 Engineering classiBcation of jointed rockmasses; Trans. South African Instit. Civil Eng. 15 335–344.
Bieniawski Z T 1976 Rock mass classiBcation in rockengineering; In: Proceedings of the Exploration for rockengineering symposium, Cape Town, Balkema, pp. 97–106.
Bieniawski Z T 1979 The geomechanics classiBcation in rockengineering application; In: Proceedings of 4th Inter-national Congress on Rock Mechanics, Montreux, 2–8September 1979, pp. 41–48.
Bieniawski Z T 1989 Engineering rock mass classiBcation;Wiley, New York, 251p.
Bieniawski Z T 1993 ClassiBcation of rock masses forengineering. The RMR system and future trends; In:Comprehensive Rock Engineering (ed.) Hudson J A, Perg-amon 3 553–573.
Bowen N 1922 The reaction principle in petrogenesis; J. Geol.30(3) 177–198.
Cai M, Kaiser P K, Uno H, Tasaka Y and Minami M 2004Estimation of rock mass deformation modulus and strengthof jointed hard rock masses using the GSI system; Int.J. Rock Mech. Min. Sci. 41 3–19.
Carter T G and Marinos V 2014 Use of GSI for rockengineering design; In: Proceedings 1st International con-ference on applied empirical design methods in mining,9–11th June 2014, Lima–Peru.
Chowdhury R and Flentje P 2002 Uncertainties in rainfall-induced landslide hazard; Quart. J. Eng. Geol. Hydrogeol.35 61–70.
Goodman R E and Bray J W 1976 Toppling of rock slopes; In:Proceeding of speciality conference on rock engineering forfoundations and slopes, American Society of Civil Engineers(ASCE), Boulder, Colorado, 2 201–234.
Hoek E 1994 Strength of rock and rock masses; ISRM News J.2(2) 4–16.
Hoek E and Bray J W 1981 Rock slope engineering; 3rd edn,The Institution of Mining and Metallurgy, London.
Hoek E and Brown E T 1997 Practical estimates of rock massstrength; Int. J. Rock Mech. Min. Sci. 34(8) 1165–1186.
Hoek E, Carter T G and Diederichs M S 2013 QuantiBcationof the geological strength index chart; In: 47th US rockmechanics/geomechanics symposium San Francisco, 23–26June 2013.
Hoek E, Marinos P and Benissi M 1998 Applicability of thegeological strength index (GSI) classiBcation for weak andsheared rock masses, The case of the Athens Schistformation;, Bull. Eng. Geol. Environ. 57(2) 151–160.
Hoek E, Marinos P and Marinos V 2005 Characterisation andengineering properties of tectonically undisturbed butlithologically varied sedimentary rock masses; Int. J. RockMech. Min. Sci. 42 277–285.
Kainthola A, Singh P K, Wasnik A B, Sazid M and Singh T N2012 Distinct element modelling of Mahabaleshwar roadcut hill slope; Geomaterials 2 105–113.
Krishnan M S 1953 The structural and tectonic history ofIndia; Geol. Surv. India Memoir 81 1–109.
Kundu J, Sarkar K, Tripathy A and Singh T N 2017Qualitative stability assessment of cut slopes alongthe National Highway-05 around Jhakri area, HimachalPradesh, India; J. Earth Syst. Sci. 126 112.
Marinos P and Hoek E 2000 GSI: A geologically friendly toolfor rock mass strength estimation; In: Proceeding ofGeoEng 2000 at the international conference on geotechni-cal and geological engineering (Melbourne, Victoria, Aus-tralia), Technomic Publishers, Lancaster, pp. 1422–1446.
Marinos P and Hoek E 2001 Estimating the geotechnicalproperties of heterogeneous rock masses such as Cysch; Bull.Eng. Geol. Environ. 60 82–92.
Marinos P, Hoek E and Marinos V 2006 Variability of theengineering properties of rock masses quantiBed by thegeological strength index: The case of ophiolites withspecial emphasis on tunnelling; Bull. Eng. Geol. Environ.65 129–142.
Marinos P, Marinos V and Hoek E 2007 Geological StrengthIndex (GSI): A characterization tool for assessing engineer-ing properties for rock masses; In: Underground worksunder special conditions (eds) Romana, Perucho and OlallaLisbon, Taylor and Francis, pp. 13–21.
Morelli G L 2017 Alternative quantiBcation of the geologicalstrength index chart for jointed rocks; Geotech. Geol. Eng.35(6) 2803–2816.
Nicholson D T 2000 Deterioration of excavated rockslopes:Mechanisms, morphology and assessment; 393p.
Nicholson D T 2004 Hazard assessment for progressive,weathering-related breakdown of excavated rockslopes;Quart. J. Eng. Geol. Hydrogeol. 37 327–346.
Nicholson D T and Hencher S R 1997 Assessing the potentialfor deterioration of engineered rockslopes; In: EngineeringGeology and the Environment (eds) Marinos P G, Koukis GC, Tsiambaos G C and Stournaras G C, Balkema, Rotter-dam, pp. 911–917.
Niyogi A, Sarkar K and Singh T N 2016 EAect of geome-chanical properties on the stability of basaltic road cutslopes at Ratnagiri, Maharashtra; In: Proceedings ofINDOROCK 2016: 6th Indian rock conference 16–17 June2016, Indian Institute of Technology Bombay, Mumbai,pp. 854–862.
Niyogi A, Sahay A, Singh A K, Sarkar K and Singh T N 2017Rockfall hazard analysis of road cut slope along NH-66 nearSangameshwar, Ratnagiri using rigid body model; In: ILC2017: 4th Indian Landslide Congress, 8–9 December 2017,Indian Institute of Technology Bombay, Mumbai, Abstract57.
Palmstrom A 1982 The volumetric joint count – a useful andsimple measure of the degree of jointing; In: Proceedings of4th International Congress IAEG, New Delhi, pp. 221–228.
Pradhan S P, Vishal V and Singh T N 2018 Finite elementmodelling of landslide prone slopes around Rudraprayagand Agastyamuni in Uttarakhand Himalayan terrain; Nat.Hazards 94(1) 181–200.
Rocscience 2015 Dips, v6.0, Rocscience Inc., Toronto.Romana M 1985 New adjustment ratings for application of
Bieniawski classiBcation to slopes; In: International sym-posium on the role of rock mechanics ISRM, Zacatecas,pp. 49–53.
Romana M 1991 SMR classiBcation; In: Proceedings of the 7thcongress on rock mechanics 2, ISRM, Aachen, Germany,Balkema, Rotterdam, pp. 955–960.
115 Page 18 of 19 J. Earth Syst. Sci. (2020) 129:115
Romana M 1993 A geomechanical classiBcation for slopes:Slope mass rating; In: Comprehensive Rock Engineering(ed.) Hudson J A, Pergamon Press, Oxford, pp. 575–600.
Romana M 1995 The geomechanics classiBcation SMR forslope correction; In: Proceedings of the 8th InternationalISRM Congress, pp. 1085–1092.
Romana M, Seron J B and Montalar E 2001 La ClasiBcaciongeomecanica SMR. Aplicacion experencias y validacion;In: V Simposio Nacional de Laderas Inestables, Madrid,pp. 575–600.
Romana M, Seron J B and Montalar E 2003 SMR geo-mechanics classiBcation: Application, experience and vali-dation; In: ISRM – Technology roadmap for rock mechan-ics, South Afr. Instit. Min. Metall., pp. 1–4.
Sarkar K, Singh A K, Niyogi A, Behera P K, Verma A K andSingh T N 2016 The assessment of slope stability alongNH-22 in Rampur–Jhakri Area, Himachal Pradesh; J. Geol.Soc. India 88 387–393 .
Sastri V V 1981 Observations on the age of Deccan Traps andrelated trap activity in India; Geol. Surv. India Memoir 3296–299.
Selby M J 1980 A rock mass strength classiBcation forgeomorphic purposes: With tests from Antarctica andNew Zealand; Geomorphology 24 31–51.
Sharma L K, Umrao R K, Singh R, Ahmad M and Singh T N2016 Geotechnical characterization of road cut hill slopeforming unconsolidated geo-materials: A case study;Geotech. Geol. Eng. 1–13.
Sharma L K, Umrao R K, Singh R, Ahmad M and Singh T N2017 Stability investigation of hill cut soil slopes alongnational highway 222 at Malshej Ghat, Maharashtra;J.Geol. Soc. India 89(2) 165–174.
Singh P K, Wasnik A B, Kainthola A, Sazid M and Singh T N2013 The stability of road cut cliA face along SH-121: A casestudy; Nat. Hazards 68(2) 497–507.
Singh T N, Singh R, Singh B, Sharma L K, Singh R and AnsariM K 2016 Investigations and stability analyses of Malinvillage landslide of Pune district, Maharashtra, India; Nat.Hazards 81(3) 2019–2030.
Siddique T, Pradhan S P, Vishal V, Mondal M E A and SinghT N 2017 Stability assessment of Himalayan road cut slopesalong National Highway 58, India; Environ. Earth Sci. 76759.
Sonmez H and Ulusay R 1999 ModiBcations to the geologicalstrength index (GSI) and their applicability to thestability of slopes; Int. J. Rock Mech. Min. Sci. 36743–760.
Tom�as R, Delgado J and Ser�on J B 2007 ModiBcation of slopemass rating (SMR) by continuous functions; Int. J. RockMech. Min. Sci. 44 1062–1069.
Tugrul A and G€urpinar O 1997 A proposed weatheringclassiBcation for basalts and their engineering properties;Bull. Eng. Geol. Environ. 55 61–71.
Zhang L 2016 Determination and applications of rock qualitydesignation (RQD); J. Rock Mech. Geotech. Eng. 8389–397.
Corresponding editor: N V CHALAPATHI RAO
J. Earth Syst. Sci. (2020) 129:115 Page 19 of 19 115