Genworth Mortgage Insurance...
20
Genworth Mortgage Insurance Australia 1Q 2015 Financial results presentation 29 April 2015 ©2015 Genworth Mortgage Insurance Australia Limited. All rights reserved.
Transcript of Genworth Mortgage Insurance...
Genworth Mortgage Insurance Australia 1Q 2015 Financial results presentation
29 April 2015
©2015 Genworth Mortgage Insurance Australia Limited. All rights reserved.
1Q 2015 RESULTS PRESENTATION • produced by GENWORTH AUSTRALIA • 1
Disclaimer
This presentation contains general information in summary form which is current as at 31 March 2015, unless otherwise stated. It may present financial information on both a
statutory basis (prepared in accordance with Australian accounting standards which comply with International Financial Reporting Standards (IFRS) and non-IFRS basis. The
Pro Forma financial information in this report is prepared on the same basis as disclosed in the Genworth Mortgage Insurance Australia Limited (GMA) IPO prospectus lodged
by GMA with the Australian Securities and Investments Commission on 23 April 2014, which reflected the post reorganisation structure. Refer to Section 7.1 and 7.2 of GMA
IPO prospectus for detailed information.
This presentation is not a recommendation or advice in relation to GMA or any product or service offered by GMA’s subsidiaries. It is not intended to be relied upon as advice to
investors or potential investors, and does not contain all information relevant or necessary for an investment decision. It should be read in conjunction with GMA’s other periodic
and continuous disclosure announcements filed with the Australian Securities Exchange (ASX), and in particular the Full Year Financial Report for the full year ended 31
December 2014. These are also available at www.genworth.com.au.
No representation or warranty, express or implied, is made as to the accuracy, adequacy or reliability of any statements, estimates or opinions or other information contained in
this presentation. To the maximum extent permitted by law, GMA, its subsidiaries and their respective directors, officers, employees and agents disclaim all liability and
responsibility for any direct or indirect loss or damage which may be suffered by any recipient through use of or reliance on anything contained in or omitted from this
presentation. No recommendation is made as to how investors should make an investment decision. Investors must rely on their own examination of GMA, including the merits
and risks involved. Investors should consult with their own professional advisors in connection with any acquisition of securities.
The information in this report is for general information only. To the extent that certain statements contained in this report may constitute “forward-looking statements” or
statements about “future matters”, the information reflects GMA’s intent, belief or expectations at the date of this report. GMA gives no undertaking to update this information
over time (subject to legal or regulatory requirements). Any forward-looking statements, including projections, guidance on future revenues, earnings and estimates, are
provided as a general guide only and should not be relied upon as an indication or guarantee of future performance. Forward-looking statements involve known and unknown
risks, uncertainties and other factors that may cause GMA’s actual results, performance or achievements to differ materially from any future results, performance or
achievements expressed or implied by these forward-looking statements. Any forward-looking statements, opinions and estimates in this report are based on assumptions and
contingencies which are subject to change without notice, as are statements about market and industry trends, which are based on interpretations of current market conditions.
Neither GMA, nor any other person, gives any representation, assurance or guarantee that the occurrence of the events expressed or implied in any forward-looking
statements in this report will actually occur. In addition, please note that past performance is no guarantee or indication of future performance.
This presentation does not constitute an offer to issue or sell securities or other financial products in any jurisdiction. The distribution of this report outside Australia may be
restricted by law. Any recipient of this presentation outside Australia must seek advice on and observe any such restrictions. This presentation may not be reproduced or
published, in whole or in part, for any purpose without the prior written permission of GMA. Local currencies have been used where possible. Prevailing current exchange rates
have been used to convert foreign currency amounts into Australian dollars, where appropriate. All references starting with “FY” refer to the financial year ended 31 December.
For example, “FY14” refers to the year ended 31 December 2014. All references starting with “1Q” refer to the financial quarter ended 31 March. For example, “1Q15” refers
to the quarter ended 31 March 2015. All references to “prior corresponding period (pcp)” refer to the three months ended 31 March 2014.
Genworth Mortgage Insurance Australia Limited ABN 72 154 890 730 ® Genworth, Genworth Financial and the Genworth logo are registered service marks of Genworth
Financial, Inc and used pursuant to license.

1Q 2015 RESULTS PRESENTATION • produced by GENWORTH AUSTRALIA • 2
Overview of 1Q 2015 financial performance
Underlying Net Profit After Tax (NPAT1) for 1Q15 of $69.7m
Reported NPAT for 1Q15 of $89.5m and includes $19.8m of post tax mark-to-market gains
New Insurance Written (NIW) for 1Q15 of $7.2bn compared to $8.7bn for the pcp
Gross Written Premium (GWP) for 1Q15 of $127.7m, down 20.0% compared to pcp
Net Earned Premium (NEP) for 1Q15 of $110.8m, an increase of 2.4% compared to pcp
Closing delinquencies of 5,378 up from 4,953 as at 31 December 2014
– Delinquencies up by 425 to 5,378 as at 31 March 2015 reflecting seasonality
– Delinquency rate up 0.03% to 0.36% compared to last quarter and up 0.02% compared to pcp
The normalised 1Q15 loss ratio is 25.3%2 which excludes a $9.6m accrual for expected recoveries related to paid
claims, up from 15.9% in the pcp. The reported loss ratio for the quarter is 16.6%.
Investment income for 1Q15 of $68.7m pre tax (includes $28.3m (pre tax) of mark-to-market gains)
Strong stable balance sheet with $1.4bn of Unearned Premium Reserve (UPR)
Cash and fixed interest Investment portfolio of $4.1bn with 2.5 year duration
Regulatory capital solvency ratio 163% on a level 2 basis3
1. Underlying NPAT excludes the after tax impact of unrealised gains/(losses) on the investment portfolio.
2. When claims are paid, GMA (through its operating subsidiaries) typically obtains a legally enforceable assignment of the borrowers’ debt from the lender. Where there is a
reasonable prospect of recovery, GMA will actively engage in collection activities to recover monies owed as a result of these assignments. Based on a history of successful
collection activities over the last few years and the current economic conditions, an expected recovery rate was established and a recovery accrual related to claims paid was
recorded.
3. Level 2 solvency ratio is only required to be calculated and submitted to APRA on a semi-annual basis. Quarterly estimates have not been audited.
1Q 2015 RESULTS PRESENTATION • produced by GENWORTH AUSTRALIA • 3
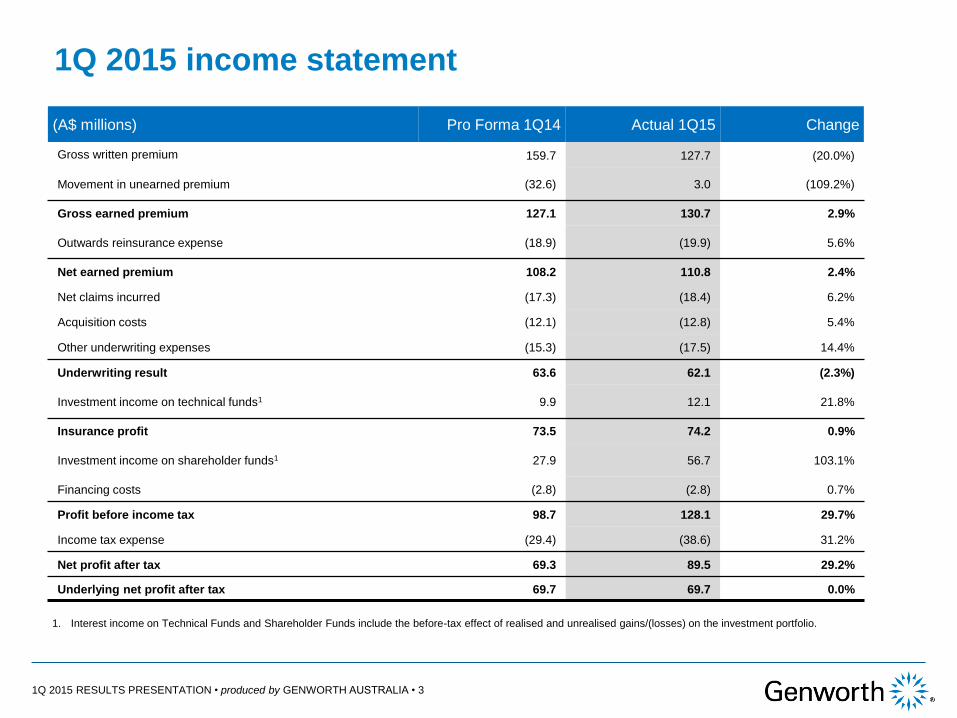
1Q 2015 income statement
1. Interest income on Technical Funds and Shareholder Funds include the before-tax effect of realised and unrealised gains/(losses) on the investment portfolio.
(A$ millions) Pro Forma 1Q14 Actual 1Q15 Change
Gross written premium 159.7 127.7 (20.0%)
Movement in unearned premium (32.6) 3.0 (109.2%)
Gross earned premium 127.1 130.7 2.9%
Outwards reinsurance expense (18.9) (19.9) 5.6%
Net earned premium 108.2 110.8 2.4%
Net claims incurred (17.3) (18.4) 6.2%
Acquisition costs (12.1) (12.8) 5.4%
Other underwriting expenses (15.3) (17.5) 14.4%
Underwriting result 63.6 62.1 (2.3%)
Investment income on technical funds1 9.9 12.1 21.8%
Insurance profit 73.5 74.2 0.9%
Investment income on shareholder funds1 27.9 56.7 103.1%
Financing costs (2.8) (2.8) 0.7%
Profit before income tax 98.7 128.1 29.7%
Income tax expense (29.4) (38.6) 31.2%
Net profit after tax 69.3 89.5 29.2%
Underlying net profit after tax 69.7 69.7 0.0%

1Q 2015 RESULTS PRESENTATION • produced by GENWORTH AUSTRALIA • 4
Residential mortgage lending market Investment vs. Owner Occupied (APRA statistic)
• Investment property lending represented 37.1% of
originations for the year ended 31 Dec 2014
Sources: APRA Quarterly ADI property exposures statistics (ADIs new housing loan approvals),
December 2014. Statistics are as per information reported to APRA by ADIs with greater than $1
billion in housing term loans as at the end of the relevant quarter, thereby excluding small lenders and
non-banks.
$ bn, %
Investment vs. Owner Occupied1 (GMA)
• Investment property lending represented 25.1% of
originations for the year ended 31 Dec 2014
151.0 186.7
158.8 164.1 172.2 196.3 211.6
68.2
75.6
81.3 77.7 84.0
104.8
124.9
31.1%
28.8%
33.9%
32.1% 32.8%
34.8%
37.1%
2008 2009 2010 2011 2012 2013 2014
Owner Occupied Investment Investment as a % of Total
30.1 31.4 24.1 24.2 25.7 25.9 27.1
14.6 10.2
7.7 6.6 8.1 9.5 9.1
32.7%
24.6% 24.2%
21.5%
23.8%
26.8% 25.1%
2008 2009 2010 2011 2012 2013 2014
Owner Occupied Investment Investment as a % of Total
$bn, %
1. Owner occupied includes loans for owner occupied and other types.
1Q 2015 RESULTS PRESENTATION • produced by GENWORTH AUSTRALIA • 5
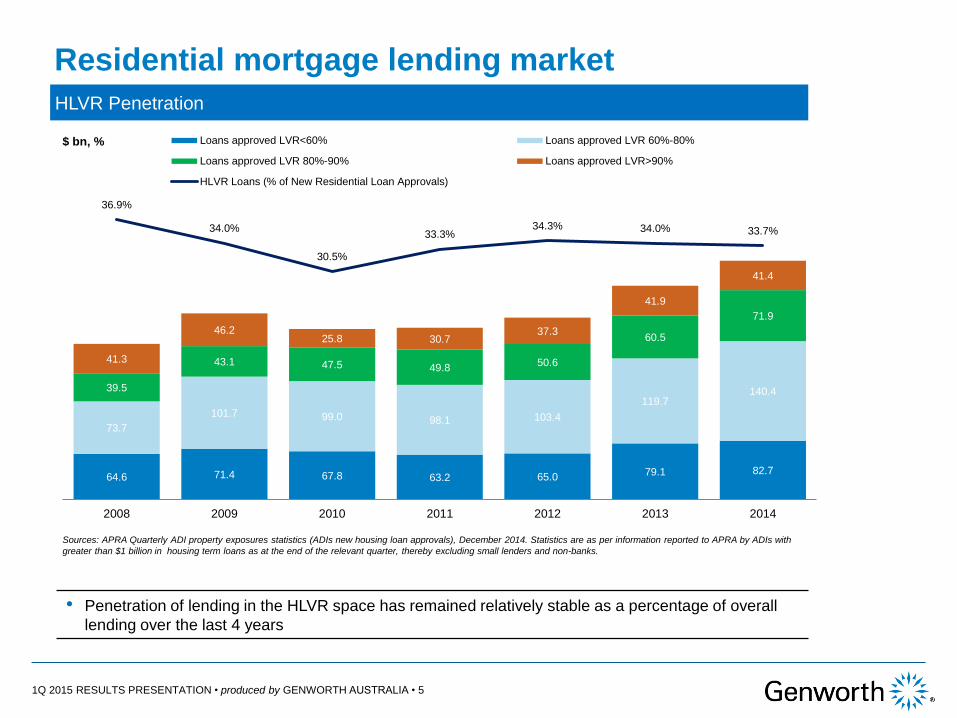
Residential mortgage lending market HLVR Penetration
• Penetration of lending in the HLVR space has remained relatively stable as a percentage of overall
lending over the last 4 years
Sources: APRA Quarterly ADI property exposures statistics (ADIs new housing loan approvals), December 2014. Statistics are as per information reported to APRA by ADIs with
greater than $1 billion in housing term loans as at the end of the relevant quarter, thereby excluding small lenders and non-banks.
$ bn, %
64.6 71.4 67.8 63.2 65.0 79.1 82.7
73.7
101.7 99.0 98.1 103.4
119.7 140.4 39.5
43.1 47.5 49.8 50.6
60.5
71.9
41.3
46.2 25.8 30.7
37.3
41.9
41.4
36.9%
34.0%
30.5%
33.3% 34.3% 34.0% 33.7%
2008 2009 2010 2011 2012 2013 2014
Loans approved LVR<60% Loans approved LVR 60%-80%
Loans approved LVR 80%-90% Loans approved LVR>90%
HLVR Loans (% of New Residential Loan Approvals)
1Q 2015 RESULTS PRESENTATION • produced by GENWORTH AUSTRALIA • 6
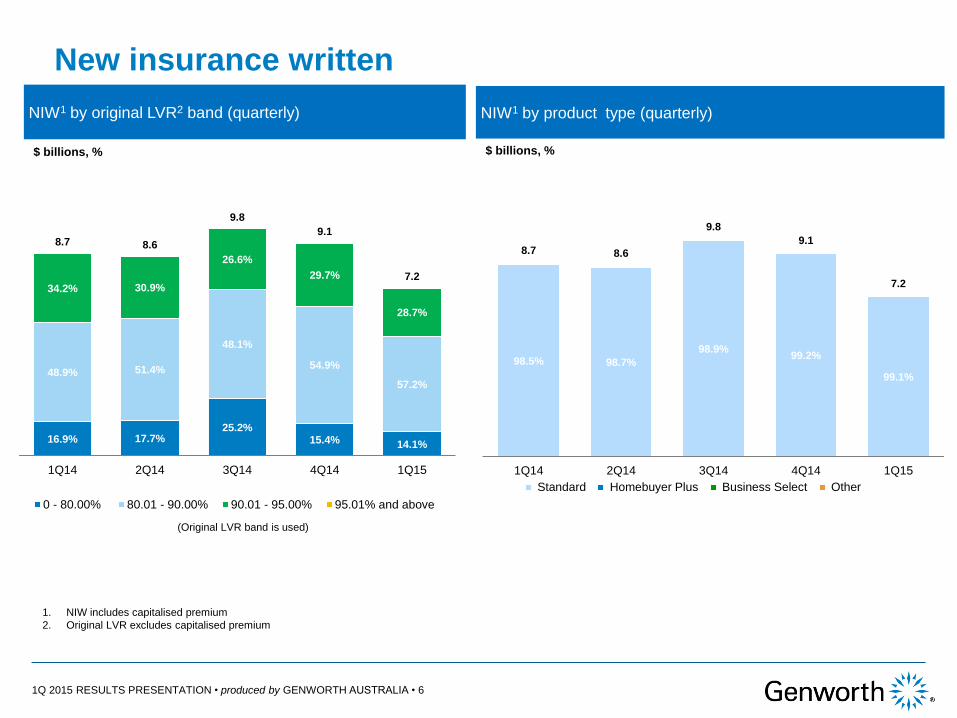
NIW1 by product type (quarterly)
NIW1 by original LVR2 band (quarterly)
$ billions, %
New insurance written
1. NIW includes capitalised premium
2. Original LVR excludes capitalised premium
98.5% 98.7%
98.9% 99.2%
99.1%
0.3%
8.7 8.6
9.8
9.1
7.2
1Q14 2Q14 3Q14 4Q14 1Q15
Standard Homebuyer Plus Business Select Other
$ billions, %
16.9% 17.7% 25.2%
15.4% 14.1%
48.9% 51.4%
48.1%
54.9%
57.2%
34.2% 30.9%
26.6%
29.7%
28.7%
8.7 8.6
9.8
9.1
7.2
1Q14 2Q14 3Q14 4Q14 1Q15
0 - 80.00% 80.01 - 90.00% 90.01 - 95.00% 95.01% and above
(Original LVR band is used)

1Q 2015 RESULTS PRESENTATION • produced by GENWORTH AUSTRALIA • 7
Insurance in force IIF1 by product type, as at 31
December 2014 and 31 March 2015
Insurance in force (IIF)1 by original LVR2 band as at 31
December 2014 and 31 March 2015
Total IIF $316 billion as at 31 March 2015
89%
6% 3% 1% 1%
89%
6% 3% 1% 1%
Standard Low Doc Homebuyer Plus Business Select Other
31 Dec 14 31 Mar 15
9% 6%
16%
8%
29% 30%
2%
9% 6%
16%
8%
29% 30%
2%
<60% 60.01-70% 70.01-80% 80.01-85% 85.01-90% 90.01-95% 95% +
31 Dec 14 31 Mar 15
NIW1 by loan type, as at 31
December 2014 and 31 March 2015
%
1. NIW and IIF includes capitalised premium
2. Original LVR excludes capitalised premium
IIF1 by loan type, as at 31 March 2015
%
Investment, 25%
Owner occupied, 75%
%
75%
25%
75%
25%
Owner Occupied Investment
31 Dec 14 31 Mar 15
1Q 2015 RESULTS PRESENTATION • produced by GENWORTH AUSTRALIA • 8
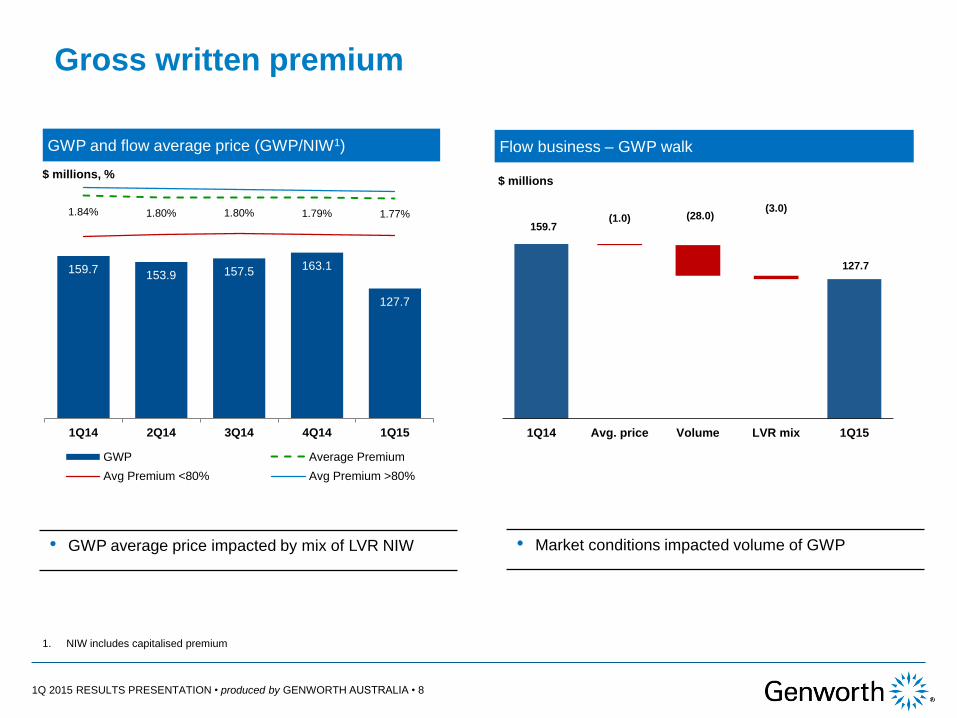
GWP and flow average price (GWP/NIW1)
Gross written premium
Flow business – GWP walk
159.7 (1.0) (28.0)
(3.0)
127.7
1Q14 Avg. price Volume LVR mix 1Q15
$ millions
1. NIW includes capitalised premium
159.7 153.9 157.5
163.1
127.7
1.84% 1.80% 1.80% 1.79% 1.77%
1Q14 2Q14 3Q14 4Q14 1Q15
GWP Average Premium
Avg Premium <80% Avg Premium >80%
$ millions, %
• Market conditions impacted volume of GWP • GWP average price impacted by mix of LVR NIW
1Q 2015 RESULTS PRESENTATION • produced by GENWORTH AUSTRALIA • 9
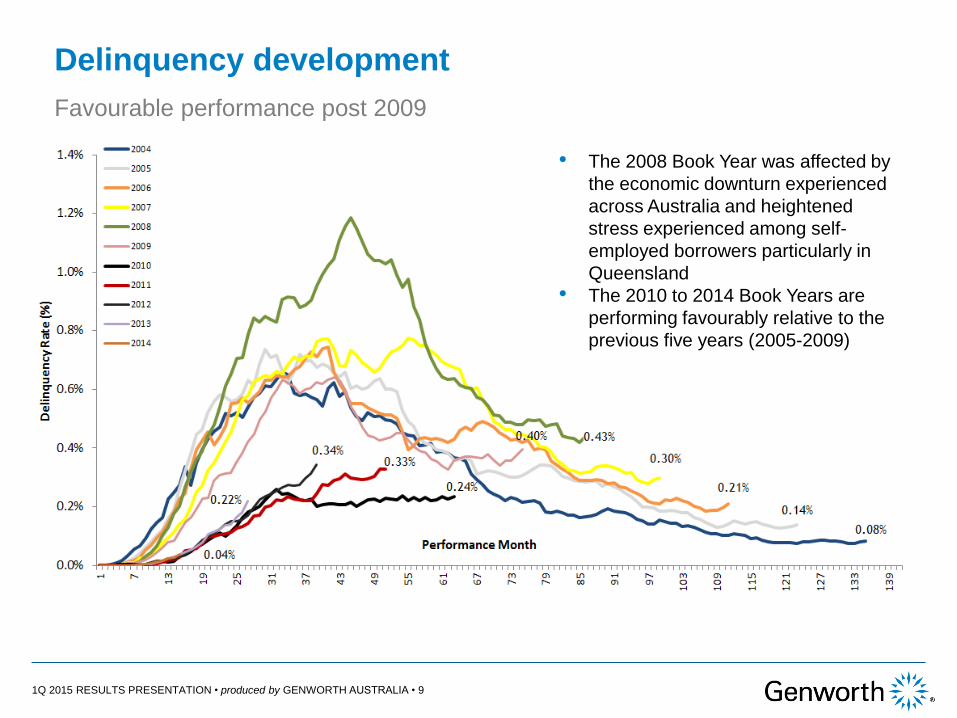
Delinquency development
Favourable performance post 2009
• The 2008 Book Year was affected by
the economic downturn experienced
across Australia and heightened
stress experienced among self-
employed borrowers particularly in
Queensland
• The 2010 to 2014 Book Years are
performing favourably relative to the
previous five years (2005-2009)

1Q 2015 RESULTS PRESENTATION • produced by GENWORTH AUSTRALIA • 10
Net incurred claims
Composition of net incurred claims (A$ millions) 1Q14 2Q14 3Q14 4Q14 1Q15
Number of paid claims (#) 462 419 350 314 280
Average paid claim ($’000) 65.1 60.5 58.6 49.6 62.5
Claims paid ($m) 30.1 25.3 20.5 15.6 17.5
Movement in reserves ($m) (12.8) 0.2 3.5 2.1 10.5
Net claims incurred ($m) 17.3 25.6 24.0 17.7 28.0
Loss ratio (%) 15.9% 23.2% 21.4% 15.3% 25.3%1
Average reserve per delinquency2
$’000
Average paid claim1
$’000
1. Average paid claim is calculated as claims handling expense and paid claims net of recoveries and divided by the number of claims paid for the relevant period. To demonstrate losses trend for
Q1 2015, average paid claims and loss ratio are adjusted before a $9.6m accrual for expected recoveries related to paid claims being recorded in Q1 2015. When claims are paid, GMA (through
its operating subsidiaries) typically obtains a legally enforceable assignment of the borrowers’ debt from the lender. Where there is a reasonable prospect of recovery, GMA will actively engage in
collection activities to recover monies owed as a result of these assignments. Based on a history of successful collection activities over the last few years and the current economic conditions, an
expected recovery rate was established and a recovery accrual related to claims paid was recorded (The reported loss ratio and reported average claim paid is 16.6% and $28,200 respectively).
2. Calculated under AIFRS, the outstanding claim provision is gross of non-reinsurance recoveries and divided by the number of delinquencies for the relevant period.
65.1 60.5 58.6
49.6
62.5
1Q14 2Q14 3Q14 4Q14 1Q15
44.4 41.7
43.3
46.6 45.0
1Q14 2Q14 3Q14 4Q14 1Q15

1Q 2015 RESULTS PRESENTATION • produced by GENWORTH AUSTRALIA • 11
1. Includes accrued investment income
2. Includes trade receivables, prepayments and plant and equipment
3. Includes reinsurance payables
(A$ in millions) 31 Dec 14 31 Mar 15
Assets
Cash and cash equivalents 88.6 187.5
Investments 1 4,112.0 3,959.0
Deferred reinsurance expense 80.6 129.6
Non-reinsurance recoveries 16.4 26.7
Deferred acquisition costs 124.5 126.4
Deferred tax assets 8.2 8.5
Goodwill & Intangibles 11.9 11.0
Other assets 2 7.1 7.6
Total assets 4,449.3 4,456.3
Liabilities Payables 3 209.3 277.4
Outstanding claims 230.9 242.2
Unearned premiums 1,362.6 1,359.6
Interest bearing liabilities 138.6 138.8
Employee provisions 7.4 7.6
Total liabilities 1,948.8 2,025.6
Net Assets 2,500.5 2,430.7
Unearned premium by book year as at 31 March 2015
Total UPR $1.36bn
2008 1%
2009 3%
2010 5%
2011 7%
2012 15%
2013 24%
2014 36%
2015 9%
Balance sheet and unearned premium reserve Strong stable balance sheet with $4.1bn in Cash and Investments and $1.36bn in
UPR

1Q 2015 RESULTS PRESENTATION • produced by GENWORTH AUSTRALIA • 12
Insurance ratio analysis
Combined ratio1
$ millions, %
Expenses
$ millions, %
12 month trailing underlying ROE
%
Insurance margin
%
67.9% 64.4%
60.4%
70.2% 67.0%
1Q14 2Q14 3Q14 4Q14 1Q15
12.1 12.0 11.9 13.0 12.8
15.3 18.7 17.6 17.3 17.5
25.3% 27.9%
26.3% 26.3% 27.3%
1Q14 2Q14 3Q14 4Q14 1Q15
Acq. costs Und. expense Exp. ratio
17.3 25.6 24.0
17.7 28.0
27.4
30.8
29.5
30.3
30.3
41.3% 51.2%
47.8%
41.6%
52.6%
1Q14 2Q14 3Q14 4Q14 1Q15
Net claims incurred Expenses Combined ratio
1. 1Q15 Combined ratio adjusted to exclude $9.6 million accrual as described on page 10 of this presentation.
11.7% 12.0% 11.9% 12.2% 12.4%
1Q14 2Q14 3Q14 4Q14 1Q15
1Q 2015 RESULTS PRESENTATION • produced by GENWORTH AUSTRALIA • 13
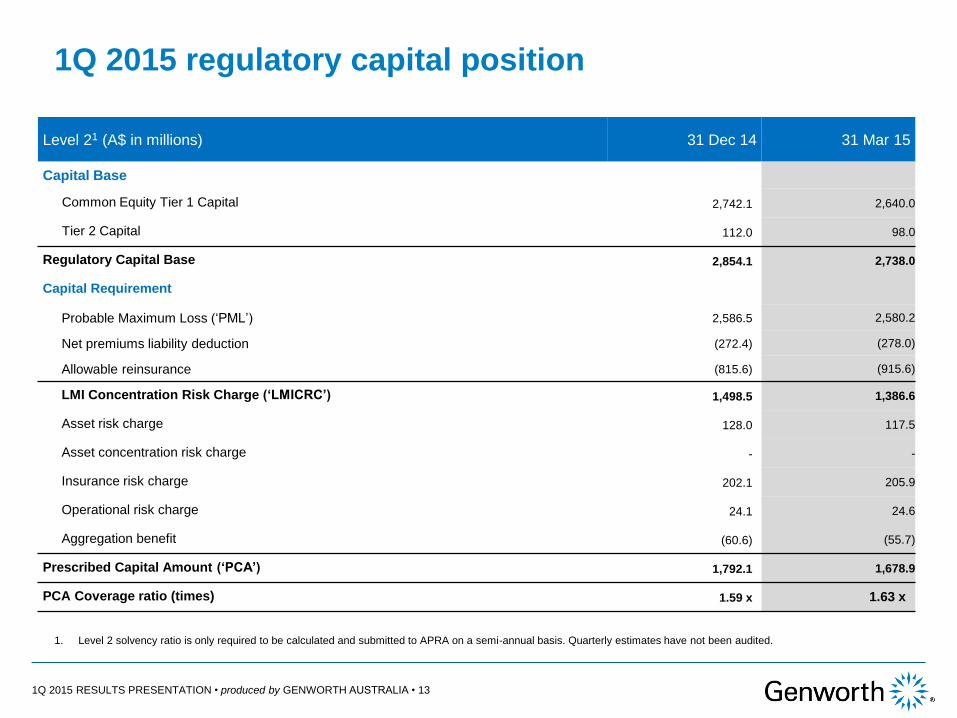
1Q 2015 regulatory capital position
Level 21 (A$ in millions) 31 Dec 14 31 Mar 15
Capital Base
Common Equity Tier 1 Capital 2,742.1 2,640.0
Tier 2 Capital 112.0 98.0
Regulatory Capital Base 2,854.1 2,738.0
Capital Requirement
Probable Maximum Loss (‘PML’) 2,586.5 2,580.2
Net premiums liability deduction (272.4) (278.0)
Allowable reinsurance (815.6) (915.6)
LMI Concentration Risk Charge (‘LMICRC’) 1,498.5 1,386.6
Asset risk charge 128.0 117.5
Asset concentration risk charge - -
Insurance risk charge 202.1 205.9
Operational risk charge 24.1 24.6
Aggregation benefit (60.6) (55.7)
Prescribed Capital Amount (‘PCA’) 1,792.1 1,678.9
PCA Coverage ratio (times) 1.59 x 1.63 x
1. Level 2 solvency ratio is only required to be calculated and submitted to APRA on a semi-annual basis. Quarterly estimates have not been audited.
1Q 2015 RESULTS PRESENTATION • produced by GENWORTH AUSTRALIA • 14
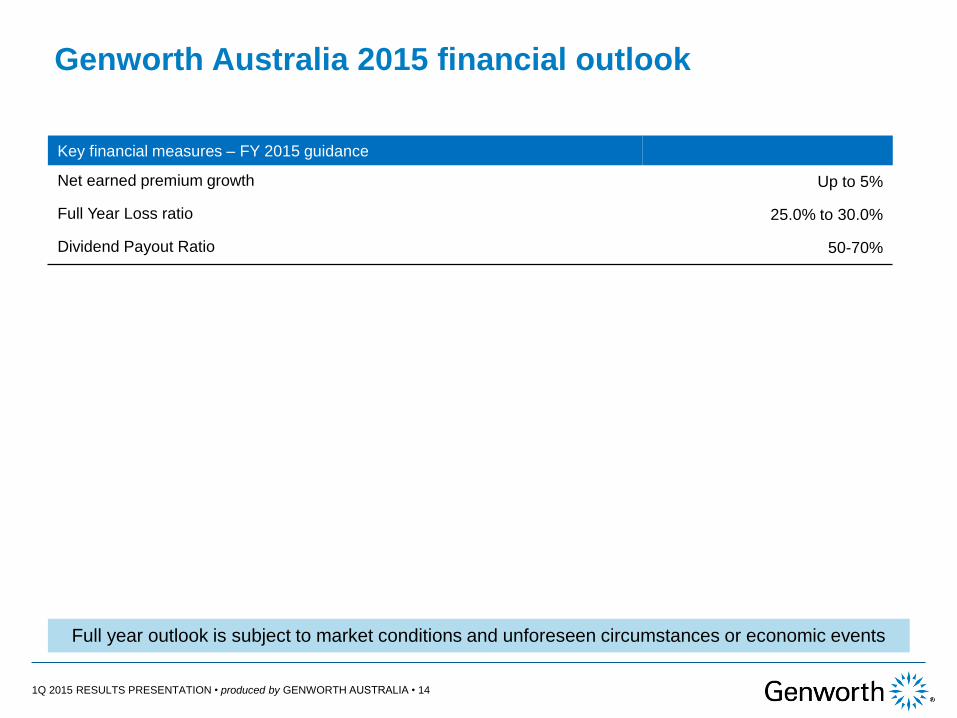
Genworth Australia 2015 financial outlook
Full year outlook is subject to market conditions and unforeseen circumstances or economic events
Key financial measures – FY 2015 guidance
Net earned premium growth Up to 5%
Full Year Loss ratio 25.0% to 30.0%
Dividend Payout Ratio 50-70%

Supplementary Slides
1Q 2015 RESULTS PRESENTATION • produced by GENWORTH AUSTRALIA • 16
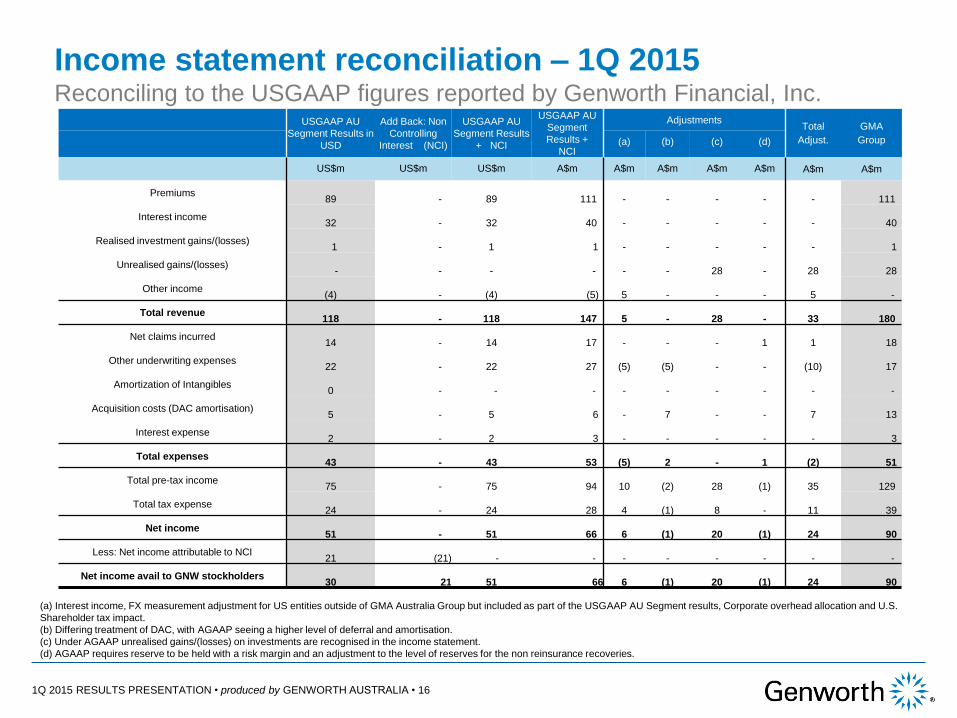
Income statement reconciliation – 1Q 2015 Reconciling to the USGAAP figures reported by Genworth Financial, Inc.
USGAAP AU
Segment Results in
USD
Add Back: Non
Controlling
Interest (NCI)
USGAAP AU
Segment Results
+ NCI
USGAAP AU
Segment
Results +
NCI
Adjustments Total
Adjust.
GMA
Group (a) (b) (c) (d)
US$m US$m US$m A$m A$m A$m A$m A$m A$m A$m
Premiums 89 - 89 111
-
-
-
-
- 111
Interest income 32 - 32 40
-
-
-
-
- 40
Realised investment gains/(losses) 1 - 1 1
-
-
-
-
- 1
Unrealised gains/(losses) - - - -
-
-
28
-
28 28
Other income (4) - (4) (5) 5
-
-
-
5 -
Total revenue 118 - 118 147
5
-
28
-
33 180
Net claims incurred 14 - 14 17
-
-
-
1
1 18
Other underwriting expenses 22 - 22 27
(5)
(5)
-
-
(10) 17
Amortization of Intangibles 0 - - -
-
-
-
-
- -
Acquisition costs (DAC amortisation) 5 - 5 6
-
7
-
-
7 13
Interest expense 2 - 2 3
-
-
-
-
- 3
Total expenses 43 - 43 53
(5)
2
-
1 (2) 51
Total pre-tax income 75 - 75 94
10
(2)
28
(1) 35 129
Total tax expense 24 - 24 28
4
(1)
8
-
11 39
Net income 51 - 51 66
6
(1)
20
(1)
24 90
Less: Net income attributable to NCI 21 (21) - -
-
-
-
-
- -
Net income avail to GNW stockholders 30 21 51 66
6
(1)
20
(1)
24 90
(a) Interest income, FX measurement adjustment for US entities outside of GMA Australia Group but included as part of the USGAAP AU Segment results, Corporate overhead allocation and U.S.
Shareholder tax impact.
(b) Differing treatment of DAC, with AGAAP seeing a higher level of deferral and amortisation.
(c) Under AGAAP unrealised gains/(losses) on investments are recognised in the income statement.
(d) AGAAP requires reserve to be held with a risk margin and an adjustment to the level of reserves for the non reinsurance recoveries.

1Q 2015 RESULTS PRESENTATION • produced by GENWORTH AUSTRALIA • 17
Quarterly financial information
(A$ in millions) Pro forma 1Q14 Actual 2Q14 Actual 3Q14 Actual 4Q14 Actual 1Q15
Gross written premium 159.7 153.9 157.5 163.1 127.7
Movement in unearned premium (32.6) (25.0) (26.6) (29.4) 3.0
Gross earned premium 127.1 128.9 130.9 133.7 130.7
Outwards reinsurance expense (18.9) (18.8) (18.9) (18.3) (19.9)
Net earned premium 108.2 110.1 112.0 115.4 110.8
Net claims incurred (17.3) (25.6) (24.0) (17.7) (18.4)
Acquisition costs (12.1) (12.0) (11.9) (13.0) (12.8)
Other underwriting expenses (15.3) (18.7) (17.6) (17.3) (17.5)
Underwriting result 63.6 53.8 58.5 67.4 62.1
Inv. income on tech reserves 9.9 17.2 9.2 13.6 12.1
Insurance profit 73.5 70.9 67.7 81.0 74.2
Inv. income on shareholders’ funds 27.9 49.1 23.1 77.0 56.7
Financing costs (2.8) (2.8) (2.8) (2.9) (2.8)
Profit before income tax 98.7 117.2 88.0 155.1 128.1
Income tax expense (29.4) (35.1) (24.0) (46.4) (38.6)
Net profit after tax
69.3 82.1 64.0 108.7 89.5
Underlying net profit after tax
69.7 63.4 70.2 76.1 69.7
Statement of comprehensive income

1Q 2015 RESULTS PRESENTATION • produced by GENWORTH AUSTRALIA • 18
Quarterly financial information
Pro forma 1Q14 Actual 2Q14 Actual 3Q14 Actual 4Q14 Actual 1Q15
Loss ratio 15.9% 23.2% 21.4% 15.3% 16.6%
Expense ratio 25.3% 27.9% 26.3% 26.3% 27.3%
Combined Ratio 41.3% 51.2% 47.8% 41.6% 43.9%
Insurance Margin 67.9% 64.4% 60.4% 70.2% 67.0%
Effective Tax Rate 29.8% 30.0% 27.3% 29.9% 30.1%
Financial ratios1
1. The actual financial ratios of GMA and its subsidiary companies for 1Q15 have been prepared under a statutory basis (prepared in accordance with Australian accounting
standards which comply with International Financial Reporting Standards (IFRS)). The pro forma financial ratios have been prepared on the same basis as the financial
information (including financial forecasts) disclosed in the prospectus lodged by GMA with the Australian Securities and Investments Commission on 23 April 2014 (Prospectus),
which reflected the post re-organisation structure.

1Q 2015 RESULTS PRESENTATION • produced by GENWORTH AUSTRALIA • 19
Delinquency development Quarterly delinquency roll and delinquency composition
Delinquency Roll 1Q14 2Q14 3Q14 4Q14 1Q15
Opening balance 4,980 5,070 5,405 5,300 4,953
New delinquencies 2,689 2,913 2,734 2,357 2,679
Cures (2,137) (2,159) (2,489) (2,390) (1,974)
Paid claims (462) (419) (350) (314) (280)
Closing delinquencies 5,070 5,405 5,300 4,953 5,378
Delinquency rate 0.34% 0.36% 0.36% 0.33% 0.36%
Delinquencies by book year Dec 14 Mar 15
2007 and prior 1993 2152 0.29%
2008 869 864 0.87%
2009 813 848 0.70%
2010 347 371 0.42%
2011 348 355 0.42%
2012 352 427 0.40%
2013 204 293 0.26%
2014 27 68 0.06%
TOTAL 4,953 5,378 0.36%
Delinquencies by geography Dec 14 Mar 15
New South Wales 1,041 1,129 0.29%
Victoria 1,114 1,186 0.32%
Queensland 1,513 1,632 0.50%
Western Australia 513 597 0.37%
South Australia 459 507 0.48%
Australian Capital Territory 56 48 0.13%
Tasmania 130 146 0.28%
Northern Territory 24 31 0.20%
New Zealand 103 102 0.27%
4,953 5,378 0.36%