Genworth Mortgage Insurance Australia - Investor...
38
Genworth Mortgage Insurance Australia Full Year 2016 Financial Results Presentation 8 February 2017 ©2017 Genworth Mortgage Insurance Australia Limited. All rights reserved.
Transcript of Genworth Mortgage Insurance Australia - Investor...

Genworth Mortgage Insurance Australia
Full Year 2016 Financial Results Presentation
8 February 2017
©2017 Genworth Mortgage Insurance Australia Limited. All rights reserved.
Full Year 2016 Results Presentation – produced by Genworth. 2
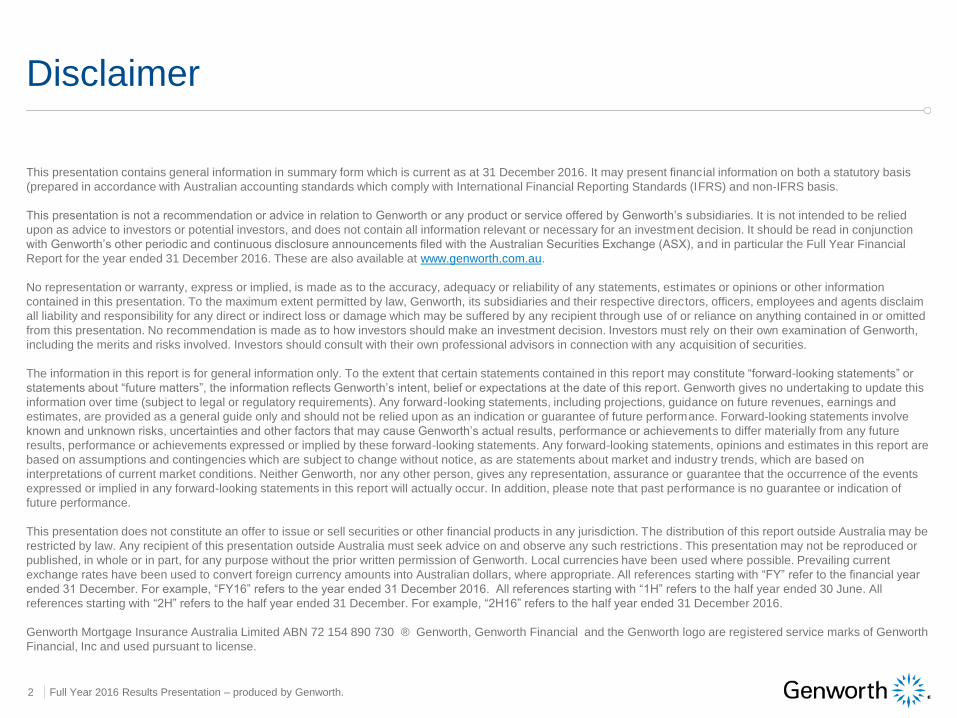
Disclaimer
This presentation contains general information in summary form which is current as at 31 December 2016. It may present financial information on both a statutory basis
(prepared in accordance with Australian accounting standards which comply with International Financial Reporting Standards (IFRS) and non-IFRS basis.
This presentation is not a recommendation or advice in relation to Genworth or any product or service offered by Genworth’s subsidiaries. It is not intended to be relied
upon as advice to investors or potential investors, and does not contain all information relevant or necessary for an investment decision. It should be read in conjunction
with Genworth’s other periodic and continuous disclosure announcements filed with the Australian Securities Exchange (ASX), and in particular the Full Year Financial
Report for the year ended 31 December 2016. These are also available at www.genworth.com.au.
No representation or warranty, express or implied, is made as to the accuracy, adequacy or reliability of any statements, estimates or opinions or other information
contained in this presentation. To the maximum extent permitted by law, Genworth, its subsidiaries and their respective directors, officers, employees and agents disclaim
all liability and responsibility for any direct or indirect loss or damage which may be suffered by any recipient through use of or reliance on anything contained in or omitted
from this presentation. No recommendation is made as to how investors should make an investment decision. Investors must rely on their own examination of Genworth,
including the merits and risks involved. Investors should consult with their own professional advisors in connection with any acquisition of securities.
The information in this report is for general information only. To the extent that certain statements contained in this report may constitute “forward-looking statements” or
statements about “future matters”, the information reflects Genworth’s intent, belief or expectations at the date of this report. Genworth gives no undertaking to update this
information over time (subject to legal or regulatory requirements). Any forward-looking statements, including projections, guidance on future revenues, earnings and
estimates, are provided as a general guide only and should not be relied upon as an indication or guarantee of future performance. Forward-looking statements involve
known and unknown risks, uncertainties and other factors that may cause Genworth’s actual results, performance or achievements to differ materially from any future
results, performance or achievements expressed or implied by these forward-looking statements. Any forward-looking statements, opinions and estimates in this report are
based on assumptions and contingencies which are subject to change without notice, as are statements about market and industry trends, which are based on
interpretations of current market conditions. Neither Genworth, nor any other person, gives any representation, assurance or guarantee that the occurrence of the events
expressed or implied in any forward-looking statements in this report will actually occur. In addition, please note that past performance is no guarantee or indication of
future performance.
This presentation does not constitute an offer to issue or sell securities or other financial products in any jurisdiction. The distribution of this report outside Australia may be
restricted by law. Any recipient of this presentation outside Australia must seek advice on and observe any such restrictions. This presentation may not be reproduced or
published, in whole or in part, for any purpose without the prior written permission of Genworth. Local currencies have been used where possible. Prevailing current
exchange rates have been used to convert foreign currency amounts into Australian dollars, where appropriate. All references starting with “FY” refer to the financial year
ended 31 December. For example, “FY16” refers to the year ended 31 December 2016. All references starting with “1H” refers to the half year ended 30 June. All
references starting with “2H” refers to the half year ended 31 December. For example, “2H16” refers to the half year ended 31 December 2016.
Genworth Mortgage Insurance Australia Limited ABN 72 154 890 730 ® Genworth, Genworth Financial and the Genworth logo are registered service marks of Genworth
Financial, Inc and used pursuant to license.

IntroductionGeorgette Nicholas, CEO
Full Year 2016 Results Presentation – produced by Genworth. 4
(A$ millions) FY15 FY16 Change %
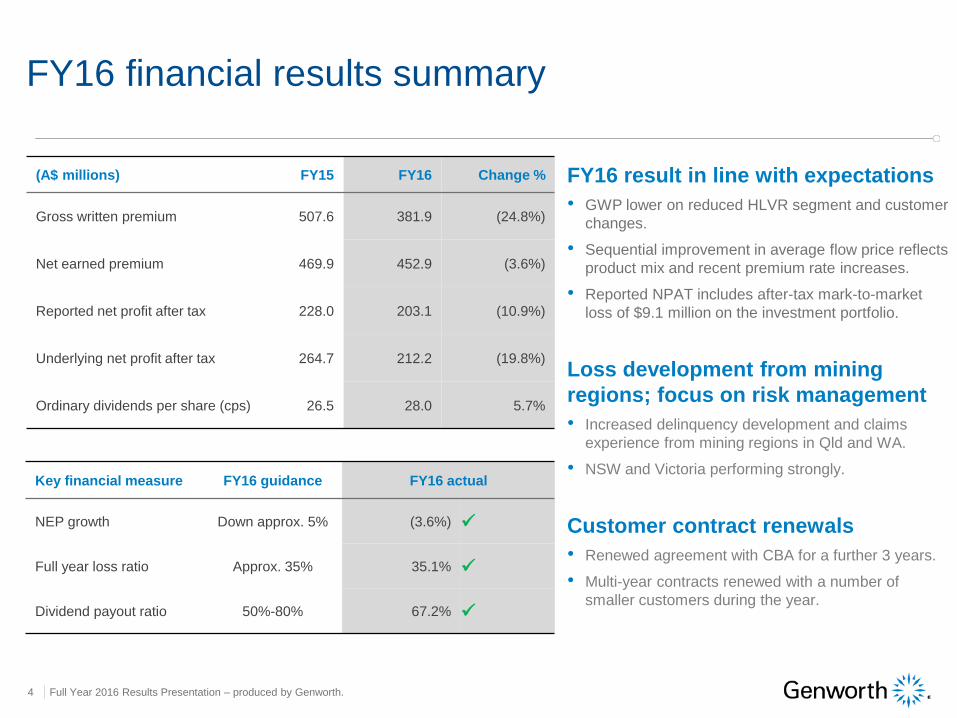
Gross written premium 507.6 381.9 (24.8%)
Net earned premium 469.9 452.9 (3.6%)
Reported net profit after tax 228.0 203.1 (10.9%)
Underlying net profit after tax 264.7 212.2 (19.8%)
Ordinary dividends per share (cps) 26.5 28.0 5.7%
FY16 financial results summary
Key financial measure FY16 guidance FY16 actual
NEP growth Down approx. 5% (3.6%)
Full year loss ratio Approx. 35% 35.1%
Dividend payout ratio 50%-80% 67.2%
FY16 result in line with expectations
• GWP lower on reduced HLVR segment and customer
changes.
• Sequential improvement in average flow price reflects
product mix and recent premium rate increases.
• Reported NPAT includes after-tax mark-to-market
loss of $9.1 million on the investment portfolio.
Loss development from mining
regions; focus on risk management
• Increased delinquency development and claims
experience from mining regions in Qld and WA.
• NSW and Victoria performing strongly.
Customer contract renewals
• Renewed agreement with CBA for a further 3 years.
• Multi-year contracts renewed with a number of
smaller customers during the year.
Full Year 2016 Results Presentation – produced by Genworth. 5
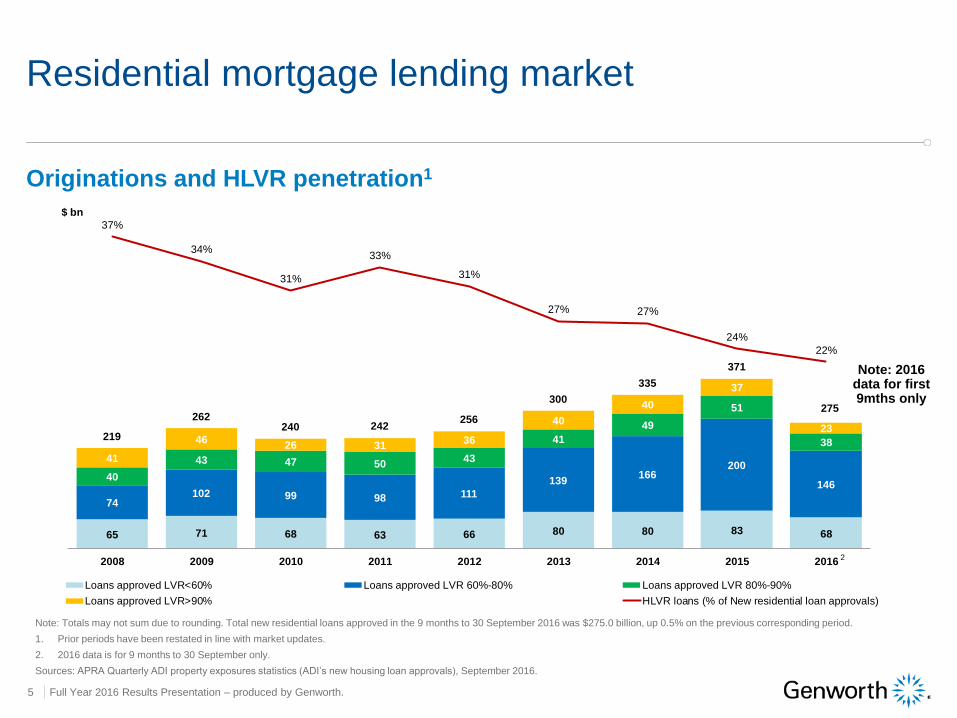
Residential mortgage lending market
Originations and HLVR penetration1
Note: Totals may not sum due to rounding. Total new residential loans approved in the 9 months to 30 September 2016 was $275.0 billion, up 0.5% on the previous corresponding period.
1. Prior periods have been restated in line with market updates.
2. 2016 data is for 9 months to 30 September only.
Sources: APRA Quarterly ADI property exposures statistics (ADI’s new housing loan approvals), September 2016.
HLVR Penetration
65 71 68 63 66 80 80 83 68
74102 99 98 111
139166
200
14640
43 47 5043
41
49
51
38
41
4626 31
36
40
40
37
23219
262 240 242
256
300
335
371
275
37%
34%
31%
33%
31%
27% 27%
24%
22%
2008 2009 2010 2011 2012 2013 2014 2015 2016
Loans approved LVR<60% Loans approved LVR 60%-80% Loans approved LVR 80%-90%
Loans approved LVR>90% HLVR loans (% of New residential loan approvals)
$ bn
2
Note: 2016 data for first 9mths only
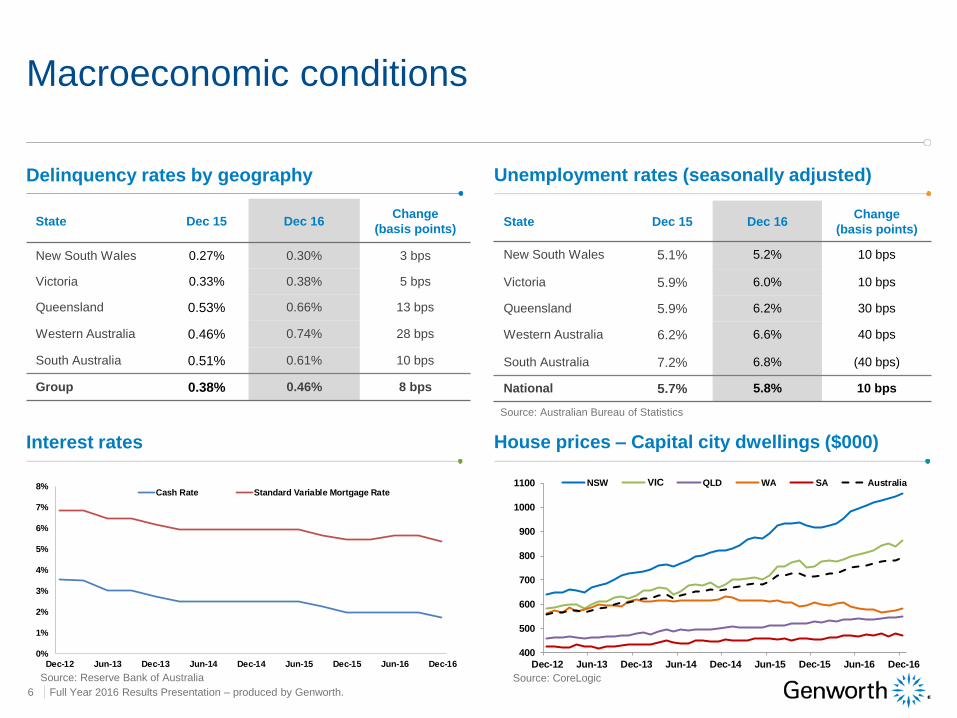
State Dec 15 Dec 16Change
(basis points)
New South Wales 0.27% 0.30% 3 bps
Victoria 0.33% 0.38% 5 bps
Queensland 0.53% 0.66% 13 bps
Western Australia 0.46% 0.74% 28 bps
South Australia 0.51% 0.61% 10 bps
Group 0.38% 0.46% 8 bps
Full Year 2016 Results Presentation – produced by Genworth. 6
Delinquency rates by geography Unemployment rates (seasonally adjusted)
Macroeconomic conditions
Interest rates House prices – Capital city dwellings ($000)
State Dec 15 Dec 16Change
(basis points)
New South Wales 5.1% 5.2% 10 bps
Victoria 5.9% 6.0% 10 bps
Queensland 5.9% 6.2% 30 bps
Western Australia 6.2% 6.6% 40 bps
South Australia 7.2% 6.8% (40 bps)
National 5.7% 5.8% 10 bps
Source: Australian Bureau of Statistics
Source: Reserve Bank of Australia Source: CoreLogic
0%
1%
2%
3%
4%
5%
6%
7%
8%
Dec-12 Jun-13 Dec-13 Jun-14 Dec-14 Jun-15 Dec-15 Jun-16 Dec-16
Cash Rate Standard Variable Mortgage Rate2. Select current reporting month in cell 'D2'
400
500
600
700
800
900
1000
1100
Dec-12 Jun-13 Dec-13 Jun-14 Dec-14 Jun-15 Dec-15 Jun-16 Dec-16
NSW VIC QLD WA SA Australia
Full Year 2016 Results Presentation – produced by Genworth. 7
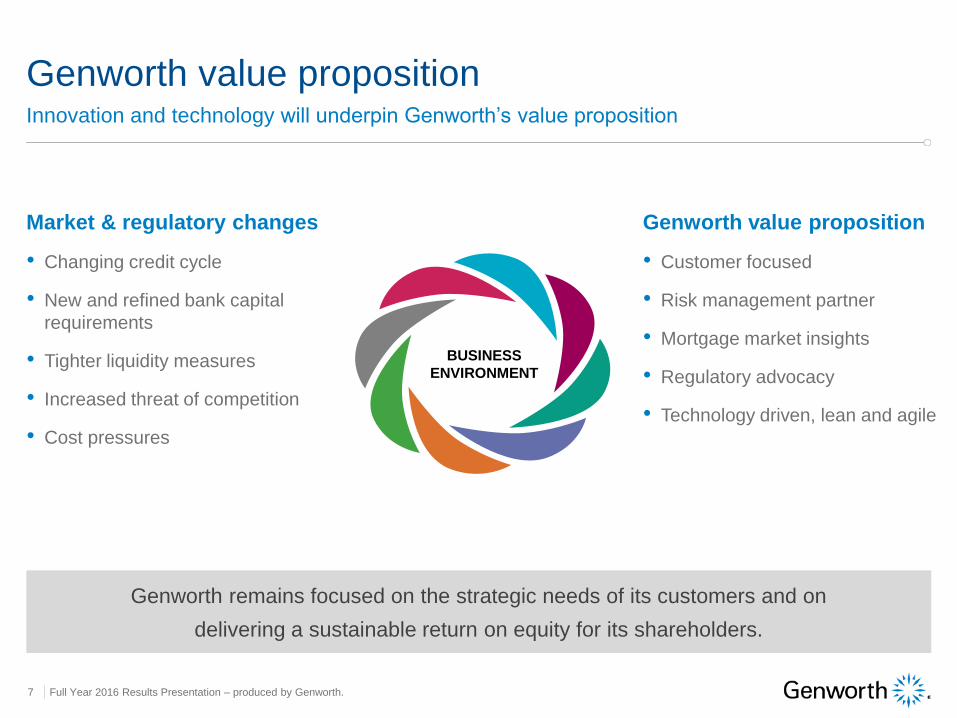
Genworth remains focused on the strategic needs of its customers and on
delivering a sustainable return on equity for its shareholders.
Genworth value proposition
BUSINESS
ENVIRONMENT
Market & regulatory changes
• Changing credit cycle
• New and refined bank capital
requirements
• Tighter liquidity measures
• Increased threat of competition
• Cost pressures
Genworth value proposition
• Customer focused
• Risk management partner
• Mortgage market insights
• Regulatory advocacy
• Technology driven, lean and agile
Innovation and technology will underpin Genworth’s value proposition
Full Year 2016 Results Presentation – produced by Genworth. 8
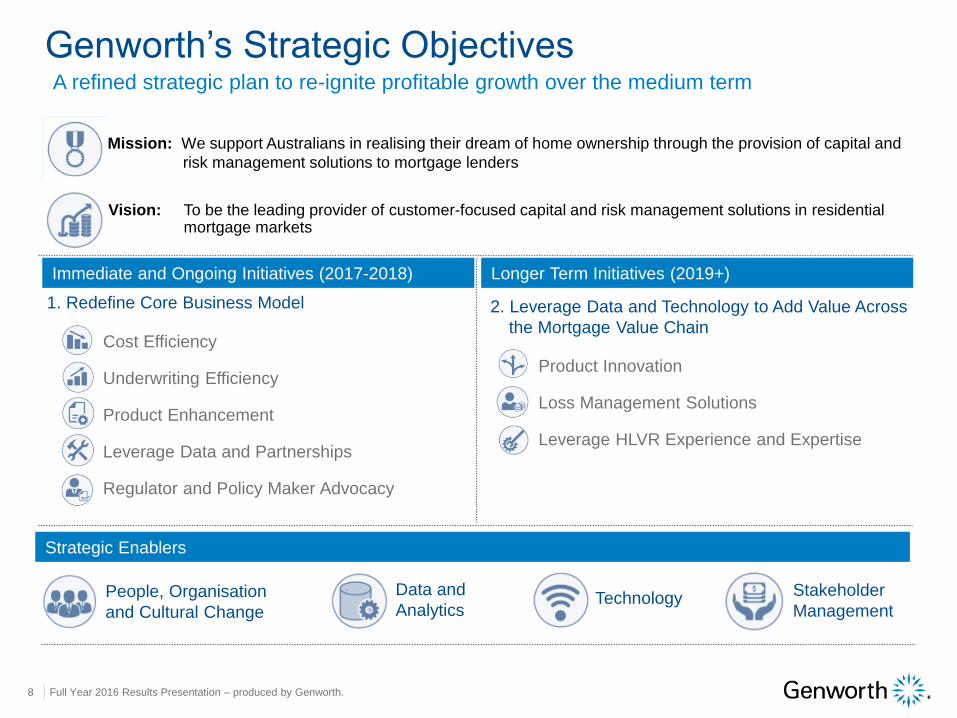
Genworth’s Strategic ObjectivesA refined strategic plan to re-ignite profitable growth over the medium term
Vision: To be the leading provider of customer-focused capital and risk management solutions in residential mortgage markets
Mission: We support Australians in realising their dream of home ownership through the provision of capital and
risk management solutions to mortgage lenders
1. Redefine Core Business Model 2. Leverage Data and Technology to Add Value Across
the Mortgage Value ChainCost Efficiency
Underwriting Efficiency
Product Enhancement
Leverage Data and Partnerships
Regulator and Policy Maker Advocacy
Immediate and Ongoing Initiatives (2017-2018) Longer Term Initiatives (2019+)
Strategic Enablers
People, Organisation
and Cultural Change
Data and
AnalyticsTechnology Stakeholder
Management
Product Innovation
Loss Management Solutions
Leverage HLVR Experience and Expertise

Detailed financial performanceLuke Oxenham, CFO
Full Year 2016 Results Presentation – produced by Genworth. 10
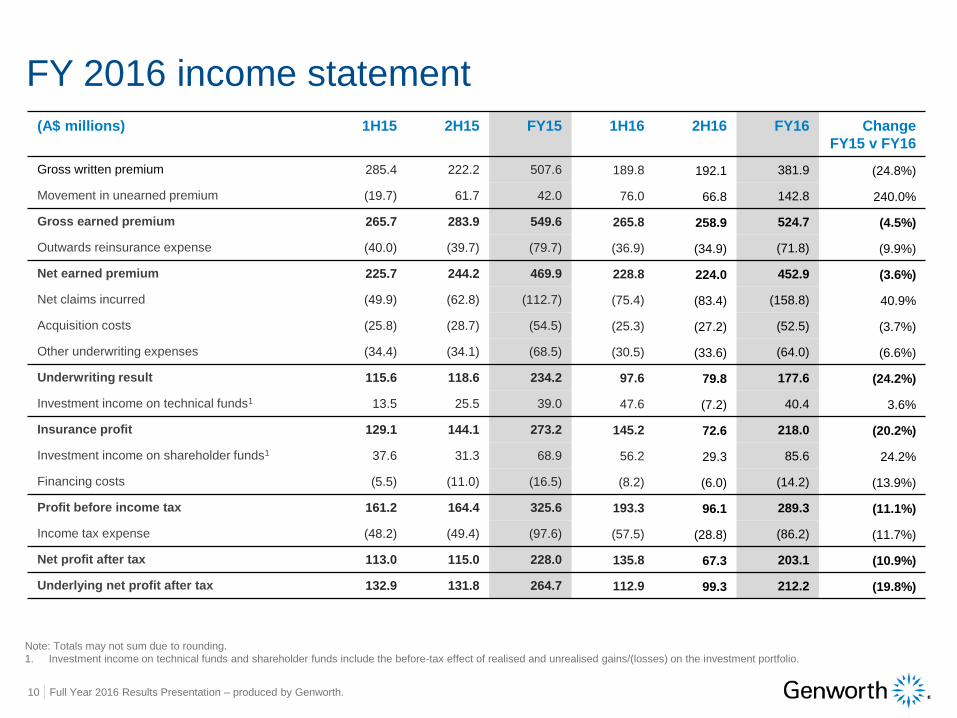
(A$ millions) 1H15 2H15 FY15 1H16 2H16 FY16 Change
FY15 v FY16
Gross written premium 285.4 222.2 507.6 189.8 192.1 381.9 (24.8%)
Movement in unearned premium (19.7) 61.7 42.0 76.0 66.8 142.8 240.0%
Gross earned premium 265.7 283.9 549.6 265.8 258.9 524.7 (4.5%)
Outwards reinsurance expense (40.0) (39.7) (79.7) (36.9) (34.9) (71.8) (9.9%)
Net earned premium 225.7 244.2 469.9 228.8 224.0 452.9 (3.6%)
Net claims incurred (49.9) (62.8) (112.7) (75.4) (83.4) (158.8) 40.9%
Acquisition costs (25.8) (28.7) (54.5) (25.3) (27.2) (52.5) (3.7%)
Other underwriting expenses (34.4) (34.1) (68.5) (30.5) (33.6) (64.0) (6.6%)
Underwriting result 115.6 118.6 234.2 97.6 79.8 177.6 (24.2%)
Investment income on technical funds1 13.5 25.5 39.0 47.6 (7.2) 40.4 3.6%
Insurance profit 129.1 144.1 273.2 145.2 72.6 218.0 (20.2%)
Investment income on shareholder funds1 37.6 31.3 68.9 56.2 29.3 85.6 24.2%
Financing costs (5.5) (11.0) (16.5) (8.2) (6.0) (14.2) (13.9%)
Profit before income tax 161.2 164.4 325.6 193.3 96.1 289.3 (11.1%)
Income tax expense (48.2) (49.4) (97.6) (57.5) (28.8) (86.2) (11.7%)
Net profit after tax 113.0 115.0 228.0 135.8 67.3 203.1 (10.9%)
Underlying net profit after tax 132.9 131.8 264.7 112.9 99.3 212.2 (19.8%)
FY 2016 income statement
Note: Totals may not sum due to rounding.
1. Investment income on technical funds and shareholder funds include the before-tax effect of realised and unrealised gains/(losses) on the investment portfolio.
Full Year 2016 Results Presentation – produced by Genworth. 11
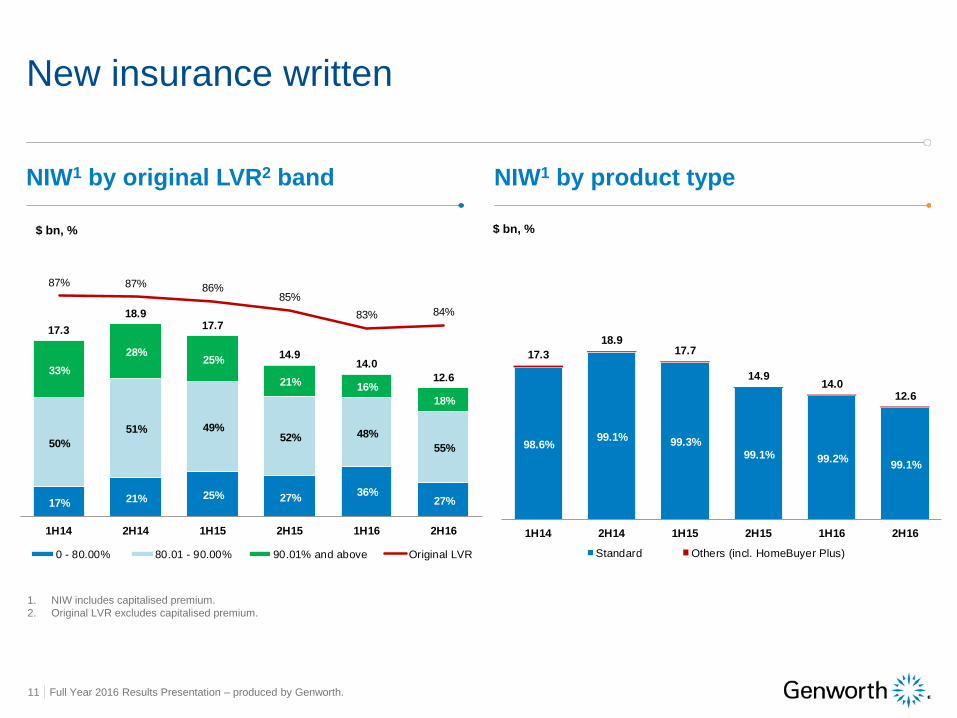
NIW1 by original LVR2 band NIW1 by product type
New insurance written
1. NIW includes capitalised premium.
2. Original LVR excludes capitalised premium.
$ bn, % $ bn, %
17% 21% 25% 27%36%
27%
50%
51% 49%52% 48%
55%
33%
28%25%
21% 16%
18%
17.3
18.917.7
14.914.0
12.6
87% 87% 86%85%
83% 84%
1H14 2H14 1H15 2H15 1H16 2H16
0 - 80.00% 80.01 - 90.00% 90.01% and above Original LVR
98.6%99.1% 99.3%
99.1% 99.2%99.1%
17.3
18.9 17.7
14.9 14.0
12.6
1H14 2H14 1H15 2H15 1H16 2H16
Standard Others (incl. HomeBuyer Plus)
Full Year 2016 Results Presentation – produced by Genworth. 12
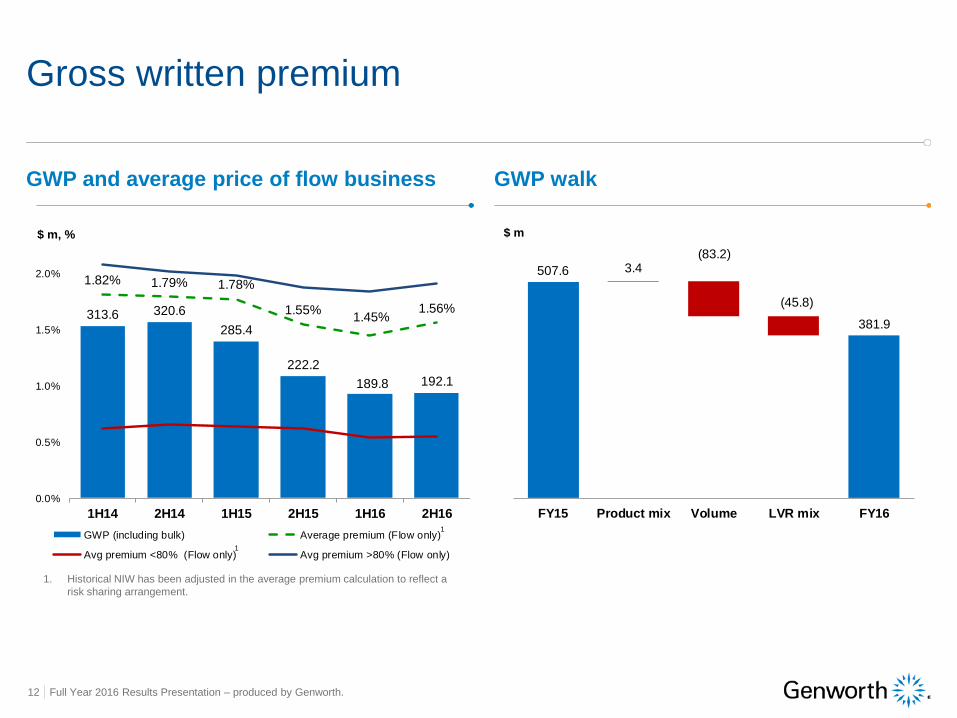
GWP and average price of flow business GWP walk
Gross written premium
1. Historical NIW has been adjusted in the average premium calculation to reflect a
risk sharing arrangement.
$ m
313.6 320.6
285.4
222.2
189.8 192.1
1.82% 1.79% 1.78%
1.55%1.45%
1.56%
0.0%
0.5%
1.0%
1.5%
2.0%
1H14 2H14 1H15 2H15 1H16 2H16
GWP (including bulk) Average premium (Flow only)
Avg premium <80% (Flow only) Avg premium >80% (Flow only)
1
1
$ m, %
3.4(83.2)
(45.8)
507.6
381.9
FY15 Product mix Volume LVR mix FY16
Full Year 2016 Results Presentation – produced by Genworth. 13
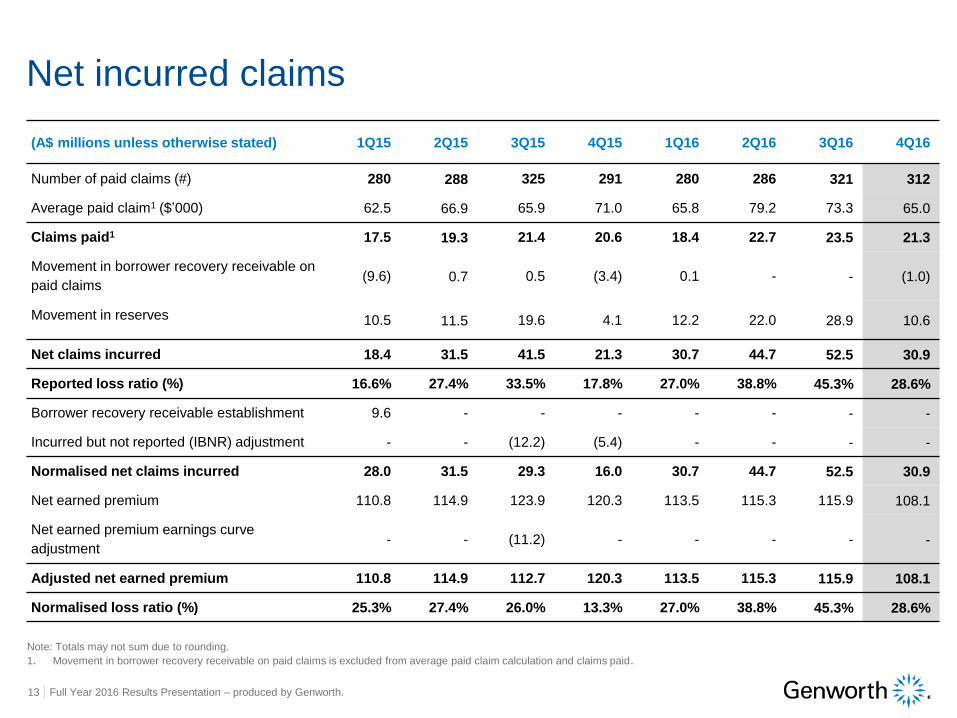
(A$ millions unless otherwise stated) 1Q15 2Q15 3Q15 4Q15 1Q16 2Q16 3Q16 4Q16
Number of paid claims (#) 280 288 325 291 280 286 321 312
Average paid claim1 ($’000) 62.5 66.9 65.9 71.0 65.8 79.2 73.3 65.0
Claims paid1 17.5 19.3 21.4 20.6 18.4 22.7 23.5 21.3
Movement in borrower recovery receivable on
paid claims(9.6) 0.7 0.5 (3.4) 0.1 - - (1.0)
Movement in reserves 10.5 11.5 19.6 4.1 12.2 22.0 28.9 10.6
Net claims incurred 18.4 31.5 41.5 21.3 30.7 44.7 52.5 30.9
Reported loss ratio (%) 16.6% 27.4% 33.5% 17.8% 27.0% 38.8% 45.3% 28.6%
Borrower recovery receivable establishment 9.6 - - - - - - -
Incurred but not reported (IBNR) adjustment - - (12.2) (5.4) - - - -
Normalised net claims incurred 28.0 31.5 29.3 16.0 30.7 44.7 52.5 30.9
Net earned premium 110.8 114.9 123.9 120.3 113.5 115.3 115.9 108.1
Net earned premium earnings curve
adjustment- - (11.2) - - - - -
Adjusted net earned premium 110.8 114.9 112.7 120.3 113.5 115.3 115.9 108.1
Normalised loss ratio (%) 25.3% 27.4% 26.0% 13.3% 27.0% 38.8% 45.3% 28.6%
Net incurred claims
Note: Totals may not sum due to rounding.
1. Movement in borrower recovery receivable on paid claims is excluded from average paid claim calculation and claims paid.
Full Year 2016 Results Presentation – produced by Genworth. 14
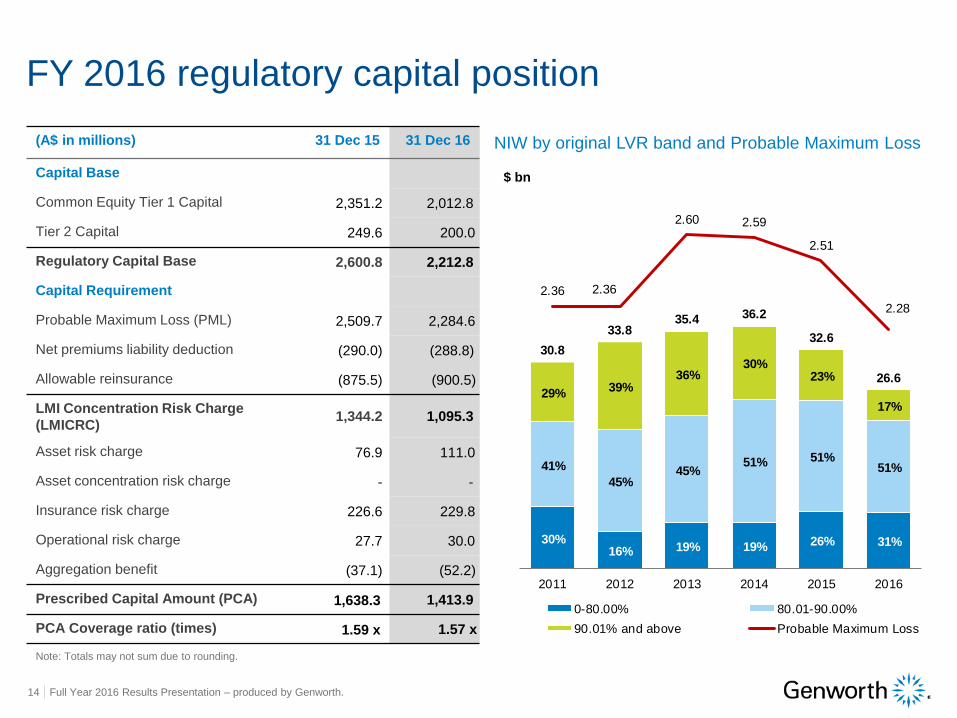
NIW by original LVR band and Probable Maximum Loss
FY 2016 regulatory capital position
(A$ in millions) 31 Dec 15 31 Dec 16
Capital Base
Common Equity Tier 1 Capital 2,351.2 2,012.8
Tier 2 Capital 249.6 200.0
Regulatory Capital Base 2,600.8 2,212.8
Capital Requirement
Probable Maximum Loss (PML) 2,509.7 2,284.6
Net premiums liability deduction (290.0) (288.8)
Allowable reinsurance (875.5) (900.5)
LMI Concentration Risk Charge
(LMICRC)1,344.2 1,095.3
Asset risk charge 76.9 111.0
Asset concentration risk charge - -
Insurance risk charge 226.6 229.8
Operational risk charge 27.7 30.0
Aggregation benefit (37.1) (52.2)
Prescribed Capital Amount (PCA) 1,638.3 1,413.9
PCA Coverage ratio (times) 1.59 x 1.57 x
Note: Totals may not sum due to rounding.
$ bn
30%16% 19% 19% 26% 31%
41%
45%45%
51% 51%51%
29%39%
36%30%
23%
17%
30.8
33.835.4 36.2
32.6
26.6
2.36 2.36
2.60 2.59
2.51
2.28
2011 2012 2013 2014 2015 2016
0-80.00% 80.01-90.00%
90.01% and above Probable Maximum Loss
Full Year 2016 Results Presentation – produced by Genworth. 15
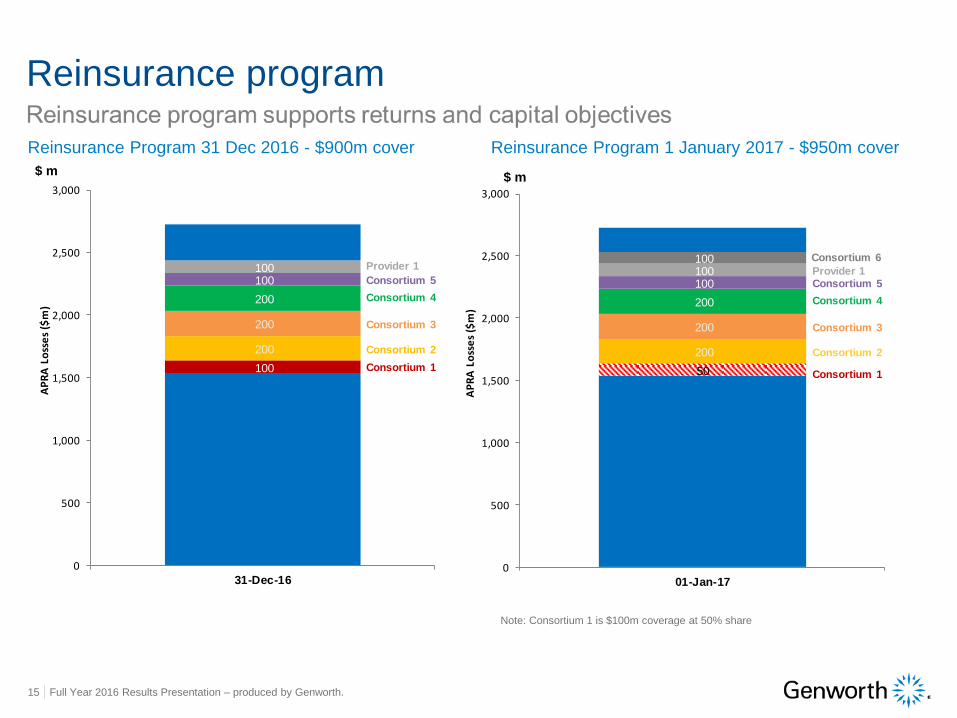
Reinsurance Program 1 January 2017 - $950m cover
Reinsurance program
$ m
Reinsurance Program 31 Dec 2016 - $900m cover
$ m
100
200
200
200
100 100
0
500
1,000
1,500
2,000
2,500
3,000
31-Dec-16
AP
RA
Lo
sse
s ($
m)
Provider 1
Consortium 2
Consortium 3
Consortium 1
Consortium 4
Consortium 5
50
200
200
200
100 100 100
0
500
1,000
1,500
2,000
2,500
3,000
01-Jan-17
AP
RA
Lo
sse
s ($
m)
Provider 1
Consortium 2
Consortium 3
Consortium 1
Consortium 4
Consortium 5
Consortium 6
Note: Consortium 1 is $100m coverage at 50% share
Full Year 2016 Results Presentation – produced by Genworth. 16
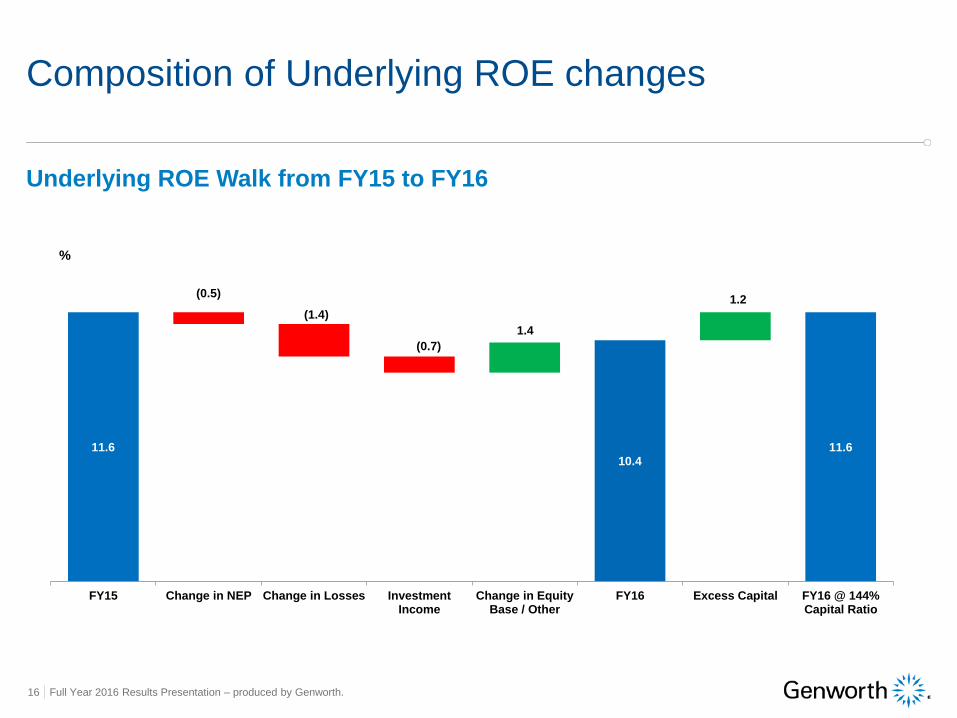
Composition of Underlying ROE changes
Underlying ROE Walk from FY15 to FY16
11.6
9.0
10.4 10.411.6
(0.5)
(1.4)
FY15 Change in NEP Change in Losses InvestmentIncome
Change in EquityBase / Other
FY16 Excess Capital FY16 @ 144%Capital Ratio
(0.7)
1.4
1.2
%
Full Year 2016 Results Presentation – produced by Genworth. 17
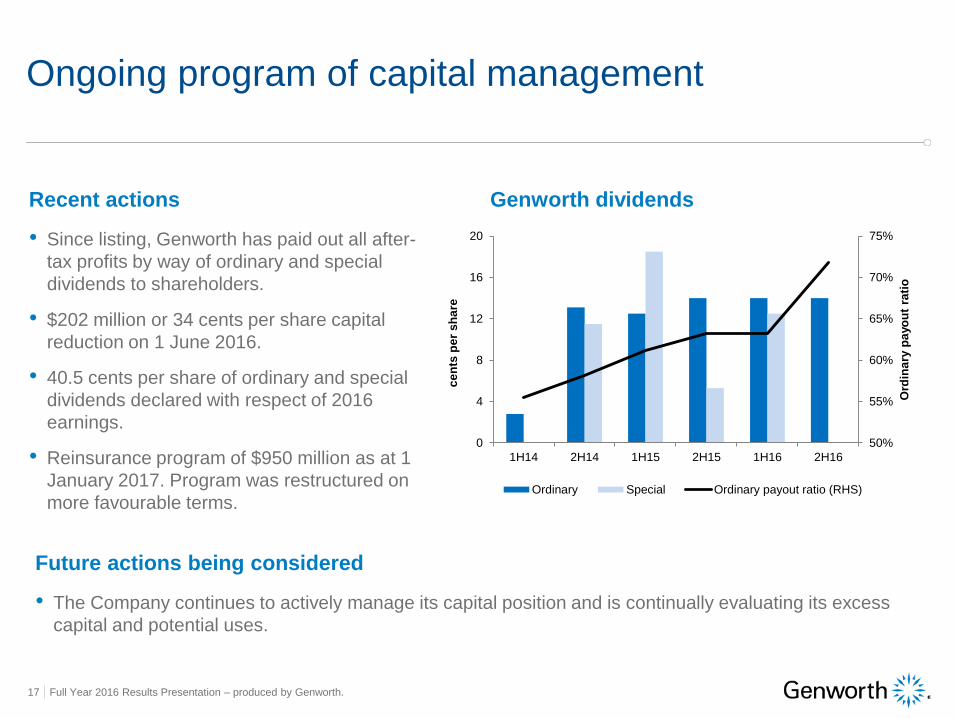
Ongoing program of capital management
Recent actions
• Since listing, Genworth has paid out all after-
tax profits by way of ordinary and special
dividends to shareholders.
• $202 million or 34 cents per share capital
reduction on 1 June 2016.
• 40.5 cents per share of ordinary and special
dividends declared with respect of 2016
earnings.
• Reinsurance program of $950 million as at 1
January 2017. Program was restructured on
more favourable terms.
Genworth dividends
Future actions being considered
• The Company continues to actively manage its capital position and is continually evaluating its excess
capital and potential uses.
50%
55%
60%
65%
70%
75%
0
4
8
12
16
20
1H14 2H14 1H15 2H15 1H16 2H16
Ord
ina
ry p
ayo
ut
rati
o
ce
nts
pe
r s
ha
re
Ordinary Special Ordinary payout ratio (RHS)

Summary and conclusionGeorgette Nicholas, CEO
Full Year 2016 Results Presentation – produced by Genworth. 19
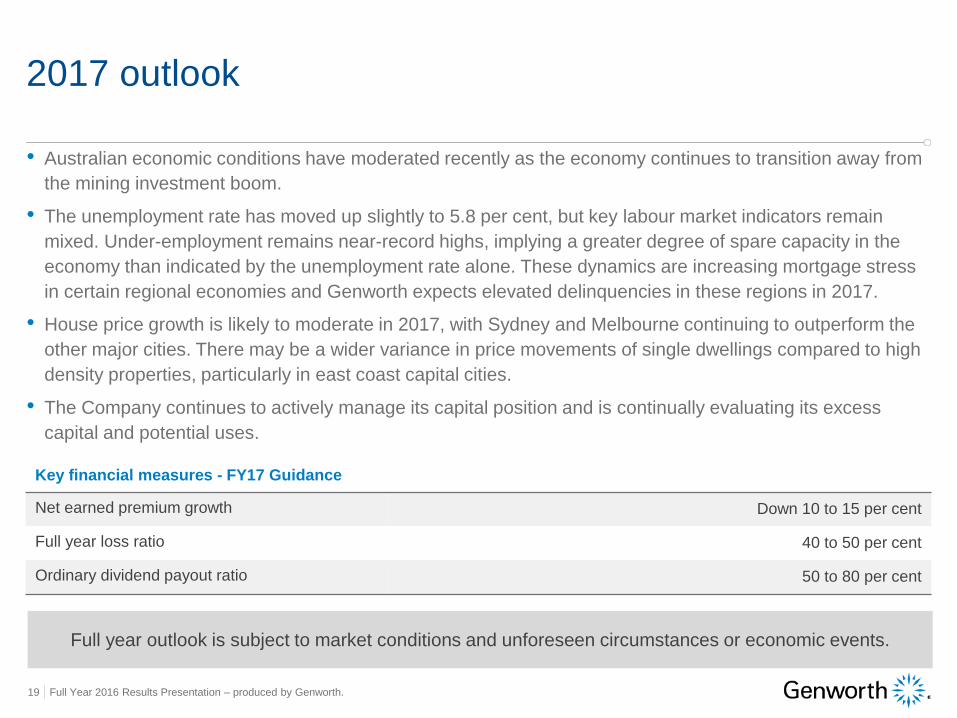
• Australian economic conditions have moderated recently as the economy continues to transition away from
the mining investment boom.
• The unemployment rate has moved up slightly to 5.8 per cent, but key labour market indicators remain
mixed. Under-employment remains near-record highs, implying a greater degree of spare capacity in the
economy than indicated by the unemployment rate alone. These dynamics are increasing mortgage stress
in certain regional economies and Genworth expects elevated delinquencies in these regions in 2017.
• House price growth is likely to moderate in 2017, with Sydney and Melbourne continuing to outperform the
other major cities. There may be a wider variance in price movements of single dwellings compared to high
density properties, particularly in east coast capital cities.
• The Company continues to actively manage its capital position and is continually evaluating its excess
capital and potential uses.
Full year outlook is subject to market conditions and unforeseen circumstances or economic events.
2017 outlook
Key financial measures - FY17 Guidance
Net earned premium growth Down 10 to 15 per cent
Full year loss ratio 40 to 50 per cent
Ordinary dividend payout ratio 50 to 80 per cent

QuestionsGeorgette Nicholas, CEO
Luke Oxenham, CFO

Supplementary slides
Full Year 2016 Results Presentation – produced by Genworth. 22
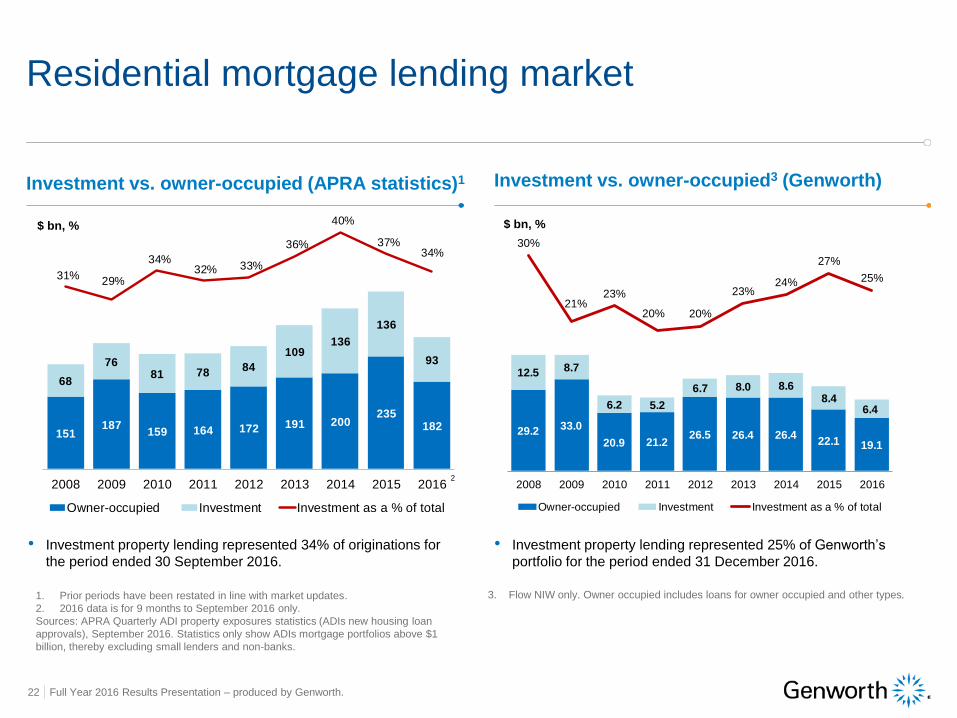
Investment vs. owner-occupied (APRA statistics)1 Investment vs. owner-occupied3 (Genworth)
Residential mortgage lending market
• Investment property lending represented 34% of originations for
the period ended 30 September 2016.
• Investment property lending represented 25% of Genworth’s
portfolio for the period ended 31 December 2016.
1. Prior periods have been restated in line with market updates.
2. 2016 data is for 9 months to September 2016 only.
Sources: APRA Quarterly ADI property exposures statistics (ADIs new housing loan
approvals), September 2016. Statistics only show ADIs mortgage portfolios above $1
billion, thereby excluding small lenders and non-banks.
3. Flow NIW only. Owner occupied includes loans for owner occupied and other types.
$ bn, %
151187
159 164 172 191 200235
182
68
7681 78
84
109136
136
93
31%29%
34%32% 33%
36%
40%
37%34%
2008 2009 2010 2011 2012 2013 2014 2015 2016
Owner-occupied Investment Investment as a % of total
2
$ bn, %
29.2 33.0
20.9 21.226.5 26.4 26.4
22.1 19.1
12.5 8.7
6.2 5.2
6.7 8.0 8.6 8.4
6.4
30%
21%23%
20% 20%
23%24%
27%
25%
2008 2009 2010 2011 2012 2013 2014 2015 2016
Owner-occupied Investment Investment as a % of total
Full Year 2016 Results Presentation – produced by Genworth. 23
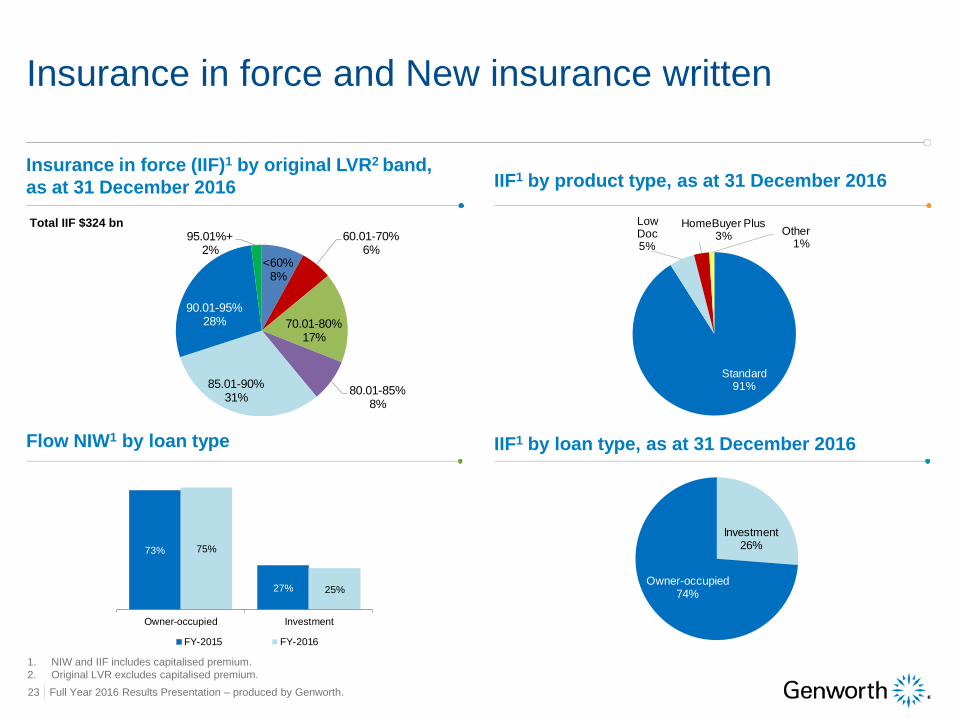
Insurance in force (IIF)1 by original LVR2 band,
as at 31 December 2016 IIF1 by product type, as at 31 December 2016
Insurance in force and New insurance written
Flow NIW1 by loan type IIF1 by loan type, as at 31 December 2016
Investment26%
Owner-occupied74%
Total IIF $324 bn
1. NIW and IIF includes capitalised premium.
2. Original LVR excludes capitalised premium.
73%
27%
75%
25%
Owner-occupied Investment
FY-2015 FY-2016
Standard91%
Low Doc5%
HomeBuyer Plus3% Other
1%
<60%8%
60.01-70%6%
70.01-80%17%
80.01-85%8%
85.01-90%31%
90.01-95%28%
95.01%+2%
Full Year 2016 Results Presentation – produced by Genworth. 24
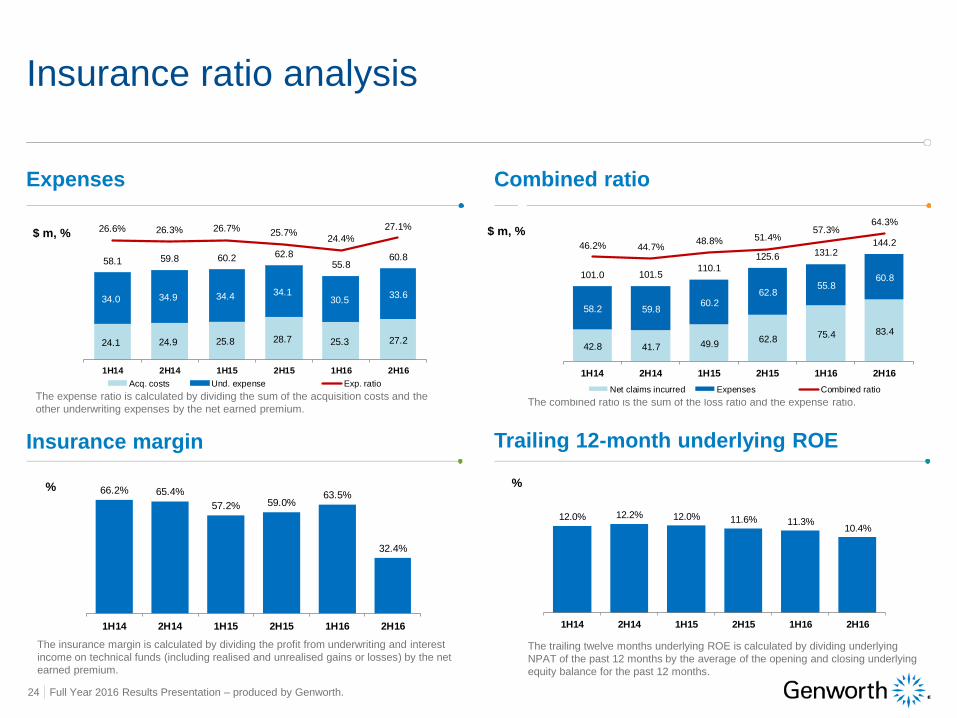
Expenses Combined ratio
Insurance ratio analysis
Insurance margin Trailing 12-month underlying ROE
The expense ratio is calculated by dividing the sum of the acquisition costs and the
other underwriting expenses by the net earned premium.The combined ratio is the sum of the loss ratio and the expense ratio.
The insurance margin is calculated by dividing the profit from underwriting and interest
income on technical funds (including realised and unrealised gains or losses) by the net
earned premium.
The trailing twelve months underlying ROE is calculated by dividing underlying
NPAT of the past 12 months by the average of the opening and closing underlying
equity balance for the past 12 months.
$ m, % $ m, %
% %
42.8 41.7 49.962.8
75.4 83.4
58.2 59.860.2
62.855.8
60.8101.0 101.5110.1
125.6 131.2144.246.2% 44.7%
48.8% 51.4%57.3%
64.3%
1H14 2H14 1H15 2H15 1H16 2H16
Net claims incurred Expenses Combined ratio
$ m, %
66.2% 65.4%
57.2% 59.0%63.5%
32.4%
1H14 2H14 1H15 2H15 1H16 2H16
12.0% 12.2% 12.0% 11.6% 11.3%10.4%
1H14 2H14 1H15 2H15 1H16 2H16
24.1 24.9 25.8 28.7 25.3 27.2
34.0 34.9 34.4 34.130.5
33.6
58.1 59.8 60.2 62.855.8
60.8
26.6% 26.3% 26.7% 25.7%24.4%
27.1%
1H14 2H14 1H15 2H15 1H16 2H16
Acq. costs Und. expense Exp. ratio
Full Year 2016 Results Presentation – produced by Genworth. 25
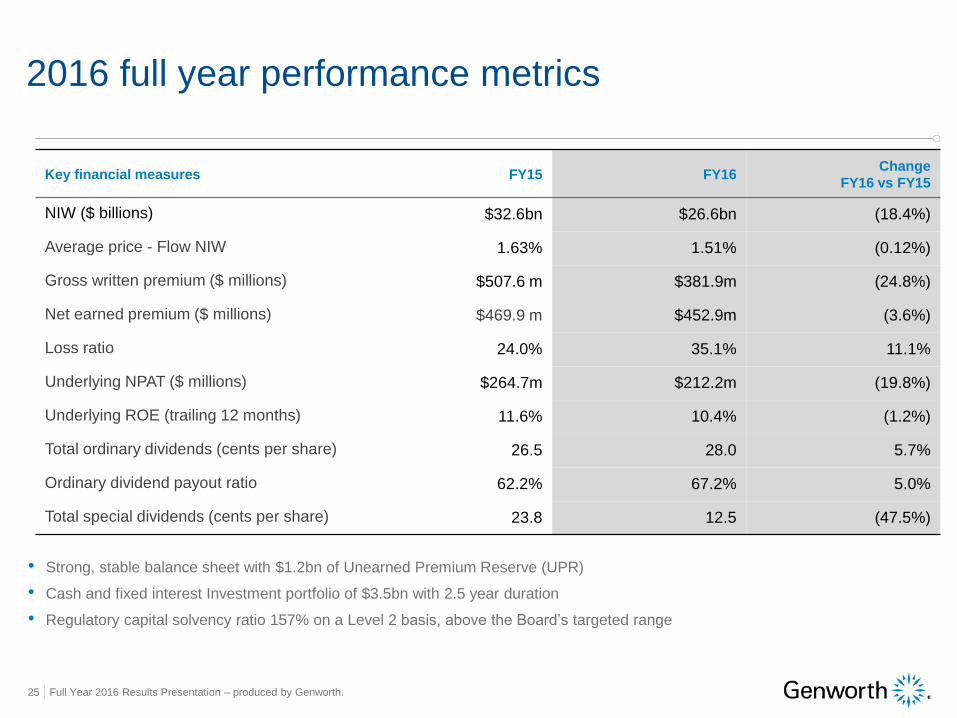
Key financial measures FY15 FY16Change
FY16 vs FY15
NIW ($ billions) $32.6bn $26.6bn (18.4%)
Average price - Flow NIW 1.63% 1.51% (0.12%)
Gross written premium ($ millions) $507.6 m $381.9m (24.8%)
Net earned premium ($ millions) $469.9 m $452.9m (3.6%)
Loss ratio 24.0% 35.1% 11.1%
Underlying NPAT ($ millions) $264.7m $212.2m (19.8%)
Underlying ROE (trailing 12 months) 11.6% 10.4% (1.2%)
Total ordinary dividends (cents per share) 26.5 28.0 5.7%
Ordinary dividend payout ratio 62.2% 67.2% 5.0%
Total special dividends (cents per share) 23.8 12.5 (47.5%)
2016 full year performance metrics
• Strong, stable balance sheet with $1.2bn of Unearned Premium Reserve (UPR)
• Cash and fixed interest Investment portfolio of $3.5bn with 2.5 year duration
• Regulatory capital solvency ratio 157% on a Level 2 basis, above the Board’s targeted range
Full Year 2016 Results Presentation – produced by Genworth. 26
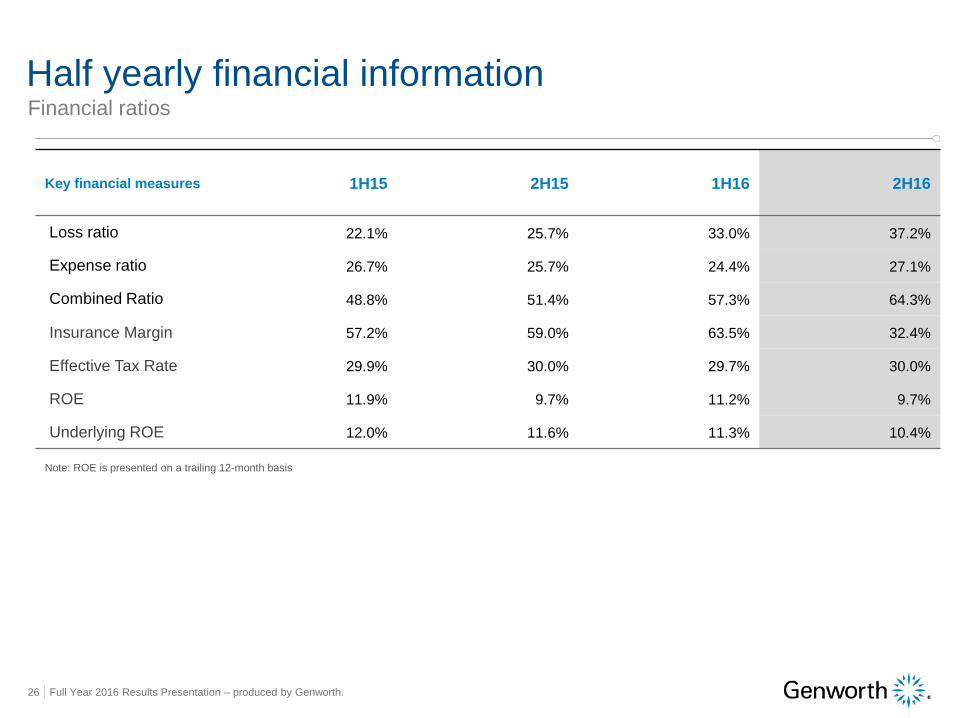
Key financial measures 1H15 2H15 1H16 2H16
Loss ratio 22.1% 25.7% 33.0% 37.2%
Expense ratio 26.7% 25.7% 24.4% 27.1%
Combined Ratio 48.8% 51.4% 57.3% 64.3%
Insurance Margin 57.2% 59.0% 63.5% 32.4%
Effective Tax Rate 29.9% 30.0% 29.7% 30.0%
ROE 11.9% 9.7% 11.2% 9.7%
Underlying ROE 12.0% 11.6% 11.3% 10.4%
Half yearly financial information
Note: ROE is presented on a trailing 12-month basis
Financial ratios
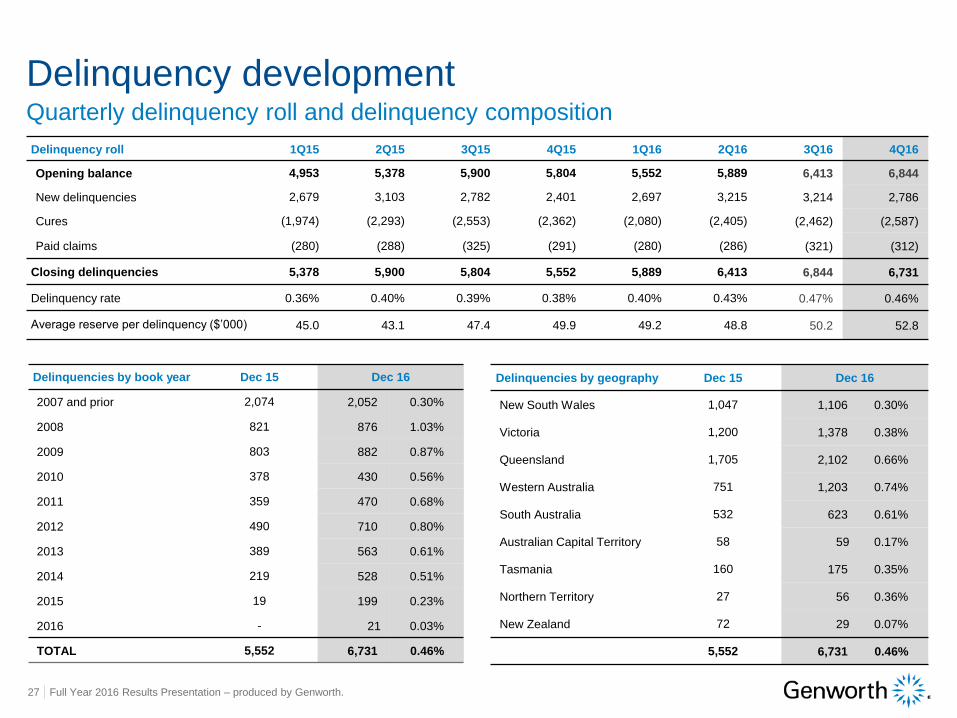
Delinquency roll 1Q15 2Q15 3Q15 4Q15 1Q16 2Q16 3Q16 4Q16
Opening balance 4,953 5,378 5,900 5,804 5,552 5,889 6,413 6,844
New delinquencies 2,679 3,103 2,782 2,401 2,697 3,215 3,214 2,786
Cures (1,974) (2,293) (2,553) (2,362) (2,080) (2,405) (2,462) (2,587)
Paid claims (280) (288) (325) (291) (280) (286) (321) (312)
Closing delinquencies 5,378 5,900 5,804 5,552 5,889 6,413 6,844 6,731
Delinquency rate 0.36% 0.40% 0.39% 0.38% 0.40% 0.43% 0.47% 0.46%
Average reserve per delinquency ($’000) 45.0 43.1 47.4 49.9 49.2 48.8 50.2 52.8
Full Year 2016 Results Presentation – produced by Genworth. 27
Delinquency developmentQuarterly delinquency roll and delinquency composition
Delinquencies by book year Dec 15 Dec 16
2007 and prior 2,074 2,052 0.30%
2008 821 876 1.03%
2009 803 882 0.87%
2010 378 430 0.56%
2011 359 470 0.68%
2012 490 710 0.80%
2013 389 563 0.61%
2014 219 528 0.51%
2015 19 199 0.23%
2016 - 21 0.03%
TOTAL 5,552 6,731 0.46%
Delinquencies by geography Dec 15 Dec 16
New South Wales 1,047 1,106 0.30%
Victoria 1,200 1,378 0.38%
Queensland 1,705 2,102 0.66%
Western Australia 751 1,203 0.74%
South Australia 532 623 0.61%
Australian Capital Territory 58 59 0.17%
Tasmania 160 175 0.35%
Northern Territory 27 56 0.36%
New Zealand 72 29 0.07%
5,552 6,731 0.46%
Full Year 2016 Results Presentation – produced by Genworth. 28
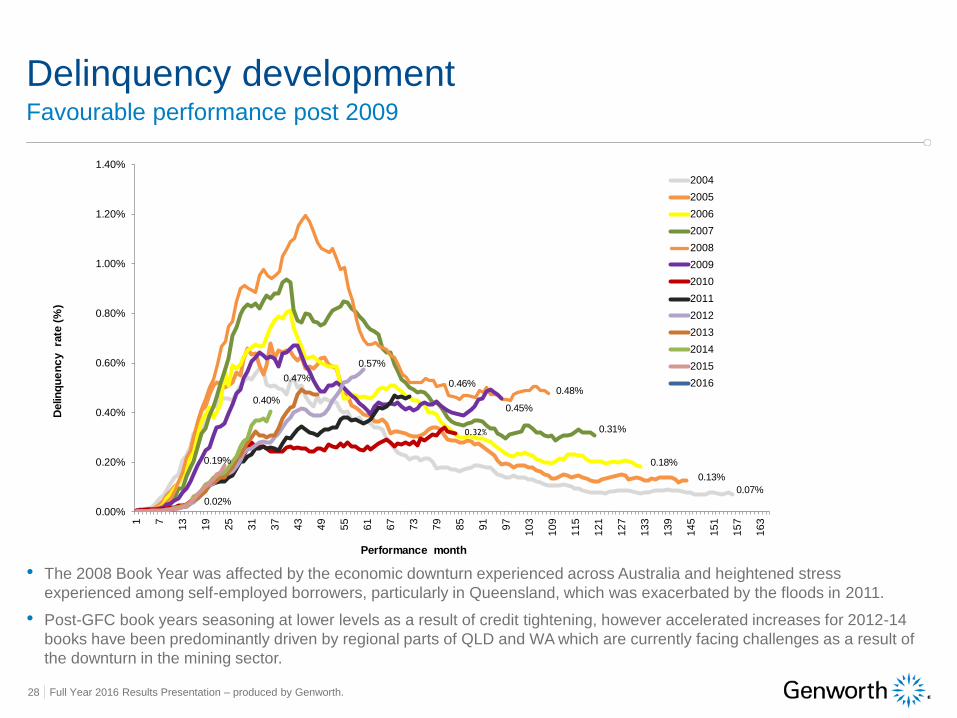
Favourable performance post 2009
• The 2008 Book Year was affected by the economic downturn experienced across Australia and heightened stress
experienced among self-employed borrowers, particularly in Queensland, which was exacerbated by the floods in 2011.
• Post-GFC book years seasoning at lower levels as a result of credit tightening, however accelerated increases for 2012-14
books have been predominantly driven by regional parts of QLD and WA which are currently facing challenges as a result of
the downturn in the mining sector.
Delinquency development
0.00%
0.20%
0.40%
0.60%
0.80%
1.00%
1.20%
1.40%
1 7
13
19
25
31
37
43
49
55
61
67
73
79
85
91
97
10
3
10
9
11
5
12
1
12
7
13
3
13
9
14
5
15
1
15
7
16
3
Delin
qu
en
cy
rate
(%
)
Performance month
2004
2005
2006
2007
2008
2009
2010
2011
2012
2013
2014
2015
2016
0.57%
0.47%
0.40%
0.07%
0.32%
0.02%
0.48%
0.13%
0.19%
0.45%
0.31%
0.18%
0.46%
Full Year 2016 Results Presentation – produced by Genworth. 29
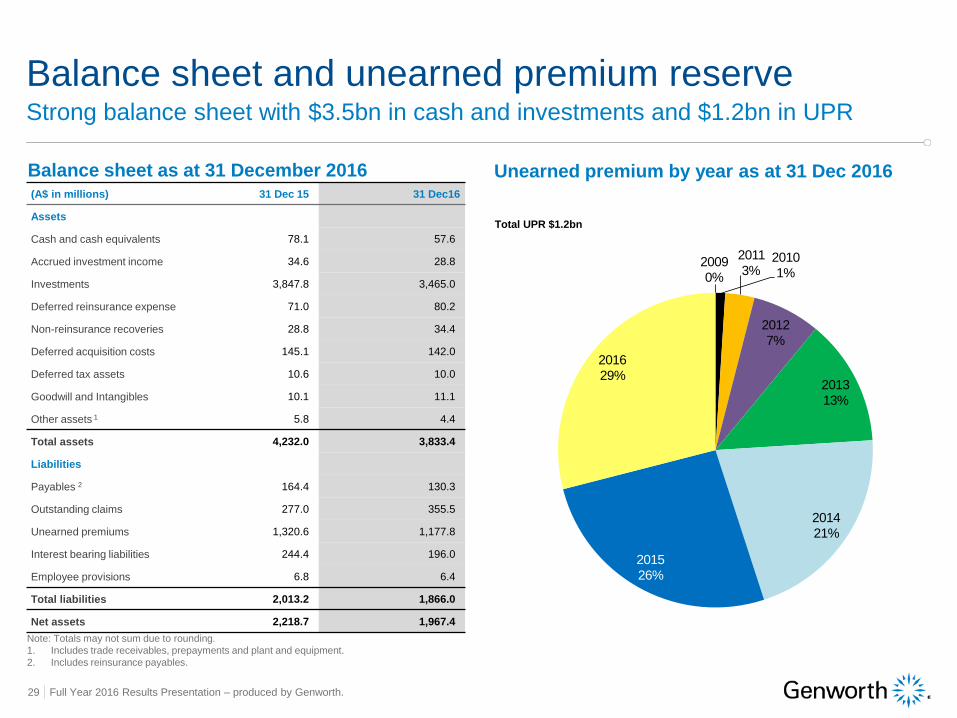
Strong balance sheet with $3.5bn in cash and investments and $1.2bn in UPR
Balance sheet as at 31 December 2016 Unearned premium by year as at 31 Dec 2016
Balance sheet and unearned premium reserve
(A$ in millions) 31 Dec 15 31 Dec16
Assets
Cash and cash equivalents 78.1 57.6
Accrued investment income 34.6 28.8
Investments 3,847.8 3,465.0
Deferred reinsurance expense 71.0 80.2
Non-reinsurance recoveries 28.8 34.4
Deferred acquisition costs 145.1 142.0
Deferred tax assets 10.6 10.0
Goodwill and Intangibles 10.1 11.1
Other assets 1 5.8 4.4
Total assets 4,232.0 3,833.4
Liabilities
Payables 2 164.4 130.3
Outstanding claims 277.0 355.5
Unearned premiums 1,320.6 1,177.8
Interest bearing liabilities 244.4 196.0
Employee provisions 6.8 6.4
Total liabilities 2,013.2 1,866.0
Net assets 2,218.7 1,967.4
Note: Totals may not sum due to rounding.
1. Includes trade receivables, prepayments and plant and equipment.
2. Includes reinsurance payables.
Total UPR $1.2bn
2009
0%
2010
1%
2011
3%
2012
7%
2013
13%
2014
21%
2015
26%
2016
29%
Full Year 2016 Results Presentation – produced by Genworth. 30
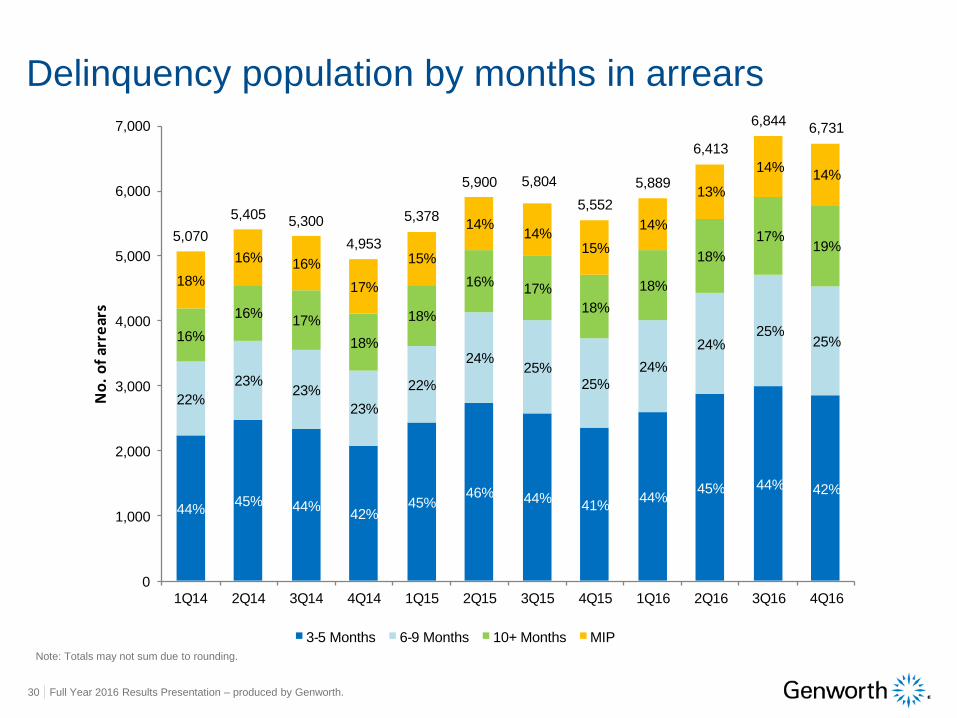
Delinquency population by months in arrears
Note: Totals may not sum due to rounding.
44%45% 44%
42%45%
46% 44%41%
44%45% 44% 42%
22%
23%23%
23%
22%
24%25%
25%
24%
24%25%
25%16%
16%17%
18%
18%
16%17%
18%
18%
18%
17% 19%
18%
16% 16%
17%
15%
14%14%
15%
14%
13%
14% 14%
5,070
5,4055,300
4,953
5,378
5,900 5,804
5,552
5,889
6,413
6,8446,731
0
1,000
2,000
3,000
4,000
5,000
6,000
7,000
1Q14 2Q14 3Q14 4Q14 1Q15 2Q15 3Q15 4Q15 1Q16 2Q16 3Q16 4Q16
No
. o
f ar
rear
s
3-5 Months 6-9 Months 10+ Months MIP
Full Year 2016 Results Presentation – produced by Genworth. 31
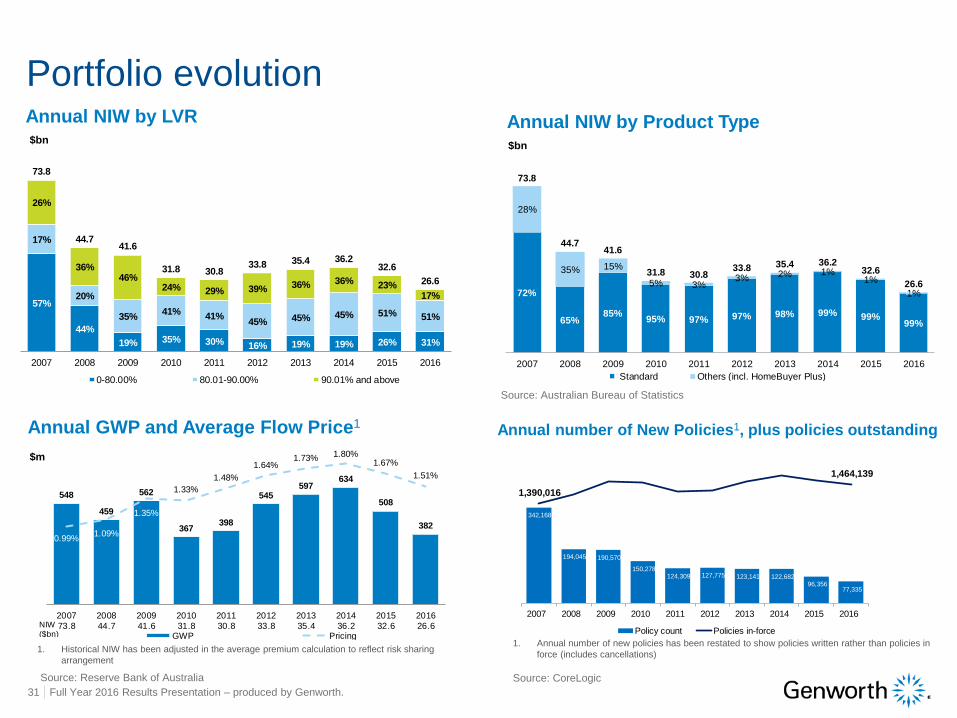
Annual NIW by LVR Annual NIW by Product Type
Portfolio evolution
Annual GWP and Average Flow Price1 Annual number of New Policies1, plus policies outstanding
Source: Australian Bureau of Statistics
Source: Reserve Bank of Australia Source: CoreLogic
72%
65%85%
95% 97% 97% 98% 99% 99%99%
28%
35% 15%
5% 3%3% 2% 1%
1%
1%
73.8
44.7 41.6
31.8 30.8 33.8 35.4 36.2
32.6
26.6
2007 2008 2009 2010 2011 2012 2013 2014 2015 2016
Standard Others (incl. HomeBuyer Plus)
1%
342,168
194,045 190,570
150,278 124,309 127,775 123,141 122,682
96,356 77,335
1,390,016
1,464,139
2007 2008 2009 2010 2011 2012 2013 2014 2015 2016
Policy count Policies in-force
548
459
562
367398
545597
634
508
382
0.99%1.09%
1.35%
1.33%
1.48%
1.64%1.73% 1.80%
1.67%
1.51%
2007
73.8
2008
44.7
2009
41.6
2010
31.8
2011
30.8
2012
33.8
2013
35.4
2014
36.2
2015
32.6
2016
26.6GWP Pricing
NIW ($bn)
1. Historical NIW has been adjusted in the average premium calculation to reflect risk sharing
arrangement
1. Annual number of new policies has been restated to show policies written rather than policies in
force (includes cancellations)
57%
44%
19% 35% 30% 16% 19% 19% 26% 31%
17%
20%
35%41%
41%45% 45% 45% 51% 51%
26%
36%46%
24% 29% 39% 36% 36% 23%17%
73.8
44.741.6
31.8 30.833.8 35.4 36.2
32.6
26.6
2007 2008 2009 2010 2011 2012 2013 2014 2015 2016
0-80.00% 80.01-90.00% 90.01% and above
$bn$bn
$m
Full Year 2016 Results Presentation – produced by Genworth. 32
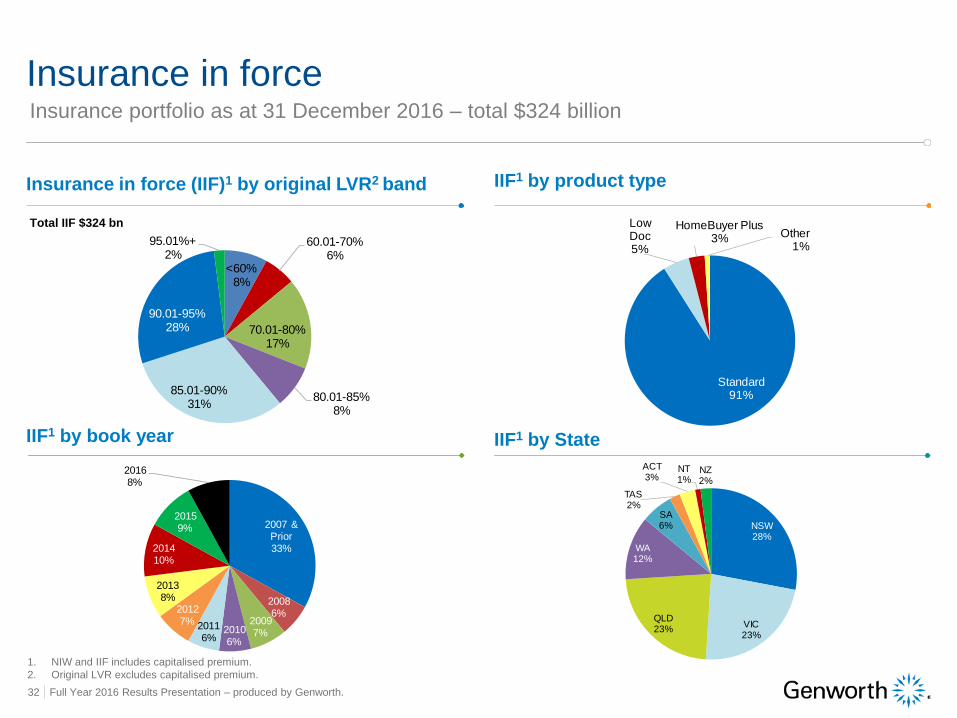
Insurance in force (IIF)1 by original LVR2 band IIF1 by product type
Insurance in force
IIF1 by book year IIF1 by State
Total IIF $324 bn
1. NIW and IIF includes capitalised premium.
2. Original LVR excludes capitalised premium.
2007 & Prior33%
20086%
20097%2010
6%
20116%
20127%
20138%
201410%
20159%
20168%
NSW28%
VIC23%
QLD23%
WA12%
SA6%
TAS2%
ACT3%
NT1%
NZ2%
Insurance portfolio as at 31 December 2016 – total $324 billion
<60%8%
60.01-70%6%
70.01-80%17%
80.01-85%8%
85.01-90%31%
90.01-95%28%
95.01%+2%
Standard91%
Low Doc5%
HomeBuyer Plus3% Other
1%
Full Year 2016 Results Presentation – produced by Genworth. 33
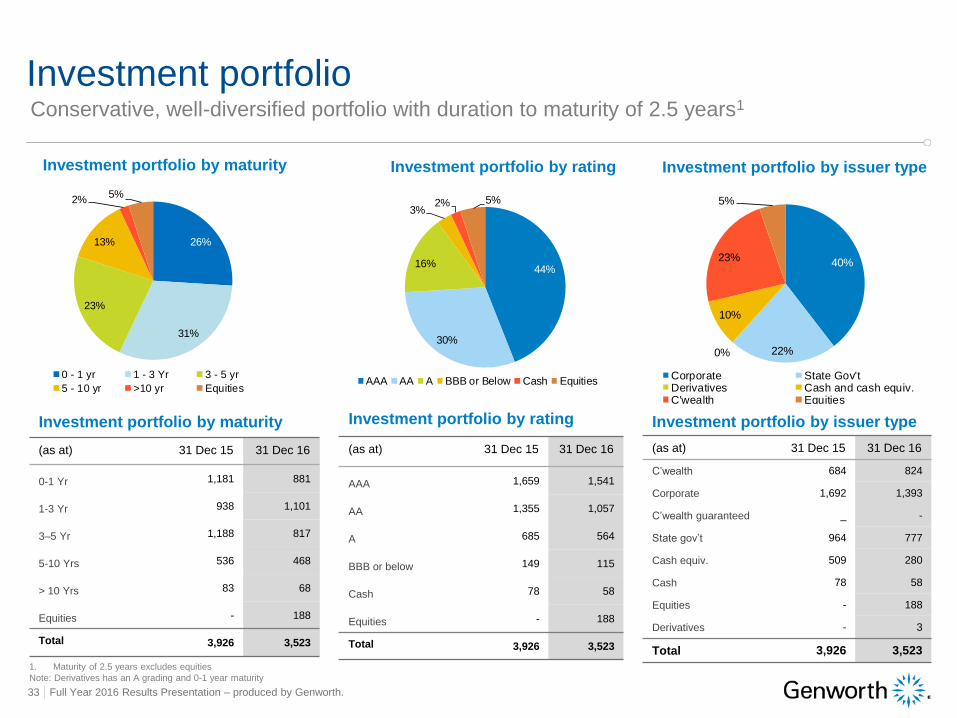
Investment portfolio by maturity Investment portfolio by issuer type
Investment portfolio
Investment portfolio by rating
26%
31%
23%
13%
2%5%
0 - 1 yr 1 - 3 Yr 3 - 5 yr
5 - 10 yr >10 yr Equities
44%
30%
16%
3%2% 5%
AAA AA A BBB or Below Cash Equities
40%
22%0%
10%
23%
5%
Corporate State Gov'tDerivatives Cash and cash equiv.C'wealth Equities
Investment portfolio by maturity
(as at) 31 Dec 15 31 Dec 16
0-1 Yr 1,181 881
1-3 Yr 938 1,101
3–5 Yr 1,188 817
5-10 Yrs 536 468
> 10 Yrs 83 68
Equities - 188
Total 3,926 3,523
Investment portfolio by rating
(as at) 31 Dec 15 31 Dec 16
AAA 1,659 1,541
AA 1,355 1,057
A 685 564
BBB or below 149 115
Cash 78 58
Equities - 188
Total 3,926 3,523
Investment portfolio by issuer type
(as at) 31 Dec 15 31 Dec 16
C’wealth 684 824
Corporate 1,692 1,393
C’wealth guaranteed _ -
State gov’t 964 777
Cash equiv. 509 280
Cash 78 58
Equities - 188
Derivatives - 3
Total 3,926 3,523
Conservative, well-diversified portfolio with duration to maturity of 2.5 years1
1. Maturity of 2.5 years excludes equities
Note: Derivatives has an A grading and 0-1 year maturity
Full Year 2016 Results Presentation – produced by Genworth. 34
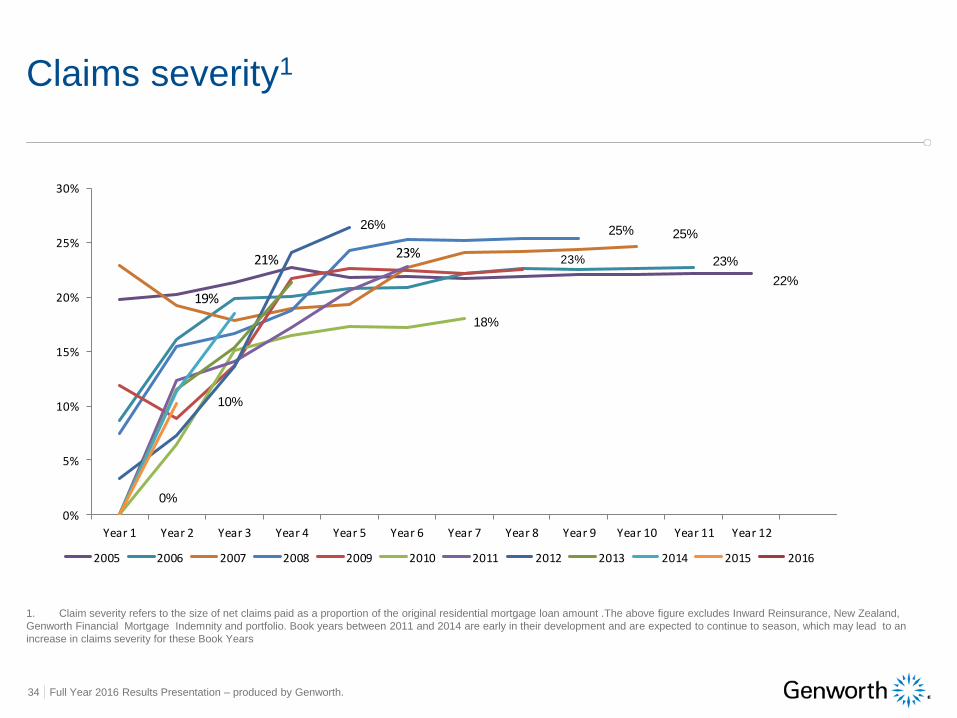
Claims severity1
1. Claim severity refers to the size of net claims paid as a proportion of the original residential mortgage loan amount .The above figure excludes Inward Reinsurance, New Zealand,
Genworth Financial Mortgage Indemnity and portfolio. Book years between 2011 and 2014 are early in their development and are expected to continue to season, which may lead to an
increase in claims severity for these Book Years
22%
23%
25%25%26%
18%
0%
5%
10%
15%
20%
25%
30%
Year 1 Year 2 Year 3 Year 4 Year 5 Year 6 Year 7 Year 8 Year 9 Year 10 Year 11 Year 12
2005 2006 2007 2008 2009 2010 2011 2012 2013 2014 2015 2016
21% 23%
19%
23%
0%
10%
Full Year 2016 Results Presentation – produced by Genworth. 35
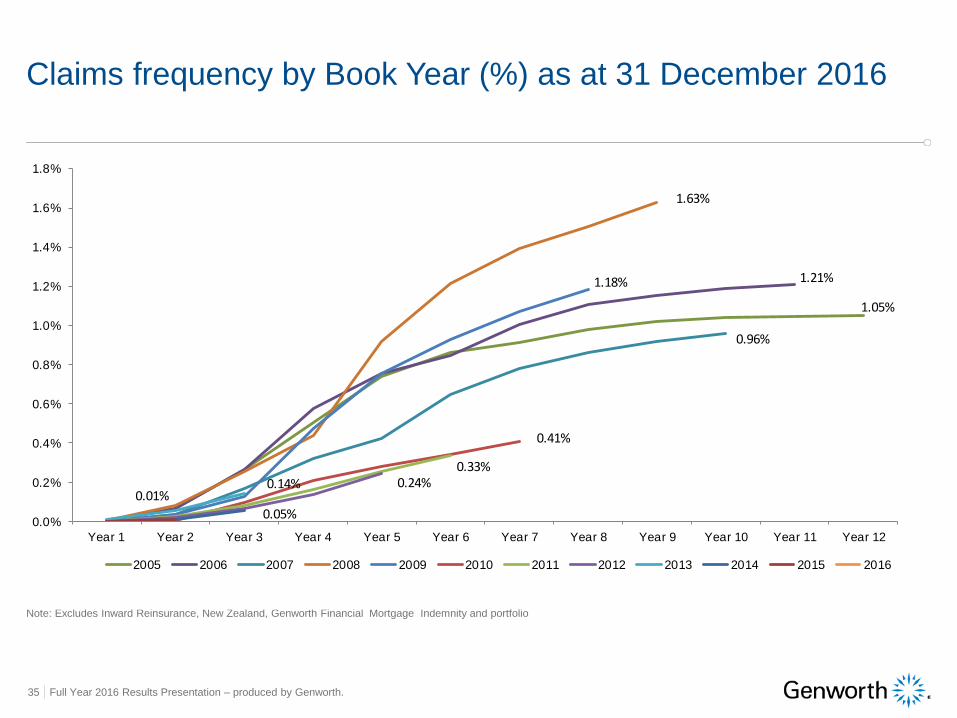
Claims frequency by Book Year (%) as at 31 December 2016
Note: Excludes Inward Reinsurance, New Zealand, Genworth Financial Mortgage Indemnity and portfolio
2015
2016
2005
2006
2007
2008
2009
2010
2011
2012
2013
2014
2015
2016
0.0%
0.2%
0.4%
0.6%
0.8%
1.0%
1.2%
1.4%
1.6%
1.8%
Year 1 Year 2 Year 3 Year 4 Year 5 Year 6 Year 7 Year 8 Year 9 Year 10 Year 11 Year 12
2005 2006 2007 2008 2009 2010 2011 2012 2013 2014 2015 2016
1.63%
1.18%
0.96%
0.33%0.24%0.14%
1.21%
0.05%
0.01%
1.05%
0.41%
Full Year 2016 Results Presentation – produced by Genworth. 36
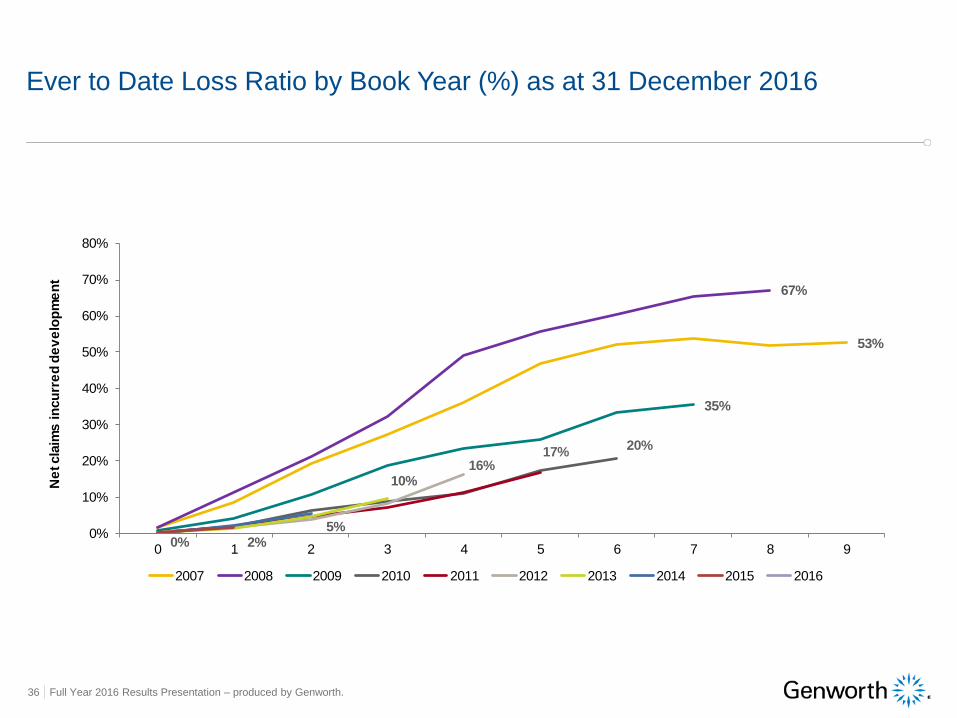
Ever to Date Loss Ratio by Book Year (%) as at 31 December 2016
53%
67%
35%
16%17%
20%
5%
10%
0% 2%0%
10%
20%
30%
40%
50%
60%
70%
80%
0 1 2 3 4 5 6 7 8 9
Ne
t cla
ims i
ncu
rre
d d
ev
elo
pm
en
t
2007 2008 2009 2010 2011 2012 2013 2014 2015 2016
Full Year 2016 Results Presentation – produced by Genworth. 37
As at 31 Dec 16 As at 31 Dec 15
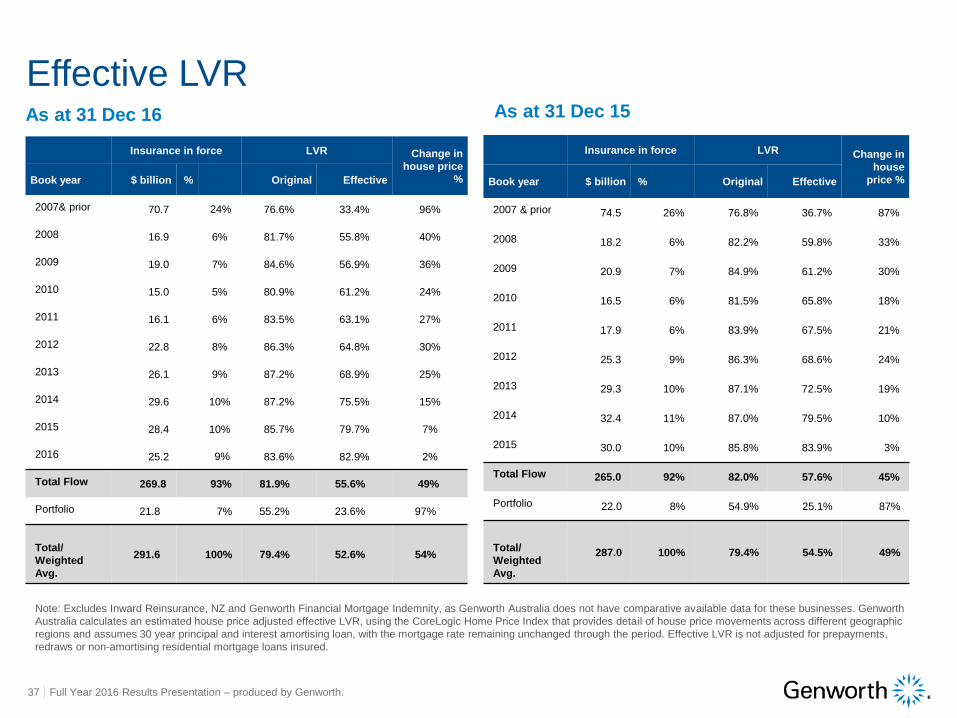
Effective LVR
Note: Excludes Inward Reinsurance, NZ and Genworth Financial Mortgage Indemnity, as Genworth Australia does not have comparative available data for these businesses. Genworth
Australia calculates an estimated house price adjusted effective LVR, using the CoreLogic Home Price Index that provides detail of house price movements across different geographic
regions and assumes 30 year principal and interest amortising loan, with the mortgage rate remaining unchanged through the period. Effective LVR is not adjusted for prepayments,
redraws or non-amortising residential mortgage loans insured.
Insurance in force LVR Change in
house price
%Book year $ billion % Original Effective
2007& prior 70.7 24% 76.6% 33.4% 96%
2008 16.9 6% 81.7% 55.8% 40%
2009 19.0 7% 84.6% 56.9% 36%
2010 15.0 5% 80.9% 61.2% 24%
2011 16.1 6% 83.5% 63.1% 27%
2012 22.8 8% 86.3% 64.8% 30%
2013 26.1 9% 87.2% 68.9% 25%
2014 29.6 10% 87.2% 75.5% 15%
2015 28.4 10% 85.7% 79.7% 7%
2016 25.2 9% 83.6% 82.9% 2%
Total Flow 269.8 93% 81.9% 55.6% 49%
Portfolio 21.8 7% 55.2% 23.6% 97%
Total/
Weighted
Avg.
291.6 100% 79.4% 52.6% 54%
Insurance in force LVR Change in
house
price %Book year $ billion % Original Effective
2007 & prior 74.5 26% 76.8% 36.7% 87%
2008 18.2 6% 82.2% 59.8% 33%
2009 20.9 7% 84.9% 61.2% 30%
2010 16.5 6% 81.5% 65.8% 18%
2011 17.9 6% 83.9% 67.5% 21%
2012 25.3 9% 86.3% 68.6% 24%
2013 29.3 10% 87.1% 72.5% 19%
2014 32.4 11% 87.0% 79.5% 10%
2015 30.0 10% 85.8% 83.9% 3%
Total Flow 265.0 92% 82.0% 57.6% 45%
Portfolio 22.0 8% 54.9% 25.1% 87%
Total/
Weighted
Avg.
287.0 100% 79.4% 54.5% 49%
Full Year 2016 Results Presentation – produced by Genworth. 38
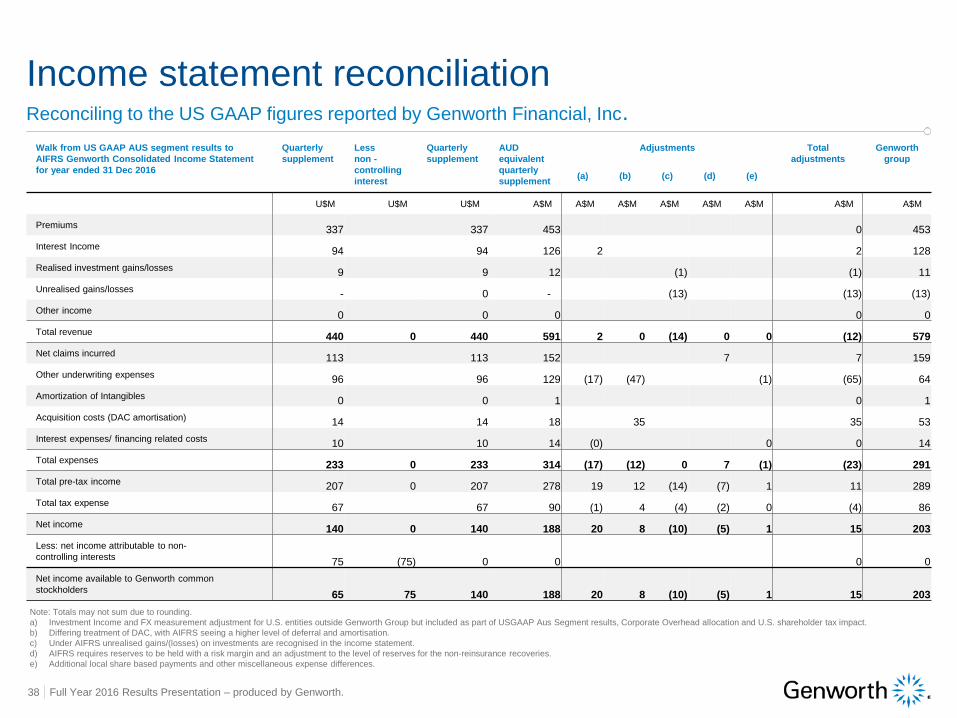
Walk from US GAAP AUS segment results to
AIFRS Genworth Consolidated Income Statement
for year ended 31 Dec 2016
Quarterly
supplement
Less
non -
controlling
interest
Quarterly
supplement
AUD
equivalent
quarterly
supplement
Adjustments Total
adjustments
Genworth
group
(a) (b) (c) (d) (e)
U$M U$M U$M A$M A$M A$M A$M A$M A$M A$M A$M
Premiums337 337 453 0 453
Interest Income94 94 126 2 2 128
Realised investment gains/losses9 9 12 (1) (1) 11
Unrealised gains/losses- 0 - (13) (13) (13)
Other income0 0 0 0 0
Total revenue440 0 440 591 2 0 (14) 0 0 (12) 579
Net claims incurred113 113 152 7 7 159
Other underwriting expenses96 96 129 (17) (47) (1) (65) 64
Amortization of Intangibles0 0 1 0 1
Acquisition costs (DAC amortisation)14 14 18 35 35 53
Interest expenses/ financing related costs10 10 14 (0) 0 0 14
Total expenses233 0 233 314 (17) (12) 0 7 (1) (23) 291
Total pre-tax income207 0 207 278 19 12 (14) (7) 1 11 289
Total tax expense67 67 90 (1) 4 (4) (2) 0 (4) 86
Net income140 0 140 188 20 8 (10) (5) 1 15 203
Less: net income attributable to non-
controlling interests75 (75) 0 0 0 0
Net income available to Genworth common
stockholders65 75 140 188 20 8 (10) (5) 1 15 203
Income statement reconciliation
Note: Totals may not sum due to rounding.
a) Investment Income and FX measurement adjustment for U.S. entities outside Genworth Group but included as part of USGAAP Aus Segment results, Corporate Overhead allocation and U.S. shareholder tax impact.
b) Differing treatment of DAC, with AIFRS seeing a higher level of deferral and amortisation.
c) Under AIFRS unrealised gains/(losses) on investments are recognised in the income statement.
d) AIFRS requires reserves to be held with a risk margin and an adjustment to the level of reserves for the non-reinsurance recoveries.
e) Additional local share based payments and other miscellaneous expense differences.
Reconciling to the US GAAP figures reported by Genworth Financial, Inc.