
GENWORTH FINANCIAL, INC. - …d18rn0p25nwr6d.cloudfront.net/.../3ecb3e77-449b-4fcd-8e70-9f6… ·...
63
Table of Contents UNITED STATES SECURITIES AND EXCHANGE COMMISSION WASHINGTON, D.C. 20549 FORM 10-K/A Amendment No. 1 to Form 10-K ☒ ANNUAL REPORT PURSUANT TO SECTION 13 OR 15(d) OF THE SECURITIES EXCHANGE ACT OF 1934 For the fiscal year ended December 31, 2016 OR ☐ TRANSITION REPORT PURSUANT TO SECTION 13 OR 15(d) OF THE SECURITIES EXCHANGE ACT OF 1934 For the transition period from to Commission file number 001-32195 GENWORTH FINANCIAL, INC. (Exact name of registrant as specified in its charter) Delaware 80-0873306 (State or other jurisdiction of incorporation or organization) (I.R.S. Employer Identification No.) 6620 West Broad Street Richmond, Virginia 23230 (Address of principal executive offices) (Zip Code) (804) 281-6000 (Registrant’s telephone number, including area code) Securities registered pursuant to Section 12(b) of the Act Title of Each Class Name of each exchange on which registered Class A Common Stock, par value $.001 per share New York Stock Exchange Securities registered pursuant to Section 12(g) of the Act None Indicate by check mark if the registrant is a well-known seasoned issuer, as defined in Rule 405 of the Securities Act. Yes ☒ No ☐ Indicate by check mark if the registrant is not required to file reports pursuant to Section 13 or Section 15(d) of the Act. Yes ☐ No ☒ Indicate by check mark whether the registrant (1) has filed all reports required to be filed by Section 13 or 15(d) of the Securities Exchange Act of 1934 during the preceding 12 months (or for such shorter period that the registrant was required to file such reports) and (2) has been subject to such filing requirements for the past 90 days. Yes ☒ No ☐ Indicate by check mark whether the registrant has submitted electronically and posted on its corporate Web site, if any, every Interactive Data File required to be submitted and posted pursuant to Rule 405 of Regulation S-T (§232.405 of this chapter) during the preceding 12 months (or for such shorter period that the registrant was required to submit and post such files). Yes ☒ No ☐ Indicate by check mark if disclosure of delinquent filers pursuant to Item 405 of Regulation S-K (§229.405 of this chapter) is not contained herein, and will not be contained, to the best of registrant’s knowledge, in definitive proxy or information statements incorporated by reference in Part III of this Form 10-K or any amendment to this Form 10-K. ☒ Indicate by check mark whether the registrant is a large accelerated filer, an accelerated filer, a non-accelerated filer, or a smaller reporting company. See the definitions of “large accelerated filer,” “accelerated filer” and “smaller reporting company” in Rule 12b-2 of the Exchange Act. (Check one): Large accelerated filer ☒ Accelerated filer ☐ Non-accelerated filer ☐ Smaller reporting company ☐ Indicate by check mark whether the registrant is a shell company (as defined in Rule 12b-2 of the Exchange Act). Yes ☐ No ☒ As of March 31, 2017, 498,931,063 shares of Class A Common Stock, par value $0.001 per share, were outstanding. The aggregate market value of the common equity (based on the closing price of the Class A Common Stock on the New York Stock Exchange) held by non-affiliates of the registrant on June 30, 2016, the last business day of the registrant’s most recently completed second fiscal quarter, was approximately $1.3 billion. All executive officers and directors of the registrant have been deemed, solely for the purpose of the foregoing calculation, to be “affiliates” of the registrant.
Transcript of GENWORTH FINANCIAL, INC. - …d18rn0p25nwr6d.cloudfront.net/.../3ecb3e77-449b-4fcd-8e70-9f6… ·...
Table of Contents
UNITED STATESSECURITIES AND EXCHANGE COMMISSION
WASHINGTON, D.C. 20549
FORM 10-K/AAmendment No. 1 to Form 10-K
☒ ANNUAL REPORT PURSUANT TO SECTION 13 OR 15(d) OF THE SECURITIES EXCHANGE ACT OF 1934For the fiscal year ended December 31, 2016
OR
☐ TRANSITION REPORT PURSUANT TO SECTION 13 OR 15(d) OF THE SECURITIES EXCHANGE ACT OF 1934For the transition period from to
Commission file number 001-32195
GENWORTH FINANCIAL, INC.(Exact name of registrant as specified in its charter)
Delaware 80-0873306(State or other jurisdiction of
incorporation or organization) (I.R.S. Employer
Identification No.)
6620 West Broad StreetRichmond, Virginia 23230
(Address of principal executive offices) (Zip Code)
(804) 281-6000(Registrant’s telephone number, including area code)
Securities registered pursuant to Section 12(b) of the Act
Title of Each Class Name of each exchange on which registeredClass A Common Stock, par value $.001 per share New York Stock Exchange
Securities registered pursuant to Section 12(g) of the ActNone
Indicate by check mark if the registrant is a well-known seasoned issuer, as defined in Rule 405 of the Securities Act. Yes ☒ No ☐Indicate by check mark if the registrant is not required to file reports pursuant to Section 13 or Section 15(d) of the Act. Yes ☐ No ☒Indicate by check mark whether the registrant (1) has filed all reports required to be filed by Section 13 or 15(d) of the Securities Exchange Act of 1934 during the preceding 12 months (or
for such shorter period that the registrant was required to file such reports) and (2) has been subject to such filing requirements for the past 90 days. Yes ☒ No ☐Indicate by check mark whether the registrant has submitted electronically and posted on its corporate Web site, if any, every Interactive Data File required to be submitted and posted
pursuant to Rule 405 of Regulation S-T (§232.405 of this chapter) during the preceding 12 months (or for such shorter period that the registrant was required to submit and post suchfiles). Yes ☒ No ☐
Indicate by check mark if disclosure of delinquent filers pursuant to Item 405 of Regulation S-K (§229.405 of this chapter) is not contained herein, and will not be contained, to the best ofregistrant’s knowledge, in definitive proxy or information statements incorporated by reference in Part III of this Form 10-K or any amendment to this Form 10-K. ☒
Indicate by check mark whether the registrant is a large accelerated filer, an accelerated filer, a non-accelerated filer, or a smaller reporting company. See the definitions of “largeaccelerated filer,” “accelerated filer” and “smaller reporting company” in Rule 12b-2 of the Exchange Act. (Check one):
Large accelerated filer ☒ Accelerated filer ☐
Non-accelerated filer ☐ Smaller reporting company ☐Indicate by check mark whether the registrant is a shell company (as defined in Rule 12b-2 of the Exchange Act). Yes ☐ No ☒As of March 31, 2017, 498,931,063 shares of Class A Common Stock, par value $0.001 per share, were outstanding.The aggregate market value of the common equity (based on the closing price of the Class A Common Stock on the New York Stock Exchange) held by non-affiliates of the registrant on
June 30, 2016, the last business day of the registrant’s most recently completed second fiscal quarter, was approximately $1.3 billion. All executive officers and directors of the registrant havebeen deemed, solely for the purpose of the foregoing calculation, to be “affiliates” of the registrant.

Table of Contents
EXPLANATORY NOTE
This Amendment No. 1 (this “Amendment”) on Form 10-K/A is being filed with respect to Genworth Financial, Inc.’s Annual Report on Form 10-K for thefiscal year ended December 31, 2016 filed with the Securities and Exchange Commission (the “SEC”) on February 27, 2017 (the “Form 10-K”). This Amendmentupdates Part III to contain certain additional information required therein.
Except for the changes to Part III and the filing of related certifications added to the list of Exhibits in Part IV, this Amendment makes no changes to theForm 10-K. This Amendment does not reflect events occurring after the filing of the Form 10-K or modify disclosures affected by subsequent events.
As used in this Amendment, the terms “Genworth,” the “company,” “we,” “our” and “us” refer to Genworth Financial, Inc.

Table of Contents
Genworth Financial, Inc.Table of Contents
PART III
Item 10. Directors, Executive Officers and Corporate Governance 1 Item 11. Executive Compensation 12 Item 12. Security Ownership of Certain Beneficial Owners and Management and Related Stockholder Matters 50 Item 13. Certain Relationships and Related Transactions, and Director Independence 53 Item 14. Principal Accounting Fees and Services 55
PART IV
Item 15. Exhibits

Table of Contents
Part III I tem 10. Directors, Executive Officers and Corporate Governance
Information required by this Item regarding our executive officers was included in Part III of our Form 10-K filed with the SEC on February 27, 2017.
OUR BOARD OF DIRECTORS
The table below sets forth information about the members of the Genworth Financial, Inc. Board of Directors (the “Board” or the “Board of Directors”),including their ages and length of service on our Board. The Board has determined that nine of the ten directors are independent directors under the New YorkStock Exchange (“NYSE”) listing requirements and our Governance Principles.
Director Age Director
Since William H. Bolinder 73 2010 G. Kent Conrad 69 2013 Melina E. Higgins 49 2013 Thomas J. McInerney 60 2013 David M. Moffett 65 2012 Thomas E. Moloney 73 2009 James A. Parke 71 2004 Debra J. Perry* 65 2016 Robert P. Restrepo Jr.* 66 2016 James S. Riepe+ 73 2006
* Elected to the Board of Directors on December 14, 2016+ Non-Executive Chairman of the Board
William H. Bolinder, former President, Chief Executive Officer and a director of Acadia Trust N.A.
Mr. Bolinder retired in June 2006 from serving as President, Chief Executive Officer and a director of Acadia Trust N.A., positions he had held since 2003.He had previously been a member of the Group Management Board for Zurich Financial Services Group from 1994 to 2002. Mr. Bolinder joined Zurich AmericanInsurance Company, USA in 1986 as Chief Operating Officer and became Chief Executive Officer in 1987. He has been a director of Endurance SpecialtyHoldings Ltd. since December 2001 and became the Lead Director of the Board in May 2013 (having served as the non-executive Chairman of the Board fromMarch 2011 until May 2013). Mr. Bolinder also previously served as a director of Quanta Capital Holding Ltd. from January 2007 to October 2008. Mr. Bolinderhas also served on the board of the American Insurance Association, American Institute for Chartered Property Casualty Underwriting, Insurance Institute forApplied Ethics, Insurance Institute of America, Insurance Services Office, Inc. and the National Association of Independent Insurers. Mr. Bolinder received a B.S.in Business Administration from the University of Massachusetts, Dartmouth.
Qualifications:Mr. Bolinder offers extensive experience in the insurance and financial services industry, including a combined 16 years serving in variouspositions with one of the world’s largest insurance companies and its U.S. subsidiary, and three years as president, chief executive officer and director of aninvestment advisory and trustee company. Mr. Bolinder’s current and former directorships with underwriters of specialty lines of insurance and reinsurance providevaluable knowledge regarding the international financial services sector.
Committees: Mr. Bolinder serves as the Chair of the Nominating and Corporate Governance Committee and as a member of the Risk Committee.
1
Table of Contents
G. Kent Conrad, former U.S. Senator.
Sen. Conrad served as a U.S. Senator representing the State of North Dakota from January 1987 to January 2013. He served as the Chair of the SenateBudget Committee from 2006 until his retirement. Prior to serving in the U.S. Senate, Sen. Conrad served as the Tax Commissioner for the State of North Dakotafrom 1981 to 1986 and as Assistant Tax Commissioner from 1974 to 1980. Sen. Conrad holds an A.B. degree in Political Science from Stanford University and anM.B.A. degree from George Washington University.
Qualifications:Sen. Conrad’s 26 years of experience as a U.S. Senator, including serving as Chair of the Senate Budget Committee for approximately sixyears, provides the Board with extensive information and insight into public policy, fiscal affairs, governmental relations and legislative and regulatory issues.
Committees: Sen. Conrad serves as a member of the Nominating and Corporate Governance Committee and the Risk Committee.
Melina E. Higgins, former Partner at The Goldman Sachs Group.
Ms. Higgins retired in 2010 from a nearly 20-year career at The Goldman Sachs Group Inc., where she served as a Managing Director from 2001 and aPartner from 2002. During her tenure at Goldman Sachs, Ms. Higgins served as Head of the Americas and Co-Chairperson of the Investment Advisory Committeefor the GS Mezzanine Partners funds, which managed over $30 billion of assets. She also served as a member of the Investment Committee for the PrincipalInvestment Area, which oversaw and approved global private equity and private debt investments. Goldman’s Principal Investment Area was one of the largestalternative asset managers in the world. Ms. Higgins has served as a director of Mylan N.V. since February 2013. Ms. Higgins has also served as non-executivechairman of the board of Antares Midco, Inc. since January 2016 and is a member of the Women’s Leadership Board of Harvard University’s John F. KennedySchool of Government. Ms. Higgins received a B.A. in Economics and Spanish from Colgate University and an M.B.A. from Harvard Business School.
Qualifications:Ms. Higgins’ extensive finance and investment experience, having spent nearly 20 years with The Goldman Sachs Group, Inc., as well asserving as a director for both public and private companies, provides the board with significant insight in connection with our restructuring and turnaroundinitiatives.
Committees: Ms. Higgins serves as a member of the Management Development and Compensation Committee and the Nominating and CorporateGovernance Committee.
Thomas J. McInerney, President and Chief Executive Officer of Genworth Financial, Inc.
Mr. McInerney has been our President and Chief Executive Officer and a director since January 2013. Before joining our company, Mr. McInerney hadserved as a Senior Advisor to the Boston Consulting Group from June 2011 to December 2012, providing consulting and advisory services to leading insurance andfinancial services companies in the United States and Canada. From October 2009 to December 2010, Mr. McInerney was a member of ING Groep’s ManagementBoard for Insurance, where he was the Chief Operating Officer of ING’s insurance and investment management business worldwide. Prior to that, he served in avariety of senior roles with ING Groep NV after serving in many leadership positions with Aetna, where he began his career as an insurance underwriter in June1978. Mr. McInerney is a member of the Board of the American Council of Life Insurers, and the Financial Services Roundtable. Mr. McInerney received a B.A. inEconomics from Colgate University and an M.B.A. from the Tuck School of Business at Dartmouth College.
Qualifications:Mr. McInerney offers insight into our company from his current role as the President and Chief Executive Officer. He also brings extensiveknowledge of the insurance and financial services industries gained through 30 years of experience serving in significant leadership positions with ING Groep NVand Aetna.
2
Table of Contents
David M. Moffett, former Chief Executive Officer and director of Federal Home Loan Mortgage Corporation.
Mr. Moffett was the Chief Executive Officer and a director of the Federal Home Loan Mortgage Corporation from September 2008 until his retirement inMarch 2009. Prior to this position, Mr. Moffett served as a Senior Advisor with the Carlyle Group LLC from May 2007 to September 2008. Mr. Moffett alsoserved as the Vice Chairman and Chief Financial Officer of U.S. Bancorp from 2001 to 2007, after its merger with Firstar Corporation, having previously served asVice Chairman and Chief Financial Officer of Firstar Corporation from 1998 to 2001 and as Chief Financial Officer of StarBanc Corporation, a predecessor toFirstar Corporation, from 1993 to 1998. Mr. Moffett has served as a director of CSX Corporation since May 2015, and PayPal Holdings, Inc. since July 2015(currently serving as its Lead Director). He also previously served on the boards of directors of CIT Group Inc. from July 2010 to May 2016, eBay Inc. from July2007 to July 2015, MBIA Inc. from May 2007 to September 2008, The E.W. Scripps Company from May 2007 to September 2008 and Building Materials HoldingCorporation from May 2006 to November 2008. Mr. Moffett also serves as a trustee on the boards of Columbia Fund Series Trust I and Columbia Funds VariableInsurance Trust, overseeing approximately 52 funds within the Columbia Funds mutual fund complex. He also serves as a trustee for the University of OklahomaFoundation. Mr. Moffett holds a B.A. degree in Economics from the University of Oklahoma and an M.B.A. degree from Southern Methodist University.
Qualifications: Mr. Moffett has many years of experience as the chief financial officer of public financial services companies. He also has experience as thechief executive officer of an entity in the housing finance industry, including related public policy experience.
Committees: Mr. Moffett serves as the Chair of the Management Development and Compensation Committee and as a member of the Nominating andCorporate Governance Committee.
Thomas E. Moloney, former Senior Executive Vice President and Chief Financial Officer of John Hancock Financial Services, Inc.
Mr. Moloney served as the interim Chief Financial Officer of MSC—Medical Services Company (“MSC”) from December 2007 to March 2008. He retiredas the Senior Executive Vice President and Chief Financial Officer of John Hancock Financial Services, Inc. in December 2004. He had served in this positionsince 1992. Mr. Moloney served in various roles at John Hancock Financial Services, Inc. during his tenure from 1965 to 1992, including Vice President,Controller, and Senior Accountant. Mr. Moloney has served as a director of SeaWorld Entertainment, Inc. since January 2015. He also previously served as adirector of MSC from 2005 to 2012 (MSC was acquired in 2012 and ceased to be a public company in 2008). Mr. Moloney is on the boards of Nashoba LearningGroup and the Boston Children’s Museum (past Chairperson), both non-profit organizations. Mr. Moloney received a B.A. in Accounting from Bentley Universityand holds an Executive Masters Professional Director Certification from the Corporate Directors Group.
Qualifications:Mr. Moloney provides almost 40 years of insurance industry and accounting experience, including having served as the chief financial officerof a public insurance company. He provides extensive knowledge of accounting and finance in regard to insurance products as well as risk assessment and riskoversight.
Committees: Mr. Moloney serves as the Chair of the Risk Committee and as a member of the Audit Committee.
James A. Parke, former Vice Chairman and Chief Financial Officer of GE Capital Services and former Senior Vice President of General ElectricCompany.
Mr. Parke retired as Vice Chairman and Chief Financial Officer of GE Capital Services and a Senior Vice President at General Electric Company (“GE”) inDecember 2005. He had served in those positions since 2002.
3
Table of Contents
From 1989 to 2002 he was Senior Vice President and Chief Financial Officer at GE Capital Services and a Vice President of GE. Prior thereto, from 1981 to 1989he held various management positions in several GE businesses. He serves as a director of First Community Bancorp in Glasgow, Montana. He also serves on theboard of buildOn, a not-for-profit corporation, and is active at Concordia College, serving as a member of its Investment Committee and as chairman of the OffuttSchool of Business Global Advisory Council. Mr. Parke received a B.A. in History, Political Science and Economics from Concordia College in Minnesota.
Qualifications:Mr. Parke offers extensive experience in the areas of finance, financial services and capital markets, gained in part through his 37 years ofexperience with GE and GE Capital Services, including having served as a former Vice Chairman and Chief Financial Officer of GE Capital Services, where hehelped build GE’s financial and insurance businesses.
Committees: Mr. Parke serves as the Chair of the Audit Committee and as a member of the Management Development and Compensation Committee.
Debra J. Perry, former Executive at Moody’s Investor Service, Inc.
Ms. Perry worked at Moody’s Corporation from 1992 to 2004. From 2001 to 2004, Ms. Perry was a senior managing director in the Global Ratings andResearch Unit of Moody’s Investors Service, Inc. where she oversaw the Americas Corporate Finance and U.S. Public Finance Groups. From 1999 to 2001,Ms. Perry served as Chief Administrative Officer and Chief Credit Officer, and from 1996 to 1999, she was a group managing director for the Finance, Securitiesand Insurance Rating Groups of Moody’s Corporation. Ms. Perry has also been a managing member of Perry Consulting LLC, an advisory firm specializing incredit risk management and governance within the financial industry, since 2008. Ms. Perry has served as a director of the Sanford C. Bernstein Fund, Inc., amutual fund, since July 2011, and Korn/Ferry International, a talent management and executive search firm, since 2008. She was a member of the board ofPartnerRe, a Bermuda-based reinsurance company, from June 2013 to March 2016. She was also a trustee of the Bank of America Funds from June 2011 untilApril 2016. Ms. Perry served on the board of directors of CNO Financial Group, Inc. from 2004 to 2011. In 2014, Ms. Perry was named to the National Associationof Corporate Directors’ Directorship 100, which recognizes the most influential people in the boardroom and corporate governance community. From September2012 to December 2014, Ms. Perry served as a member of the Executive Committee of the Committee for Economic Development (“CED”) in Washington, D.C. anon-partisan, business-led public policy organization, until its merger with the Conference Board, and she continues as a member of CED. Ms. Perry received herB.A. in History from the University of Wisconsin and her M.A. in European History from Yale University.
Qualifications:Ms. Perry brings extensive knowledge of corporate governance as a result of her many years of board and board committee experience,including service on multiple audit committees, two of which she has chaired. Ms. Perry also has significant experience in executive management at a NationallyRecognized Statistical Rating Organization, or “NRSRO,” where she oversaw the financial analysis and assignment of credit and financial strength ratings tofinancial and industrial companies and public sector entities, including the global insurance industry.
Committees: Ms. Perry serves as a member of the Audit Committee and the Risk Committee.
Robert P. Restrepo Jr., former Chairman and President and Chief Executive Officer of State Auto Financial Corporation.
Mr. Restrepo retired from State Auto Financial Corporation in 2015, having served as its Chairman from 2006 to December 2015 and as its President andChief Executive Officer from 2006 to May 2015. Mr. Restrepo has over 40 years of insurance industry experience, having held executive roles at Main StreetAmerica Group, Hanover Insurance Group Inc. (formerly Allmerica Financial Corp), Travelers and Aetna. Mr. Restrepo has served as a director of Majesco, aprovider of insurance software and consulting services, since August 2015, and
4

Table of Contents
RLI Corp., a property and casualty insurance company, since July 2016. Mr. Restrepo also currently serves on the boards of directors of The Larry H. Miller Groupof Companies and Nuclear Electric Insurance Limited. Mr. Restrepo received a B.A. in English from Yale University.
Qualifications:Mr. Restrepo offers over 40 years of experience managing and operating insurance companies and has expertise in corporate governance,acquisitions, risk, strategic planning and leadership development.
Committees: Mr. Restrepo serves as a member of the Audit Committee and the Management Development and Compensation Committee.
James S. Riepe, Senior Advisor and former Vice Chairman of T. Rowe Price Group, Inc. Lead Director from February 2009 to May 2012 and Non-Executive Chairman of the Board since May 2012.
Mr. Riepe is a retired Vice Chairman and a Senior Advisor at T. Rowe Price Group, Inc. Mr. Riepe served as the Vice Chairman of T. Rowe Price Group,Inc. from 1997 until his retirement in December 2005. Prior to joining T. Rowe Price Group, Inc. in 1981, Mr. Riepe was an Executive Vice President of TheVanguard Group. He has served as a director of LPL Financial Holdings Inc. since February 2008. Mr. Riepe also previously served on the boards of directors ofThe NASDAQ OMX Group, Inc. from May 2003 to May 2014, T. Rowe Price Group, Inc. from 1981 to 2006 and 57 T. Rowe Price registered investmentcompanies (mutual funds) until his retirement in 2006. He is a member of the University of Pennsylvania’s Board of Trustees. Mr. Riepe received a B.S. inIndustrial Management, an M.B.A. and an Honorary Doctor of Laws degree from the University of Pennsylvania.
Qualifications:Mr. Riepe brings to the Board significant expertise in finance and investments, as well as extensive management and operating experience,gained through his role as a senior executive in the investment management industry, including 23 years with T. Rowe Price.
Committees: Mr. Riepe is a member of the Audit Committee and Management Development and Compensation Committee.
CORPORATE GOVERNANCE
Governance Principles
Our Governance Principles are published on our website, as are our other corporate governance materials, including the charters adopted by the Board foreach of our standing committees and any key practices adopted by the committees. To view these materials, go to www.genworth.com, select “Investors” and thenselect “Corporate Governance.” The Board regularly reviews corporate governance developments and may modify these principles, charters and key practices aswarranted. Any modifications will be reflected in the documents on our website.
Code of Business Conduct and Ethics
All of our directors, officers and employees, including our principal executive officer, principal financial officer, principal accounting officer and controller,must act ethically at all times and in accordance with the policies comprising our code of business conduct and ethics set forth in Genworth’s Code of Ethics(“Code of Ethics”). If an actual or potential conflict of interest arises for a director, the director shall promptly inform the chief executive officer. To view our Codeof Ethics, go to www.genworth.com, select “Investors,” then select “Corporate Governance,” then select “Code of Business Conduct & Ethics” and finally select“Genworth Code of Ethics.” Section 11 of our Governance Principles, which are available on our website, more fully addresses our Code of Ethics. Under ourGovernance Principles, the Board will not permit any waiver of any ethics policy for any director or executive officer. Within the time period required by the SECand the NYSE, we will post on our website any amendment to our Code of Ethics.
5

Table of Contents
Communication with Genworth’s Board of Directors
The Board of Directors has established a process for stockholders and other interested persons to communicate directly with Genworth and its non-management directors. Information regarding this process, including how to email or write our non-management directors, may be found on our website. To viewthis process, go to www.genworth.com,select “Investors,” then select “Corporate Governance” and finally select “Contact the Board.” Concerns relating toaccounting, internal accounting controls and auditing matters may also be submitted confidentially and anonymously through the methods specified on our website.You may direct your communications to our non-management directors as a group or individually, or to any committee of the Board of Directors. The CorporateSecretary or Genworth’s ombudsman monitors, reviews and sorts all written communications to the non-management directors. Communications related to mattersthat are within the scope of the responsibilities of the Board of Directors are forwarded to the Board of Directors, the relevant committee of the Board or anindividual director, as appropriate.
The Corporate Secretary or Genworth’s ombudsman forwards correspondence related to routine business and customer service matters to the appropriatemanagement personnel. The Corporate Secretary or Genworth’s ombudsman will immediately consult with the Audit Committee Chairman, who will determinewhether to communicate further with the Audit Committee and/or the full Board of Directors with respect to the correspondence received relating to accounting,internal accounting controls, auditing matters or officer conduct.
Letters may be sent to the non-management directors as a group or individually, c/o the Corporate Secretary, Genworth Financial, Inc., 6620 West BroadStreet, Building #1, Richmond, Virginia 23230.
In addition, letters may be sent directly to Genworth, c/o the Corporate Secretary or Investor Relations, Genworth Financial, Inc., 6620 West Broad Street,Building #1, Richmond, Virginia 23230.
BOARD OF DIRECTORS AND COMMITTEES
Board Composition
Our Board of Directors is composed of individuals with diverse experience at policy-making levels in business and government in areas that are relevant tothe company. Each director was nominated on the basis of the unique set of qualifications and skills he or she brings to the Board, as well as how thosequalifications and skills blend with those of the others on the Board as a whole. The blend of our directors’ diverse backgrounds ensures that issues facing thecompany are examined and addressed with the benefit of a broad array of perspectives and expertise.
We believe that our directors have demonstrated leadership in a variety of positions across various professions and industries. Their experiences,qualifications, attributes and skills include:
DIRECTOR EXPERIENCES, QUALIFICATIONS, ATTRIBUTES AND SKILLS✓ Chief Executive Officer (Former or Current) ✓ Healthcare/Medical✓ Chief Financial Officer (Former or Current) ✓ Consumer Marketing✓ Insurance ✓ Public Policy/Political✓ Mortgage ✓ Technology/IT✓ Risk ✓ Restructuring and Turnaround✓ Mergers and Acquisitions ✓ Asset Management✓ Finance and Investment Management ✓ International
6

Table of Contents
As a group, apart from Mr. McInerney, our directors include three former chief executive officers (Mr. Bolinder, Mr. Moffett and Mr. Restrepo), threeformer chief financial officers (Mr. Moffett, Mr. Moloney and Mr. Parke), six directors with a background in insurance (Mr. Bolinder, Mr. Moffett, Mr. Moloney,Mr. Parke, Ms. Perry and Mr. Restrepo), one director with mortgage experience (Mr. Moffett), seven directors with risk experience (Mr. Bolinder, Mr. Moffett,Mr. Moloney, Mr. Parke, Ms. Perry, Mr. Restrepo and Mr. Riepe), eight directors with experience in mergers and acquisitions (Mr. Bolinder, Ms. Higgins,Mr. Moffett, Mr. Moloney, Mr. Parke, Ms. Perry, Mr. Restrepo and Mr. Riepe), seven directors with a background in finance and investment management (Mr.Bolinder, Ms. Higgins, Mr. Moffett, Mr. Moloney, Mr. Parke, Ms. Perry and Mr. Riepe), two directors with healthcare and medical experience (Sen. Conrad andMs. Higgins), one director with consumer marketing experience (Mr. Riepe), three directors with public policy experience (Sen. Conrad, Mr. Moffett andMr. Restrepo), three directors with technology experience (Mr. Moloney, Mr. Parke and Mr. Riepe), three directors with restructuring and turnaround experience(Ms. Higgins, Ms. Perry and Mr. Restrepo), five directors with a background in asset management (Mr. Bolinder, Ms. Higgins, Mr. Moffett, Ms. Perry andMr. Riepe), and seven directors with international experience (Mr. Bolinder, Ms. Higgins, Mr. Moffett, Mr. Moloney, Mr. Parke, Ms. Perry and Mr. Riepe). See theOurBoardofDirectorssection above for a description of each director’s complete biographical information, qualifications and skills.
Subject to the rights of the holders of any outstanding series of our preferred stock, our certificate of incorporation provides that the number of authorizeddirectors of our company will be fixed from time to time by a resolution adopted by our Board of Directors, but will not be less than one nor more than fifteen. OurGovernance Principles further state that the size of the Board should be in the range of seven to 15 directors. Our Board of Directors has set the size of the Board ofDirectors at ten members, effective December 14, 2016, but continues to evaluate the optimal size for the Board and may consider the addition of one or moreindependent directors to the Board in the future.
Our Governance Principles provide that directors who serve as chief executive officers or in equivalent positions for other public companies should not serveon more than two other boards of public companies in addition to the Genworth Board and other directors should not serve on more than four other boards of publiccompanies in addition to the Genworth Board.
Board Committees
The four standing committees of the Board are the Audit Committee, Management Development and Compensation Committee, Nominating and CorporateGovernance Committee and Risk Committee. These committees are described below. The Board has established written charters for each of its four standingcommittees. Our Board of Directors may also establish various other committees to assist it in carrying out its responsibilities.
AuditCommittee
The Board has established the Audit Committee in accordance with Section 3(a)(58)(A) of the Securities Exchange Act of 1934, as amended (the “ExchangeAct”). The Audit Committee consists solely of “independent” directors as defined by the applicable rules of the NYSE and the SEC and by our GovernancePrinciples. In addition, the Board has determined that all five of the Audit Committee’s current members, Messrs. Moloney, Parke, Restrepo and Riepe andMs. Perry, are “audit committee financial experts,” as defined by SEC rules.
As more fully set forth in its charter, which can be found in the corporate governance section of our website (to view, go to www.genworth.com, select“Investors,” then select “Corporate Governance,” then select “Audit Committee” and finally select “Charter”), the purpose of the Audit Committee is to assist theBoard in its oversight of the integrity of the company’s financial statements, the company’s compliance with legal and regulatory requirements, the independenceand qualifications of the company’s independent registered public
7

Table of Contents
accounting firm and the performance of the company’s internal audit function and independent auditors. The Audit Committee’s duties include:
• discussing with management and our independent registered public accounting firm our annual and quarterly financial statements, earnings releasesand financial information and earnings guidance provided to analysts and rating agencies;
• selecting our independent registered public accounting firm and approving the terms of its engagement;
• discussing with management and our independent registered accounting firm any audit problems or difficulties and management’s response;
• independently and/or in coordination with the Risk Committee, overseeing risks associated with financial accounting and reporting, including thesystem of internal control, which includes reviewing and discussing with management and our independent registered public accounting firm thecompany’s risk assessment process and management policies with respect to the company’s major financial risk exposure and the procedures utilizedby management to identify and mitigate the exposure to such risks;
• reviewing our financial reporting and accounting standards and principles;
• reviewing our internal system of financial controls and the results of internal audits;
• obtaining and reviewing formal written reports from the independent registered public accounting firm regarding its internal quality-controlprocedures;
• reviewing and investigating any matters pertaining to the integrity of management, including conflicts of interest, or adherence to standards of businessconduct;
• preparing and publishing a committee report;
• establishing procedures for the hiring of employees or former employees of our independent registered public accounting firm;
• establishing procedures for the receipt, retention and treatment of complaints on accounting, internal accounting controls or auditing matters; and
• establishing policies and procedures for the review and approval of all proposed transactions with “Related Persons,” as that term is defined inSection 11(b) of our Governance Principles.
The Audit Committee has determined that in view of the increased demands and responsibilities of the committee, its members generally should not serve onmore than two additional audit committees of other public companies.
ManagementDevelopmentandCompensationCommittee
The Management Development and Compensation Committee (the “Compensation Committee”) consists solely of “independent” directors as defined by theapplicable rules of the NYSE and by our Governance Principles. As more fully set forth in its charter, which can be found in the corporate governance section ofour website (to view, go to www.genworth.com, select “Investors,” then select “Corporate Governance,” then select “Management Development andCompensation Committee” and finally select “Charter”), the Compensation Committee’s responsibilities include:
• reviewing and approving on an annual basis the corporate goals and objectives with respect to the compensation of our CEO, evaluating our CEO’sperformance in light of these goals and objectives and setting our CEO’s compensation based on such evaluation;
• reviewing and approving on an annual basis the evaluation process and compensation structure for our other officers, including evaluating and settingthe compensation for our senior executive officers;
8

Table of Contents
• reviewing and approving our variable incentive compensation and other stock-based compensation plans;
• assisting the Board in developing and evaluating potential candidates for executive positions and overseeing the development of succession plans;
• assessing the structure and composition of the leadership of the company;
• reviewing and discussing our Compensation Discussion and Analysis, recommending its inclusion to the Board in our annual reports and proxystatements and publishing a committee report;
• overseeing risks relating to our compensation programs; and
• determining whether the work of any compensation consultant who had a role in determining or recommending the amount or form of executive ordirector compensation raised any conflict of interest.
Under its charter, the Compensation Committee has authority to delegate any of its responsibilities to subcommittees as the Compensation Committee maydeem appropriate in its sole discretion. The Compensation Committee’s report appears in Item 11 of this Amendment. Additional information regarding theCompensation Committee’s processes and procedures for consideration of executive compensation is also provided in Item 11— CompensationDiscussionandAnalysissection below.
NominatingandCorporateGovernanceCommittee
The Nominating and Corporate Governance Committee (the “Nominating Committee”) consists solely of “independent” directors as defined by theapplicable rules of the NYSE and by our Governance Principles. As more fully set forth in its charter, which can be found in the corporate governance section ofour website (to view, go to www.genworth.com, select “Investors,” then select “Corporate Governance,” then select “Nominating and Corporate GovernanceCommittee” and finally select “Charter”), the Nominating Committee’s responsibilities include:
• leading the search for individuals qualified to become members of our Board;
• reviewing the Board’s committee structure and recommending committee members;
• developing and annually reviewing the governance principles;
• overseeing the annual self-evaluations of the Board and its committees;
• overseeing risks related to corporate governance;
• reviewing annually director compensation and benefits; and
• periodically reviewing the environmental, social and governance practices of the company.
The Nominating Committee makes recommendations to the Board of Directors of candidates for election to our Board, and our Board of Directors nominatesdirector candidates and makes recommendations to our stockholders. This committee will consider all stockholder recommendations for candidates for the Board,which should be sent to the Nominating and Corporate Governance Committee, c/o Corporate Secretary, Genworth Financial, Inc., 6620 West Broad Street,Building #1, Richmond, Virginia 23230.
The Nominating Committee believes all director nominees should meet certain qualifications and possess certain qualities or skills that, when considered inlight of the qualities and skills of the other director nominees, assist the Board in overseeing our operations and developing and pursuing its strategic objectives.The Nominating Committee believes each director nominee should at a minimum:
• possess the highest personal and professional ethics, integrity and values;
9
Table of Contents
• be committed to representing the long-term interests of our stockholders;
• have an inquisitive and objective perspective, practical wisdom and mature judgment;
• bring a distinct skill set of value to the Board and the company when viewed alone and in combination with other directors;
• be willing and able to devote sufficient time to carrying out his or her duties and responsibilities effectively; and
• be committed to serve on the Board for an extended period of time.
The Nominating Committee, as a matter of practice, takes diversity factors into account when considering potential director nominees. The company doesnot have a formal policy on Board diversity. The qualifications, qualities and skills required for directors are further set forth in Section 3 of Genworth’sGovernance Principles, which are available on our website.
In addition to considering candidates suggested by stockholders, the Nominating Committee considers potential candidates recommended by currentdirectors, company officers, employees and others. We have also engaged an outside search firm to assist us in identifying and evaluating potential directorcandidates. Ms. Perry and Mr. Restrepo were each evaluated as a candidate for the Board by our Nominating Committee at the suggestion of our outside searchfirm. The Nominating Committee considers all potential candidates regardless of the source of the recommendation and determines whether potential candidatesmeet our qualifications, qualities and skills for directors. Where there is an interest in a particular candidate, the Nominating Committee’s review is multi-facetedand typically includes a review of written materials regarding the candidate, due diligence performed internally and externally, a review of a completed candidatequestionnaire and one or more interviews with members of the Nominating Committee.
The Nominating Committee is also responsible for reviewing periodically the nature and amount of our political contributions, the operations of our PoliticalAction Committee and our public disclosure regarding such activities. In addition, the Nominating Committee periodically reviews our policies and practices onmatters of corporate citizenship, including philanthropic programs and financial and other support of charitable, education and cultural organizations.
RiskCommittee
The purpose of the Risk Committee is to assist the Board in its oversight of all areas relating to Genworth’s enterprise risk management policies and therelated risk profiles, including, but not limited to, the following major risk exposures: credit risks; market risks; insurance risks; housing risks; operational risks;model risks; and any other risk that poses a material threat to the viability of the company.
As more fully set forth in its charter, which can be found in the corporate governance section of our website (to view, go to www.genworth.com, select“Investors,” then select “Corporate Governance,” then select “Risk Committee” and finally select “Charter”), the Risk Committee’s responsibilities include:
• reviewing and recommending annually for Board approval (i) the company’s enterprise risk management policies and (ii) the risk appetite of thecompany, and to oversee the implementation and maintenance of such policies and appetite;
• receiving regular reports on the efforts to implement and comply with regulatory requirements related to risk management;
• reviewing and overseeing the control, management and mitigation processes relating to Genworth’s enterprise risk management policies and riskappetite;
• reviewing Genworth’s ability to assess and manage significant and emerging risks;
10

Table of Contents
• reviewing and analyzing Genworth’s major risk exposures, strategies, processes, and policies, with accompanying stress tests;
• reviewing and overseeing Genworth’s internal risk function;
• periodically reviewing and overseeing Genworth’s compliance processes and policies;
• receiving reports regarding risks associated with litigation and investigations/regulatory matters involving the company; and
• discussing with management the company’s overall investment portfolio and investment strategies.
SECTION 16(a) BENEFICIAL OWNERSHIP REPORTING COMPLIANCE
Section 16(a) of the Exchange Act requires our directors, executive officers and holders of more than 10% of our common stock to file with the SEC initialreports of ownership and reports of changes in ownership of our common stock and other equity securities. Such persons are required by SEC regulations to furnishus with copies of all Section 16(a) forms filed by such person with respect to our securities.
To our knowledge, all filings required to be made by reporting persons during 2016 were timely made in accordance with the requirements of Section 16(a)of the Exchange Act.
11

Table of Contents
Item 11. Executive Compensation
REPORT OF THE MANAGEMENT DEVELOPMENT AND COMPENSATION COMMITTEE
The Management Development and Compensation Committee of the Board of Directors oversees the compensation programs of Genworth Financial, Inc. onbehalf of the Board. In fulfilling its oversight responsibilities, the committee reviewed and discussed with management the Compensation Discussion and Analysisincluded in this document.
In reliance on the review and discussion referred to above, the Management Development and Compensation Committee recommended to the Board ofDirectors that the Compensation Discussion and Analysis be included in Genworth’s Form 10-K for the fiscal year ended December 31, 2016, which has been orwill be filed with the U.S. Securities and Exchange Commission.
This report shall not be deemed to be incorporated by reference by any general statement incorporating by reference into any filing under the Securities Actof 1933, as amended, or the Securities Exchange Act of 1934, as amended, and shall not otherwise be deemed filed under such acts. This report is provided by thefollowing independent directors, who constitute the committee:
David M. Moffett, ChairMelina E. HigginsJames A. ParkeRobert P. Restrepo Jr.James S. Riepe
12
Table of Contents
COMPENSATION DISCUSSION AND ANALYSIS
This section provides an overview and analysis of our compensation programs and policies, including the material compensation decisions made under theprograms with respect to the following executive officers, whom we refer to as our “named executive officers” or “NEOs:”
• Thomas J. McInerney, President and Chief Executive Officer (“CEO”);
• Kelly L. Groh, Executive Vice President and Chief Financial Officer (“CFO”);
• Kevin D. Schneider, Executive Vice President and Chief Operating Officer (“COO”);
• Ward E. Bobitz, Executive Vice President and General Counsel; and
• Daniel J. Sheehan IV, Executive Vice President—Chief Investment Officer (“CIO”).
Executive Summary
We aligned named executive officer incentives in 2016 with the execution of financial and other strategic initiatives that would improve our operatingperformance, enable strategic flexibility of our life and long-term care insurance businesses, and increase returns in our mortgage insurance businesses. We met orexceeded our key operational, strategic and financial objectives for 2016 across all businesses, except for our Australia mortgage insurance business whichexperienced loss ratio pressures in certain commodity dependent regions.
Additionally, and following an active and extensive strategic review process over two years, the company entered into a definitive agreement in the fourthquarter of 2016 with China Oceanwide Holdings Group Co., Ltd. (“Oceanwide”) under which Oceanwide has agreed to acquire all of the outstanding shares of thecompany. The transaction has been approved by Genworth’s stockholders, and is subject to other closing conditions, including the receipt of regulatory approvals. 1
2016CompanyPerformance
Below is a summary of our key performance results for 2016:
Mortgage Insurance
• Our U.S. and Canada mortgage insurance businesses significantly exceeded their goals with respect to adjusted operating income 2 and operatingreturn on equity (“operating ROE”) 3 , while our Australia mortgage insurance business ended the year slightly below target;
• We exceeded our internal goals for our private mortgage insurer eligibility requirements (“PMIERs”) in our U.S. mortgage insurance business andwere above plan for new business pricing returns and market share; and
• We maintained prudent top-line growth in our Canada mortgage insurance business within risk tolerances, and maintained strong portfolio quality. 1 This Compensation Discussion and Analysis, as well as the compensation disclosure that follows under Item 12, are presented without regard to the terms of
the proposed merger with Oceanwide. For further information regarding the terms, conditions and interests of certain persons under the proposed merger, seeour proxy statement for the special meeting of stockholders held on March 7, 2017, which was filed on January 25, 2017.
2 “Adjusted operating income (loss)” equals income (loss) from continuing operations excluding the after-tax effects of income attributable to non-controllinginterests, net investment gains (losses), goodwill impairments, gains (losses) on the sale of businesses, gains (losses) on the early extinguishment of debt,gains (losses) on insurance block transactions, restructuring costs, and infrequent or unusual non-operating items.
3 “Operating ROE” for each of our mortgage insurance businesses is defined in the table outlining key financial metrics on page 20.
13
Table of Contents
Life Insurance
• We exceeded our goals for premium rate increases on our blocks of long-term care insurance, and continued execution of our multi-year rate actionfiling plan;
• We successfully executed bondholder consents to provide the company strategic flexibility to take actions to separate and isolate our long-term careinsurance business;
• We made meaningful progress toward the separation and isolation of our long-term care insurance business through reinsurance, repatriation and othertransactions in 2016; and
• We achieved our internal target expense run-rate goal for 2016.
Corporate and Other
• We had strong investment portfolio performance, exceeding our goals for net investment income, impairments and trading losses for the year; and
• We ended the year with holding company cash and cash equivalents of $1,098 million 4 , which remained above our target of one and one-half timesannual debt service, plus a $350 million buffer.
Impactof2016PerformanceonCompensation
Our operating performance in 2016, as well as our trailing three-year performance, have directly impacted our named executive officer compensation, asfollows:
• The company met or exceeded most of our annual financial and operating goals, except in Australia, resulting in an annual incentive award to our CEOfor 2016 that was above target;
• Annual incentive awards for our other named executive officers were also above target, and differentiated based on performance for their respectiveareas of responsibility and contributions made toward our strategic priorities;
• Our trailing three-year performance from 2014 through 2016 was significantly below target, resulting in the cancellation of our 2014-2016Performance Stock Units (“PSUs”) without any payout; and
• The value of outstanding long-term equity awards (both vested and unvested) held by our named executive officers continues to be significantly belowtargeted values, consistent with the decline in our stock price and company performance over that same three-year time period.
ImpactofPerformanceonCEOCompensation
The following illustrations summarize the total direct compensation for our CEO for 2013 through 2016 through three different perspectives: reportedpay,which values long-term equity awards based on a grant-date fair value; realizablepay, which reflects the accumulated spread or nominal value of outstandingequity awards as of December 31, 2016 for awards made in the represented year; and realizedpay, which shows the value actually realized from any stockappreciation rights (“SARs”) exercised and restricted stock units (“RSUs”) vested during the period.
Because we aligned the largest portion of our CEO’s initial compensation package in 2013 with stockholder value through an award of SARs, which onlyyields value to the extent the stock price appreciates above the base price established on the grant date, there is a significant difference between reportedpayin2013 for long-term equity, and what that initial award has yielded in terms of either realizablepayor realizedpayas of the end of 2016. For example, the baseprice of Mr. McInerney’s initial grant of SARs upon his hire in 2013 was $7.90, 4 Comprises cash and cash equivalents of $998 million and U.S. government bonds of $100 million as of December 31, 2016.
14

Table of Contents
with a reportedvalueof approximately $7.1 million. However, our stock price as of the end of 2016 was significantly below the base price for that award, resultingin no value related to that award in the realizablepaycolumn for 2013, and none of those SARs have been exercised, resulting in no value as realizedpayfor anyof the subsequent years.
CEO Reported, Realizable and Realized Pay
(1) Reported Pay represents: (i) base salary paid; (ii) actual annual incentive earned for performance in the period; and (iii) the grant-date fair value of any
equity-based awards granted during the period (SARs, RSUs, or target value of PSUs), each as reported in the Summary Compensation Table for theapplicable year. Reported pay excludes any amounts shown as “all other compensation” in the Summary Compensation Table for illustrative purposes.
(2) Realizable Pay represents: (i) base salary paid; (ii) actual annual incentive earned for performance in the period; and (iii) the value as of December 31, 2016,
based on our closing price of $3.81, of any outstanding long-term equity awards granted during the applicable year.
Realizable pay for 2013 does not include any outstanding value for the SARs granted as part of Mr. McInerney’s initial compensation package because theclosing price of our stock on December 31, 2016 was below the exercise price of the SARs. It also does not include any value related to his initial grant ofRSUs, which have all since vested and are reflected as Realized Pay in the year vested.
Realizable pay for 2014 does not include any outstanding value for the 2014-2016 PSUs because company performance was below threshold levels and thoseawards have been cancelled.
Realizable pay for 2015 includes the estimated value of 2015-2017 PSUs awarded in 2015 based on applying 2016 year-end performance against theperformance goals, and then reflecting achievement at the next highest performance milestone. By applying the company’s 2016 year-end Book ValueMultiple to the 2015-2017 PSU performance goals, performance would be below threshold and thus no shares would vest, however, for purposes of thistable, we have shown the value as of December 31, 2016 of the threshold number of PSUs (50%).
Realizable pay for 2016 includes the estimated value of 2016-2018 PSUs awarded in 2016 based on applying 2016 year-end projected performance againstthe performance goals, and then reflecting achievement at the next highest performance milestone. As of the end of 2016, we estimate performance for theseawards to be performing at or slightly above target. Therefore, for purposes of this table, we have shown the value as of December 31, 2016 of the maximumnumber of PSUs (125%).
(3) Realized Pay represents: (i) base salary paid; (ii) actual annual incentive earned for performance in the period; and (iii) the pre-tax value of any RSUs vested
or SARs exercised during the period, valued at the time of such vesting or exercise. No SARs have been exercised and no awards of PSUs have vested in thereported timeframe.
15

Table of Contents
AdditionalKeyCompensationDevelopments
• Our CEO was awarded a regular and competitively-sized annual long-term equity grant in the first quarter of 2016, which was different from prior
years because his initial long-term equity grants awarded at the time of his hire in January 2013 were intended to provide three-years of annual equityincentive values covering 2013-2015.
• For 2016, our CEO’s annual equity award was denominated entirely in PSUs, which vest based on company performance over three years, whileawards to our other named executive officers were denominated 50% in the form of PSUs, and the remaining 50% in RSUs.
• Certain previously awarded cash retention incentives for Ms. Groh and Messrs Schneider, Sheehan and Bobitz were earned in 2016. These incentives
were established in prior years based on the individual’s demonstrated sustained leadership and importance to the company’s strategic reviewinitiatives. Our CEO has not been awarded any cash retention incentives.
Consideration of Last Year’s Advisory Stockholder Vote on Executive Compensation
At the 2016 Annual Meeting of Stockholders on May 12, 2016, over 82% of the shares voted were cast in favor of the compensation of the company’snamed executive officers, as discussed and disclosed in the 2016 proxy statement. Annual advisory votes to approve named executive officer compensation serveas a tool to help guide the Compensation Committee in evaluating the alignment of the company’s executive compensation programs with the interests of thecompany and our stockholders. We also reach out from time to time to obtain stockholder input on the company’s compensation and governance practices, and toaddress any questions they may have. In considering the results of the 2016 advisory vote to approve named executive officer compensation, the CompensationCommittee concluded that the company’s overall pay practices and the compensation paid to our named executive officers for 2015 relative to the company’sperformance enjoyed strong stockholder support, and did not make any specific changes to our compensation program as a result of the vote.
Governance and Principles Underlying Our Compensation Programs
Our objective in compensating executive officers is to attract, retain and motivate employees of superior ability who are dedicated to the long-term interestsof our stockholders. With this objective in mind, the following principles guide our compensation program design and individual compensation decisions.Additionally, we have highlighted below key elements of our compensation programs or policies for named executive officers that illustrate how we support theseprinciples in practice: Our Guiding Principles Examples of Programs or Policies That Support Our Principles
Compensation should be primarily performance-based and align executive officerincentives with stockholder interests across multiple timeframes.
• Annual incentives (short-term performance-based awards)
• Annual long-term equity grants to NEOs include PSUs (vest based oncompany performance after three years), and RSUs (long-term stockappreciation with an emphasis on retention)
At-risk pay and compensation design should reflect an executive officer’s impacton company performance over time.
• Our CEO’s 2016 equity grant was delivered 100% in PSUs, while otherNEO awards were delivered 50% in PSUs and 50% in RSUs
• Long-term incentives constitute the largest component of annualcompensation opportunities for executive officers
• Annual incentive goals align NEO compensation with performance intheir area of responsibility
16

Table of Contents
Total compensation opportunities should be competitive within the relevantmarketplace.
• Our compensation benchmarking approach, as described below, andchanges adopted to our peer group in 2016
Our incentive compensation should reward financial and operational performance,and allow for qualitative assessment.
• In determining annual incentive awards, the Compensation Committeemeasures performance against specific financial objectives for theperson’s area of responsibility, together with a qualitative assessmentof operational performance and other results
• Our PSUs reward achievement of specific longer-term companyobjectives, while the Compensation Committee reserves the flexibilityof negative discretion at payout
Plan designs and incentives should support appropriate risk management practices.
• Executive Officer Stock ownership guidelines for the CEO (7x salary),our COO, CFO and CIO (3x), and for our other Executive VicePresidents or Senior Vice Presidents (2x)
• 50% retention ratio for net after-tax shares received from the vesting orexercise of all equity incentive awards until executive officers’ stockownership guidelines are met, ensuring significant personal assets arealigned with long-term stockholder interests
• Exercises of previously awarded stock options and SARs are settled instock and are subject to a nine-month net hold requirement
• Clawback, anti-hedging and anti-pledging policies
Our Decision-Making Process
RoleoftheCompensationCommittee
The Compensation Committee seeks a collaborative relationship with management, and currently uses an independent third-party compensation consultant toprovide for a more informed decision-making process and objective perspective in this important governance matter. The Compensation Committee facilitates theannual review process of CEO performance and compensation decisions, with input from the Board and support of the compensation consultant. The CompensationCommittee regularly meets in executive session without management present, and retains the final authority to approve all compensation policies, programs andamounts paid to our named executive officers.
RoleofManagementandCompensationConsultants
Our CEO and Executive Vice President—Human Resources regularly attend meetings of the Compensation Committee to provide analysis, details andrecommendations regarding the company’s executive compensation programs and plan design. Our COO also periodically attends Compensation Committeemeetings to provide additional analysis of business strategy, context for understanding incentive goals and results, and his perspectives on leadership and talentwithin our operating businesses. Our CEO provides the Compensation Committee with performance assessments and compensation recommendations in his role asa manager for individual named executive officers (other than himself). The Compensation Committee, typically in the first quarter of each year, then determinesand approves annual incentive award payouts for the prior year, any adjustments to base salary, target annual incentives for the upcoming year, and awards of long-term incentives to executive officers. For more information on the compensation decisions made in 2016, see the OurAnnualCompensationProgramsectionbelow.
17

Table of Contents
The Compensation Committee has retained Steven Hall & Partners, LLC, an independent compensation consultant, to assist in reviewing and analyzingcompensation data for our named executive officers, including our CEO. The compensation consultant regularly attends Compensation Committee meetings andmeets with the Compensation Committee in executive session without management present. The Compensation Committee occasionally requests special studies,assessments of market trends and education regarding changing laws and regulations from the compensation consultant to assist the Compensation Committee in itsdecision-making processes for the CEO and other executive officers. For example, in 2016, the compensation consultant supported the Committee’s evaluation of arevised peer group to be used for benchmarking purposes, and provided advice related to market practices for treatment of outstanding incentives under alternativetransaction scenarios. The compensation consultant provides the Compensation Committee with advice, but does not determine the amount or form ofcompensation for our named executive officers.
The Compensation Committee assessed the independence of the compensation consultant and other advisors pursuant to SEC rules and concluded that noconflict of interest exists that would prevent the compensation consultant or other advisors from independently representing the Compensation Committee.
EvaluatingMarketCompetitiveness
We generally evaluate market competitiveness of our programs as an input into the process of designing plans and setting target compensation levels fornamed executive officers. We review each component of compensation for our named executive officers separately and in the aggregate, and also consider theinternal relationships among the named executive officers to help determine appropriate pay levels. With respect to individual named executive officers, wecompare the total target compensation opportunities for our named executive officers to target opportunities for similar positions at comparable companies. Thesebenchmarks are a gauge for evaluating market competitiveness, but are not given greater weight than other key factors when making compensation decisions. Forexample, individual named executive officers may have higher or lower target compensation levels compared to market medians based on level of responsibility,individual experience and skills, performance trends, competitive dynamics, retention needs and internal equity considerations.
The Compensation Committee typically utilizes a combination of publicly available information related to a specific list of peer companies (the “PeerGroup”), as well as information available through market compensation surveys to provide a broad perspective of market practice. While no individual companymatches our lines of business precisely, the Peer Group is intended to represent, in the aggregate, companies with revenue sources and talent demands similar to thecompany. With respect to size, we generally look at revenue or total assets as indicators of comparability rather than market capitalization due to the potential forvolatility year over year as stock prices change. The companies included in market surveys used by the company are not individually identifiable for a particularexecutive position (and therefore we are not benchmarking against any particular company within the survey), and also may change from year-to-year based onvoluntary participation in the market surveys we use, mergers and divestitures, or changes in corporate structure.
To the extent we make changes to our business portfolio, or as peer companies adjust their own business lines or distribution channels, we will consideradding peers, or removing peers which no longer have revenue sources and talent demands similar to ours. The Compensation Committee will consider advice andrecommendations developed by its compensation consultant to support our benchmarking principles. The Peer Group used when considering 2016 compensationactions was composed of the following companies: Aflac, Inc. Fidelity National Financial Protective Life CorporationAon plc Lincoln National Corporation Radian GroupAssurant, Inc. Marsh & McLennan Companies, Inc. Reinsurance Group of America, Inc.The Chubb Corporation MGIC Investment Corporation Unum GroupCNO Financial Group, Inc. Principal Financial Group, Inc.
18

Table of Contents
In 2016, and following determination of 2016 compensation for our named executive officers, we reviewed our Peer Group and determined to make thefollowing adjustments based on changes in company size, sources of revenue and sources of talent:
Removed:Aon plc, The Chubb Corporation, and Marsh & McLennon Companies, Inc.Added:American Financial Group, Inc., CNA Financial Corporation, First American FinancialCorporation, and Hanover Insurance Group, Inc.
Our Annual Compensation Program
Our 2016 annual compensation program for named executive officers consists of the following key elements: base salary, annual incentive, and annual long-term equity grants (including RSUs and/or PSUs). Below is a summary and assessment of actions taken with respect to our annual compensation program for ournamed executive officers.
BaseSalary
Base salaries are generally intended to reflect the scope of an executive officer’s responsibilities and level of experience, reward sustained performance overtime and be market-competitive. In February 2016, the Compensation Committee undertook its annual review of executive officer base salaries. The CompensationCommittee approved a salary increase for Ms. Groh of 10%, as a continuation of her base salary progression to market competitive levels following her promotionin 2015. The Compensation Committee determined to not make any base salary adjustments for the other named executive officers at that time as the existing basesalaries were considered competitive within the marketplace for their roles. Previously, in December 2015, the Compensation Committee approved a base salaryincrease for Mr. Schneider of 12% in connection with his appointment as COO, effective January 1, 2016.
AnnualIncentive
In our annual incentive program, we review performance against clear financial objectives, together with a qualitative assessment of operational objectivesand other accomplishments toward strategic priorities not necessarily reflected in annual financial results. Each named executive officer has an annual incentivetarget, expressed as a percentage of base salary. The 2016 target annual incentive opportunities for our named executive officers ranged from 100% to 200% ofbase salary, and payout opportunities for 2016 ranged from zero to 200% of their individual target amount. Individual annual incentive targets are reported in the2016 Grants of Plan-Based Awards Table below.
19
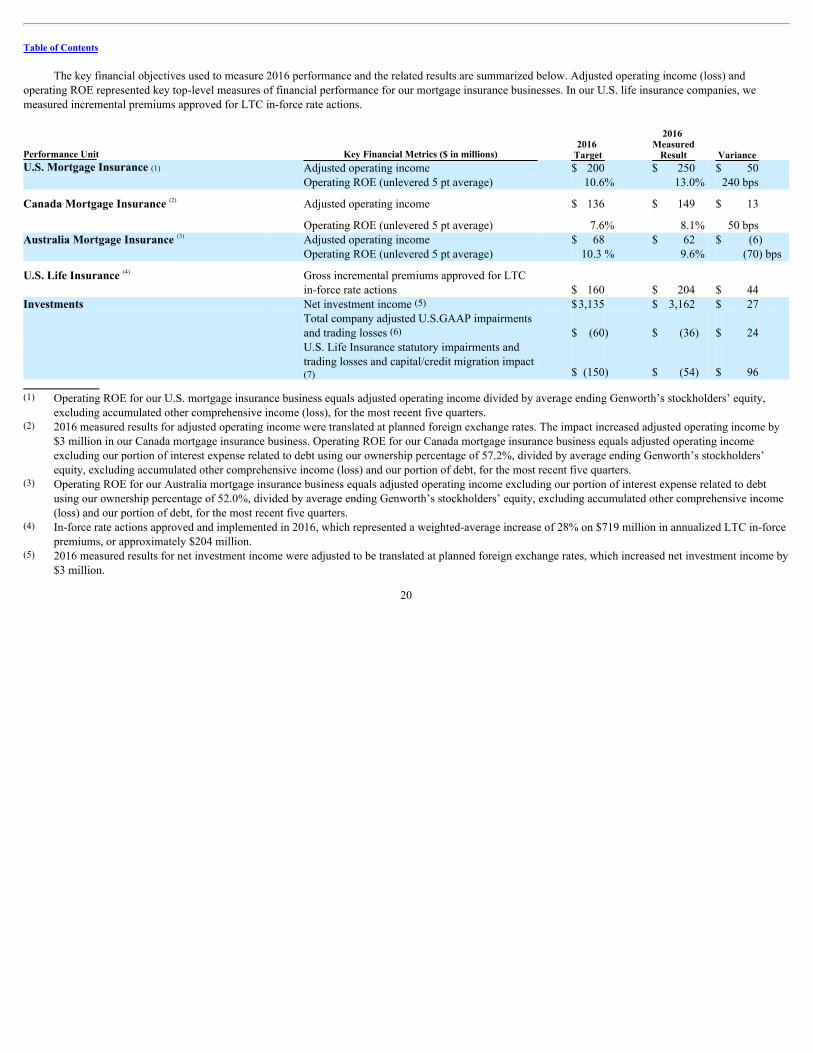
Table of Contents
The key financial objectives used to measure 2016 performance and the related results are summarized below. Adjusted operating income (loss) andoperating ROE represented key top-level measures of financial performance for our mortgage insurance businesses. In our U.S. life insurance companies, wemeasured incremental premiums approved for LTC in-force rate actions.
Performance Unit Key Financial Metrics ($ in millions) 2016
Target
2016 Measured
Result Variance U.S. Mortgage Insurance (1) Adjusted operating income $ 200 $ 250 $ 50
Operating ROE (unlevered 5 pt average) 10.6% 13.0% 240 bps
Canada Mortgage Insurance (2) Adjusted operating income $ 136 $ 149 $ 13
Operating ROE (unlevered 5 pt average) 7.6% 8.1% 50 bps Australia Mortgage Insurance (3) Adjusted operating income $ 68 $ 62 $ (6)
Operating ROE (unlevered 5 pt average) 10.3 % 9.6% (70) bps
U.S. Life Insurance (4)
Gross incremental premiums approved for LTCin-force rate actions $ 160 $ 204 $ 44
Investments Net investment income (5) $3,135 $ 3,162 $ 27
Total company adjusted U.S.GAAP impairmentsand trading losses (6) $ (60) $ (36) $ 24
U.S. Life Insurance statutory impairments andtrading losses and capital/credit migration impact(7) $ (150) $ (54) $ 96
(1) Operating ROE for our U.S. mortgage insurance business equals adjusted operating income divided by average ending Genworth’s stockholders’ equity,
excluding accumulated other comprehensive income (loss), for the most recent five quarters.(2) 2016 measured results for adjusted operating income were translated at planned foreign exchange rates. The impact increased adjusted operating income by
$3 million in our Canada mortgage insurance business. Operating ROE for our Canada mortgage insurance business equals adjusted operating incomeexcluding our portion of interest expense related to debt using our ownership percentage of 57.2%, divided by average ending Genworth’s stockholders’equity, excluding accumulated other comprehensive income (loss) and our portion of debt, for the most recent five quarters.
(3) Operating ROE for our Australia mortgage insurance business equals adjusted operating income excluding our portion of interest expense related to debtusing our ownership percentage of 52.0%, divided by average ending Genworth’s stockholders’ equity, excluding accumulated other comprehensive income(loss) and our portion of debt, for the most recent five quarters.
(4) In-force rate actions approved and implemented in 2016, which represented a weighted-average increase of 28% on $719 million in annualized LTC in-forcepremiums, or approximately $204 million.
(5) 2016 measured results for net investment income were adjusted to be translated at planned foreign exchange rates, which increased net investment income by$3 million.
20

Table of Contents
(6) Total company adjusted U.S. GAAP impairments and trading losses were calculated as follows:
(amounts in millions) Net realized gains (losses) on available-for-sale securities $ 128 Exclude—non-recurring gains from the sale of U.S. Government Treasury Inflation Protected Securities (130)
Total adjusted U.S. GAAP trading losses $ (2) Total impairments (40) Gains on limited partnerships 6
Total company adjusted U.S. GAAP impairments and trading losses $ (36)
(7) Investment impairments and trading losses are calculated in accordance with statutory accounting rules and the capital/credit migration impact representsstatutory risk-based capital impact to U.S. Life Insurance companies from changes in National Association of Insurance Commissioners or “NAIC” rating ofinvested assets shown at a 350% multiple.
For 2016, the company also identified and disclosed certain key strategic priorities designed to have an impact on company financial performance andstockholder value over time. The Compensation Committee took these strategic priorities into account when evaluating the performance of our named executiveofficers and consideration was given for the accomplishments in their areas of responsibility. These key strategic priorities, and related accomplishments in 2016,included: Key Strategic Priority 2016 Key Accomplishments/ResultsMeaningful progress toward separation and isolation of our long-term careinsurance business
• Several transactions filed or executed in 2016 to support unstacking of ourlife and long-term care insurance companies; progress on schedule
• Closed transaction to sell certain blocks of term life insurance, certain ofthe proceeds of which will facilitate unstacking of our life and long-termcare insurance businesses
• Secured bondholder consents in the first quarter of 2016 to facilitate theseparation of our long-term care insurance business from the debtobligations of Genworth Holdings, Inc.
Recapture/Repatriation of all businesses from Bermuda • Completed in October 2016Target $505 million operating expense run-rate for U.S. Life Insurance (1) • $502 million achieved (1) Excludes certain categories of extraordinary expenses, including transaction-related expenses primarily for third party legal and financial services, as well as
fees and expenses associated with litigation.
Actual performance against any particular financial or strategic objective noted above did not result in any pre-determined or formulaic payouts. Instead, theCompensation Committee reviewed overall performance results against the applicable objectives in determining the actual payouts of annual incentives and alsoconsidered the performance of each named executive officer in their respective area of responsibility. A discussion of the relevant metrics and performance as theyrelate to specific annual incentives awarded to each named executive officer follows. Amounts paid for 2016 are reported under the Non-Equity Incentive PlanCompensation—Annual Incentive column of the 2016 Summary Compensation Table.
21

Table of Contents
Mr. McInerney
Mr. McInerney’s annual incentive award for 2016 was above his targeted amount based on several factors, including his significant contributions in supportof the Board’s strategic review process, and in consideration for the above target financial results in the majority of our operating businesses for the year, including:
• above target results for adjusted operating income and operating ROE in our U.S. and Canada mortgage insurance businesses;
• meeting our internal target expense run-rate for our U.S. Life Insurance segment for 2016; and
• above target results for key financial goals listed above for our investments organization.
Additionally, consideration was given for Mr. McInerney’s accomplishments against key strategic and operational objectives set out at the beginning of theyear, including:
• making meaningful progress toward the potential separation and isolation of our long-term care insurance business, as noted above; and
• making meaningful progress toward developing a new long-term care insurance business model and regulatory framework with the NationalAssociation of Insurance Commissioners.
After considering inputs from the Board, the Compensation Committee determined to award Mr. McInerney an annual incentive award of $3,000,000 for2016 performance, or 150% of his targeted amount. This award was based on an assessment of Mr. McInerney’s performance against these pre-establishedfinancial and non-financial objectives, despite slightly below target financial results in our Australia mortgage insurance business.
Ms. Groh
Ms. Groh’s annual incentive award for 2016 primarily reflects her contributions as our CFO to achieving and exceeding the majority of our financial andnon-financial objectives noted above. Other key factors taken into consideration in determining Ms. Groh’s annual incentive award were:
• providing leadership and support for the company’s efforts toward potential separation and isolation of our long-term care insurance business, with theaccomplishments summarized above;
• active leadership and significant contributions to support the Board in its strategic review process; and
• active leadership in managing ratings agency and other key capital markets relationships during the company’s strategic review process.
Based on these factors, the Compensation Committee approved an annual incentive award of $850,000 for Ms. Groh, or approximately 155% of her targetedamount for 2016.
Mr. Schneider
Mr. Schneider’s annual incentive award primarily reflects his role as our COO, in which he is primarily responsible for the financial and operatingperformance of our businesses. Our U.S. mortgage insurance business significantly exceeded its financial goals, and our Canada mortgage insurance and U.S. LifeInsurance businesses also performed above target, while our Australia mortgage insurance business finished slightly below their financial goals for the year. Otherkey factors taken into consideration in determining Mr. Schneider’s annual incentive award were:
• active leadership toward meeting our internal target expense rate for our U.S. Life Insurance segment and headquarters operations for 2016;
22

Table of Contents
• providing leadership and support for the company’s efforts toward potential separation and isolation of our long-term care insurance business, with theaccomplishments summarized above; and
• active leadership and significant contributions to support the Board in its strategic review process.
Based on these factors, the Compensation Committee approved an annual incentive award of $1,500,000 for Mr. Schneider, or approximately 138% of histargeted amount for 2016.
Mr. Bobitz
Mr. Bobitz’s annual incentive award for 2016 primarily reflects his contributions as our General Counsel to make significant progress toward our keystrategic and non-financial objectives noted above. Other key factors taken into consideration in determining Mr. Bobitz’s annual incentive award were:
• active leadership in managing regulatory relationships and coordination with the Board during its strategic review process;
• providing leadership and support for the company’s efforts toward potential separation and isolation of our long-term care insurance business, with theaccomplishments summarized above; and
• management of key litigation matters affecting the company.
Based on these factors, the Compensation Committee approved an annual incentive award of $750,000 for Mr. Bobitz, or approximately 176% of histargeted amount for 2016.
Mr. Sheehan
Mr. Sheehan’s annual incentive award primarily reflects his contributions to our company performance as our CIO. As a member of the corporate leadershipteam, some weight was given to his contributions to the strategic accomplishments noted above. Significant weight was also given to the performance of thecorporate investments organization, including exceeding targeted net investment income as noted above, and other positive results and accomplishments as notedbelow:
• exceeding targeted levels of higher-yielding private asset production, including commercial mortgages, private placements and limited partnerships;
• active leadership in re-negotiating counterparty agreements after company rating downgrades; and
• collaborating with our U.S. Life Insurance segment to meet our internal target expense rate reductions.
Based on these factors, the Compensation Committee approved an annual incentive award of $1,900,000 for Mr. Sheehan, or approximately 181% of histargeted amount, for 2016.
AnnualLong-TermEquityGrants
We believe that the largest component of our annual compensation opportunities for named executive officers should be in the form of longer-termincentives, including annual long-term equity grants. The Compensation Committee determines an approximate compensation value for annual equity grants for theCEO after receiving inputs from the Board and the Compensation Committee’s compensation consultant, and for each other named executive officer based on therecommendations of our CEO. Additional considerations for award values include competitive pay levels, alignment of total pay at risk with the individual’s abilityto impact long-term company performance, the individual’s sustained performance over time, and long-term succession and retention needs.
The CEO prepares a recommendation for the annual long-term equity grant compensation value for each of the executive officers (other than himself), andthe company uses a 20-day historical average closing price on or
23
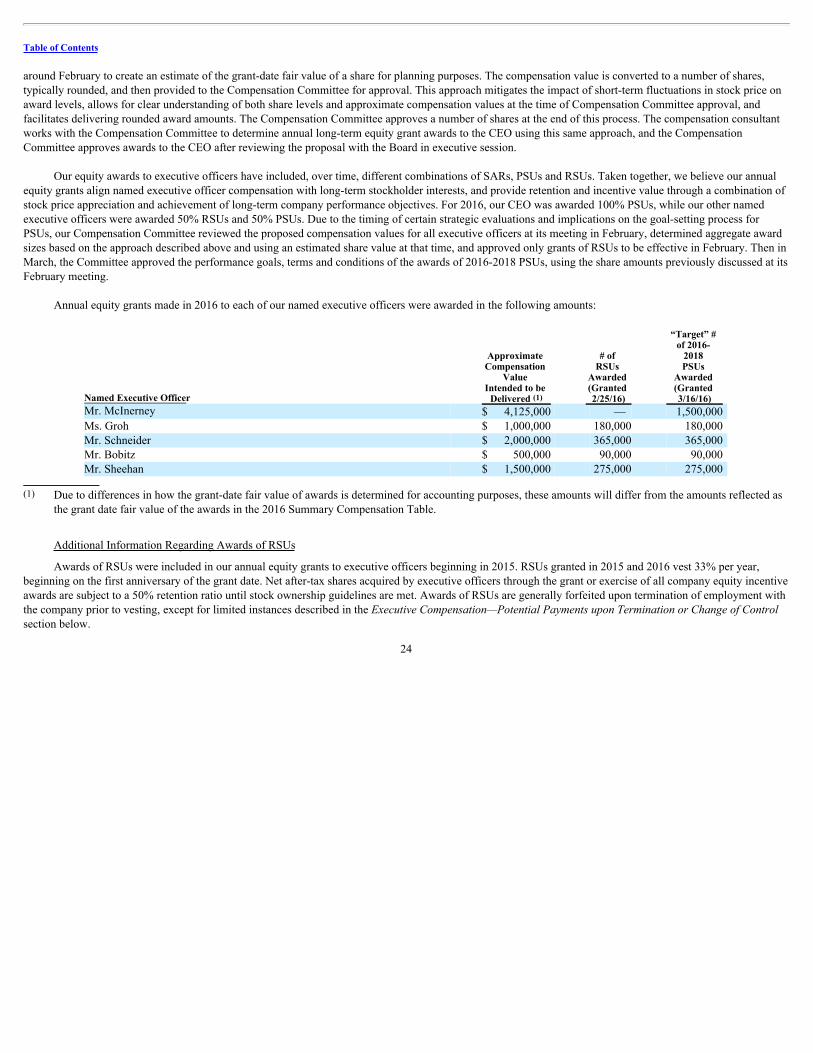
Table of Contents
around February to create an estimate of the grant-date fair value of a share for planning purposes. The compensation value is converted to a number of shares,typically rounded, and then provided to the Compensation Committee for approval. This approach mitigates the impact of short-term fluctuations in stock price onaward levels, allows for clear understanding of both share levels and approximate compensation values at the time of Compensation Committee approval, andfacilitates delivering rounded award amounts. The Compensation Committee approves a number of shares at the end of this process. The compensation consultantworks with the Compensation Committee to determine annual long-term equity grant awards to the CEO using this same approach, and the CompensationCommittee approves awards to the CEO after reviewing the proposal with the Board in executive session.
Our equity awards to executive officers have included, over time, different combinations of SARs, PSUs and RSUs. Taken together, we believe our annualequity grants align named executive officer compensation with long-term stockholder interests, and provide retention and incentive value through a combination ofstock price appreciation and achievement of long-term company performance objectives. For 2016, our CEO was awarded 100% PSUs, while our other namedexecutive officers were awarded 50% RSUs and 50% PSUs. Due to the timing of certain strategic evaluations and implications on the goal-setting process forPSUs, our Compensation Committee reviewed the proposed compensation values for all executive officers at its meeting in February, determined aggregate awardsizes based on the approach described above and using an estimated share value at that time, and approved only grants of RSUs to be effective in February. Then inMarch, the Committee approved the performance goals, terms and conditions of the awards of 2016-2018 PSUs, using the share amounts previously discussed at itsFebruary meeting.
Annual equity grants made in 2016 to each of our named executive officers were awarded in the following amounts:
Named Executive Officer
Approximate Compensation
Value Intended to be
Delivered (1)
# of RSUs
Awarded (Granted 2/25/16)
“Target” # of 2016-
2018 PSUs
Awarded (Granted 3/16/16)
Mr. McInerney $ 4,125,000 — 1,500,000 Ms. Groh $ 1,000,000 180,000 180,000 Mr. Schneider $ 2,000,000 365,000 365,000 Mr. Bobitz $ 500,000 90,000 90,000 Mr. Sheehan $ 1,500,000 275,000 275,000
(1) Due to differences in how the grant-date fair value of awards is determined for accounting purposes, these amounts will differ from the amounts reflected as
the grant date fair value of the awards in the 2016 Summary Compensation Table.
Additional Information Regarding Awards of RSUs
Awards of RSUs were included in our annual equity grants to executive officers beginning in 2015. RSUs granted in 2015 and 2016 vest 33% per year,beginning on the first anniversary of the grant date. Net after-tax shares acquired by executive officers through the grant or exercise of all company equity incentiveawards are subject to a 50% retention ratio until stock ownership guidelines are met. Awards of RSUs are generally forfeited upon termination of employment withthe company prior to vesting, except for limited instances described in the ExecutiveCompensation—PotentialPaymentsuponTerminationorChangeofControlsection below.
24

Table of Contents
Additional Information Regarding 2016-2018 Performance Stock Unit Grants
Our Compensation Committee approved different performance measures for each of our PSU grants over the past three years, after considering withmanagement and its independent compensation consultant at the time of each grant measures that would be meaningful indications of improved company financialperformance, and after considering the strategic business portfolio alternatives that had been under review over the past few years.
Awards of 2016-2018 PSUs are earned over a three-year period and vest according to company performance against two goals measured for our globalmortgage insurance businesses and two goals measured for our U.S. life insurance businesses, as noted in the table below. The target number of PSUs noted aboveis fixed for each participant at the time of grant, and following the performance period any unvested PSUs will be forfeited. The metrics are independentlyweighted (25% each), such that performance at threshold for all performance measures would result in a 50% payout, and performance for all four performancemeasures at maximum would result in a 125% payout. The maximum was set at 125% of the target, versus our typical 200% of target, in an effort to preserve moreshares available for issuance under our 2012 Omnibus Incentive Plan for one additional annual equity grant to our named executive officers. The CompensationCommittee reserves the ability to use negative discretion upon payout of PSUs.
2016-2018 Performance Stock Unit Metrics and Goals
Performance Measure
Weight(% of
Target)
Threshold(50%
Payout)
Target (100% Payout)
Maximum(125% Payout)
2016-2018 Mortgage Insurance Average Annual Adjusted OperatingIncome ($MM) (1) 25% $ 300 $ 410 $ 510
2016-2018 Mortgage Insurance Average Annual Adjusted OperatingROE (unlevered) (2) 25% 6.8% 8.8% 10.6%
2018 U.S. Life Insurance Expense ($MM) (3) 25% $ 460 $ 425 $ 400 2016-2018 Cumulative LTC In-Force Rate Actions ($MM) (4) 25% $ 525 $ 585 $ 645
(1) Sum of U.S., Canada and Australia mortgage insurance businesses’ U.S. GAAP annual income (loss) from continuing operations excluding the after-tax
effects of income attributable to non-controlling interests, net investment gains (losses), goodwill impairments, gains (losses) on the sale of businesses, gains(losses) on the early extinguishment of debt, gains (losses) on insurance block transactions and infrequent or unusual non-operating income. Adjustedoperating income is translated at 0.74 foreign exchange rates for Australia & 0.77 for Canada and based on assumed ownership levels of 52.0% for Australiamortgage insurance business and 57.2% Canada mortgage insurance business.
(2) Annual adjusted operating income excluding our portion of interest expense related to debt using our ownership percentage of 57.2% for Canada and 52.0%for Australia, divided by average ending Genworth Financial, Inc.’s stockholders’ equity for U.S., Canada, and Australia, excluding accumulated othercomprehensive income (loss) and our portion of debt.
(3) Target 2018 expenses are the gross Selling, General and Administrative expenses, including claim administration costs and software amortization, excludingcertain costs for retention, actuarial staff augmentation, and costs or settlements associated with pending litigation. Expenses for an immediate annuitiesproduct offering and costs associated with strategic transactions will also be excluded from this measure.
(4) Gross incremental premium approvals which are considered as premium or reserve releases that are premium equivalent based on the state approvalassumptions utilized in the 2015 Loss Recognition Projections.
25

Table of Contents
Final Determination of 2014-2016 Performance Stock Units
Final performance for our 2014-2016 PSUs was below threshold performance for both company metrics, resulting in cancellation of the award with nopayout in the first quarter of 2017. Company performance was measured relative to threshold, target and maximum goals established for Company Operating ROEand Book Value Per Basic Share (each as defined below), and as measured for the final year of the three-year incentive plan (2016). The target number of PSUswas fixed for each participant at the time of grant, and the metrics were independently weighted (50% each). The performance goals and final results for the 2014-2016 PSUs are noted in the table below:
2014-2016 Performance Stock Unit Metrics and Goals
Metric
Weight(% of
Target)
Threshold(50%
Payout)
Target (100% Payout)
Maximum(200% Payout)
2016 Result
2014-2016 PSU Payout Earned
Company Operating ROE (1) 50% 6.75% 8.0% 9.5% (3.2)% Below ThresholdBook Value Per Basic Share (2) 50% $ 26.50 $ 27.50 $ 28.50 $19.16 Below Threshold (1) Company Operating ROE equals adjusted operating income (loss) for the prior twelve months ended, divided by our average ending stockholders’ equity,
excluding accumulated other comprehensive income (loss) in our average ending stockholders’ equity, for the most recent five quarters ending December 31,2016.
(2) Book Value Per Basic Share equals equity excluding accumulated other comprehensive income (loss) and noncontrolling interests, divided by Genworth’scommon shares outstanding at the end of the period.
Additional Information Regarding 2015-2017 Performance Stock Units
Our 2015-2017 PSUs vest according to company performance relative to achievement of threshold, target and maximum goals established for the ratio of ourstock price to our book value (the Book Value Multiple), each at the end of the three-year performance period. The Book Value Multiple goals for the 2015-2017PSUs emphasize our objective of re-building long-term stockholder value, while maintaining flexibility for strategic business portfolio alternatives. The targetnumber of PSUs is fixed for each participant at the time of grant, and following the performance period any unvested PSUs will be forfeited. Performance belowthe threshold goal established will result in no payouts, and each participant could earn up to 200% of his or her target amount for performance that meets orexceeds the maximum goals established. The Compensation Committee reserves the ability to use negative discretion upon payout of PSUs.
Performance relative to the 2015-2017 PSUs will be significantly influenced by our stock price at the end of the performance period as the stock price is thenumerator in the Book Value Multiple calculation. Although it is difficult to accurately predict performance under this award at this point, based on our BookValue Per Basic Share as of December 31, 2016, we can estimate the stock price needed to achieve threshold, target and maximum performance levels relative tothe goals established for these awards. Based on our 2016 year-end Book Value Per Basic Share of $19.16, and our December 31, 2016 closing stock price of$3.81, the Book Value Multiple is trending significantly below threshold levels of performance.
2015-2017 Performance Stock Unit Metrics and Goals
Metric Weight
(% of Target) Threshold
(50% Payout) Target
(100% Payout) Maximum
(200% Payout) Book Value Multiple (1) 100% 0.50 0.65 0.80
(1) The average daily closing price of Genworth’s common stock for the period beginning one business day following Genworth’s third quarter of 2017
earnings announcement through and including five business days following Genworth’s fourth quarter of 2017 earnings announcement, divided by the two-point average of the company’s Book Value Per Basic Share as of the close of the third quarter of 2017 and close
26

Table of Contents
of the fourth quarter of 2017. Book Value Per Basic Share equals Genworth’s stockholders’ equity, excluding accumulated other comprehensive income(loss), divided by Genworth’s common shares outstanding at the end of the period.
Additional Information Regarding Prior Awards of SARs
Awards of SARs were included in our annual equity grants prior to 2016. SARs granted in February 2014 vest 25% per year, while SARs granted in 2015vest 33% per year, each beginning on the first anniversary of the grant date. Beginning with our 2011 annual equity grant, all grants of SARs have been in the formof Capped SARs, which include a limit on the maximum value per share upon exercise, in order to reduce accounting expense through a reduced grant date fairvalue. The Capped SAR awards made in 2011 through 2015 have a maximum share value of $75.00, which allows us to realize significant expense savings withoutmaterially diminishing the incentive and reward for long-term stock price appreciation.
Awards of SARs are generally forfeited upon termination of employment with the company prior to vesting, except for limited instances described in theExecutiveCompensation—PotentialPaymentsuponTerminationorChangeofControlsection below. Net after-tax shares acquired by executive officers throughthe grant or exercise of all company equity incentive awards are subject to a 50% retention ratio until stock ownership guidelines are met. Additionally, sharesacquired through the exercise of stock options (if outstanding from prior grant practices) or SARs are further subject to the company’s nine-month net hold policy(see the OtherKeyCompensationandGovernancePolicies—ExecutiveOfficerStockOwnershipGuidelines,RetentionRatioandNetHoldPolicysection below).
Our Other Compensation and Benefits Programs
PriorCompensationforMs.Groh
Ms. Groh was appointed Executive Vice President and CFO effective October 15, 2015. At the time of our annual long-term equity grants in the first quarterof 2015, Ms. Groh was not an executive officer of the company. Her 2015 annual long-term equity awards reflected a unique approach we used in 2015 for certainkey non-executive officers that emphasized long-term retention through a combination of RSUs and deferred cash (referred to hereafter as “Cash-In-Lieu OfEquity”). Under this structure, Ms. Groh was awarded $116,500 in Cash-In-Lieu of Equity, which vests 50% each on the first and second anniversaries of the grantdate, and 15,550 RSUs, which vest 50% each on the third and fourth anniversaries of the grant date. Payout of the portion of Ms. Groh’s Cash-In-Lieu of Equityaward that vested in 2016 is reflected in the Bonus column of the 2016 Summary Compensation Table .Awards of RSUs and Cash-In-Lieu of Equity are generallyforfeited upon termination of employment with the company prior to vesting, except for limited instances described in the ExecutiveCompensation—PotentialPaymentsuponTerminationorChangeofControlsection below.
Additionally, prior to her appointment as CFO, Ms. Groh had been awarded two cash-based retention incentive awards of $600,000, the first which becamepayable on September 30, 2016, and is reflected in the Bonus column of the 2016 Summary Compensation Table . The second cash-based retention incentivebecomes payable on May 31, 2017. The retention incentives are payable if Ms. Groh is still employed by the company on such dates, or earlier upon limitedcircumstances, including a termination of employment without cause, termination due to a layoff, termination in connection with the sale of a business unit towhich she is assigned, or death.
RetentionIncentiveAwardsForMessrs.Schneider,SheehanandBobitz
On October 14, 2015, the Compensation Committee approved cash-based retention incentive awards of $2,000,000 to Mr. Schneider and Mr. Sheehan, and acash-based retention incentive award of $425,000 to Mr. Bobitz, each of whom have demonstrated sustained performance and leadership in their critical roles, andwhom were considered by the Compensation Committee as critical to retain through the company’s strategic
27

Table of Contents
review period. The cash-based retention incentives include certain restrictive covenants, including non-solicitation of customers, clients or employees duringemployment and for 12 months following any future separation of service from the company. The incentives for Mr. Schneider and Mr. Sheehan became payable50% on December 31, 2016 (these payments are reflected in the Bonus column of the 2016 Summary Compensation Table), and the remaining 50% is payable onDecember 31, 2017, provided they are still employed by the company on such dates, or earlier under certain limited circumstances, including a termination ofemployment without “cause” or for “good reason” (as such terms are defined in the company’s 2015 Key Employee Severance Plan), death or disability. The cash-based retention incentive for Mr. Bobitz was payable 100% on December 31, 2016, and is reflected in the Bonus column of the 2016 Summary CompensationTable.
Subsequently, on September 15, 2016, the Compensation Committee awarded an additional cash-based retention incentive of $425,000 to Mr. Bobitz, whichwill become payable 100% on June 1, 2018, provided he is still employed by the company (or its successor) on such date, or earlier under certain limitedcircumstances, including a termination of employment without “cause,” death or disability.
SeveranceBenefits—InvoluntaryTerminationwithoutaChangeofControl
The Compensation Committee annually reviews the provisions and participants of executive-level severance benefits in order to monitor competitivenessand appropriate levels of benefits to meet the plan objectives. After such a review, the company adopted the 2015 Key Employee Severance Plan (the “2015Severance Plan”), effective as of January 1, 2015, in order to offer competitive termination benefits, and promote retention of a selected group of key employees,including the company’s named executive officers, and to provide key protections to the company in the form of restrictive covenants. Payments and benefitspayable to the named executive officers under the 2015 Severance Plan are generally similar to or less than payments and benefits payable under a predecessorplan, which expired by its terms on December 31, 2014, primarily due to the designation of certain named executive officers to a lower benefit tier level than underthe prior plan. In addition, restrictive covenant provisions applicable to named executive officers receiving payments under the 2015 Severance Plan have beenstrengthened, including the addition of a 12-month non-compete provision.
The specific terms of the 2015 Severance Plan, and the potential payments and benefits upon a termination of employment without “cause” or by theexecutive for “good reason” for each of our named executive officers are described more fully in the ExecutiveCompensation—PotentialPaymentsuponTerminationorChangeofControlsection below.
SeveranceBenefits—InvoluntaryTerminationFollowingaChangeofControl
We maintain change of control severance benefits for a select group of key executives, including our named executive officers, in the event that theexecutive’s employment is terminated without “cause” or by the executive for “good reason” within two years following a change of control of the company (eacha “Qualified Termination”).
The change of control severance benefits are intended to keep participating key leaders “neutral” to the possibility of corporate transactions in the bestinterests of stockholders by removing the fear of job loss and other distractions that may result from potential, rumored or actual changes of control of thecompany. All benefits under our change of control plan are “double-trigger” benefits, meaning that no compensation will be paid to participants solely upon theoccurrence of a change of control so as to not create an unintended incentive. We believe that this structure is appropriate for employees whose jobs are in factterminated in such a transaction, without providing a windfall to those who continue employment following the transaction.
The Compensation Committee annually reviews the provisions and participants of our change of control plans to monitor competitiveness and appropriatelevels of benefits to meet the plan objectives. The Compensation Committee adopted a new 2014 Change of Control Plan (the “2014 Change of Control Plan”) in
28

Table of Contents
order to replace and consolidate certain predecessor plans. The 2014 Change of Control Plan was adopted by the Compensation Committee on December 17, 2014,and the predecessor plans were cancelled and eliminated at that time. The 2014 Change of Control Plan completely eliminates excise tax gross-up payments for allparticipants, provides for reduced payments and benefits to the named executive officers as compared to those under the predecessor plans, and strengthensrestrictive covenant provisions applicable to any participants receiving payments. If an executive becomes eligible to receive benefits under the 2014 Change ofControl Plan, he or she will not be eligible to receive benefits under the 2015 Severance Plan.
The specific terms of the 2014 Change of Control Plan, and the potential payments and benefits upon a Qualified Termination for each of our namedexecutive officers are described more fully in the ExecutiveCompensation—PotentialPaymentsuponTerminationorChangeofControlsection below.
RetirementBenefits
Retirement benefits also fulfill an important role within our overall executive compensation program because they provide a competitive financial securitycomponent that supports attraction and retention of talent. We maintain the Retirement and Savings Plan, a tax-qualified, defined contribution plan in which ourU.S. employees, including our named executive officers, are eligible to participate. The Retirement and Savings Plan has two features: the “401(k) SavingsFeature,” in which participants can defer savings on a pre-tax basis and receive company matching contributions, subject to certain Internal Revenue Service(“IRS”) limits, and a “Retirement Account Feature,” which includes only company contributions made annually based on a schedule of completed years of serviceand age. In addition, we offered the following non-qualified retirement and deferred compensation plans in 2015 that were available to certain of our namedexecutive officers:
• Genworth Financial, Inc. Supplemental Executive Retirement Plan (the “SERP”), which is a defined benefit plan that was closed to new participantsafter December 31, 2009;
• Genworth Financial, Inc. Retirement and Savings Restoration Plan (the “Restoration Plan”), which is a defined contribution plan; and
• Genworth Financial, Inc. Deferred Compensation Plan (the “Deferred Compensation Plan”), which was closed to new contributions afterDecember 31, 2015.
We continually assess our benefit offerings and seek to align benefit offerings with competitive market levels. It is important to us to keep our benefit designand costs competitive with our peers so that we can continue to attract and retain talent while managing our expenses. In 2015, we approved certain changes to ourretirement benefit plans, including the Retirement and Savings Plan, the SERP, the Restoration Plan and the Deferred Compensation Plan in order to make theplans more closely align with current market practices and reduce our expenses. Each of the above non-qualified retirement plans, including the 2015 amendmentsthereto, is described in more detail in the ExecutiveCompensation—PensionBenefitsand Non-QualifiedDeferredCompensationsections below.
OtherBenefitsandPerquisites
We regularly review the benefits and perquisites provided to our named executive officers to ensure that our programs align with our overall principles ofproviding competitive compensation and benefits that maximize the interests of our stockholders. We provide executive officers with an individually-owneduniversal life insurance policy (the “Leadership Life Program”) available to all of our U.S.-based executives, an enhanced company-owned life insurance program(the “Executive Life Program”) and a limited number of perquisites intended to keep executive officers healthy and focused on company business with minimaldistraction. The perquisites provided to named executive officers are the opportunity to receive financial planning services and annual physical examinations.
29

Table of Contents
We also provide certain benefits in the event of death, total disability or sale of a business unit to a successor employer. Amounts payable to namedexecutive officers in those limited circumstances are described in more detail in the ExecutiveCompensation—PotentialPaymentsuponTerminationorChangeofControlsection below.
Other Key Compensation and Governance Policies
In addition to our compensation programs described above, the company maintains the following policies and practices intended to strengthen the overalllong-term stockholder alignment and governance of our compensation programs.
ExecutiveOfficerStockOwnershipGuidelines,RetentionRatioandNetHoldPolicy
The company maintains stock ownership guidelines for the amount of common stock that must be held by the company’s executive officers. The stockownership guidelines specify the value of company stock, as a multiple of the executive officer’s base salary, which must be held by each executive officer.
Position Multiple CEO 7x Salary CFO, CIO and COO 3x Salary Other Executive Vice Presidents and Senior Vice Presidents 2x Salary
The ownership multiple is used to calculate a target number of shares for each designated executive officer as of January 1 of each year (or, in the case of anewly-designated executive officer, as of the date such executive officer first becomes subject to the ownership guidelines). The target number of shares isindividually determined by multiplying the executive officer’s then-current annual base salary by the applicable multiple, and dividing the result by the averageclosing price of the company’s common stock during the 60 trading days immediately preceding the measurement date.
Compliance with the stock ownership requirements is also measured as of January 1 of each year. In the event that an executive officer has not reached therequired level of stock ownership as of any measurement date, the executive officer will be subject to a 50% retention ratio that requires the executive officer toretain (and not sell or transfer) at least 50% of the after-tax “profit” shares resulting from the grant or exercise of all company equity incentive awards until the nextmeasurement date. Decreases in overall stock price between measurement dates, therefore, will cause an increase in the number of shares that must be held in orderto meet the ownership guideline.
In order to meet this stock ownership requirement, an executive officer may count (i) all shares of common stock owned by the executive officer, includingcommon stock held in the company’s Retirement and Savings Plan, (ii) any outstanding RSUs, but excluding any unvested RSUs that vest based on achievement ofperformance goals (such as PSUs), and (iii) a number of shares representing the aggregate “spread value” of vested and in-the-money stock options and SARs (withsuch number being calculated as of January 1 of each year on a pre-tax basis, based on the 60 trading day average closing price of the company’s common stock onsuch date). Decreases in overall stock price between measurement dates, therefore, reduced the number of shares deemed to be owned relative to the goal and theresulting reduced ownership levels do not necessarily represent a disposition of shares between measurement dates. Furthermore, none of our named executiveofficers sold shares in 2015 or in 2016.
30

Table of Contents
The following table shows the number of shares of common stock considered to be held, and the applicable stock ownership requirements, for each of ournamed executive officers as of January 1, 2017:
Named Executive Officer
Stock Requirement
as of January 1, 2017, based
on $4.37 stock
price average (#)
Number of Shares Deemed
Held as of January 1, 2017,based on $4.37
stock price average (#)
Stock Held as a% of
Guidelines as of January 1,
2017
Subject to 50%Net Share Retention Ratio For
Duration of 2017
Mr. McInerney (1) 1,600,183 164,602 10% Yes Ms. Groh 377,186 233,604 62% Yes Mr. Schneider 497,200 509,790 > 100% No Mr. Bobitz 194,308 141,229 73% Yes Mr. Sheehan 411,476 467,957 > 100% No
(1) Mr. McInerney was deemed to have met 42% of his ownership goal as of January 1, 2015, based on a $10.32 average stock price at that time. As a result of
our measurement approach, the ownership requirements increased significantly for Mr. McInerney from that time until January 1, 2017, due to the decline inour stock price over that same time period. Additionally, the number of shares deemed to be held by Mr. McInerney for his vested SARs, awarded as thelargest component of his initial grant at the time of his hiring, decreased to zero over that same period due to reductions in the “spread value” of that award.Mr. McInerney’s only other outstanding company equity awards are in the form of PSUs, which are not deemed as shares held until after they becomevested. Mr. McInerney has not sold any shares of company stock since joining the company in 2013.
Additionally, in order to minimize any possible appearance of an incentive for executive officers to seek to cause short-term increases in the price ofGenworth shares in order to exercise stock options or SARs and sell the stock for unwarranted personal gains, the Compensation Committee requires executiveofficers to hold for at least nine months the shares of Genworth stock that they receive by exercising stock options or SARs (net of any shares applied for a cashlessexercise or to pay applicable taxes). This requirement applies to all of our named executive officers.
Anti-HedgingandAnti-PledgingPoliciesforDirectorsandExecutiveOfficers
The company maintains an anti-hedging policy, which prohibits executive officers and directors from buying or selling options (puts or calls) on Genworthsecurities on an exchange or in any other organized market, and also prohibits certain forms of hedging or monetization transactions with respect to Genworthsecurities, such as prepaid variable forward contracts, equity swaps, collars, forward sale contracts and exchange funds. The company maintains this policy becausehedging transactions, which might be considered short-term bets on the movement of the company’s securities, could create the appearance that the person istrading based on inside information. In addition, transactions in options may also focus the person’s attention on short-term performance at the expense of our long-term objectives.
The company also maintains an anti-pledging policy, which prohibits its executive officers and directors from holding Genworth securities in a marginaccount or otherwise pledging Genworth securities as collateral for a loan. Securities held in a margin account as collateral for a margin loan may be sold by thebroker without the customer’s consent if the customer fails to meet a margin call. Similarly, securities pledged as collateral for a loan may be sold in foreclosure ifthe borrower defaults on the loan. The company maintains this policy because a margin sale or foreclosure sale may occur at a time when the pledger is aware ofmaterial nonpublic information or otherwise is not permitted to trade in Genworth securities and the margin sale or foreclosure sale of Genworth securities duringsuch time could also create the appearance that the person is trading based on inside information.
31

Table of Contents
ClawbackPolicy
The company maintains a clawback policy under which the company will seek to recover, at the discretion and direction of the Compensation Committee,and after it has considered the costs and benefits of doing so, incentive compensation earned by, awarded or paid to a covered officer for performance periodsbeginning after January 1, 2011, if the result of a performance measure upon which the award was based or paid is subsequently restated or otherwise adjusted in amanner that would reduce the size of the award or payment (other than a restatement or adjustment due to a change in applicable accounting principles, rules orinterpretations). In addition, if a covered officer engaged in fraud or intentional misconduct that contributed to an award or payment of incentive compensation tohim or her that is greater than would have been paid or awarded in the absence of the misconduct, the company may take other remedial and recovery actions, asdetermined by the Compensation Committee.
TaxandAccountingConsiderations
We consider accounting and tax implications when designing our executive compensation and incentive programs. For example, it is our intent to maximizethe deductibility of executive compensation while retaining flexibility to compensate executive officers in a manner commensurate with performance and thecompetitive landscape for executive talent. In particular, 2016 annual cash incentives for our named executive officers and awards of RSUs and PSUs were grantedpursuant to the 2012 Genworth Financial, Inc. Omnibus Incentive Plan. Using an “umbrella approach,” we annually establish objective performance goals for thepurpose of ensuring that such awards qualify as performance-based compensation under Section 162(m) of the Internal Revenue Code (the “Code”), and thereforewill be fully deductible by the company. These performance goals are used to establish maximum possible annual incentives payable to each of the namedexecutive officers, and maximum possible awards of performance-based RSUs and PSUs for each of the named executive officers, each of which we refer to as the“Section 162(m) maximum awards.” Separately, the Compensation Committee employs negative discretion to reduce the Section 162(m) maximum awards, as itdeems appropriate, based on the Compensation Committee’s evaluation of corporate, operational and individual performance. Other than base salaries, we havestructured the main elements of our 2016 regular annual compensation programs for named executive officers, including annual incentives and annual long-termequity grants, to each qualify as performance-based compensation that is fully deductible by the company.
As an example of our consideration of accounting impact, we noted that the Black-Scholes expense for stock options and SARs for the company has beensignificantly impacted by the company’s historical stock price volatility, resulting in significantly higher than normal expenses for such awards. This led us to makegrants of Capped SARs from 2011 through 2015, in lieu of traditional non-qualified stock options or SARs, in order to achieve reduced compensation expense.
EvaluationofCompensationProgramRisks
The Compensation Committee annually reviews a report prepared by management regarding the design and operation of our compensation arrangements foremployees, including executive officers, for the purpose of determining whether such programs might encourage inappropriate risk-taking that could have amaterial adverse effect on the company. Following that review for 2016 compensation, the Compensation Committee agreed with management’s conclusion thatthe company’s compensation plans, programs and policies do not encourage employees to take risks that are reasonably likely to have a material adverse effect onthe company.
32

Table of Contents
EXECUTIVE COMPENSATION
The following table provides information relating to compensation earned by or paid to our named executive officers in all capacities:
2016 Summary Compensation Table
Name and Principal Position Year
Salary ($)
Bonus ($)
Stock Awards
($) (5)
Option Awards
($) (6)
Non-equity Incentive PlanCompensation
($) (7)
Change in Pension Value
and Nonqualified
Deferred Compensation
Earnings ($) (8)
All Other Compensation
($) (9) Total
($) Thomas J. McInerney President and Chief Executive Officer
201620152014
996,804 1,035,141996,803
— — —
4,215,000775,000
1,142,250
— — —
3,000,000 1,200,000
—
— — —
328,453 175,372557,312
8,540,2573,185,5132,696,365
Kelly L. Groh Executive Vice President and Chief Financial Officer
20162015
538,657 435,909
658,250 —
(1)
860,400 114,759
— —
850,000 425,000
75,376 133,837
129,750 89,946
3,112,4331,199,451
Kevin D. Schneider Executive Vice President and Chief Operating Officer
201620152014
722,683 672,842636,520
1,000,000—
1,000,000
(2) (3)
1,744,7001,452,950593,970
— 922,200459,000
1,500,000 1,200,0001,150,000
692,720 497,969747,176
167,627 159,292153,202
5,827,7304,905,2534,739,868
Ward E. Bobitz Executive Vice President and General Counsel
2016
423,642
425,000(4)
430,200
—
750,000
422,665
84,603
2,536,110
Daniel J. Sheehan IV Executive Vice President—Chief Investment Officer
201620152014
598,083 621,085582,746
1,000,000—
600,000
(2) (3)
1,314,5001,780,950395,980
— 957,000306,000
1,900,000 1,300,000950,000
801,545 476,280587,647
136,884 116,711116,005
5,751,0125,252,0263,538,378
(1) Reflects the first of two equal installments in the amount of $600,000 of a cash retention incentive originally awarded to Ms. Groh in 2015. Also includes the
first of two equal installments in the amount of $58,250 of Ms. Groh’s cash long-term incentive originally awarded in 2015.(2) Reflects the first of two equal installments of a cash retention incentive originally awarded in 2015.(3) Reflects payment of a cash retention incentive originally awarded in 2012.(4) Reflects the payment of a cash retention incentive originally awarded in 2015.(5) Reflects the aggregate grant date fair value of RSUs and PSUs awarded during the period, determined in accordance with FASB ASC Topic 718. Grant date
fair value for the RSUs is based on the grant date fair value of the underlying shares. Grant date fair value for the PSUs is based on the grant date fair valueof the underlying shares at target performance and the probable outcome of performance-based conditions at the time of grant, excluding the effect ofestimated forfeitures. The 2016 value for each named executive officer includes the grant date fair value of PSUs granted, and for all named executiveofficers, with the exception of Mr. McInerney, also includes the grant date fair value of RSUs awarded. Assuming achievement of the PSU performanceconditions at the highest level (rather than at target level), the aggregate grant date fair value of awards reflected in this column would be higher by thefollowing amounts: Mr. McInerney, $1,053,750; Ms. Groh, $126,450; Mr. Schneider, $256,412; Mr. Bobitz, $63,225; and Mr. Sheehan, $193,188.
(6) Reflects the aggregate grant date fair value of SARs, determined in accordance with FASB ASC Topic 718, using the Black-Scholes option pricing model.The assumptions used in determining the grant date fair values of the SARs are set forth in the notes to our consolidated financial statements, which areincluded in our 2016 Annual Report on Form 10-K filed with the SEC on February 27, 2017. The actual value, if any, that a named executive officer mayrealize upon the exercise of SARs will depend on the excess of the stock price over the base price on the date of exercise (with the excess capped at amaximum stock price of $75.00), so there is no assurance that the value realized by a named executive officer will be at or near the value reflected in thistable.
33

Table of Contents
(7) Reflects the value of cash incentives paid pursuant to our annual incentive program as described in the CompensationDiscussionandAnalysissection above.(8) Reflects the annual change in actuarial present values of the eligible named executive officer’s accumulated benefits under the SERP. The SERP was closed
to new participants effective January 1, 2010. A description of the SERP precedes the 2016 Pension Benefits Table below.(9) See the 2016 All Other Compensation—Details table below:
2016 All Other Compensation—Details
Name
Company Contributions
to the Retirement Plans ($) (a)
Life InsurancePremiums
($) (b) Executive
Physical ($) Financial
Counseling ($) Total ($) Mr. McInerney 285,585 22,884 — 19,985 328,453 Ms. Groh 106,002 7,648 3,000 13,100 129,750 Mr. Schneider 128,611 16,032 3,000 19,985 167,627 Mr. Bobitz 59,669 11,834 — 13,100 84,603 Mr. Sheehan 127,135 9,749 — — 136,884 (a) Reflects contributions made on behalf of the named executive officers for each of the following programs: (i) company matching contributions made in 2016
to the 401(k) Savings Feature of the Retirement and Savings Plan; (ii) company contributions made in 2017 to the Retirement Account Feature of theRetirement and Savings Plan, which are based on 2016 earnings; and (iii) company contributions made in 2017 to the Restoration Plan, which are based on2016 earnings.
(b) Represents premium payments made in 2016 for the following programs: (i) Leadership Life Program, an individually owned universal life insurance policyprovided to all of our executives; and (ii) Executive Life Program, a $1 million company-owned life insurance policy for which the participating namedexecutive officers may identify a beneficiary for payment by us in the event of his or her death. Premiums for the Leadership Life Program are gradedthrough age 59, with escalation in particular between age 50 and 59, and level thereafter.
Grants of Plan-Based Awards
The table below provides information on the following plan-based awards that were made in 2016:
• AnnualIncentive.Annual incentive opportunities awarded to our named executive officers are earned based on company performance measuredagainst one-year financial and operating objectives, together with a qualitative assessment of performance, including individual performanceobjectives. Additional information regarding the design of the annual incentive program and 2016 awards are included in the CompensationDiscussionandAnalysissection above. Annual incentives are identified as “AI” in the Award Type column of the following table.
• RestrictedStockUnits. Each RSU represents a contingent right to receive one share of our common stock in the future. If the company pays dividends
on its common stock, dividend equivalents accrue with respect to the RSUs and are paid in cash at the time that the corresponding RSUs vest.Additional information regarding RSUs is included in the CompensationDiscussionandAnalysissection above.
• PerformanceStockUnits.PSUs consist of performance-vesting stock units that may convert to shares following the end of the performance periodbased on achievement of certain pre-established performance goals. PSUs are granted with respect to a target number of shares, will be forfeited ifperformance falls below a designated threshold level of performance, and may be earned up to 125% of the target number of shares for exceeding adesignated maximum level of performance. Additional information regarding PSUs is included in the CompensationDiscussionandAnalysissectionabove.
34

Table of Contents
2016 Grants of Plan-Based Awards Table
Name
AwardType
Grant Date
Estimated Future Payouts Under
Non-Equity Incentive Plan Awards ($)
Estimated Future Payouts Under Equity Incentive
Plan Awards (#) (1)
All Other Stock
Awards: Number of
Shares of Stock
or Units (#) (2)
All Other Option
Awards: Number of Securities Underlying
Options (#)
Exercise or
Base Price
of Option Awards
($/Sh)
Grant DateFair Value
of Stock and Option
Awards ($) (3) Threshold Target Max Threshold Target Max
Mr. McInerney AI — 2,000,000 4,000,000 PSU 3/16/2016 750,000 1,500,000 1,875,000 4,215,000
Ms. Groh AI — 550,000 1,100,000 RSU 2/25/2016 180,000 354,600 PSU 3/16/2016 90,000 180,000 225,000 505,800
Mr. Schneider AI — 1,087,500 2,175,000 RSU 2/25/2016 365,000 719,050 PSU 3/16/2016 182,500 365,000 456,250 1,025,650
Mr. Bobitz AI — 425,000 850,000 RSU 2/25/2016 90,000 177,300 PSU 3/16/2016 45,000 90,000 112,500 252,900
Mr. Sheehan AI — 1,050,000 2,100,000 RSU 2/25/2016 275,000 541,750 PSU 3/16/2016 137,500 275,000 343,750 772,750
(1) The 2016-2018 PSUs may be earned and become vested based on our level of achievement of certain pre-established performance goals over the
performance period ending on December 31, 2018.(2) The RSUs granted are scheduled to vest one-third per year beginning on the first anniversary of the grant date.(3) Reflects the aggregate grant date fair value of the award determined in accordance with FASB ASC Topic 718. Grant date fair value for the RSUs is based
on the grant date fair value of the underlying shares. Grant date fair value for the PSUs is based on the grant date fair value of the underlying shares at targetperformance and the probable outcome of performance-based conditions at the time of grant, excluding the effect of estimated forfeitures.
35

Table of Contents
Outstanding Equity Awards at 2016 Fiscal Year-End Table
The table below provides information with respect to stock options, SARs, RSUs and PSUs outstanding on December 31, 2016: Option Awards Stock Awards
Name
Number of Securities
Underlying UnexercisedOptions (#) Exercisable
Number of Securities
Underlying Unexercised Options (#)
Unexercisable
Option Exercise
Price ($)
Option Expiration
Date
Number ofShares or Units of Stock
That HaveNot
Vested (#)
Market Valueof Shares or
Units of StockThat Have Not Vested
($) (8)
Equity Incentive Plan Awards:
Number of Unearned Shares,
Units or Other Rights That HaveNot Vested (#) (9)
Equity Incentive Plan Awards: Market or
Payout Value of Unearned Shares, Unitsor Other Rights That Have Not Vested ($) (8)
Mr. McInerney 1,200,000 — 7.90 01/02/2023 — — 50,000(10) 190,500 1,875,000 (11) 7,143,750
Ms. Groh 2,150 — 7.80 07/31/2017 2,887(3) 10,999 225,000 (11) 857,250 4,500 — 7.80 02/13/2018 2,124(4) 8,092 39,000 — 14.18 02/10/2020 5,000(5) 19,050 24,000 — 12.75 02/09/2021 15,550 (6) 59,246 30,000 — 8.88 02/14/2022 180,000 (7) 685,800 19,500 6,500(1) 9.06 02/15/2023 7,326 7,324(2) 15.23 02/20/2024
Mr. Schneider 6,300 — 7.80 07/31/2017 53,333 (4) 203,199 52,500 (10) 200,025 8,400 — 7.80 02/13/2018 365,000 (7) 1,390,650 456,250 (11) 1,738,313 45,000 — 16.31 08/01/2018 100,000 — 7.80 08/19/2019 85,000 — 14.18 02/10/2020 85,000 — 12.75 02/09/2021 152,000 — 8.88 02/14/2022 100,000 — 5.13 06/01/2022 200,000 — 5.96 10/31/2022 161,250 53,750 (1) 9.06 02/15/2023 75,000 75,000 (2) 15.23 02/20/2024 88,334 176,666 (2) 7.99 02/20/2025
Mr. Bobitz 3,200 — 7.80 07/31/2017 1,887(3) 7,189 17,500 (10) 66,675 4,200 — 7.80 02/13/2018 2,700(4) 10,287 112,500 (11) 428,625 23,500 — 2.46 02/12/2019 16,666 (4) 63,497 22,000 — 14.18 02/10/2020 90,000 (7) 342,900 13,200 — 12.75 02/09/2021 15,300 — 8.88 02/14/2022 12,750 4,250(1) 9.06 02/15/2023 10,500 10,500 (2) 15.23 02/20/2024 30,000 60,000 (2) 7.99 02/20/2025
Mr. Sheehan 3,700 — 7.80 07/31/2017 103,333 (4) 393,699 35,000 (10) 133,350 7,400 — 7.80 02/13/2018 275,000 (7) 1,047,750 343,750 (11) 1,309,688 18,000 — 7.80 08/19/2019 40,000 — 14.18 02/10/2020 24,000 — 12.75 02/09/2021 32,400 — 8.88 02/14/2022 120,000 — 5.96 10/31/2022 101,250 33,750 (1) 9.06 02/15/2023 50,000 50,000 (2) 15.23 02/20/2024 91,667 183,333 (2) 7.99 02/20/2025
(1) Remaining SARs vested 100% on 2/15/2017.(2) Remaining SARs vest 50% on 2/20/2017 and 2/20/2018.(3) Remaining RSUs vested 100% on 2/15/2017.(4) Remaining RSUs vest 50% on 2/20/2017 and 2/20/2018.(5) Remaining RSUs vest 50% on 11/3/2017 and 11/3/2018.(6) RSUs vest 50% on 3/20/2018 and 3/20/2019.(7) RSUs vest one-third on 2/25/2017, 2/25/2018 and 2/25/2019.(8) Market value is calculated based on the closing price of our common stock on December 31, 2016 of $3.81 per share.(9) 2014-2016 PSUs are not reflected as performance criteria was not met as of the end of the performance period, December 31, 2016.
36
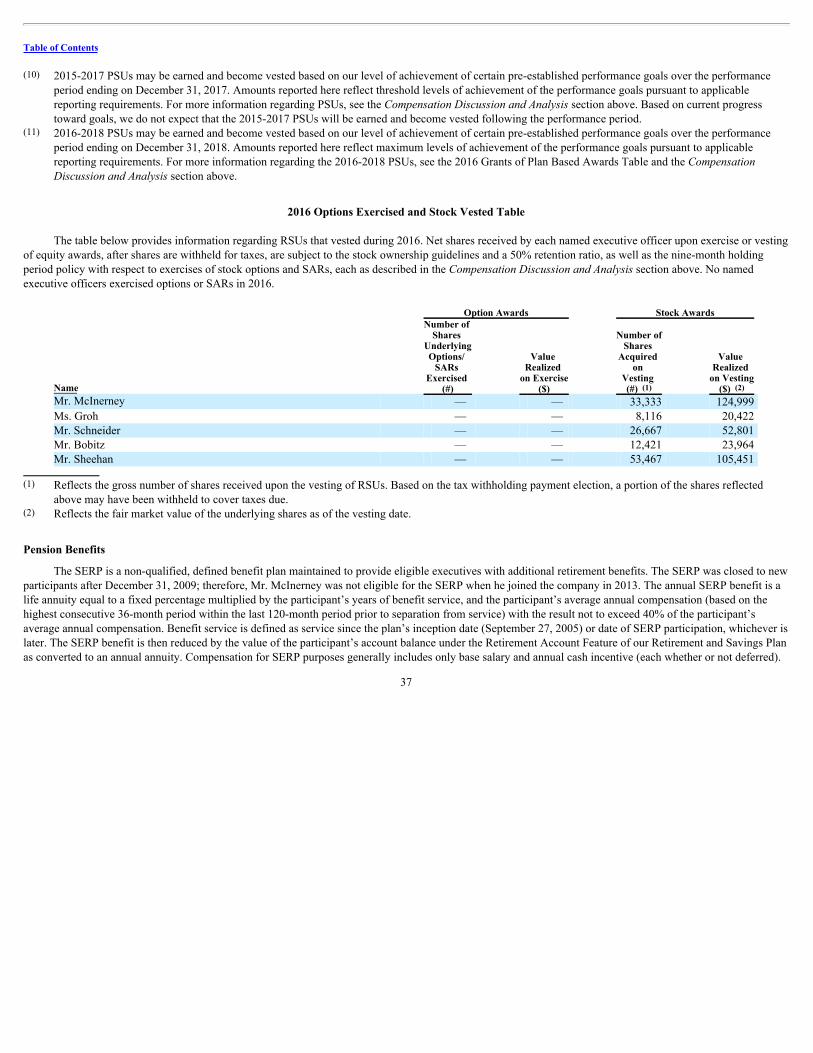
Table of Contents
(10) 2015-2017 PSUs may be earned and become vested based on our level of achievement of certain pre-established performance goals over the performanceperiod ending on December 31, 2017. Amounts reported here reflect threshold levels of achievement of the performance goals pursuant to applicablereporting requirements. For more information regarding PSUs, see the CompensationDiscussionandAnalysissection above. Based on current progresstoward goals, we do not expect that the 2015-2017 PSUs will be earned and become vested following the performance period.
(11) 2016-2018 PSUs may be earned and become vested based on our level of achievement of certain pre-established performance goals over the performanceperiod ending on December 31, 2018. Amounts reported here reflect maximum levels of achievement of the performance goals pursuant to applicablereporting requirements. For more information regarding the 2016-2018 PSUs, see the 2016 Grants of Plan Based Awards Table and the CompensationDiscussionandAnalysissection above.
2016 Options Exercised and Stock Vested Table
The table below provides information regarding RSUs that vested during 2016. Net shares received by each named executive officer upon exercise or vestingof equity awards, after shares are withheld for taxes, are subject to the stock ownership guidelines and a 50% retention ratio, as well as the nine-month holdingperiod policy with respect to exercises of stock options and SARs, each as described in the CompensationDiscussionandAnalysissection above. No namedexecutive officers exercised options or SARs in 2016.
Option Awards Stock Awards
Name
Number of Shares
UnderlyingOptions/
SARs Exercised
(#)
Value Realized
on Exercise($)
Number ofShares
Acquired on
Vesting (#) (1)
Value Realized
on Vesting($) (2)
Mr. McInerney — — 33,333 124,999 Ms. Groh — — 8,116 20,422 Mr. Schneider — — 26,667 52,801 Mr. Bobitz — — 12,421 23,964 Mr. Sheehan — — 53,467 105,451
(1) Reflects the gross number of shares received upon the vesting of RSUs. Based on the tax withholding payment election, a portion of the shares reflected
above may have been withheld to cover taxes due.(2) Reflects the fair market value of the underlying shares as of the vesting date.
Pension Benefits
The SERP is a non-qualified, defined benefit plan maintained to provide eligible executives with additional retirement benefits. The SERP was closed to newparticipants after December 31, 2009; therefore, Mr. McInerney was not eligible for the SERP when he joined the company in 2013. The annual SERP benefit is alife annuity equal to a fixed percentage multiplied by the participant’s years of benefit service, and the participant’s average annual compensation (based on thehighest consecutive 36-month period within the last 120-month period prior to separation from service) with the result not to exceed 40% of the participant’saverage annual compensation. Benefit service is defined as service since the plan’s inception date (September 27, 2005) or date of SERP participation, whichever islater. The SERP benefit is then reduced by the value of the participant’s account balance under the Retirement Account Feature of our Retirement and Savings Planas converted to an annual annuity. Compensation for SERP purposes generally includes only base salary and annual cash incentive (each whether or not deferred).
37

Table of Contents
The annual SERP benefit is calculated as described below:
SERPBenefit
=
(
1.45% x Average Annual
CompensationX
Service as Eligible Participant (through
12/31/2010)
)
+
(
1.1% x Average Annual
CompensationX
Service as EligibleParticipant (after
1/1/2011)
)
–
Annuitized value of thecompany’s qualified
plan: Retirement Account Feature
Each participant in the SERP will partially vest with regard to their benefit when they reach age 55 and have earned five years of “future service” (i.e. serviceoccurring after December 31, 2015). Once a SERP participant has earned five years of “future service” and has reached at least age 55, the participant will becomepartially vested based on a scale ranging from 50% at age 55 and increasing by 10% each year until the participant reaches full vesting at age 60. This change couldresult in the potential for earlier partial vesting for participants if they complete the required years of “future service.” If a participant resigns before vesting, thenhis or her SERP benefit will be forfeited. Only in certain circumstances will the SERP become fully vested upon termination prior to age 60, as described in thePotentialPaymentsuponTerminationorChangeofControlsection below. Benefit payments under the SERP will begin following a participant’s qualifyingseparation from service, but not earlier than age 60. The SERP has no provisions for acceleration of payout before age 60. There are also no provisions for thegranting of extra years of service.
Material assumptions used to calculate the present value of the accumulated benefit are as follows:
• The accumulated benefit represents the current accrued benefit first available at age 60 utilizing actual service and compensation as of December 31,2016;
• Interest rate of 4.21%;
• Mortality prescribed in Section 417(e) of the Code for lump sum payments from qualified plans;
• Form of payment actuarially equivalent to a five-year certain and life benefit; and
• Payments are guaranteed for the life of the participant.
All SERP benefit accruals will freeze as of December 31, 2020. In addition, existing SERP participants were offered an opportunity to make an irrevocable,one-time election before the end of 2015 to freeze their SERP benefit accruals early, effective December 31, 2015, and begin receiving restoration benefits underthe Restoration Plan as of January 1, 2016 (Ms. Groh made this election; Messrs. Schneider, Bobitz and Sheehan did not).
The table below reflects the present value of the accrued benefit as of December 31, 2016.
2016 Pension Benefits Table
Name Plan Name
Number of YearsCreditedService
(#)
Present Value of
AccumulatedBenefit
($)
Payments During LastFiscal Year
($) Mr. McInerney (1) * — — — Ms. Groh (2) SERP 10.33 659,201 — Mr. Schneider SERP 11.33 2,988,165 — Mr. Bobitz SERP 11.33 988,168 — Mr. Sheehan SERP 11.33 2,557,025 — (1) The SERP was closed to new participants after December 31, 2009; therefore, Mr. McInerney was not eligible for the SERP when he joined the company in
2013.(2) Ms. Groh elected to freeze her SERP benefit as of December 31, 2015 in order to begin receiving restoration benefits under our Restoration Plan as described
in the Pension Benefits section above.
38

Table of Contents
Non-Qualified Deferred Compensation
The company maintains the Restoration Plan, a non-qualified defined contribution plan, which provides eligible executives, including our named executiveofficers, with benefits generally equal to any matching contributions that they are precluded from receiving under the 401(k) Savings Feature of our Retirement andSavings Plan as a result of restrictions under the Code (the “Restoration 401(k) Savings Feature”). For 2016, we provided a contribution credit equal to 6% of theparticipant’s eligible pay (base salary and annual cash incentive paid) in excess of the annual compensation limit in Section 401(a)(17) of the Code ($265,000 in2016). Effective January 1, 2017, Restoration 401(k) Savings feature contributions changed from 6% to 5% which is consistent with plan changes to the company’smatching contributions under the qualified Retirement and Savings Plan which were implemented at the same time.
Since January 1, 2010, newly hired or promoted executive officers who were not already participants in the SERP have been eligible for up to two additionaltypes of contributions within the Restoration Plan. For those eligible executive officers, the Restoration Plan provides supplemental benefits equal to the amount ofcontributions that executives are precluded from receiving under the Retirement Account Feature of our qualified Retirement and Savings Plan (the “RestorationRetirement Account Feature”). Current participants in the SERP will become eligible to receive Restoration Retirement Account Feature contributions effective asof the day their respective benefit accruals under the SERP become frozen, which was either on January 1, 2016, if they elected to freeze benefit accruals early (asMs. Groh did), or on January 1, 2021 (applicable to Messrs. Schneider, Bobitz and Sheehan).
Participants become vested with respect to the Restoration 401(k) Savings Feature and Restoration Retirement Account Feature account balances as of theearlier of reaching age 60 or attaining three years of “future service” (i.e., service occurring after December 31, 2015).
In addition, such executive officers are eligible for an additional 3% contribution credit on all eligible pay (the “Supplemental Contribution”). TheSupplemental Contribution was closed to new participants after December 31, 2015, and is being eliminated entirely effective December 31, 2020. In 2016,Mr. McInerney was the only named executive officer eligible for this Supplemental Contribution provided under the Restoration Plan. The portion of theRestoration Plan balance attributable to the Supplemental Contribution will not vest until attainment of age 60 with at least five years of service.
Eligible executives, including our named executive officers, have had the opportunity to request that their Restoration Plan contribution credits (balances) beinvested in or track a diverse array of generally available mutual fund investment options.
The company previously offered a voluntary Deferred Compensation Plan that provided participants with the ability to annually defer receipt of a portion oftheir base salary and/or annual incentive award in order to save and accumulate additional retirement funds on a before-tax basis. Earnings (and losses) werecredited to executive accounts based on participant choices between 10 generally available mutual fund investment options. A participant could defer between 10%and 75% of his or her salary and between 25% and 85% of his or her annual incentive award and could elect to have such deferred amount, plus any earnings (orlosses) thereon, paid upon the participant’s termination of employment (in a lump sum or over up to 10 annual installments), or elect to receive an in-service lumpsum payment upon a specific date. Participants were always 100% vested in their Deferred Compensation Plan accounts. As of December 31, 2016, Ms. Groh andMr. Bobitz were the only named executive officers who had a balance in the Deferred Compensation Plan. Effective for plan years beginning January 1, 2016, thecompany suspended future contributions to the plan.
39
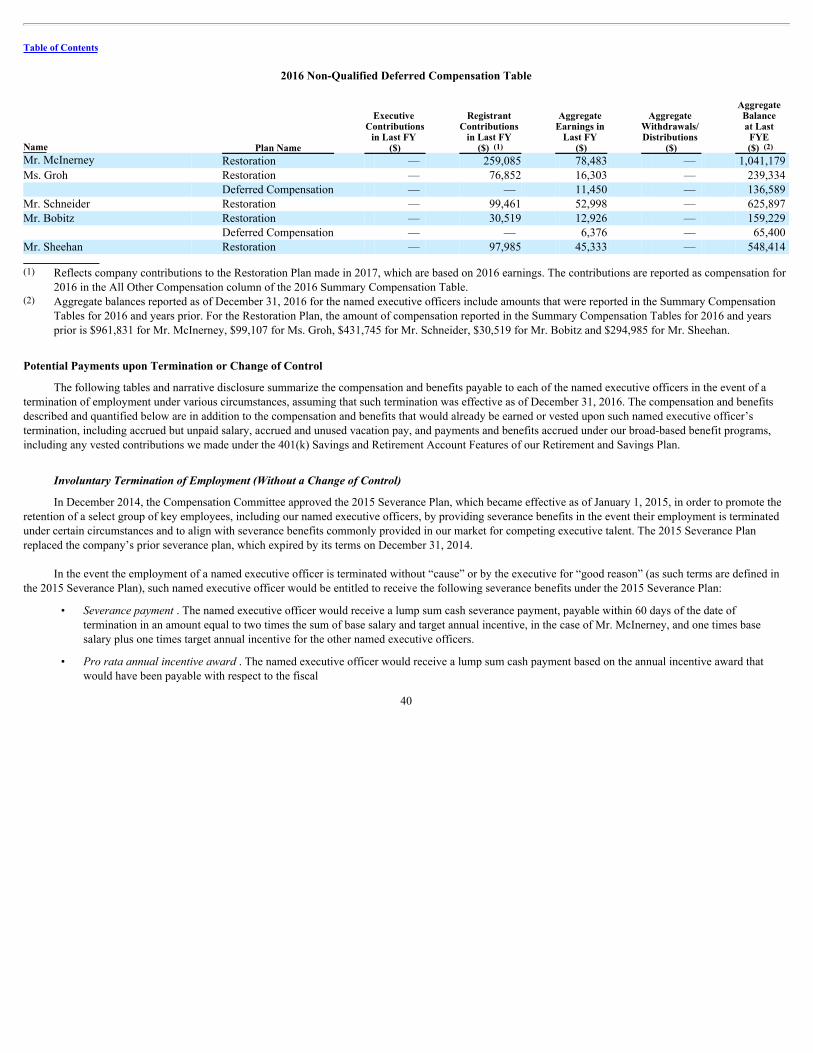
Table of Contents
2016 Non-Qualified Deferred Compensation Table
Name Plan Name
Executive Contributions
in Last FY ($)
Registrant Contributions
in Last FY ($) (1)
Aggregate Earnings in
Last FY ($)
Aggregate Withdrawals/ Distributions
($)
Aggregate Balance at Last FYE ($) (2)
Mr. McInerney Restoration — 259,085 78,483 — 1,041,179 Ms. Groh Restoration — 76,852 16,303 — 239,334
Deferred Compensation — — 11,450 — 136,589 Mr. Schneider Restoration — 99,461 52,998 — 625,897 Mr. Bobitz Restoration — 30,519 12,926 — 159,229
Deferred Compensation — — 6,376 — 65,400 Mr. Sheehan Restoration — 97,985 45,333 — 548,414 (1) Reflects company contributions to the Restoration Plan made in 2017, which are based on 2016 earnings. The contributions are reported as compensation for
2016 in the All Other Compensation column of the 2016 Summary Compensation Table.(2) Aggregate balances reported as of December 31, 2016 for the named executive officers include amounts that were reported in the Summary Compensation
Tables for 2016 and years prior. For the Restoration Plan, the amount of compensation reported in the Summary Compensation Tables for 2016 and yearsprior is $961,831 for Mr. McInerney, $99,107 for Ms. Groh, $431,745 for Mr. Schneider, $30,519 for Mr. Bobitz and $294,985 for Mr. Sheehan.
Potential Payments upon Termination or Change of Control
The following tables and narrative disclosure summarize the compensation and benefits payable to each of the named executive officers in the event of atermination of employment under various circumstances, assuming that such termination was effective as of December 31, 2016. The compensation and benefitsdescribed and quantified below are in addition to the compensation and benefits that would already be earned or vested upon such named executive officer’stermination, including accrued but unpaid salary, accrued and unused vacation pay, and payments and benefits accrued under our broad-based benefit programs,including any vested contributions we made under the 401(k) Savings and Retirement Account Features of our Retirement and Savings Plan.
InvoluntaryTerminationofEmployment(WithoutaChangeofControl)
In December 2014, the Compensation Committee approved the 2015 Severance Plan, which became effective as of January 1, 2015, in order to promote theretention of a select group of key employees, including our named executive officers, by providing severance benefits in the event their employment is terminatedunder certain circumstances and to align with severance benefits commonly provided in our market for competing executive talent. The 2015 Severance Planreplaced the company’s prior severance plan, which expired by its terms on December 31, 2014.
In the event the employment of a named executive officer is terminated without “cause” or by the executive for “good reason” (as such terms are defined inthe 2015 Severance Plan), such named executive officer would be entitled to receive the following severance benefits under the 2015 Severance Plan:
• Severancepayment. The named executive officer would receive a lump sum cash severance payment, payable within 60 days of the date of
termination in an amount equal to two times the sum of base salary and target annual incentive, in the case of Mr. McInerney, and one times basesalary plus one times target annual incentive for the other named executive officers.
• Prorataannualincentiveaward. The named executive officer would receive a lump sum cash payment based on the annual incentive award thatwould have been payable with respect to the fiscal
40

Table of Contents
year in which the qualified termination occurs (determined at the end of such year based on actual performance results), prorated to the nearest halfmonth to reflect the portion of the fiscal year that had elapsed prior to the date of termination.
• Benefitspayment. The named executive officer would receive a lump sum cash payment, payable within 60 days of the date of termination, equal to
the monthly cost of the employer portion to provide the group medical, dental, vision, and/or prescription drug plan benefits the employee had beenreceiving before the termination, multiplied by 12.
• Partialvestingoftime-basedequityawards. Stock options, SARs, RSUs and other equity awards with time-based vesting restrictions held by thenamed executive officer would become immediately vested as of the participant’s termination, but only with respect to a number of awards thatotherwise would have become vested on the award’s next regularly scheduled vesting date based on continued employment (the remainder of suchawards would be forfeited), and stock options and SARs would remain exercisable until the earlier of the first anniversary of the date of the qualifiedtermination or the award’s regular expiration date.
• Vestingofperformance-basedequityawards. Performance-based equity awards held by the named executive officer for at least 12 months would
remain outstanding and would be earned, if at all, based on actual performance through the end of the performance period, prorated to the nearest half-month to reflect the portion of the performance period year that had elapsed prior to the date of termination.
• Retirementplanprovisions. The named executive officer would become fully vested in any funded or unfunded nonqualified pension, retirement ordeferred compensation plans in which he or she participates, provided he or she has been employed by the company for at least five years.
To receive severance benefits under the 2015 Severance Plan, the executive would have to execute and deliver to us a general release of claims and agree tocertain restrictive covenants, including a 12-month non-compete provision, 24-month restrictions on the solicitation of customers and employees, and restrictionson the use of confidential information.
The following table summarizes the payments and benefits that would have been payable to the named executive officers under the 2015 Severance Plan andother retention incentives in the event of a termination without “cause” or by the executive for “good reason” on December 31, 2016. Mr. McInerney Ms. Groh Mr. Schneider Mr. Bobitz Mr. Sheehan Cash Severance (1) $ 6,000,000 $1,100,000 $ 1,812,500 $ 850,000 $ 1,650,000 Annual Incentive (2) 3,000,000 850,000 1,500,000 750,000 1,900,000 Retention Incentive (3) — 600,000 1,000,000 425,000 1,000,000 Payments Related to Health Benefits (4) 3,495 6,565 11,833 — 14,622 SAR and Option Vesting (5) — — — — — RSU Vesting (6) — 282,793 565,153 158,382 546,103 PSU Vesting (7) 127,000 — 133,350 44,450 88,900 SERP Vesting (8) — 659,201 2,988,165 988,168 2,557,025 Restoration Plan Vesting (9) — 239,334 625,897 159,229 548,414
Total $ 9,130,495 $3,737,893 $ 8,636,898 $3,375,229 $ 8,305,064
(1) Reflects a cash severance in the amount of two times the sum of base salary and target annual incentive in the case of Mr. McInerney, and one times base
salary plus one times target annual incentive in the case of the other named executive officers.(2) Reflects an annual incentive award based on actual performance results through the end of 2016. Annual incentive awards under the 2015 Severance Plan are
determined based on actual pro rata performance.(3) Reflects cash-based retention incentive awards that remained outstanding and had not been earned as of December 31, 2016. For more information regarding
the retention incentive, please see the CompensationDiscussionandAnalysisabove.
41

Table of Contents
(4) Represents a lump sum cash payment equal to the company cost of 12 months of continued health coverage.(5) Reflects the aggregate value of stock options and SARs (based on the excess, if any, of the closing price of Genworth common stock on December 31, 2016
over the exercise price) that would immediately vest as of the executive’s termination (the awards for which vesting would accelerate are those awards thatwould have become vested on the award’s next regularly scheduled vesting date based on continued employment). Because the closing price of Genworthcommon stock on December 31, 2016 ($3.81) was less than the exercise price for all stock options and SARs that would become vested, no value for theseawards is reflected in the table.
(6) Reflects the aggregate value of RSUs (based on the closing price of Genworth common stock on December 31, 2016 of $3.81) that would immediately vestas of the executive’s termination (the awards for which vesting would accelerate are those awards that would have become vested on the award’s nextregularly scheduled vesting date based on continued employment).
(7) Reflects the aggregate value of 2015-2017 PSUs, that would remain outstanding following the executive’s termination, and could be earned, if at all, at theend of the performance period based on actual results, prorated to the nearest half-month to reflect the portion of the performance period year that hadelapsed prior to the date of termination. Based on current progress toward goals, amounts payable based on threshold level of performance are shown.Performance-based equity awards that have been held for less than one year at the time of termination are forfeited, and therefore the named executiveofficers would have forfeited the 2016-2018 PSUs granted on March 16, 2016. Based on performance toward goals, the 2014-2016 PSUs did not result inany payout following the performance period.
(8) Reflects the present value of each participating named executive officer’s accumulated benefits under the SERP, as noted in the 2016 Pension BenefitsTable, which would become fully vested.
(9) Reflects the outstanding balance of the Restoration Plan as of December 31, 2016, including contributions made to the plan in 2017 for qualified earnings in2016, as noted in the 2016 Non-Qualified Deferred Compensation Table, which would become fully vested, provided the executive officer has beenemployed by the company for at least five years. For Mr. McInerney, the unvested portion of his Restoration Plan balance would be forfeited until he meetsthis five-year service requirement.
InvoluntaryTerminationFollowingaChangeofControl
In December 2014, the Compensation Committee adopted a new 2014 Change of Control Plan (the “2014 Change of Control Plan”) in order to continue toprovide severance benefits to a select group of key executives, including our named executive officers, in the event that the executive’s employment is terminatedwithout “cause” or by the executive for “good reason” following a change of control of the company. If an executive becomes eligible to receive benefits under the2014 Change of Control Plan, he or she will not be eligible to receive benefits under the 2015 Severance Plan. The 2014 Change of Control Plan replaced andconsolidated the company’s two prior change of control plans.
Pursuant to the 2014 Change of Control Plan, a named executive officer would receive payments and benefits in the event of a termination of employmentwithout “cause” or by the executive with “good reason” within two years following a change of control of the company (each a “Qualified Termination” as definedin the Change of Control Plan). In the event of a Qualified Termination, such named executive officer would be eligible to receive the following severance benefitsunder the 2014 Change of Control Plan:
• Severancepayment. The named executive officer would receive a lump sum cash severance payment in an amount equal to two and one-half times the
sum of his base salary and target annual incentive in the case of Mr. McInerney, and two times the sum of his or her base salary and target annualincentive in the case of the other named executive officers, payable within 60 days following termination.
• Prorataannualincentiveaward. The named executive officer would receive a lump sum cash payment based on the annual incentive award that
would have been payable with respect to the fiscal year in which the Qualified Termination occurs (determined based on actual pro rata performance,to
42
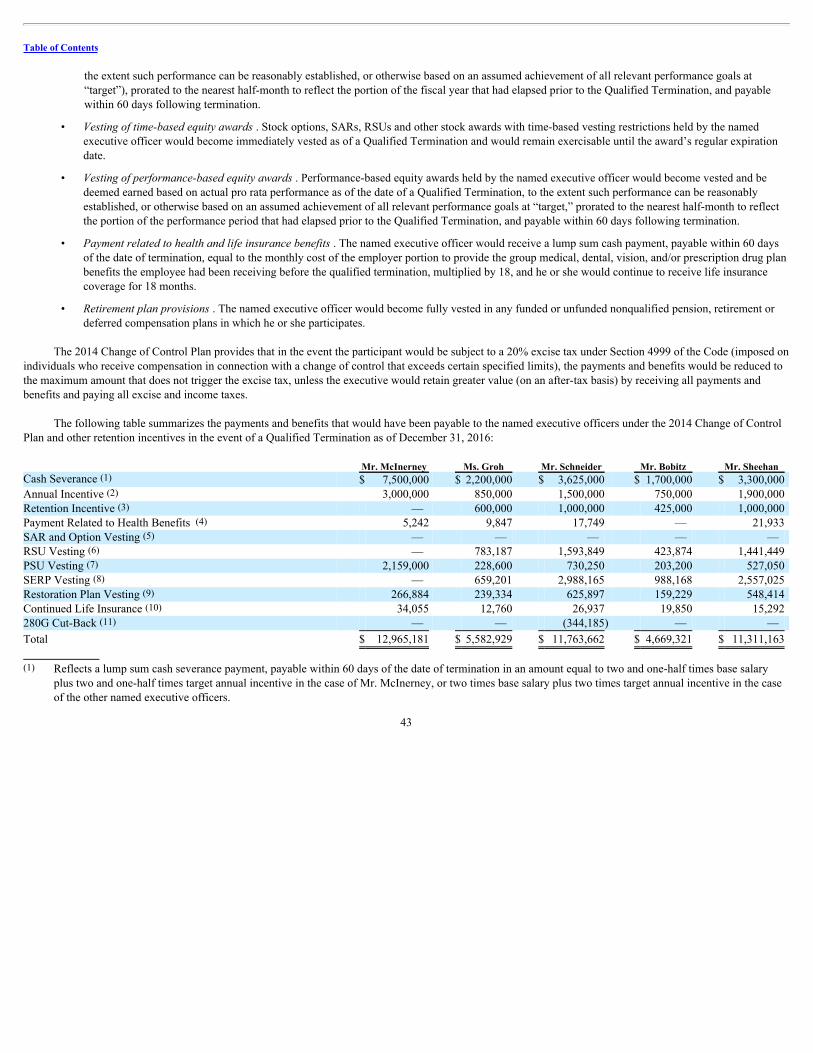
Table of Contents
the extent such performance can be reasonably established, or otherwise based on an assumed achievement of all relevant performance goals at“target”), prorated to the nearest half-month to reflect the portion of the fiscal year that had elapsed prior to the Qualified Termination, and payablewithin 60 days following termination.
• Vestingoftime-basedequityawards. Stock options, SARs, RSUs and other stock awards with time-based vesting restrictions held by the named
executive officer would become immediately vested as of a Qualified Termination and would remain exercisable until the award’s regular expirationdate.
• Vestingofperformance-basedequityawards. Performance-based equity awards held by the named executive officer would become vested and bedeemed earned based on actual pro rata performance as of the date of a Qualified Termination, to the extent such performance can be reasonablyestablished, or otherwise based on an assumed achievement of all relevant performance goals at “target,” prorated to the nearest half-month to reflectthe portion of the performance period that had elapsed prior to the Qualified Termination, and payable within 60 days following termination.
• Paymentrelatedtohealthandlifeinsurancebenefits. The named executive officer would receive a lump sum cash payment, payable within 60 daysof the date of termination, equal to the monthly cost of the employer portion to provide the group medical, dental, vision, and/or prescription drug planbenefits the employee had been receiving before the qualified termination, multiplied by 18, and he or she would continue to receive life insurancecoverage for 18 months.
• Retirementplanprovisions. The named executive officer would become fully vested in any funded or unfunded nonqualified pension, retirement ordeferred compensation plans in which he or she participates.
The 2014 Change of Control Plan provides that in the event the participant would be subject to a 20% excise tax under Section 4999 of the Code (imposed onindividuals who receive compensation in connection with a change of control that exceeds certain specified limits), the payments and benefits would be reduced tothe maximum amount that does not trigger the excise tax, unless the executive would retain greater value (on an after-tax basis) by receiving all payments andbenefits and paying all excise and income taxes.
The following table summarizes the payments and benefits that would have been payable to the named executive officers under the 2014 Change of ControlPlan and other retention incentives in the event of a Qualified Termination as of December 31, 2016: Mr. McInerney Ms. Groh Mr. Schneider Mr. Bobitz Mr. Sheehan Cash Severance (1) $ 7,500,000 $ 2,200,000 $ 3,625,000 $ 1,700,000 $ 3,300,000 Annual Incentive (2) 3,000,000 850,000 1,500,000 750,000 1,900,000 Retention Incentive (3) — 600,000 1,000,000 425,000 1,000,000 Payment Related to Health Benefits (4) 5,242 9,847 17,749 — 21,933 SAR and Option Vesting (5) — — — — — RSU Vesting (6) — 783,187 1,593,849 423,874 1,441,449 PSU Vesting (7) 2,159,000 228,600 730,250 203,200 527,050 SERP Vesting (8) — 659,201 2,988,165 988,168 2,557,025 Restoration Plan Vesting (9) 266,884 239,334 625,897 159,229 548,414 Continued Life Insurance (10) 34,055 12,760 26,937 19,850 15,292 280G Cut-Back (11) — — (344,185) — —
Total $ 12,965,181 $ 5,582,929 $ 11,763,662 $ 4,669,321 $ 11,311,163
(1) Reflects a lump sum cash severance payment, payable within 60 days of the date of termination in an amount equal to two and one-half times base salary
plus two and one-half times target annual incentive in the case of Mr. McInerney, or two times base salary plus two times target annual incentive in the caseof the other named executive officers.
43

Table of Contents
(2) Reflects lump sum cash payment of the current-year annual incentive award based on actual performance results through the end of 2016. Annual incentiveawards under the 2014 Change of Control Plan are determined based on actual pro rata performance, to the extent such performance can be reasonablyestablished, or otherwise based on an assumed achievement of all relevant performance goals at “target.”
(3) Reflects cash-based retention incentive awards that remained outstanding and had not been earned as of December 31, 2016. For more information regardingthe retention incentive, please see the CompensationDiscussionandAnalysissection above.
(4) Reflects a lump sum cash payment equal to the company cost of 18 months of continued health coverage.(5) Reflects the aggregate value of stock options and SARs (based on the excess, if any, of the closing price of Genworth common stock on December 31, 2016
over the exercise price) which would become immediately vested and exercisable in full. Because the closing price of Genworth common stock onDecember 31, 2016 ($3.81) was less than the exercise price for all stock options and SARs that would become vested, no value for these awards is reflectedin the table.
(6) Reflects the aggregate value of RSUs (based on the closing price of Genworth common stock on December 31, 2016 of $3.81) which would immediatelyvest as of the executive’s termination.
(7) Pursuant to the 2014 Change of Control Plan, 2015-2017 and 2016—2018 PSUs would become vested and be deemed earned based on actual pro rataperformance as of the date of a participant’s Qualified Termination, to the extent such performance can be reasonably established in the sole discretion of theCompensation Committee, or otherwise based on an assumed achievement of all relevant performance goals at “target.” Amounts in column reflect theaggregate value of these PSUs (based on the closing price of Genworth common stock on December 31, 2015 of $3.81) which would become vested basedon an assumed achievement of performance goals at “target levels,” and a pro rata payout based on the portion of the performance period elapsed as of theQualified Termination. Based on performance toward goals, the 2014-2016 PSUs did not result in any payout following the performance period.
(8) Reflects the present value of each participating named executive officer’s accumulated benefits under the SERP, as noted in the 2016 Pension BenefitsTable, which would become fully vested.
(9) Reflects the outstanding balance of the Restoration Plan as of December 31, 2016, including contributions made to the plan in 2017 for qualified earnings in2016, as noted in the 2016 Non-Qualified Deferred Compensation Table, which would become fully vested. For Mr. McInerney, this represents only theSupplemental Contribution account balance within the Restoration Plan due to the fact he is already vested in the 401(k) Savings and Retirement AccountFeature balances.
(10) Reflects the estimated value of premium payments for 18 months of continued coverage under the Leadership Life and Executive Life Programs.(11) If an executive’s total parachute payments exceed the 280G threshold amount by less than 10%, then the compensation payable to the executive will be
reduced such that the total parachute payments to the executive do not exceed the 280G threshold amount (the amount of any such reduction is referred to asa “280G Cut-Back”). The amounts reflect a good-faith estimate of the potential 280G Cut-Back amounts for Mr. Schneider.
DeathorDisability
In the event of death or total disability, executive officers (or their designated beneficiary) would generally be eligible to receive the following:
• EquityAwards.In the event of death, all unvested stock options and SARs would become vested and exercisable, all unvested RSUs would becomevested, and unvested PSUs held for at least one year would become vested on a pro rata basis as of the date of termination based on the number of fullmonths elapsed from the grant date until the date of termination, and would pay out at the end of the regular performance period based on actualperformance. In the event of termination due to total disability, the treatment of outstanding stock options, SARs, RSUs and PSUs is the same as in theevent of death, except that with respect to outstanding stock options, SARs and RSUs, any such equity awards not held for more than a year from thegrant date would be forfeited.
44

Table of Contents
• AnnualIncentive.Executive officers (or their designated beneficiary) would receive a pro-rated portion of any annual incentive award, based on actualperformance results.
• RetirementPrograms. Executive officers (or their designated beneficiary) would become vested in the SERP benefits shown in the 2016 Pension
Benefits Table and the balance of the Restoration Plan reported in the 2016 Non-Qualified Deferred Compensation Table (which includes the 2017contribution to the Restoration Plan, based on 2016 compensation).
• LifeInsurancePrograms. In the event of death, their beneficiary would receive payments pursuant to the Leadership Life and Executive Life
Programs in the form of death benefits. In the event of disability, the executive would receive one year of continued Leadership Life Programpremiums.
The following table summarizes the payments and benefits payable to the named executive officers (or their designated beneficiary) in the event of death ortotal disability as of December 31, 2016: Mr. McInerney Ms. Groh Mr. Schneider Mr. Bobitz Mr. Sheehan Death Disability Death Disability Death Disability Death Disability Death Disability Stock Option and SAR Vesting (1) $ — $ — $ — $ — $ — $ — $ — $ — $ — $ — RSU Vesting (2) — — 783,187 97,387 1,593,849 203,199 423,874 80,974 1,441,449 393,698 PSU Vesting (3) 127,000 127,000 — — 133,350 133,350 44,450 44,450 88,900 88,900 Cash-in-Lieu of Equity (4) — — 58,250 58,250 — — — — — — Retention Incentive (5) — — 600,000 — 1,000,000 1,000,000 425,000 425,000 1,000,000 1,000,000 Pro-Rated Annual Incentive Award (6) 3,000,000 3,000,000 850,000 850,000 1,500,000 1,500,000 750,000 750,000 1,900,000 1,900,000 SERP Vesting (7) — — 659,201 659,201 2,988,165 2,988,165 988,168 988,168 2,557,025 2,557,025 Restoration Plan Vesting (8) 266,884 266,884 239,334 239,334 625,897 625,897 159,229 159,229 548,414 548,414 Leadership Life Program (9) 2,000,000 16,418 1,200,000 4,705 2,000,000 12,625 1,444,000 8,582 2,000,000 5,263 Executive Life Program (10) 1,453,500 — 1,453,500 — 1,456,000 — 1,453,500 — 1,463,000 —
Total $ 6,847,384 $ 3,410,302 $ 5,843,472 $ 1,908,877 $ 11,297,261 $ 6,463,236 $ 5,688,221 $ 2,456,403 $ 10,998,788 $ 6,493,300
(1) Reflects the aggregate value of stock options and SARs (based on the excess, if any, of the closing price of Genworth common stock on December 31, 2016
over the exercise price) which would become immediately vested and exercisable in full. Because the closing price of Genworth common stock onDecember 31, 2016 ($3.81) was less than the exercise price for all stock options and SARs that would become vested, no value for these awards is reflectedin the table.
(2) Reflects the aggregate value of RSUs (based on the closing price of Genworth common stock on December 31, 2016 of $3.81) which would immediatelyvest as of the executive’s death or total disability.
(3) Based on performance toward goals, the 2014-2016 PSUs were not earned and did not become vested following the performance period. Based on currentprogress toward goals, a pro rata payout of 2015-2017 PSUs based on a threshold level of performance is reflected in the table. Performance-based equityawards that have been held for less than one year at the time of termination are forfeited, and therefore the named executive officers would have forfeited the2016-2018 PSUs granted on March 16, 2016.
(4) Reflects the portion of the Cash-in-Lieu of Equity award made to Ms. Groh which would accelerate immediately upon her termination. For more informationregarding Cash-in-Lieu of Equity, please see the CompensationDiscussionandAnalysissection above.
(5) Reflects cash-based retention incentive awards that remained outstanding and had not been earned as of December 31, 2016. For more information regardingthe retention incentive, please see the CompensationDiscussionandAnalysissection above.
(6) Reflects a pro rata portion of any annual incentive award, based on actual performance results.(7) Reflects the present value of each participating named executive officer’s accumulated benefits under the SERP, as noted in the 2016 Pension Benefits
Table, which would become fully vested.(8) Pursuant to the terms of the Restoration Plan, the Restoration Plan balances become vested in the event of death or disability. For Mr. McInerney, this
represents only the Supplemental Contribution account balance within the Restoration Plan due to the fact he is already vested in the 401(k) Savings andRetirement
45

Table of Contents
Account Feature balances. These amounts, which include contributions to be made on behalf of the named executive officers in 2017 for compensationearned in 2016, are reported in the 2016 Non-Qualified Deferred Compensation Table.
(9) Represents death benefits payable to the named executive officer’s beneficiary in the event of death, or the value of one year of continued premium paymentsin the event of total disability.
(10) Pursuant to the terms of the Executive Life Program, we will use the proceeds from a company-owned life insurance policy to pay the named executiveofficer’s beneficiary a $1 million payment, plus a gross-up on federal and state income taxes related to that payment.
Retirement
Each of our executive benefit and compensation programs has varying retirement definitions. Upon a voluntary termination, a retirement-eligible executivewould be eligible to receive the following:
• RetirementPrograms.The current definition of retirement for purposes of the SERP is attainment of age 60 with five years of service. As amendedand described above, participants in the SERP may partially vest sooner after they reach age 55 and have earned five years of “future service” (i.e.,service occurring after December 31, 2015) based on a scale ranging from 50% at age 55 and increasing by 10% each year until the participant reachesfull vesting at age 60. The SERP was closed to new participants effective January 1, 2010; therefore, Mr. McInerney is not eligible for our SERP. TheRestoration Plan currently vests upon termination if the participant is at least age 60 with respect to the Restoration 401(k) Savings and RestorationRetirement Account Feature account balances, and after age 60 with five years of service with respect to any Supplemental Contribution accountbalance. As of December 31, 2016 Mr. McInerney is vested in the Restoration 401(k) Savings and Restoration Retirement Account Feature balances($774,295), but is not yet vested in his Supplemental Contribution account balance ($266,884) as he has not yet met the five-year service requirement.
As amended and described above, the Restoration Plan may also become vested after attaining three years of “future service” (i.e., service occurringafter December 31, 2015) with respect to the Restoration 401(k) Savings Feature and Restoration Retirement Account Feature (there is no change tothe vesting requirements for Supplemental Contributions). Benefits will be paid from the Restoration Plan in 10 annual installments if the accountbalance is $50,000 or more at retirement or paid in a lump sum if the account balance is less than $50,000 at retirement.
• LifeInsurancePrograms.The definition of retirement under the Leadership Life Program is age 60 with 10 years of service. If this eligibility is met,we will continue to pay Leadership Life Program premiums until the later of age 65 or until a total of 10 annual premium payments have been made.For participants under the Executive Life Program prior to January 1, 2007, we will continue to pay the premium if the executive retires at age 60 with10 years of service. For participants who joined the Executive Life Program after January 1, 2007, coverage will cease at termination.
• EquityAwards.All unvested stock option, SAR and RSU awards that have been held for one year at the time of retirement would immediately vest
and become exercisable if the participant is at least age 60 with five years of service at retirement. PSUs would become vested on a pro rata basis,based on actual performance for the entire performance period.
BusinessDisposition
Some of our equity awards contain provisions for modified vesting if an employee terminates as a result of employment by a successor employer to whichwe have transferred a business operation (“Business Disposition”). In the event of a Business Disposition and related termination of employment as ofDecember 31, 2016, all unvested SARs noted in the Outstanding Equity Awards at 2016 Fiscal Year-End Table above that have been held for at least 12 months asof the date of termination would continue to vest in accordance with their original vesting schedule, and outstanding stock options and SARs would expire on theearlier of the original
46

Table of Contents
expiration date or five years from the Business Disposition date. All outstanding RSU and PSU awards held by an employee transferred in a Business Dispositionwould be forfeited immediately upon such Business Disposition. For Ms. Groh and Mr. Bobitz, the cash-based retention incentive awards held, and for Ms. Grohthe first 50% of the Cash-in-Lieu of Equity, would each vest and become payable should employment terminate as a result of a Business Disposition.
Compensation of Directors
The Nominating Committee has the responsibility for annually reviewing and recommending to the Board compensation and benefits for “non-managementdirectors.” Non-management directors are those directors who are not executive officers of Genworth or its affiliates. Accordingly, all directors, other thanMr. McInerney, are regarded as non-management directors. Mr. McInerney does not receive any compensation for serving as a director. As part of its 2016 review,the Nominating Committee engaged Steven Hall & Partners, LLC to provide competitive market data and advice regarding non-management directorcompensation. Based on its review, the Nominating Committee determined not to recommend any changes to the company’s non-management directorcompensation and benefits program.
The company’s compensation and benefits for non-management directors are as follows:
• AnnualRetainer.Each non-management director is paid an annual retainer, payable in quarterly installments following the end of each quarter ofservice. The amount of the annual retainer is $230,000. Of this amount, 60% of the annual retainer is paid in deferred stock units (“DSUs”) and 40% ispaid in cash. Instead of receiving a cash payment, non-management directors may elect to have 100% of their annual retainer paid in DSUs; however,no more than 30,000 DSUs may be granted to any non-management director with respect to the annual retainer in any one calendar year. To the extentthis limit would be exceeded, the remainder of a director’s annual retainer will be paid in cash.
• DeferredStockUnits.Each DSU awarded to non-management directors represents the right to receive one share of our common stock in the future.DSUs are granted at the end of each quarter of service and are credited to a notional account maintained by us in the recipient’s name. The number ofDSUs granted is determined by dividing the DSU value to be delivered by the fair market value of our common stock on the date of grant. If thecompany pays dividends on its common stock, dividend equivalents accrue with respect to the DSUs, which are reinvested in additional DSUs. TheDSUs will be paid out beginning one year after the director leaves the Board in a single payment or in payments over 10 years, at the election of thedirector, or, if earlier, upon the death of the director.
• RetainerforNon-ExecutiveChairmanoftheBoard.The Non-Executive Chairman of the Board receives a $200,000 annual retainer in addition to theregular annual retainer. Such amount is paid in quarterly installments, following the end of each quarter of service. Of this amount, 60% is paid inDSUs and 40% is paid in cash. Instead of receiving a cash payment, the Non-Executive Chairman of the Board may elect to have 100% of theadditional annual retainer paid in DSUs; however, no more than 25,000 DSUs may be granted to the Non-Executive Chairman of the Board withrespect to the additional annual retainer in any one calendar year. To the extent this limit would be exceeded, the remainder of the additional annualretainer will be paid in cash.
• FeesforLeadDirector.If a Lead Director is appointed in the absence of an independent Non-Executive Chairman of the Board, the Lead Directorwould receive an annual cash retainer of $20,000 in quarterly installments, as additional compensation for services as Lead Director.
• FeesforCommitteeChairs.The chairpersons of each of our standing committees receive additional cash retainers, which are paid in quarterly
installments. The chairperson of the Audit Committee receives an annual cash retainer of $20,000, the chairperson of the Compensation Committeereceives an annual cash retainer of $15,000, and the chairpersons of each of our other standing committees receive an annual cash retainer of $10,000.
47

Table of Contents
• MatchingGiftProgram.The company offers a matching gift program that provides for the matching of employee and director charitable contributions
pursuant to the contribution guidelines established by the Genworth Foundation. Each non-management director is eligible for such charitablecontributions to be matched on a 50% basis, up to a maximum matching contribution of $10,000 during any calendar year.
• ReimbursementofCertainExpenses.Non-management directors are reimbursed for reasonable travel and other Board-related expenses, including
expenses to attend Board and committee meetings, other business-related events and director education seminars, in accordance with policies approvedfrom time to time.
The following table sets forth information concerning compensation paid or accrued by us in 2016 to our non-management directors:
2016 Director Compensation Table
Name
Fees Earned or
Paid in Cash ($) (3)
Stock Awards ($) (4)(5)
All Other Compensation
($) (6) Total
($) William H. Bolinder 136,902 65,335 10,000 212,237 G. Kent Conrad 126,902 65,335 3,250 195,487 Melina E. Higgins 126,902 65,335 9,999 202,236 David M. Moffett 128,777 65,335 — 194,112 Thomas E. Moloney 136,902 65,335 7,500 209,737 James A. Parke 161,555 61,878 10,000 233,433 Debra J. Perry (1) 3,833 3,650 — 7,483 Robert P. Restrepo Jr. (1) 3,833 3,650 — 7,483 James S. Riepe 242,557 118,474 10,000 371,031 Christine B. Mead (2) 34,500 32,167 10,000 76,667 Nancy J. Karch (2) 40,125 32,167 — 72,292 John R. Nichols (2) 42,167 29,465 10,000 81,632 (1) Effective December 14, 2016, upon the recommendation of the Nominating and Corporate Governance committee, Ms. Perry and Mr. Restrepo were elected
to the Board of Directors.(2) Mses. Karch and Mead did not stand for re-election at our 2016 annual meeting of stockholders on May 12, 2016 and therefore retired from the Board of
Directors effective that date. Mr. Nichols was elected to the Board of Directors on May 12, 2016 and subsequently tendered his resignation from the Boardof Directors on September 22, 2016.
(3) Amounts include the portion of the annual retainer (described above) that was paid in cash. Mr. Parke elected to receive 100% of his annual retainer payablein 2016 in the form of DSUs and reached the maximum deferral of 30,000 DSUs with his second quarter retainer payment; therefore, a portion of his secondquarter payment and his full third and fourth quarter payments were made in cash. Messrs. Bolinder, Conrad, Moffett, Moloney and Riepe and Ms. Higginsreached the maximum deferral of 30,000 DSUs with their third quarter retainer payment; therefore, a portion of their third quarter payment and full fourthquarter payment was made in cash. Amounts also include applicable committee chair fees and the retainer for the Non-Executive Chairman of the Board ofDirectors.
(4) Reflects the aggregate grant date fair value of DSUs, determined in accordance with FASB ASC Topic 718. The fair value of stock unit awards for purposesof Topic 718 typically equals the price of the underlying stock on the date of grant; however, amounts in the table are lower because the DSUs do not convertto transferable shares until one year after the director leaves the Board of Directors, and Topic 718 provides that the impact of transferability restrictions thatremain in place after an award of stock based compensation vests may be considered when determining the fair value of the award for accounting purposes.The Finnerty option
48

Table of Contents
pricing model was, therefore, used to factor in these post-vest holding requirements with the following assumptions: (i) expected post vesting restrictionperiod of 7.9 years; (ii) expected volatility of 82.0%; (iii) risk-free interest rate of 1.60%; (iv) expected dividend yield of 0.00%; and (v) calculated discountfor post vest restriction period of 31.8%.
(5) The following table shows for each non-management director the total number of DSUs held as of December 31, 2016 (rounded down to the nearest wholeshare):
Name
Total Number of DSUs Held as of
December 31, 2016 William H. Bolinder 109,671 G. Kent Conrad 72,832 Melina E. Higgins 67,837 David M. Moffett 81,725 Thomas E. Moloney 117,415 James A. Parke 212,302 Debra J. Perry 1,403 Robert P. Restrepo Jr. 1,403 James S. Riepe 237,055 Nancy J. Karch 146,391 Christine B. Mead 105,001 John R. Nichols 11,318
(6) Amounts reflect company charitable match contributions.
Director Stock Ownership Policy
To help promote the alignment of the personal interests of the company’s directors with the interests of our stockholders, we have established a robust stockownership policy for all non-management directors. Under the policy, each non-management director is expected to hold common stock and/or DSUs while servingas a director of Genworth having a value equal to five times the value of the cash portion of the annual retainer payable to non-management directors, which iscurrently $92,000. Therefore, the current ownership guideline is $460,000. Non-management directors are expected to satisfy this ownership guideline over timeafter their initial appointment to the Board, and are not permitted to sell any shares of Genworth common stock received from us until the ownership guideline hasbeen met. The DSUs held by the non-management directors settle in shares of common stock beginning one year after the director leaves the Board of Directors ina single payment or in payments over 10 years, at the election of the director, or earlier upon the death of the director.
The following table shows the stock ownership as of March 1, 2017 of our non-management directors serving on that date, the percentage of the ownershipguideline that they have reached, and the number of years that have elapsed since the director was initially made subject to the policy. The value of each non-management director’s stock ownership is based on the closing price of our common stock on March 1, 2017 ($4.13).
Director
Number of Shares/DSUs
Held (#)
Value as of March 1, 2017
($)
Stock Held as %of Ownership
Guideline
Years Subjectto Ownership
Policy William H. Bolinder 109,671 452,941 98% 6 G. Kent Conrad 72,832 300,796 65% 4 Melina E. Higgins 67,837 280,167 61% 3 David M. Moffett 81,725 337,524 73% 4 Thomas E. Moloney 117,415 484,924 > 100% 7 James A. Parke (1) 212,302 876,807 > 100% 10 Debra J. Perry 1,403 5,794 1% 0 Robert P. Restrepo Jr. 1,403 5,794 1% 0 James S. Riepe 237,055 979,037 > 100% 10
49
Table of Contents
(1) Mr. Parke has served on our Board of Directors since 2004 but was first elected to our Board of Directors by the holders of the company’s Class A Common
Stock in May 2006. At such time, Mr. Parke became a non-management director and subject to the director stock ownership policy.
Item 12. Security Ownership of Certain Beneficial Owners and Management and Related Stockholder Matters
INFORMATION RELATING TO DIRECTORS, EXECUTIVE OFFICERS AND SIGNIFICANT STOCKHOLDERS
Ownership of Genworth Common Stock
The following table sets forth information as of March 1, 2017, except as indicated in the footnotes to the table, regarding the beneficial ownership of ourcommon stock by:
• all persons (including any “group” as that term is used in Section 13(d)(3) of the Exchange Act) known by us to own beneficially more than 5% of anyclass of our common stock (based on the most recently available information filed with the SEC);
• the named executive officers included in the 2016 Summary Compensation Table as set forth in Item 11;
• each of our current directors; and
• all directors and executive officers as a group.
Beneficial ownership is determined in accordance with the rules of the SEC. Except as indicated in the footnotes to the table, each of the directors andexecutive officers possesses sole voting and investment power with respect to all shares set forth opposite his or her name. In computing the number of sharesbeneficially owned by a person and the percentage ownership of that person, shares of common stock issuable upon the exercise of stock options or SARs or uponthe conversion of RSUs held by that person that are currently exercisable or convertible, or are exercisable or convertible within 60 days of March 1, 2017, aredeemed to be issued and outstanding. These shares, however, are not deemed outstanding for purposes of computing percentage ownership of any otherstockholder. The number of shares issuable upon exercise of SARs is calculated based on the excess of the closing price of our common stock on March 1, 2017over the base price of the SARs. As of March 1, 2017, there were 498,927,446 shares of common stock outstanding and no shares of any other class of votingsecurities outstanding.
50
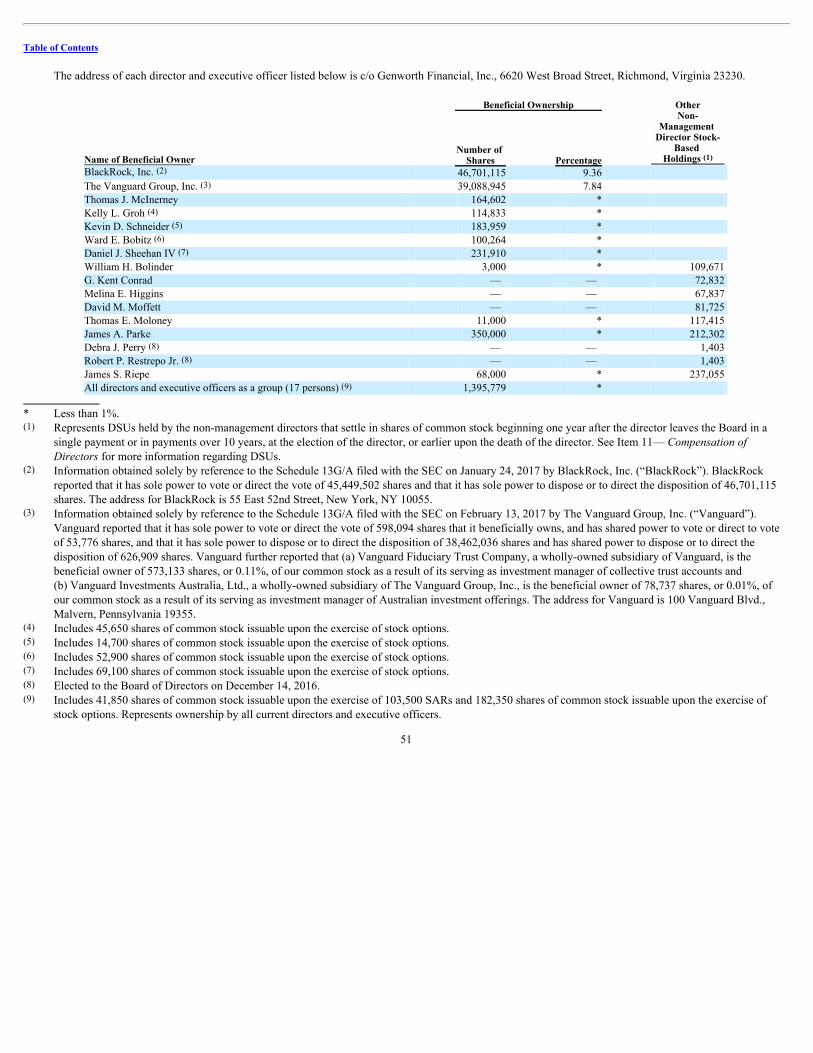
Table of Contents
The address of each director and executive officer listed below is c/o Genworth Financial, Inc., 6620 West Broad Street, Richmond, Virginia 23230.
Beneficial Ownership OtherNon-
Management Director Stock-
Based Holdings (1) Name of Beneficial Owner
Number of Shares Percentage
BlackRock, Inc. (2) 46,701,115 9.36 The Vanguard Group, Inc. (3) 39,088,945 7.84 Thomas J. McInerney 164,602 * Kelly L. Groh (4) 114,833 * Kevin D. Schneider (5) 183,959 * Ward E. Bobitz (6) 100,264 * Daniel J. Sheehan IV (7) 231,910 * William H. Bolinder 3,000 * 109,671 G. Kent Conrad — — 72,832 Melina E. Higgins — — 67,837 David M. Moffett — — 81,725 Thomas E. Moloney 11,000 * 117,415 James A. Parke 350,000 * 212,302 Debra J. Perry (8) — — 1,403 Robert P. Restrepo Jr. (8) — — 1,403 James S. Riepe 68,000 * 237,055 All directors and executive officers as a group (17 persons) (9) 1,395,779 *
* Less than 1%.(1) Represents DSUs held by the non-management directors that settle in shares of common stock beginning one year after the director leaves the Board in a
single payment or in payments over 10 years, at the election of the director, or earlier upon the death of the director. See Item 11— CompensationofDirectorsfor more information regarding DSUs.
(2) Information obtained solely by reference to the Schedule 13G/A filed with the SEC on January 24, 2017 by BlackRock, Inc. (“BlackRock”). BlackRockreported that it has sole power to vote or direct the vote of 45,449,502 shares and that it has sole power to dispose or to direct the disposition of 46,701,115shares. The address for BlackRock is 55 East 52nd Street, New York, NY 10055.
(3) Information obtained solely by reference to the Schedule 13G/A filed with the SEC on February 13, 2017 by The Vanguard Group, Inc. (“Vanguard”).Vanguard reported that it has sole power to vote or direct the vote of 598,094 shares that it beneficially owns, and has shared power to vote or direct to voteof 53,776 shares, and that it has sole power to dispose or to direct the disposition of 38,462,036 shares and has shared power to dispose or to direct thedisposition of 626,909 shares. Vanguard further reported that (a) Vanguard Fiduciary Trust Company, a wholly-owned subsidiary of Vanguard, is thebeneficial owner of 573,133 shares, or 0.11%, of our common stock as a result of its serving as investment manager of collective trust accounts and(b) Vanguard Investments Australia, Ltd., a wholly-owned subsidiary of The Vanguard Group, Inc., is the beneficial owner of 78,737 shares, or 0.01%, ofour common stock as a result of its serving as investment manager of Australian investment offerings. The address for Vanguard is 100 Vanguard Blvd.,Malvern, Pennsylvania 19355.
(4) Includes 45,650 shares of common stock issuable upon the exercise of stock options.(5) Includes 14,700 shares of common stock issuable upon the exercise of stock options.(6) Includes 52,900 shares of common stock issuable upon the exercise of stock options.(7) Includes 69,100 shares of common stock issuable upon the exercise of stock options.(8) Elected to the Board of Directors on December 14, 2016.(9) Includes 41,850 shares of common stock issuable upon the exercise of 103,500 SARs and 182,350 shares of common stock issuable upon the exercise of
stock options. Represents ownership by all current directors and executive officers.
51

Table of Contents
Ownership of Public Company Genworth Subsidiaries
GenworthMICanadaInc.
In July 2009, Genworth MI Canada Inc. (“Genworth Canada”), our indirect, majority-owned subsidiary, completed an initial public offering of its commonshares. As of March 1, 2017, we beneficially owned 57.2% of the common shares of Genworth Canada. The following table sets forth information as of March 1,2017, regarding the beneficial ownership of the common shares of Genworth Canada by the named executive officers and all of our directors and executive officersas a group. As of March 1, 2017, none of our current directors beneficially owned any common shares of Genworth Canada. Beneficial ownership is determined inaccordance with the rules of the SEC. The executive officers that hold Genworth Canada common shares possess sole voting and investment power with respect toall shares set forth by their name. As of March 1, 2017, there were 91,941,600 common shares of Genworth Canada outstanding and no shares of any other class ofvoting securities outstanding.
Beneficial Ownership
Name of Beneficial Owner Number of
Shares Percentage Thomas J. McInerney — — Kelly L. Groh — — Kevin D. Schneider — — Ward E. Bobitz — — Daniel J. Sheehan IV — — All directors and executive officers as a group (17 persons) (1) 4,530 *
* Less than 1%.(1) Represents ownership by all current directors and executive officers.
GenworthMortgageInsuranceAustraliaLimited
In May 2014, Genworth Mortgage Insurance Australia Limited (“Genworth Australia”), our indirect, majority-owned subsidiary, completed an initial publicoffering of its common shares. As of March 1, 2017, we beneficially owned 52.0% of the common shares of Genworth Australia. The following table sets forthinformation as of March 1, 2017, regarding the beneficial ownership of the common shares of Genworth Australia by the named executive officers and all of ourdirectors and executive officers as a group. As of March 1, 2017, none of our current directors beneficially owned any common shares of Genworth Australia.Beneficial ownership is determined in accordance with the rules of the SEC. The executive officers that hold Genworth Australia common shares possess solevoting and investment power with respect to all shares set forth by their name. As of March 1, 2017, there were 509,149,741 common shares of Genworth Australiaoutstanding and no shares of any other class of voting securities outstanding.
Beneficial Ownership
Name of Beneficial Owner Number of
Shares Percentage Thomas J. McInerney — — Kelly L. Groh — — Kevin D. Schneider 33,419 * Ward E. Bobitz — — Daniel J. Sheehan IV — — All directors and executive officers as a group (17 persons) (1) 100,024 *
* Less than 1%.(1) Represents ownership by all current directors and executive officers.
52

Table of Contents
EQUITY COMPENSATION PLANS
The following table gives information as of December 31, 2016 about common stock that may be issued under all of our existing equity compensation plans:
Plan Category
(a) Number of Securities
to be Issued Upon Exercise of
Outstanding Options,Warrants and Rights
(2)
(b) Weighted-Average Exercise Price of
Outstanding Options,Warrants and Rights
(3)
(c) Number of Securities
Remaining Available for Future Issuance Under Equity Compensation
Plans (Excluding SecuritiesReflected in Column(a)) (4)
Equity Compensation Plans Approved byStockholders (1) 11,121,319 $ 11.42 5,699,163
Equity Compensation Plans Not Approved byStockholders — — —
Total 11,121,319 $ 11.42 5,699,163
(1) 2004 Genworth Financial, Inc. Omnibus Incentive Plan and 2012 Genworth Financial, Inc. Omnibus Incentive Plan.(2) Includes shares issuable pursuant to the exercise or conversion of stock options, SARs, RSUs, PSUs and DSUs. The number of shares issuable upon exercise
of SARs is calculated based on the excess, if any, of the closing price of our common stock on December 30, 2016 of $3.81 over the base price of the SARs.The number of shares issuable upon conversion of PSUs is calculated based on maximum payout levels until the performance period closes and the awardsettles.
(3) Calculation of weighted-average exercise price of outstanding awards includes SARs (which are exercisable for shares of common stock for noconsideration) and stock options, but does not include RSUs, PSUs and DSUs that convert to shares of common stock for no consideration. The weighted-average exercise price of outstanding stock options was $11.83. The weighted-average base price of outstanding SARs was $10.42.
(4) All of these shares are available for issuance pursuant to grants of full-value stock awards.
CHANGES IN CONTROL
On October 21, 2016, Genworth entered into an Agreement and Plan of Merger (the “Merger Agreement”) with Asia Pacific Global Capital Co., Ltd., alimited liability company incorporated in the People’s Republic of China (“Asia Pacific”), and Asia Pacific Global Capital USA Corporation, a Delawarecorporation and an indirect, wholly owned subsidiary of Asia Pacific (“Merger Sub”), pursuant to which Merger Sub will merge with and into Genworth, subject tothe terms and conditions of the Merger Agreement (the “Merger”), with Genworth surviving the Merger as an indirect, wholly owned subsidiary of Asia Pacific,and an indirect subsidiary of China Oceanwide Holdings Group Co., Ltd., a limited liability company incorporated in the People’s Republic of China. Genworthexpects the proposed transaction to be completed by the middle of 2017, subject to certain closing conditions including receipt of required regulatory approvals.
Item 13. Certain Relationships and Related Transactions, and Director Independence.
CERTAIN RELATIONSHIPS AND RELATED TRANSACTIONS
Our Board of Directors has established a policy, which is set forth in our Governance Principles that Genworth will not enter into a transaction with a“related person” except in circumstances where there is a verifiable Genworth business interest supporting the transaction and the transaction otherwise meetsGenworth’s standards that apply to similar transactions with unaffiliated entities or persons. For purposes of our policy, “related person” means any of ourexecutive officers, directors, nominees for director, any persons known by us to beneficially own in excess of 5% of any class of our voting securities, any personwho is an immediate family member of the foregoing and any firm, corporation or other entity in which any of the foregoing persons is an executive officer,general partner, principal or in a similar position or in which such person is deemed to have a
53

Table of Contents
10% or greater beneficial ownership interest. Our policy applies to all transactions with “related persons,” including modifications of previously approvedtransactions, other than: (1) transactions available to all employees generally; and (2) transactions involving the payment of compensation or the entry intocompensatory agreements or arrangements that are approved by the Compensation Committee or paid pursuant to an agreement, plan or arrangement approved bythe Compensation Committee. The Board has delegated to the Audit Committee the responsibility of establishing policies and procedures for the review andapproval of transactions with related persons, and the Audit Committee has established certain key practices related thereto. Our Governance Principles are inwriting and can be found in the corporate governance section of our website. To view, go to www.genworth.com, select “Investors,” then select “CorporateGovernance” and then select “Governance Principles.” Our Audit Committee’s key practices are in writing and can be found in the corporate governance section ofour website. To view, go to www.genworth.com, select “Investors,” then select “Corporate Governance,” then select “Audit Committee” and finally select “KeyPractices.”
DIRECTOR INDEPENDENCE
Our Board currently consists of ten directors, nine of whom are independent (as defined by our Governance Principles and NYSE listing standards) and oneof whom is our CEO, Mr. McInerney. For a director to be independent, the Board must determine that the director does not have any direct or indirect materialrelationship with Genworth. The Board has established guidelines to assist it in determining director independence, which conform to, or are more exacting than,the independence requirements of the NYSE. The independence guidelines are set forth in Section 4 of our Governance Principles, which are available on ourwebsite (to view, go to www.genworth.com, select “Investors,” then select “Corporate Governance” and then select “Governance Principles”). In addition toapplying these guidelines, the Board will consider all relevant facts and circumstances in making an independence determination. Our Board has determined thatthe purchase of Genworth products and services on the same terms available to unaffiliated entities or persons does not impair a director’s independence andtherefore such purchases are not considered by our Board when making independence determinations. The Board has determined that Mr. Bolinder, Sen. Conrad,Ms. Higgins, Mr. Moffett, Mr. Moloney, Mr. Parke, Ms. Perry, Mr. Restrepo and Mr. Riepe satisfy the NYSE’s independence requirements and Genworth’sindependence guidelines. The Board also previously determined that Nancy J. Karch and Christine B. Mead, who served on the board in 2016 until the annualstockholders meeting held in May 2016, and John R. Nichols, who served on the Board from the annual stockholders meeting in May 2016 until September 2016,satisfied the NYSE’s independence requirements and Genworth’s independence guidelines.
In addition to the independence guidelines discussed above, members of the Audit Committee also must satisfy additional independence requirementsestablished by the SEC and the NYSE. Specifically, they may not accept, directly or indirectly, any consulting, advisory or other compensatory fee from Genworthor any of its subsidiaries other than their directors’ compensation and they may not be affiliated with Genworth or any of its subsidiaries. The Board has determinedthat all the members of the Audit Committee satisfy the relevant SEC and NYSE independence requirements.
Further, in affirmatively determining the independence of any director who will serve on the Management Development and Compensation Committee, theBoard has also considered all factors specifically relevant to determining whether a director has a relationship to Genworth that is material to that director’s abilityto be independent from management in connection with the duties of a member of the Management Development and Compensation Committee, including: (1) thesource of compensation of the director, including any consulting, advisory or other compensatory fee paid by Genworth to such director; and (2) whether thedirector is affiliated with Genworth, its subsidiaries or its affiliates.
MEETINGS OF NON-MANAGEMENT AND INDEPENDENT DIRECTORS
All of our current non-management directors are independent (as determined in accordance with the NYSE listing standards and our Governance Principles)and our non-management directors met without management
54

Table of Contents
present at regularly scheduled Board meetings during 2016. Our Governance Principles provide that the non-management directors will meet regularly withoutmanagement present. Mr. McInerney, our CEO, is currently the only employee of the company who serves on our Board. In addition, our Governance Principlesprovide that if the non-management directors include individuals who are not independent, as determined in accordance with the NYSE listing standards and ourGovernance Principles, then the independent directors on our Board will separately meet at least one time each year. Our Governance Principles provide that theNon-Executive Chairman of the Board, currently Mr. Riepe, will preside at the meetings of the non-management directors and the independent directors; in theabsence of Mr. Riepe, the non-management directors present will select an independent committee chair to preside at such session. The independent Non-ExecutiveChairman of the Board may periodically call meetings of the non-management and independent directors, including at the request of the non-management orindependent directors.
Item 1 4. Principal Accountant Fees and Services
INDEPENDENT REGISTERED PUBLIC ACCOUNTING FIRM
Upon the approval of the Audit Committee, Genworth retained KPMG LLP (“KPMG”) to audit our consolidated financial statements for 2016 and to attestto the effectiveness of the company’s internal control over financial reporting. In addition, Genworth retained KPMG, as well as other accounting firms, to provideother auditing and advisory services in 2016.
We understand the need for KPMG to maintain objectivity and independence in its audit of our consolidated financial statements. As required by the AuditCommittee’s charter and applicable SEC and PCAOB rules and regulations, the Audit Committee pre-approves all audit, audit-related, tax and other permitted non-audit services performed by KPMG, including the amount of fees payable for such services, to ensure that the provision of such services does not impair KPMG’sindependence. The Audit Committee may not delegate this responsibility to management. Certain audit and audit-related services and fees are pre-approved by theAudit Committee on an annual basis in connection with the engagement of KPMG as the company’s independent registered public accounting firm for the fiscalyear. Other audit, audit-related and permitted non-audit services have been pre-approved by the Audit Committee pursuant to our Audit Committee’s Key Practicesand are subject to fee caps. Any other audit, audit-related and permitted non-audit services and all tax services must be specifically pre-approved by the AuditCommittee.
The aggregate fees billed by KPMG in 2016 and 2015 for professional services rendered were:
Type of Fees 2016 2015 (in millions) Audit Fees (1) $ 7.8 $ 8.4 Audit-Related Fees (2) 2.0 2.1 Tax Fees (3) — 0.2 All Other Fees (4) 0.1 0.1
Total $ 9.9 $10.8
(1) Fees for services to perform an audit or review in accordance with either the standards of the PCAOB or generally accepted auditing standards and services
that generally only Genworth’s independent registered public accounting firm can reasonably provide, such as the audit of Genworth’s consolidated financialstatements included in public offerings or filings, the review of the financial statements included in our Quarterly Reports on Form 10-Q, and for servicesthat are normally provided by accountants in connection with statutory and regulatory filings or engagements.
(2) Fees for assurance and related services that are traditionally performed by Genworth’s independent registered public accounting firm, such as audit andrelated services for employee benefit plan audits,
55

Table of Contents
internal control reviews, document production requests, attest services not required by statute or regulation, and consultation concerning financial accountingand reporting standards.
(3) Fees for tax compliance, consultation and planning services. Tax compliance generally involves preparation of original and amended tax returns, claims forrefunds, tax payment planning services and assistance with tax audits and filing appeals and totaled $32,978 for 2016 and $116,516 for 2015. Taxconsultation and tax planning encompass a diverse range of services, including assistance in connection with tax advice related to mergers and acquisitions,employee benefit plans and requests for rulings or technical advice from taxing authorities and totaled $0 for 2016 and $42,739 for 2015.
(4) Fees not considered audit or audit-related, such as the actuarial services, workpaper access for strategic due diligence, and advice and assistance for thedissolution of entities.
56

Table of Contents
Part IV Item 15. Exhibit
31.3 Certification Pursuant to Section 302 of the Sarbanes-Oxley Act of 2002—Thomas J. McInerney 31.4 Certification Pursuant to Section 302 of the Sarbanes-Oxley Act of 2002—Kelly L. Groh
57

Table of Contents
SIGNATURES
Pursuant to the requirements of Section 13 or 15(d) of the Securities Exchange Act of 1934, the Registrant has duly caused this report to be signed on itsbehalf by the undersigned, thereunto duly authorized.
Genworth Financial, Inc.
By: /s/ Thomas J. McInerney
Thomas J. McInerneyPresident and Chief Executive Officer
Date: April 3, 2017
58

Exhibit 31.3
CERTIFICATIONS
I, Thomas J. McInerney, certify that:
1. I have reviewed this Amendment No. 1 on Form 10-K/A to the annual report on Form 10-K of Genworth Financial, Inc.; and
2. Based on my knowledge, this report does not contain any untrue statement of a material fact or omit to state a material fact necessary to make thestatements made, in light of the circumstances under which such statements were made, not misleading with respect to the period covered by this report.
Dated: April 3, 2017
By: /s/ Thomas J. McInerney
Thomas J. McInerneyPresident and Chief Executive Officer
(Principal Executive Officer)

Exhibit 31.4
CERTIFICATIONS
I, Kelly L. Groh, certify that:
1. I have reviewed this Amendment No. 1 on Form 10-K/A to the annual report on Form 10-K of Genworth Financial, Inc.; and
2. Based on my knowledge, this report does not contain any untrue statement of a material fact or omit to state a material fact necessary to make thestatements made, in light of the circumstances under which such statements were made, not misleading with respect to the period covered by this report.
Dated: April 3, 2017
Genworth Financial, Inc.
By: /s/ Kelly L. Groh
Kelly L. GrohExecutive Vice President and Chief Financial Officer
(Principal Financial Officer)


![Index [d18rn0p25nwr6d.cloudfront.net]d18rn0p25nwr6d.cloudfront.net/CIK-0001389207/c7dbe8c4-bd...Corporate Taxpayer’s ID (CNPJ/MF) No. 01.545.826/0001-07 Corporate Registry (NIRE)](https://static.fdocuments.us/doc/165x107/5ed43574a9596d397405e1bb/index-corporate-taxpayeras-id-cnpjmf-no-015458260001-07-corporate.jpg)
