Q3 2015 Earnings ReleaseTitle Q3 2015 Earnings Release Created Date 20151122033
GENPACT
Q3 2016 EARNINGS PRESENTATION
November 2, 2016Ticker (NYSE: G)
2© 2016 Copyright Genpact. All Rights Reserved.
Forward-looking StatementsThese materials contain certain statements concerning our future growth prospects and forward-looking statements, as definedin the safe harbor provisions of the U.S. Private Securities Litigation Reform Act of 1995. These statements involve a number ofrisks, uncertainties and other factors that could cause actual results to differ materially from those in such forward-lookingstatements. These risks, uncertainties and other factors include but are not limited to a slowdown in the economies and sectorsin which our clients operate, a slowdown in the business process outsourcing and information technology services sectors, therisks and uncertainties arising from our past and future acquisitions, our ability to convert bookings to revenues, our ability tomanage growth, factors which may impact our cost advantage, wage increases, changes in tax rates and tax legislation, ourability to attract and retain skilled professionals, risks and uncertainties regarding fluctuations in our earnings, foreign currencyfluctuations, general economic conditions affecting our industry as well as other risks detailed in our reports filed with the U.S.Securities and Exchange Commission, including Genpact’s Annual Report on Form 10-K. These filings are available atwww.sec.gov or on the Investor Relations section of our website, www.genpact.com. Genpact may from time to time makeadditional written and oral forward-looking statements, including statements contained in our filings with the Securities andExchange Commission and our reports to shareholders. Although Genpact believes that these forward-looking statements arebased on reasonable assumptions, you are cautioned not to put undue reliance on these forward-looking statements, whichreflect management’s current analysis of future events and should not be relied upon as representing management’sexpectations or beliefs as of any date subsequent to the time they are made. Genpact undertakes no obligation to update anyforward-looking statements that may be made from time to time by or on behalf of Genpact.
Non-GAAP Financial MeasuresThese materials also include measures defined by the SEC as non-GAAP financial measures. Genpact believes that these non-GAAP measures can provide useful supplemental information to investors regarding financial and business trends relating to itsfinancial condition and results of operations when read in conjunction with the Company’s reported results. Reconciliations ofthese non-GAAP measures from GAAP are available in this presentation and in our earnings release dated November 2, 2016.
3© 2016 Copyright Genpact. All Rights Reserved.
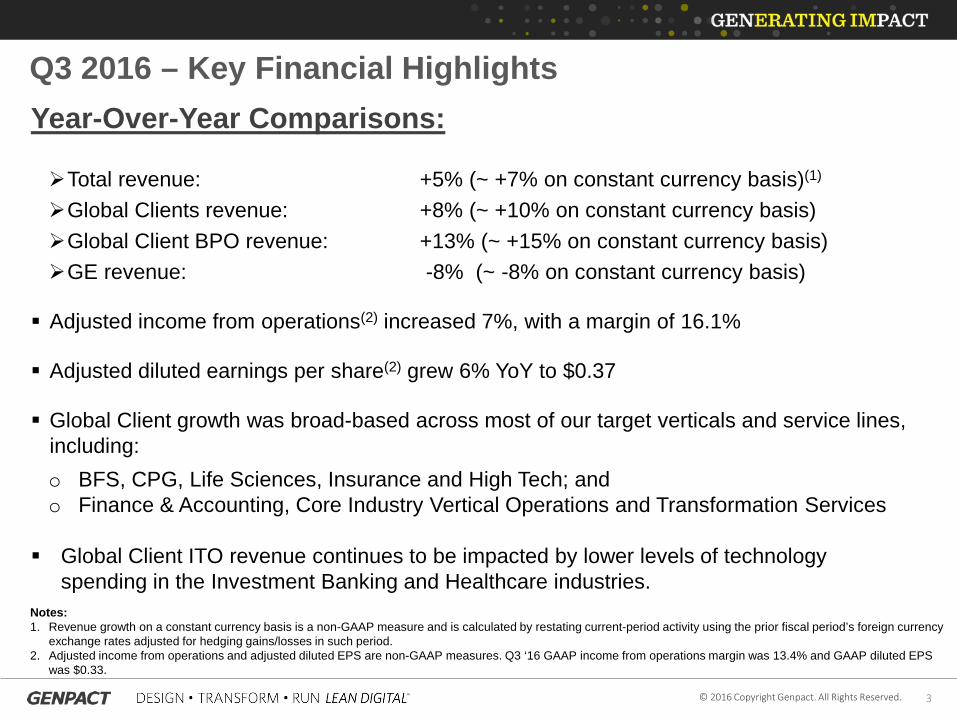
Q3 2016 – Key Financial HighlightsYear-Over-Year Comparisons:
Total revenue: +5% (~ +7% on constant currency basis)(1)
Global Clients revenue: +8% (~ +10% on constant currency basis)Global Client BPO revenue: +13% (~ +15% on constant currency basis)GE revenue: -8% (~ -8% on constant currency basis)
Adjusted income from operations(2) increased 7%, with a margin of 16.1%
Adjusted diluted earnings per share(2) grew 6% YoY to $0.37
Global Client growth was broad-based across most of our target verticals and service lines, including:o BFS, CPG, Life Sciences, Insurance and High Tech; ando Finance & Accounting, Core Industry Vertical Operations and Transformation Services
Global Client ITO revenue continues to be impacted by lower levels of technology spending in the Investment Banking and Healthcare industries.
Notes:1. Revenue growth on a constant currency basis is a non-GAAP measure and is calculated by restating current-period activity using the prior fiscal period’s foreign currency
exchange rates adjusted for hedging gains/losses in such period. 2. Adjusted income from operations and adjusted diluted EPS are non-GAAP measures. Q3 ‘16 GAAP income from operations margin was 13.4% and GAAP diluted EPS
was $0.33.
4© 2016 Copyright Genpact. All Rights Reserved.
Healthy Pipeline and Continued Momentum for Lean DigitalSM
Our pipeline continues to grow across most of our targeted industry verticals, service lines and geographies
Lean DigitalSM is helping clients’ operations transform to more agile and nimble business models
M&A in chosen areas remains a priority to add digital and analytics capabilities
5© 2016 Copyright Genpact. All Rights Reserved.
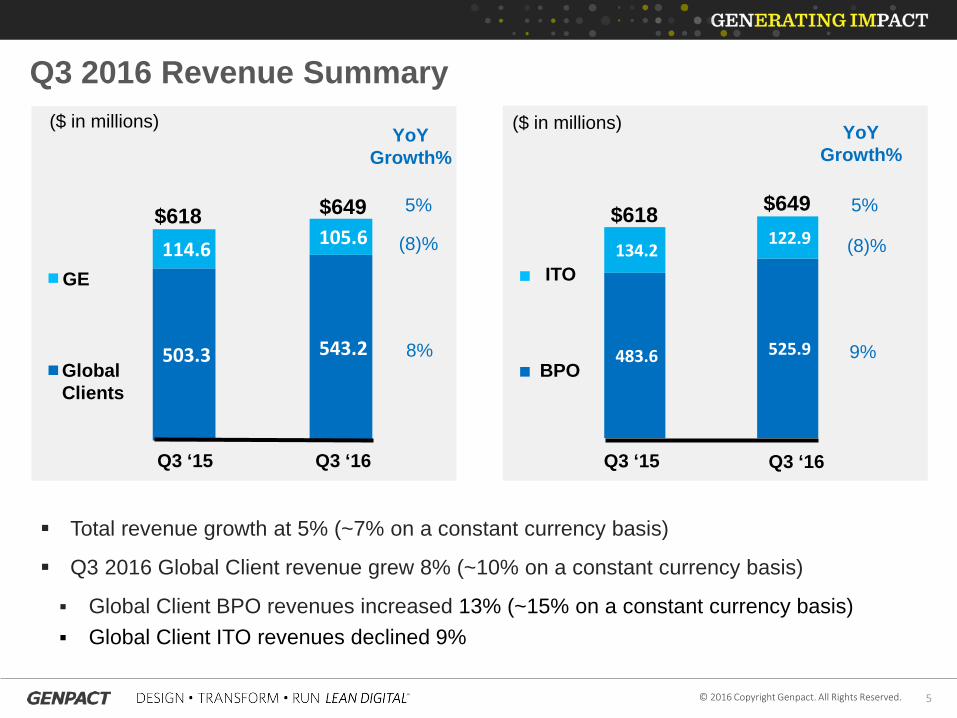
483.6 525.9
134.2 122.9
503.3 543.2
114.6 105.6
Total revenue growth at 5% (~7% on a constant currency basis)
Q3 2016 Global Client revenue grew 8% (~10% on a constant currency basis)
Global Client BPO revenues increased 13% (~15% on a constant currency basis) Global Client ITO revenues declined 9%
Global Clients
GE
BPO
ITO
5%
YoY Growth%
8%
(8)%
5%
(8)%
9%
YoY Growth%
Q3 ‘15 Q3 ‘16 Q3 ‘15 Q3 ‘16
($ in millions) ($ in millions)
$618 $649$649$618
Q3 2016 Revenue Summary
6© 2016 Copyright Genpact. All Rights Reserved.
Num
ber o
f clie
nts
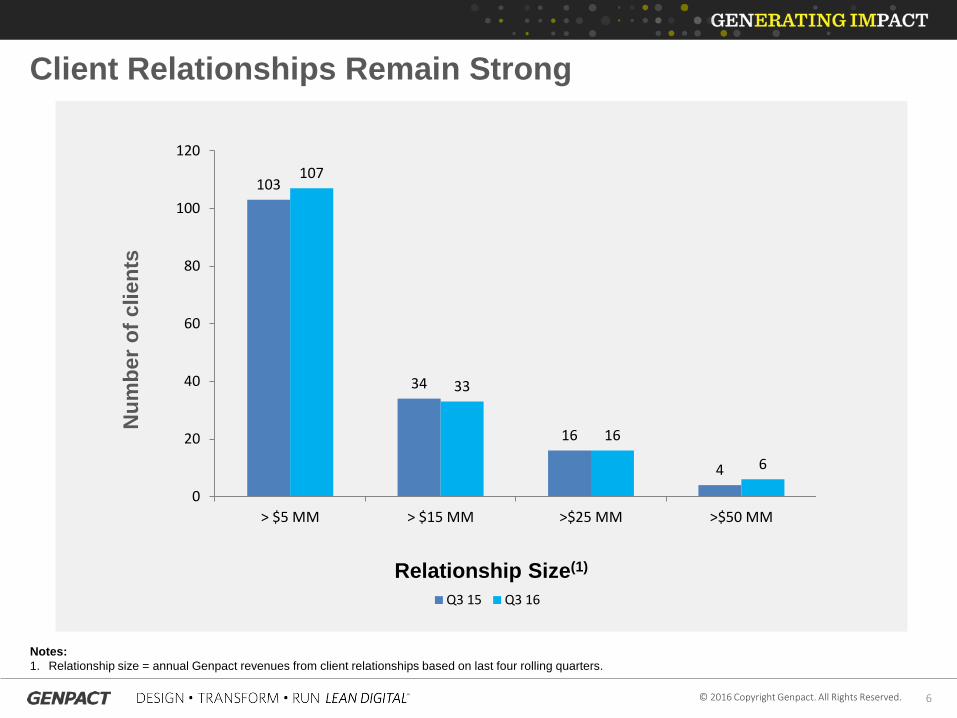
Notes:1. Relationship size = annual Genpact revenues from client relationships based on last four rolling quarters.
Relationship Size(1)
Client Relationships Remain Strong
103
34
16
4
107
33
16
6
0
20
40
60
80
100
120
> $5 MM > $15 MM >$25 MM >$50 MM
Q3 15 Q3 16
7© 2016 Copyright Genpact. All Rights Reserved.
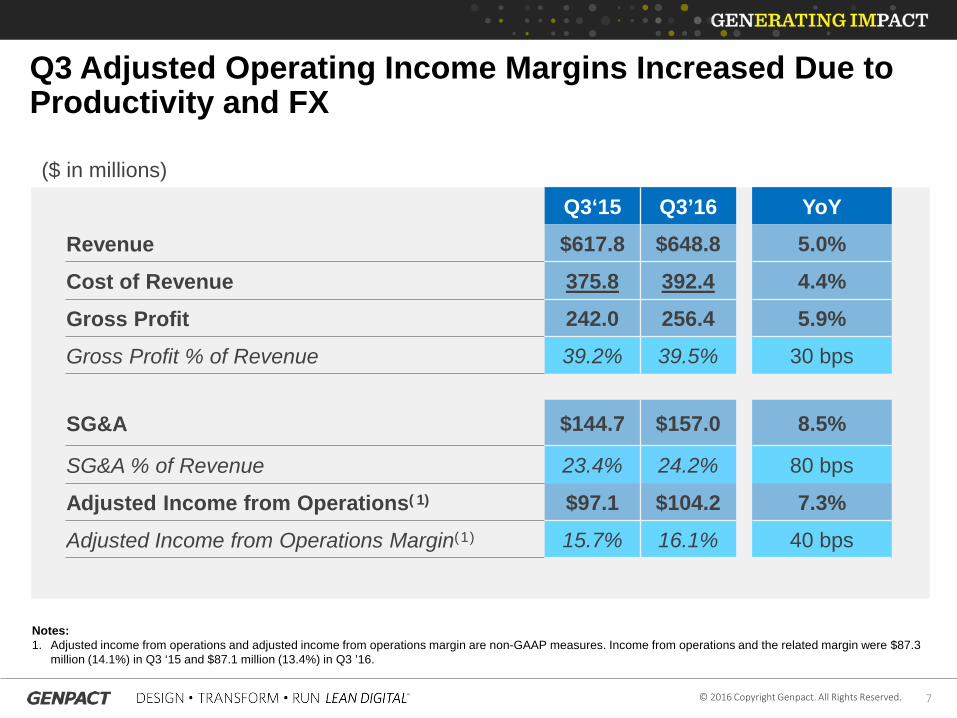
Q3‘15 Q3’16 YoY
Revenue $617.8 $648.8 5.0%
Cost of Revenue 375.8 392.4 4.4%
Gross Profit 242.0 256.4 5.9%
Gross Profit % of Revenue 39.2% 39.5% 30 bps
SG&A $144.7 $157.0 8.5%
SG&A % of Revenue 23.4% 24.2% 80 bps
Adjusted Income from Operations(1) $97.1 $104.2 7.3%
Adjusted Income from Operations Margin(1) 15.7% 16.1% 40 bps
($ in millions)
Notes:1. Adjusted income from operations and adjusted income from operations margin are non-GAAP measures. Income from operations and the related margin were $87.3
million (14.1%) in Q3 ‘15 and $87.1 million (13.4%) in Q3 ’16.
Q3 Adjusted Operating Income Margins Increased Due to Productivity and FX

8© 2016 Copyright Genpact. All Rights Reserved.
EPS Year-over-Year Bridge
Q3 ‘15 Q3 ‘16Adjusted Net Income ($ millions) (3) 76.9 78.2Diluted Shares Outstanding (millions)(4) 217.6 209.4
31
3
FX Re-measurement
loss in Q3’16 vs. gain in Q3’15
Q3 ‘15GAAP EPS
33
(Cents per share)
Net Adjustments(1)
35
4
Net Adjustments(1)
Q3 ‘15Adjusted
EPS
Q3 ‘16Adjusted EPS(3)
Q3 ‘16GAAP EPS
Higher Adjusted
Income from Operations(3)
4
Increase Decrease
Notes:1. Adjustments primarily include amortization and impairment of acquired intangible assets, acquisition-related expenses and stock-based compensation expenses.2. Net of shares issued, retired and dilution impact.3. Adjusted net income, adjusted income from operations and adjusted EPS are non-GAAP measures. 4. Weighted average number of diluted shares outstanding. This includes the impact of 6.3 million shares repurchased in Q3’ 2016.- The above bridge reflects only significant variance items year-over-year and is illustrative and subject to rounding.- EPS = Diluted earnings per share
37
Lower taxes
2
Lower share count(2)
1 1
Higher Net
Interest Expense
1
9© 2016 Copyright Genpact. All Rights Reserved.
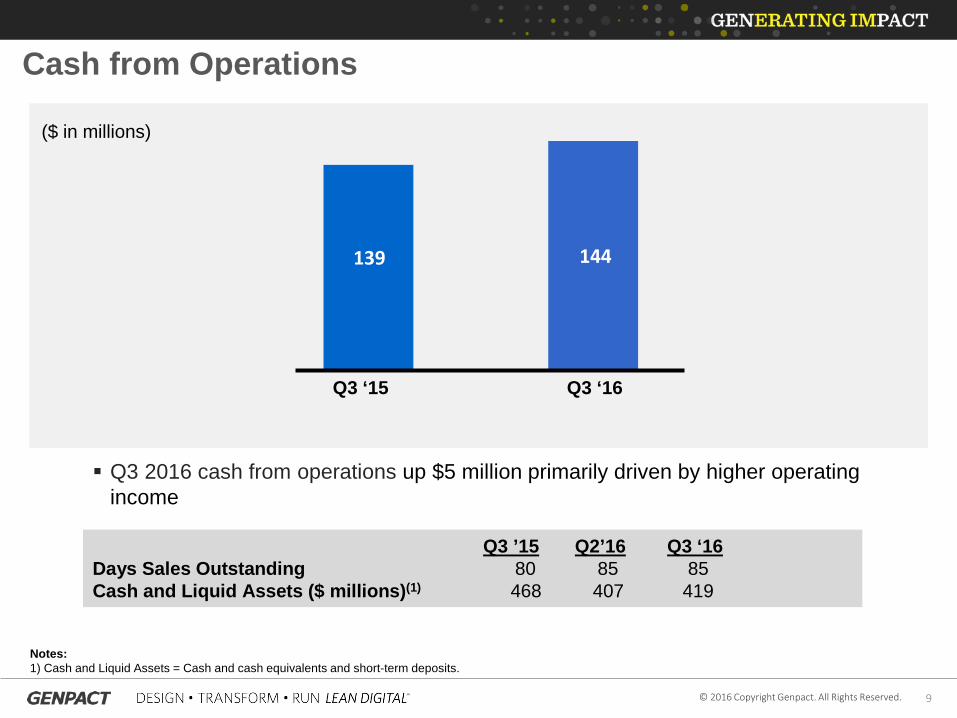
139 144
Q3 2016 cash from operations up $5 million primarily driven by higher operating income
Q3 ‘15 Q3 ‘16
Notes:1) Cash and Liquid Assets = Cash and cash equivalents and short-term deposits.
($ in millions)
Q3 ’15 Q2’16 Q3 ‘16Days Sales Outstanding 80 85 85Cash and Liquid Assets ($ millions)(1) 468 407 419
Cash from Operations
10© 2016 Copyright Genpact. All Rights Reserved.
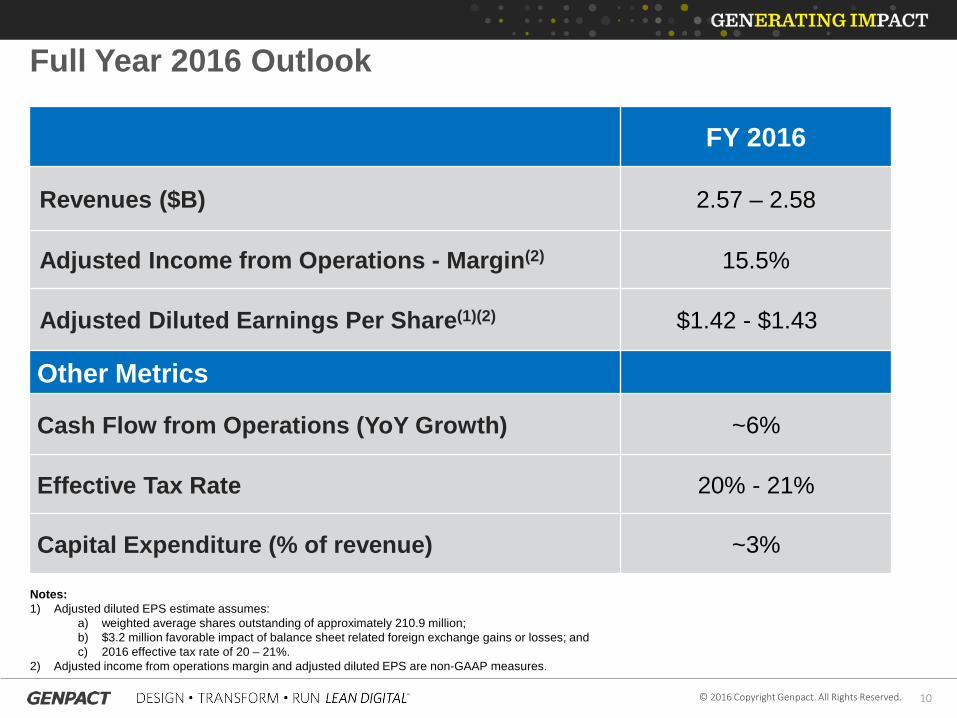
FY 2016
Revenues ($B) 2.57 – 2.58
Adjusted Income from Operations - Margin(2) 15.5%
Adjusted Diluted Earnings Per Share(1)(2) $1.42 - $1.43
Other Metrics
Cash Flow from Operations (YoY Growth) ~6%
Effective Tax Rate 20% - 21%
Capital Expenditure (% of revenue) ~3%
Full Year 2016 Outlook
Notes:1) Adjusted diluted EPS estimate assumes:
a) weighted average shares outstanding of approximately 210.9 million; b) $3.2 million favorable impact of balance sheet related foreign exchange gains or losses; andc) 2016 effective tax rate of 20 – 21%.
2) Adjusted income from operations margin and adjusted diluted EPS are non-GAAP measures.
11© 2016 Copyright Genpact. All Rights Reserved.
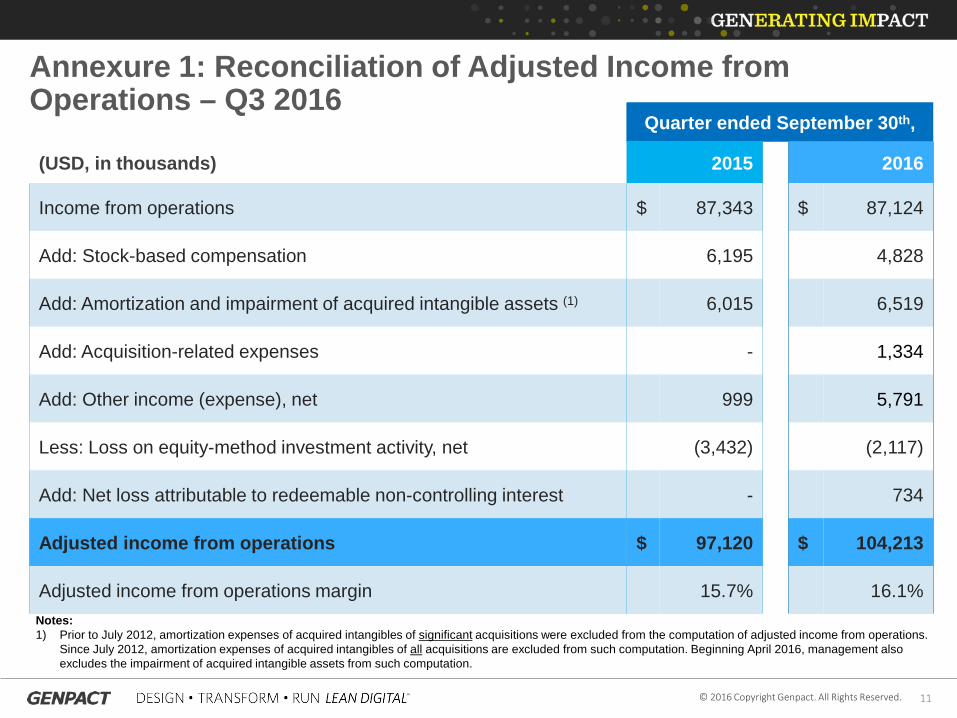
Annexure 1: Reconciliation of Adjusted Income from Operations – Q3 2016
Quarter ended September 30th,
(USD, in thousands) 2015 2016
Income from operations $ 87,343 $ 87,124
Add: Stock-based compensation 6,195 4,828
Add: Amortization and impairment of acquired intangible assets (1) 6,015 6,519
Add: Acquisition-related expenses - 1,334
Add: Other income (expense), net 999 5,791
Less: Loss on equity-method investment activity, net (3,432) (2,117)
Add: Net loss attributable to redeemable non-controlling interest - 734
Adjusted income from operations $ 97,120 $ 104,213
Adjusted income from operations margin 15.7% 16.1%Notes:1) Prior to July 2012, amortization expenses of acquired intangibles of significant acquisitions were excluded from the computation of adjusted income from operations.
Since July 2012, amortization expenses of acquired intangibles of all acquisitions are excluded from such computation. Beginning April 2016, management also excludes the impairment of acquired intangible assets from such computation.
12© 2016 Copyright Genpact. All Rights Reserved.
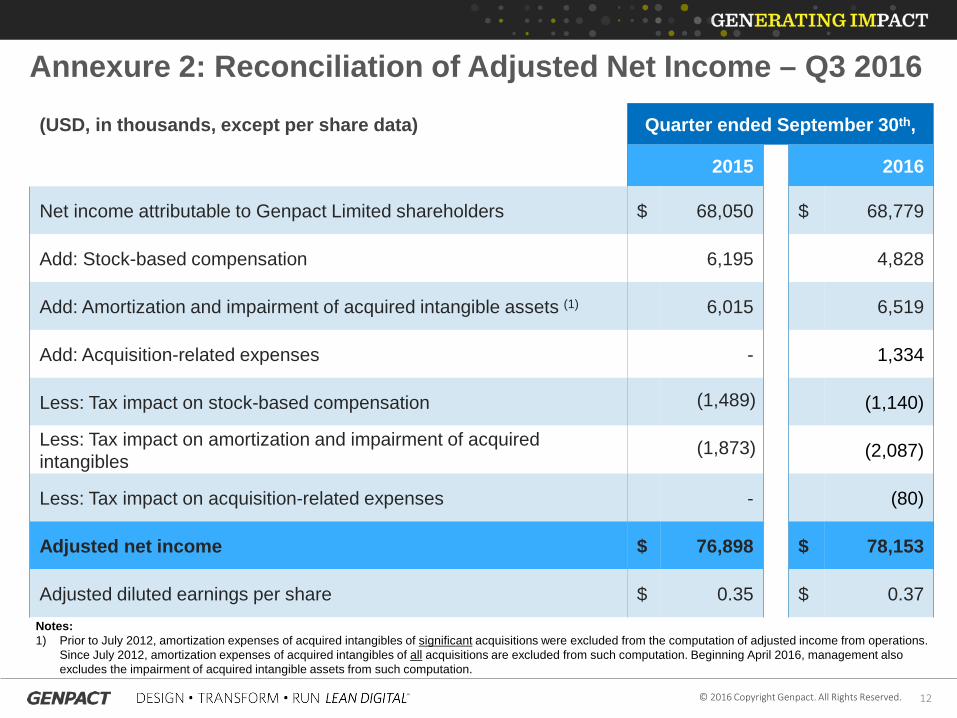
Annexure 2: Reconciliation of Adjusted Net Income – Q3 2016
(USD, in thousands, except per share data) Quarter ended September 30th,
2015 2016
Net income attributable to Genpact Limited shareholders $ 68,050 $ 68,779
Add: Stock-based compensation 6,195 4,828
Add: Amortization and impairment of acquired intangible assets (1) 6,015 6,519
Add: Acquisition-related expenses - 1,334
Less: Tax impact on stock-based compensation (1,489) (1,140)
Less: Tax impact on amortization and impairment of acquired intangibles
(1,873) (2,087)
Less: Tax impact on acquisition-related expenses - (80)
Adjusted net income $ 76,898 $ 78,153
Adjusted diluted earnings per share $ 0.35 $ 0.37Notes:1) Prior to July 2012, amortization expenses of acquired intangibles of significant acquisitions were excluded from the computation of adjusted income from operations.
Since July 2012, amortization expenses of acquired intangibles of all acquisitions are excluded from such computation. Beginning April 2016, management also excludes the impairment of acquired intangible assets from such computation.
13© 2016 Copyright Genpact. All Rights Reserved.
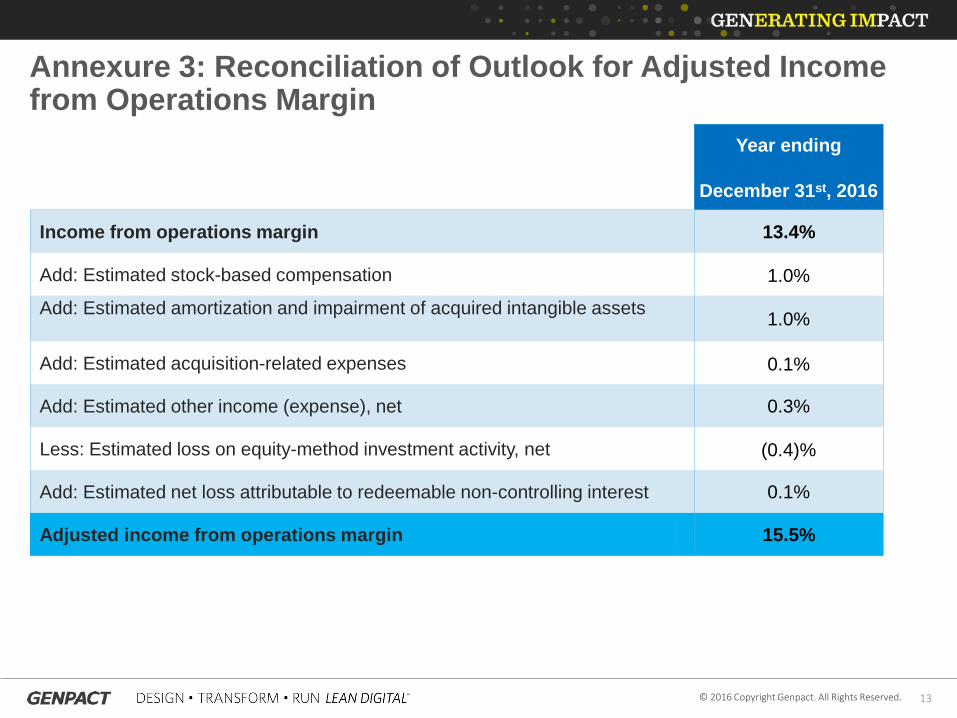
Annexure 3: Reconciliation of Outlook for Adjusted Income from Operations Margin
Year ending
December 31st, 2016
Income from operations margin 13.4%
Add: Estimated stock-based compensation 1.0%
Add: Estimated amortization and impairment of acquired intangible assets 1.0%
Add: Estimated acquisition-related expenses 0.1%
Add: Estimated other income (expense), net 0.3%
Less: Estimated loss on equity-method investment activity, net (0.4)%
Add: Estimated net loss attributable to redeemable non-controlling interest 0.1%
Adjusted income from operations margin 15.5%
14© 2016 Copyright Genpact. All Rights Reserved.
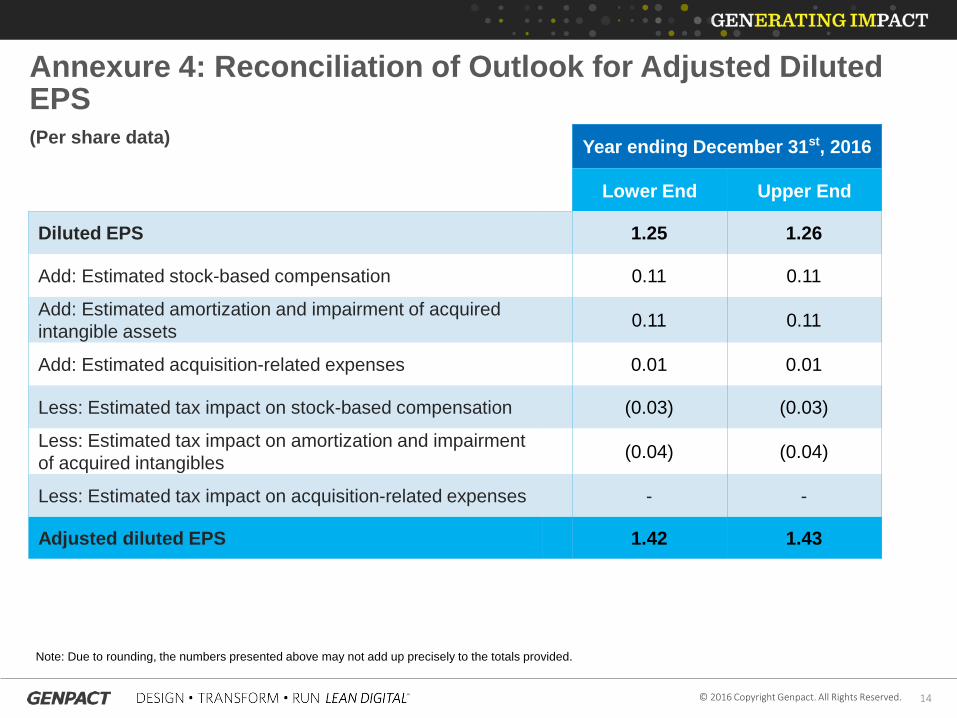
Annexure 4: Reconciliation of Outlook for Adjusted Diluted EPS(Per share data) Year ending December 31st, 2016
Lower End Upper End
Diluted EPS 1.25 1.26
Add: Estimated stock-based compensation 0.11 0.11
Add: Estimated amortization and impairment of acquired intangible assets 0.11 0.11
Add: Estimated acquisition-related expenses 0.01 0.01
Less: Estimated tax impact on stock-based compensation (0.03) (0.03)
Less: Estimated tax impact on amortization and impairmentof acquired intangibles (0.04) (0.04)
Less: Estimated tax impact on acquisition-related expenses - -
Adjusted diluted EPS 1.42 1.43
Note: Due to rounding, the numbers presented above may not add up precisely to the totals provided.
THANK YOU