Genotyping of Saccharomyces cerevisiae strains by ...
28
1 Genotyping of Saccharomyces cerevisiae strains by interdelta sequence typing 1 using automated microfluidics 2 Ricardo Franco-Duarte 1 , Inês Mendes 1 Ana Catarina Gomes 2 , Manuel A.S. Santos 2,3 , 3 Bruno de Sousa 4 , Dorit Schuller 1 4 5 1 CBMA (Centre of Molecular and Environmental Biology) / Department of Biology / 6 University of Minho, Braga, Portugal 7 2 BIOCANT - Biotechnology Innovation Center, Cantanhede, Portugal 8 3 RNA Biology Laboratory, CESAM, Biology Department, Aveiro University, Campus 9 Universitário de Santiago, Aveiro 10 4 Centre for Malaria & Tropical Diseases Associated Laboratory, Instituto de Higiene e 11 Medicina Tropical, Universidade Nova de Lisboa, Portugal. 12 13 *For correspondence: 14 Dorit Schuller 15 e-mail: [email protected] 16 Tel.: (+351) 253 604 310/17 17 Fax: (+351) 253 678 980 18 19 Abbreviations: mtDNA - mitochondrial DNA; MLST - multi locus sequence typing 20 21 Keywords: capillary electrophoresis, interdelta sequences, non-parametric methods, 22 Saccharomyces cerevisiae 23 24 Number of words: 5764 25
Transcript of Genotyping of Saccharomyces cerevisiae strains by ...
1
Genotyping of Saccharomyces cerevisiae strains by interdelta sequence typing 1
using automated microfluidics 2
Ricardo Franco-Duarte1, Inês Mendes
1 Ana Catarina Gomes
2, Manuel A.S. Santos
2,3, 3
Bruno de Sousa4, Dorit Schuller
1 4
5
1 CBMA (Centre of Molecular and Environmental Biology) / Department of Biology / 6
University of Minho, Braga, Portugal 7
2 BIOCANT - Biotechnology Innovation Center, Cantanhede, Portugal 8
3 RNA Biology Laboratory, CESAM, Biology Department, Aveiro University, Campus 9
Universitário de Santiago, Aveiro 10
4 Centre for Malaria & Tropical Diseases Associated Laboratory, Instituto de Higiene e 11
Medicina Tropical, Universidade Nova de Lisboa, Portugal. 12
13
*For correspondence: 14
Dorit Schuller 15
e-mail: [email protected] 16
Tel.: (+351) 253 604 310/17 17
Fax: (+351) 253 678 980 18
19
Abbreviations: mtDNA - mitochondrial DNA; MLST - multi locus sequence typing 20
21
Keywords: capillary electrophoresis, interdelta sequences, non-parametric methods, 22
Saccharomyces cerevisiae 23
24
Number of words: 576425
2
Abstract 26
Amplification of genomic sequences flanked by delta elements of retrotransposons TY1 27
and TY2 is a reliable method for characterization of Saccharomyces cerevisiae strains. 28
The aim of this study is to evaluate the usefulness of microfluidic electrophoresis 29
(Caliper LabChip®
) to assess the factors that affect interlaboratory reproducibility of 30
interdelta sequence typing for S. cerevisiae strain delimitation. We carried out 31
experiments in two laboratories, using varying combinations of Taq DNA polymerases 32
and thermal cyclers. The reproducibility of the technique is evaluated using non-33
parametric statistical tests and we show that the source of Taq DNA polymerase and 34
technical differences between laboratories have the highest impact on reproducibility, 35
whereas thermal cyclers have little impact. We also show that the comparative analysis 36
of interdelta patterns is more reliable when fragment sizes are compared, than when 37
absolute and relative DNA concentrations of each band are considered. Interdelta 38
analysis based on a smaller fraction of bands with intermediate sizes between 100 and 39
1000 bp yield the highest reproducibility. 40
3
Introduction 41
Biotechnological processes conducted by Saccharomyces cerevisiae strains are gaining 42
increasing importance. Tracking inoculated strains throughout productive processing is 43
necessary for quality assurance in fermentative processes such as bioethanol production 44
or wine fermentation. Besides, yeast has been identified as an emerging human 45
pathogen capable of causing clinically relevant infections in immune compromised 46
patients [1, 2]. Therefore, quick and accurate methods for yeast strains delimitation that 47
rely on high-throughput genotyping methods based on microfluidics systems can be of 48
interest in both industrial and clinical contexts. 49
Numerous molecular methods have been developed for yeast strain characterization, 50
such as chromosome separation by pulsed field electrophoresis [3, 4], restriction 51
fragment length polymorphism analysis of mitochondrial DNA (mtDNA RFLP) [5-8], 52
random amplified polymorphic DNA (RAPD) [9], PCR fingerprinting followed by 53
enzymatic restriction of amplified DNA [10], multi locus sequence typing (MLST) [11], 54
microsatellite analysis [12-14], real-time PCR [15, 16] and PCR-amplification of inter-55
delta sequences [17, 18]. Delta sequences are flanking sequences (300 bp) of 56
retrotransposons TY1 and TY2 that are dispersed throughout the genome (particularly 57
in terminal chromosomal regions), but can also be found as single elements. About 300 58
delta elements were described in the genome of the laboratory strain S288c. Since the 59
number and location of delta elements have a certain intraspecific variability they are 60
appropriate genetic markers for the identification of polymorphisms. Amplification of 61
interdelta regions between neighbouring delta sequences results in a mixture of 62
differently sized strain-specific fragments. This PCR-based method is easy to perform, 63
cheap and rapid, and therefore suitable for the characterization of high number of 64
strains. 65
4
More recently, the interdelta method was improved by the use of alternative primers 66
(δ12 and δ21) [17] that bind close to the initially described binding sites for primers δ1 67
and δ2 [18]. The combined use of these improved primer combinations (δ12 / δ21 or 68
δ12 / δ2) revealed greater banding pattern polymorphism and improved discriminatory 69
power [13]. The use of primer pairs δ12 / δ2 showed the same discriminatory power of 70
other methods for strain delimitation, such as mtDNA RFLP, microsatellite analysis and 71
karyotyping [19]. However, this method requires careful standardization of DNA 72
concentration [20]. Occasional non-reproducible “ghost bands” are present due to the 73
low annealing temperature (43 ºC), which is a disadvantage of the interdelta method. 74
Increasing the annealing temperature to 55 ºC reduced ghost bands, but lead to poorer 75
banding pattern and consequently reduced discriminatory power [21]. In summary, PCR 76
profiling analysis of delta sequences is associated with good discriminatory power for 77
the analysis of commercial strains [22], but the use of this typing method for routine 78
analysis of yeast strains requires careful evaluation [21, 23-26]. It is therefore advisable 79
to use additional methods such as mtDNA RFLP or microsatellite analysis to confirm 80
ambiguous results. 81
Fluorescent primers and automated DNA sequencers improve significantly banding 82
patterns containing weakly amplified fragments [27], decreasing experimental error and 83
increasing data throughput, scoring and reliability [28]. When interdelta sequences are 84
amplified with fluorescent primers, followed by capillary electrophoresis, the resolution 85
of the obtained profiles is considerably increased in comparison with standard agarose 86
gel electrophoresis [29]. 87
The efficiency of PCR amplification is affected by numerous factors namely annealing 88
temperature, the concentration of MgCl2, primers and template DNA. Even slight 89
variations in these parameters may affect results compromising data comparisons and 90
5
sharing between experiments and laboratories [30]. The optimal reaction conditions 91
need to be optimized for each PCR application. 92
Microfluidics are gaining notoriety across broads research fields, e.g., forensics, clinical 93
and genetic analysis [31-33]. Miniaturized reactions economize DNA samples, reagents 94
and analytical time considerably, and increase sensitivity, throughput and automation 95
possibilities [34, 35]. In the microfluidic chips for DNA analysis of the Caliper´s 96
LabChip®
system, DNA samples are electroosmotically transported and fragmented 97
inside the chip, separated by capillary electrophoresis and finally analyzed using 98
fluorescence detection [36]. 99
Genome-wide studies of yeast inter-strain variability require bio-databanks for 100
biodiversity conservation, sustainable development of genetic resources and equitable 101
sharing of genotypic data among laboratories. We consider interdelta sequences 102
amplification as a very useful method for high-throughput characterization of S. 103
cerevisiae strains, which is easy to perform, cheap and rapid in comparison to other 104
molecular methods. The aim of this study is to evaluate the impact of two different Taq 105
polymerases on the interlaboratory reproducibility of interdelta sequence typing for 106
yeast strain delimitation using microfluidics electrophoresis (Caliper´s LabChip®). 107
Besides, we also evaluate the impact of different thermal cyclers on the patterns 108
obtained. The study demonstrates that the reproducibility of the technique is most 109
affected by the source of Taq DNA polymerase and technical differences between 110
laboratories such as different operators. Interlaboratory reproducibility is highest when 111
fragment sizes between 100 and 1000 bp are compared, rather than absolute and relative 112
DNA concentrations of each band. 113
114
6
Materials and methods 115
Yeast strains and culture 116
Saccharomyces cerevisiae strains used in this work were collected in the Vinho Verde 117
wine region (northwest Portugal) during three consecutive vintages (2001-2003). From 118
a collection of 300 isolates, the 12 strains with highest genetic heterogeneity, according 119
to their allelic microsatellite combinations for loci ScAAT1-ScAAT6 [37], were 120
selected using neuronal networks [38]. Strains were named as follows: R8, R16, R20, 121
R21, R30, R58, R60, R61, R62, R81, R88 and R101. 122
123
Interdelta sequences amplification and analysis 124
Yeast cells were cultivated (36 h, 28 ºC, 160 rpm) in 1 mL of YPD medium (yeast 125
extract 1% w/v, peptone 1% w/v, glucose 2% w/v) and the DNA isolation was 126
performed as previously described [6]. Briefly, cells were suspended in a sorbitol 127
containing buffer in the presence of lyticase for cell wall degradation. Cells were then 128
lysed by SDS addition, followed by DNA purification with sodium acetate and 129
isopropanol to eliminate proteins, polysaccharides, RNA or other cell constituents. 130
Subsequently, DNA was precipitated with ethanol, resuspended in TE and quantified 131
(Nanodrop, Thermo Scientific). DNA amplification was performed recurring to primers 132
δ12 (5’-TCAACAATGGAATCCCAAC - 3’) and δ2 (5’- GTGGATTTTTATTCCAAC 133
- 3’) [17]. Thirty μL of reaction mixture was prepared with 120 ng of DNA, Taq buffer 134
(10 mM Tris-HCl, 50 mM KCl, 0.08 % Nonidet P40), 50 pmoles of each primer, 0.4 135
mM of each dNTP, 3 mM MgCl2 (MBI Fermentas) and 1.0 U of Taq DNA polymerase. 136
After initial denaturation (95 ºC for 2 min), the reaction mixture was cycled 35 times 137
using the following settings: 95 ºC for 30 s, 43.2 ºC for 1 min, 72 ºC for 1 min, followed 138
by a final extension at 72 ºC during 10 min. Characteristic PCR profiles of the 12 strains 139
are shown in Figure 1. 140
7
An experimental strategy was devised to study the reproducibility of the interdelta 141
sequence amplification as a typing method for yeast strains using 96-well PCR plates 142
and the following combinations of Taq DNA polymerase, thermal cyclers and 143
laboratories: Plate 1 - commercial Taq (MBI Fermentas recombinant Taq, Ref. 144
EP0402), BioRad MyCycler thermal cycler, laboratory 1 (8 replicates per strain); Plate 145
2 - in-house cloned and produced Taq, BioRad MyCycler thermal cycler, laboratory 1 146
(8 replicates per strain); Plate 3 - in-house cloned and produced Taq, Eppendorff 147
Mastercycler thermal cycler, laboratory 1 (8 replicates per strain); Plate 4 - commercial 148
Taq (MBI Fermentas recombinant Taq Ref. EP0402) or in-house cloned and produced 149
Taq (4 replicates per strain), BioRad MyCycler thermal cycler, laboratory2. This 150
approach resulted in 32 replicates for each strain and a total of 384 electrophoretic 151
banding patterns. The four microplates thus included the following conditions to be 152
compared: A - Commercial Taq, BioRad thermal cycler, laboratory 1; B - In-house Taq, 153
BioRad thermal cycler, laboratory 1; C - In-house Taq, Eppendorff thermal cycler, 154
laboratory 1; D - Commercial Taq, BioRad thermal cycler, laboratory 2; E - In-house 155
Taq, BioRad thermal cycler, laboratory 2. Both laboratories used the same DNA 156
samples and the same in-house cloned and commercial Taq enzymes. Amplifications 157
were carried out with the same PCR buffer (MBI Fermentas, Ref. B33). PCR products 158
were analyzed using a high-throughput automated microfluidic electrophoresis system 159
(Caliper LabChip® 90 Electrophoresis System) and a 96-well plate format, according to 160
the manufacturer’s instructions. The tolerance of the sizing resolution for this system is 161
±15% (from 25 to 100 bp), ±10% (from 100 to 150 bp), ±5% (from 150 to 700 bp), 162
±10% (from 700 to 1000 bp). 163
164
Statistical analysis of electrophoretic data 165
8
The size (bp) and concentration (ng of DNA) of each band was determined using the 166
LabChip®
HT software (version 2.6) and exported to the software SPSS 18.0 package 167
for the composition of a matrix containing data for each band of the 32 replicates 168
banding patterns from each strain. Each band was analyzed and compared in terms of 169
fragment sizes (bp), absolute DNA concentration (ng/µl) and relative DNA 170
concentrations (%) (absolute concentration value was divided by the sum of all 171
concentration values of all bands contained in a replicate banding pattern). An 172
exploratory data analysis was performed, where normality distribution (Kolmogorov-173
Smirnov and Shapiro-Wilk tests) and variance homogeneity (Levene's test) were tested 174
using SPSS 18.0. After several unsuccessful transformations of the data, non-parametric 175
tests were performed, such as “Kruskall-Wallis one-way analysis of variance” test, to 176
check for the equality of treatment medians among the different groups. More precisely, 177
the null hypothesis (H0) assuming equality of all medians was tested against the 178
alternative hypothesis (H1), which assumes that at least two of the strains show 179
differences in their medians, as outlined below: 180
181
H0: θ1=θ2=⋯=θ12 vs H1: ∃(i,j):θi≠θj for some i≠j, (1) 182
where θi represents the median concentration (or percentage of concentration) for the ith
183
strain, i=1,…,12. 184
185
In cases where the test produced statistical significant differences between strains, 186
multiple pairwise comparisons were performed to trace the origin of such differences. 187
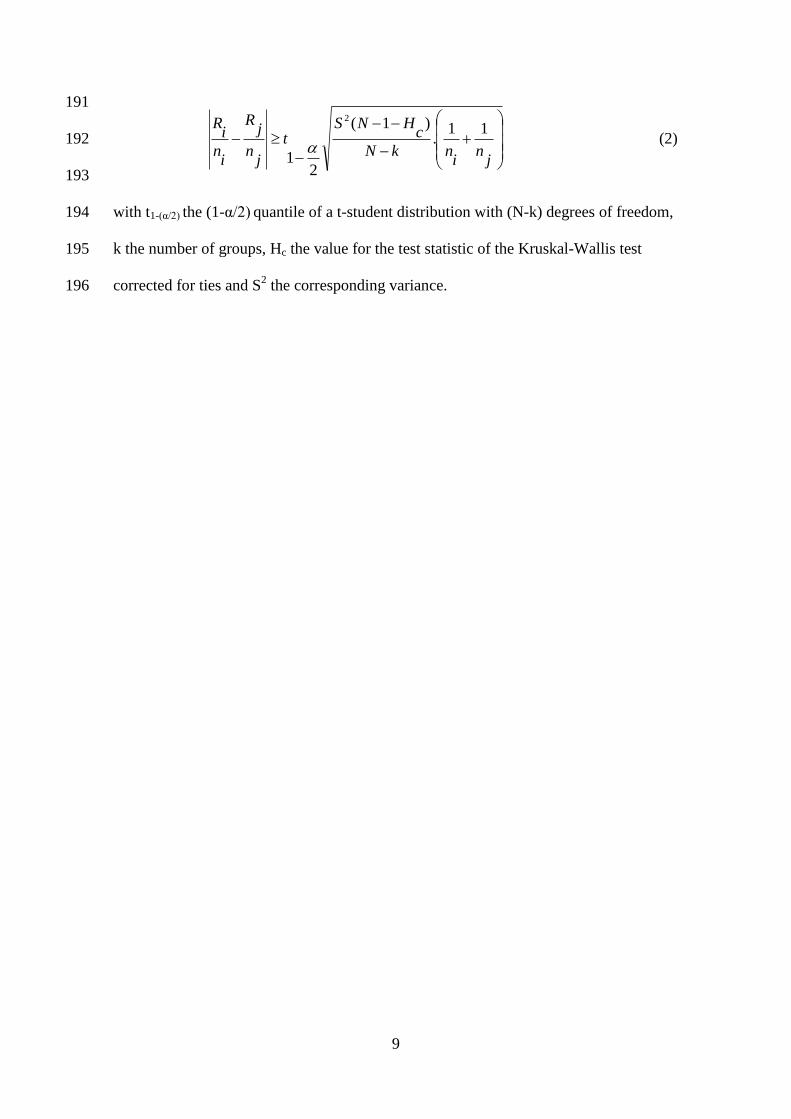
The method proposed by Conover and Iman [39] searches for comparative magnitudes 188
of the means based on the rank data, and assumes the t-student distribution. The test is 189
based on the following expression: 190
9
jn
inkN
cHNS
t
jn
jR
in
iR 11
.)1(
21
2
191
(2) 192
193
with t1-(α/2) the (1-α/2) quantile of a t-student distribution with (N-k) degrees of freedom, 194
k the number of groups, Hc the value for the test statistic of the Kruskal-Wallis test 195
corrected for ties and S2 the corresponding variance.196
10
Results 197
Electrophoretic profile of the Saccharomyces cerevisiae strains 198
Interdelta fragments of 12 genetically heterogeneous strains were amplified, using 199
primers δ12 and δ2 and were analyzed using automated microfluidics electrophoresis 200
(Caliper LabChip® 90 Electrophoresis System). In order to evaluate the inter-201
laboratorial reproducibility of the banding patterns and to determine which combination 202
of Taq DNA polymerase and thermal cycler produced the most reproducible banding 203
patterns between both laboratories, the experimental design included different 204
combinations of the mentioned factors, as described in the Materials and Methods 205
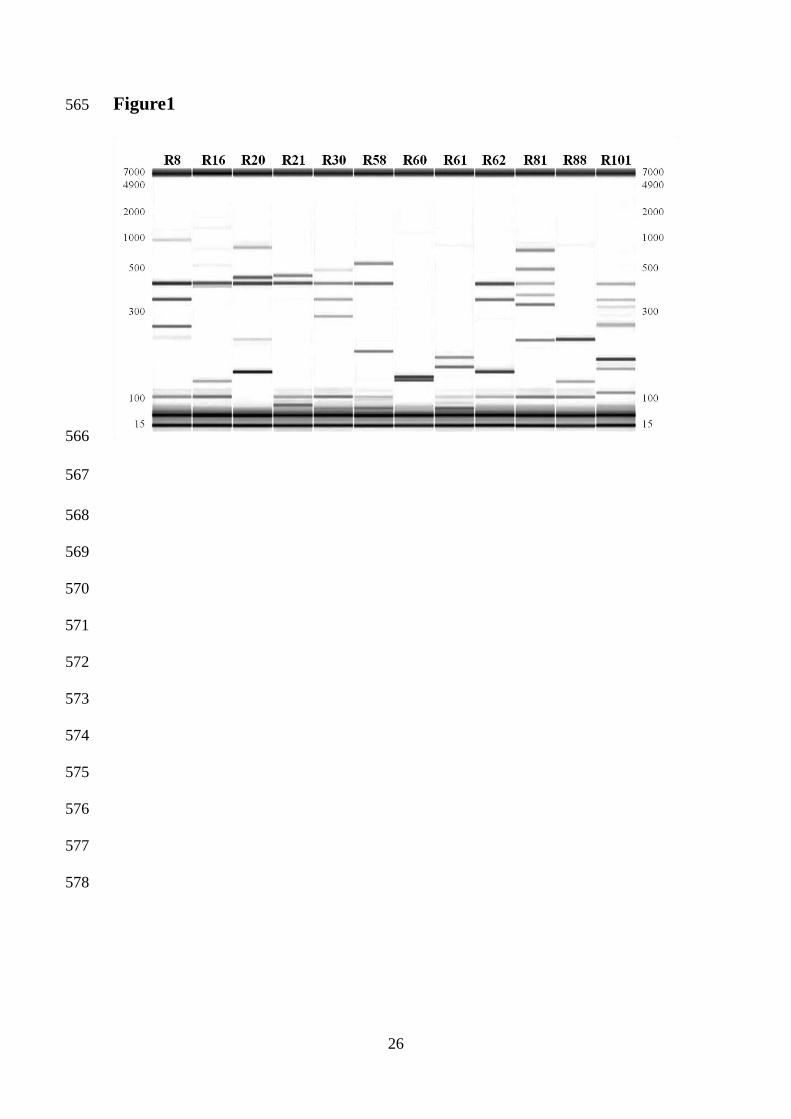
section. Unique banding patterns were obtained for each strain (Figure 1). The most 206
common band was present in 9 out of the 12 strains and had a size of approximately 400 207
bp. Quantitative and qualitative analysis of each band was performed using the software 208
package of the electrophoresis system, using the values of the co-injected internal 209
markers (gel bands at 15 and 7000 bp) as a reference. The analysis presented herein is 210
based on the length of the amplified fragments (bp), and the absolute and relative (%) 211
values of DNA concentration (ng/µL) of each band, as outlined in the Material and 212
Methods section. 213
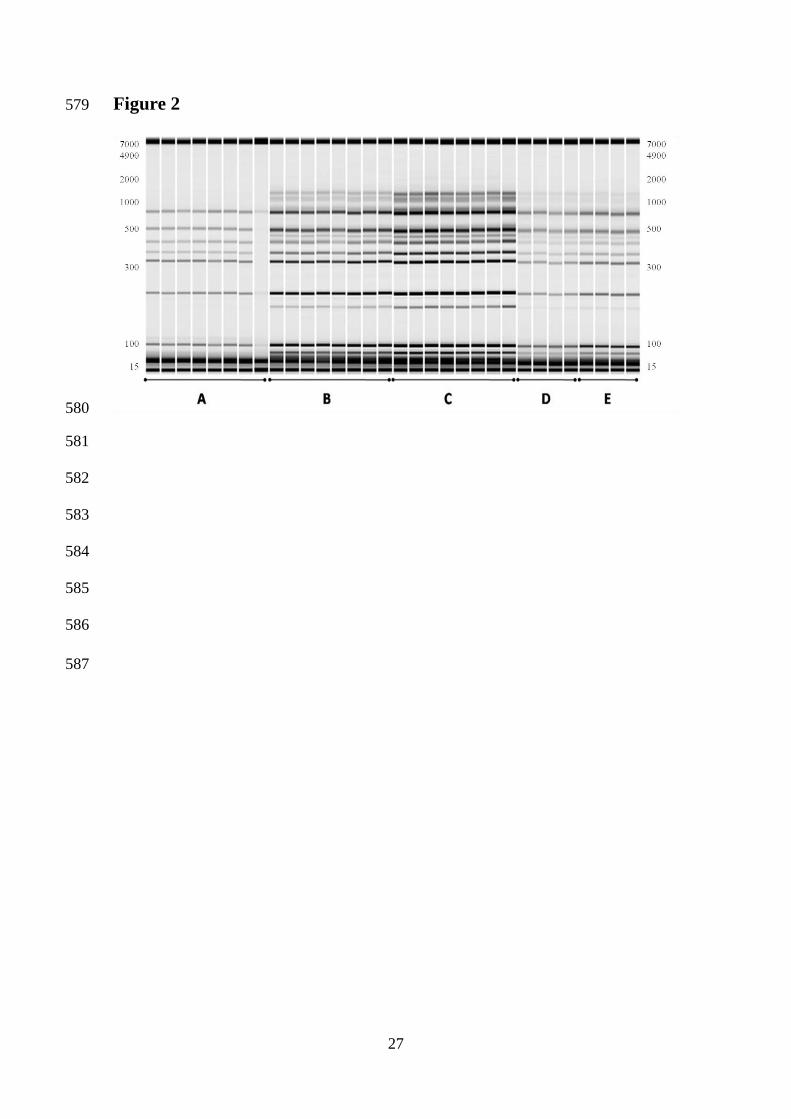
Figure 2 shows an example of 32 replicate banding patterns of a representative strain 214
tested under the conditions indicated in the first paragraph of Material and Methods 215
section. Fragment sizes showed high reproducibility between replicates of the same 216
condition and between conditions. Considerable differences were observed when, for 217
each experimental condition, DNA concentrations were compared. The most intense 218
banding patterns were obtained in laboratory 1, using in-house cloned and produced Taq 219
and the Eppendorff thermal cycler (condition C), followed by condition B and A. The 220
in-house produced Taq polymerase (C) amplified PCR products more efficiently than 221
11
commercial Taq (B). This agrees with the slightly stronger banding patterns of 222
condition E compared to condition D in laboratory 2. These trends were similar for the 223
other eleven strains (data not shown). One of eight replicates of condition A 224
(corresponding to the 8th
lane of Figure 2) failed amplification for most strains due to 225
lateral evaporation of the PCR reaction mixture during cycling in the 96-well plates. 226
These replicates were excluded from further analysis. 227
228
Reproducibility of PCR-based interdelta typing 229
Our main goal in this study was to identify statistically significant differences between 230
the banding patterns of yeast strains, generated under conditions A-E (see above), to 231
enhance reproducibility of interdelta sequence analysis between laboratories. In the first 232
step of the statistical analysis the data was verified for normality between the 12 strains 233
and the corresponding homogeneity of variances. Kolmogorov-Smirnov and Shapiro-234
Wilk tests were used to investigate the normality assumption. The results (data not 235
shown) revealed that our data did not follow a normal distribution since all p-values 236
were approximately zero (<0.001) and, therefore, smaller than any of the usual levels of 237
significance considered (1 %, 5 % and 10 %). Homogeneity of variances between 238
strains was tested using Levene's test. This condition was also not satisfied by the data 239
(data not shown), as p-values were approximately zero (<0.001) for both variables in the 240
study. In an attempt to satisfy both normality and homogeneity of variances, data were 241
transformed using logarithm of base 2 and inverse values of absolute or relative 242
concentrations. New variables were created in SPSS, both for absolute and relative 243
values. Once again, the normality and homogeneity of variance assumptions were 244
rejected (data not shown), which lead us to use non-parametric tests. 245
The Kruskal-Wallis one-way analysis of variance was used to test equality of medians 246
among the groups of strains corresponding to each of the previously mentioned 247
12
condition (A-E) , using the formula (1) shown in the Material and Methods section. The 248
median was the measure of centrality for this test. It was expected that, in case of 249
reproducibility, all strains should have similar results, meaning that the values of 250
concentration (absolute or relative) and of fragment sizes (bp) should not differ in terms 251
of the median values. However, the Kruskal-Wallis test rejected the equality of medians 252
between groups, because once again the p-values were approximately 0 (<0.001). The 253
following approach consisted in searching for differences in terms of the median values 254
of fragment sizes (bp) and concentration values (absolute and relative) between strains. 255
This approach was repeated for the distinct experimental conditions used (A-E) in order 256
to search for the factors that most affect the reproducibility of the technique among the 257
conditions A-E. Based on the results from the Kruskall-Wallis one-way analysis of 258
variance, we assumed that at least two strains showed a difference in the medians. In 259
order to identify the strains that lead to the rejection of the equality of the medians, 260
Multiple Pairwise Comparisons, pooling the data for all 32 replicates per strain, were 261
performed. All 3892 values (the total number of observations regarding all experiments, 262
i.e. all bands of the 32 replicates of the 12 strains), were ordered by increasing numbers 263
and a rank score was calculated for identical values of absolute and relative 264
concentrations. Then, the formula (2) shown in the Material and Methods section was 265
applied for pairwise strain comparisons, based on a t-student distribution to search for 266
the origins of the differences between experimental conditions. The results of this test 267
are summarized in Table 1, for each pair compared, for each strain and using the 268
fragment size (bp), as well as absolute and relative DNA concentration values. 269
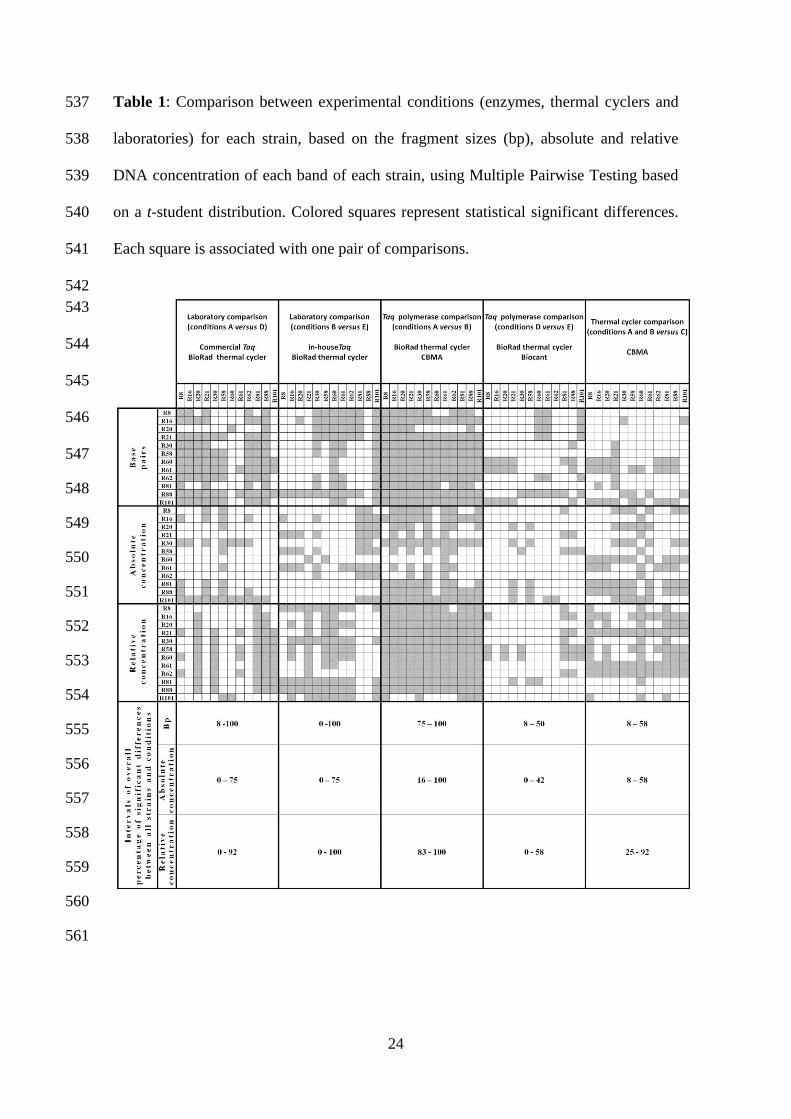
Statistical significant differences were observed when comparing all 3892 records 270
against each other, being the significant ones (based on a t-student significance test) 271
represented with gray squares in Table 1. In the bottom part of this Table (last three 272
13
lines), overall percentages are represented considering the differences between strains 273
and between conditions, both for fragment size base pairs and absolute and relative 274
DNA concentrations values. The inter-laboratory banding patterns reproducibility was 275
rather low as observed by the distribution of gray squares in the corresponding main 276
columns. Significant differences were found between strains analyzed in the two 277
laboratories. The lack of reproducibility of these experiments between laboratories was 278
not visible when analyzing the intervals of overall percentages. One could see that these 279
intervals were very comprehensive (including 0 and 100%) and that this analysis was 280
inconclusive for these comparisons. The reasons for this could be due to strain specific 281
effects and also to the extreme values included in the statistical. For example, strain 282
R101 was associated with 0% of statistically significant differences regarding absolute 283
DNA concentration, while for strain R88, regarding fragment size 100% of significant 284
differences were obtained. The cloned and in-house produced Taq increased 285
reproducibility between laboratories relative to commercial Taq. The comparison 286
between Taq polymerases produced data heterogeneity between laboratories. Low and 287
high reproducibility was found between enzymes for laboratory 1 and 2, respectively 288
(columns 3 and 4). This was shown by the higher number of gray squares in column 3 289
in comparison to column 4, and also by the intervals of overall percentages of 290
significant differences (75-100% comparing to 8-50% regarding fragment length; 16-291
100% comparing to 0-42% regarding absolute concentration values; 83-100% in 292
comparison to 0-58% regarding relative concentration values). 293
Regarding the different thermal cyclers used, experimental variation in laboratory 2 lead 294
to more reproducible results, as shown by the comparison of fragment sizes. This 295
reproducibility was not so evident when comparing absolute and relative concentration 296
values. 297
14
When analyzing all conditions together, the comparison of absolute DNA concentration 298
values produced the most reproducible results, followed by fragment size and relative 299
DNA concentration values. Relative concentration values should not be used, however, 300
because in replicate analysis of strains under different experimental conditions, distinct 301
numbers of fragments were obtained, affecting the ratios of relative concentration. 302
303
Comparison of different experimental conditions for strains delimitation 304
To identify the experimental condition that best differentiate the 12 yeast strains, 305
statistical analysis of the differences between group medians for each experimental 306
condition was performed. For each experimental condition (from A to E), the 307
percentage of significant differences between the strains was calculated (excluding the 308
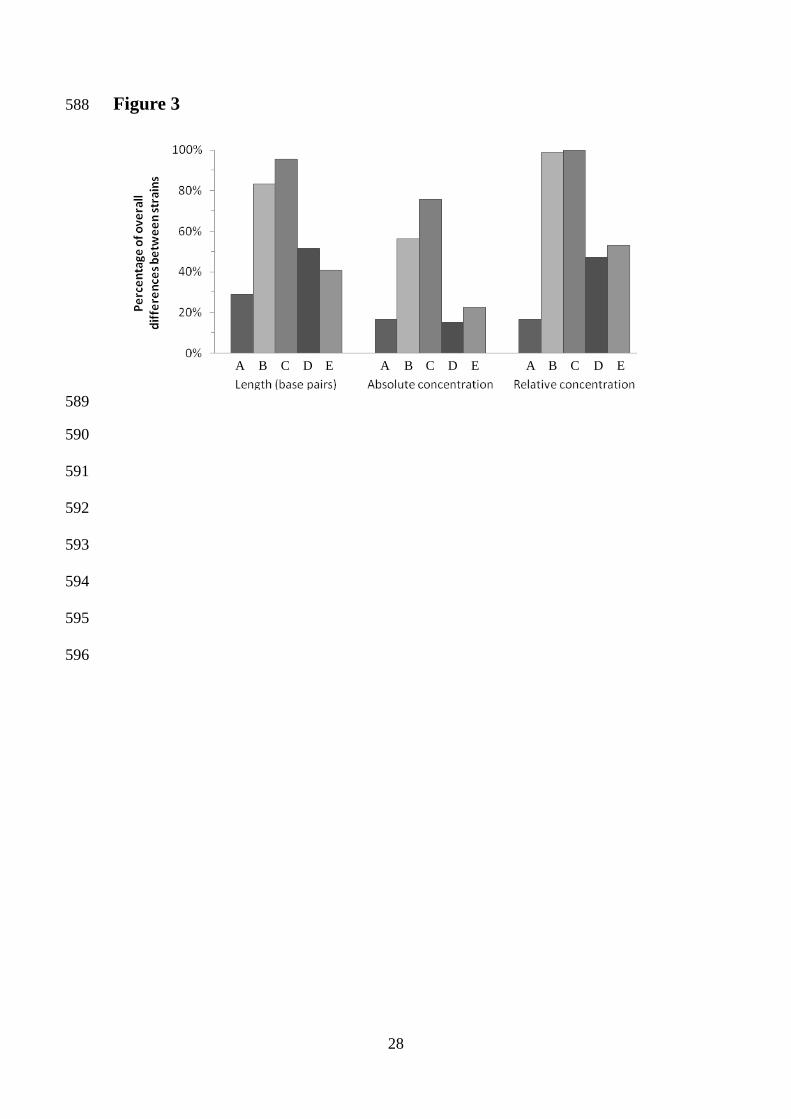
comparisons between the same strain for each experimental condition). Figure 3 shows 309
that combination C (in-house cloned Taq, Eppendorff thermal cycler, laboratory 2) lead 310
to the highest percentages regarding size, absolute and relative DNA concentration 311
values. This suggests that this is the most suitable combination of experimental 312
conditions for strain delimitation using interdelta banding patterns. Regarding fragment 313
size and relative DNA concentration, these percentages were almost 100, meaning that 314
the 12 electrophoretic patterns would correspond to 12 different strains. On the contrary, 315
combinations A (Commercial Taq, BioRad thermal cycler, laboratory 2), D 316
(Commercial Taq, BioRad thermal cycler, laboratory 1), and E (in-house Taq, BioRad 317
thermal cycler, laboratory 1) were less capable of differentiating strains with only 28.79 318
%, 51.52 % and 40.91 % of correctly delimited strains regarding fragment sizes, 319
respectively. Similar results were observed when comparisons were performed based on 320
absolute and relative DNA concentrations. In general terms, the use of in-house cloned 321
Taq polymerase led to better results than the use of commercial Taq polymerase, as can 322
be observed when comparing combination A and D (commercial Taq) with 323
15
combinations B, C and E (in-house Taq). Regarding the laboratories where the PCR 324
reactions were carried out, the strain patterns in laboratory 2 were better separated than 325
those obtained in laboratory 1 (combinations A, B and C versus combinations D and E). 326
The best results regarding strains differentiation were obtained when using relative 327
DNA concentration values (100 % with combinations B and C), however the latter 328
produced biased results. This is explained by the fact that, to calculate the relative DNA 329
concentration values, the absolute values were divided by the sum of all concentration 330
values of all bands contained in a banding pattern. In replicate analysis of different 331
experimental conditions, distinct numbers of fragments were obtained affecting the 332
ratios of relative concentration, leading to overestimated strain delimitation. Due to this 333
we consider that the percentages obtained for the analysis of absolute DNA 334
concentrations are more realistic to delimitate strains than relative DNA concentration 335
value. Fragment length analysis is the preferable measure for typing of yeast strains 336
using interdelta fragments amplification, even though the reproducibility associated was 337
smaller compared to absolute values of concentration (Table 1), but producing more 338
consistent results without introducing biases in the reproducibility of the technique. 339
340
Determination of identical banding patterns for each strain in all conditions 341
To gain further insight into the reproducibility of the interdelta sequence typing method, 342
we tried to identify for each strain the bands that were amplified across the A-E 343
experimental conditions. Strain R60, which showed a very different banding pattern was 344
excluded from this analysis. As shown in Table 2, three to seven bands in the range of 345
100 – 900 bp were apparent in all 32 replicates of each strain. The respective standard 346
deviations were rather low, ranging from 1.3 to 15.6 bp. Additional bands were mostly 347
found for fragment sizes between 1000 and 1500 bp or below 100 bp, and were not 348
represented because of lack of reproducibility. Some intermediate fragments were also 349
16
not included in Table 3 because they were represented only in some experimental 350
conditions. Reproducibility would approximate to 100%, if only the bands included in 351
Table 2 would be used for comparison of fragment sizes. 352
17
Discussion 353
The improved interdelta method [17] is suitable for the typing of yeast strains [19]. This 354
method is simple, rapid and less expensive than others, such as sequencing and 355
microsatellite amplification. Although less rigorous than other techniques as MLST or 356
microsatellite amplification, the PCR-based interdelta method is suitable for high-357
throughput analysis of large strain collections using microfluidic electrophoresis. The 358
amplification of interdelta regions results in a mixture of differently sized-specific 359
fragments. As previously shown by BLAST analysis [17], the sequences of fragments 360
obtained by amplification with primers δ12 and δ21 matched the predicted interdelta 361
regions. We have designed an inter-laboratory approach to evaluate the performance 362
and the reproducibility of this method as a high-throughput typing approach for the 363
genetic characterization of yeast strains. The comparative approaches that we describe 364
herein can contribute to the constitution of bio-databanks for equitable sharing of 365
genotypic data among laboratories in the context of biodiversity conservation and 366
sustainable development of genetic resources. However, it is crucial to find a set of 367
parameters leading to most reproducible patterns between laboratories. 368
As outlined in the Materials and Methods section, interdelta sequences of 12 strains 369
were amplified, under varying conditions (Taq DNA polymerase, thermal cycler and 370
laboratory). Interdelta sequence typing showed the reproducibility necessary for 371
implementation as a typing method for multiple (4 or 8) replicates of one strain, under 372
identical experimental conditions. The use of the microfluidic LabChip® system greatly 373
contributed to achieve very precise data with a high resolution, as reported in previous 374
works [28, 29]. 375
In general, DNA amplification depends on numerous factors such as the method of 376
DNA isolation, the concentrations of DNA, primers, MgCl2, dNTPs, the Taq 377
18
polymerase and the annealing temperature. In the present work only one DNA 378
extraction was performed for each strain, and the same DNA was used by both 379
laboratories, being therefore no variable in our experiments. Our (unpublished) results 380
showed that the DNA extraction protocol used is the most appropriate and leads to 381
much better results than an extraction method using phenol. DNA quantification was 382
performed in the NanodropTM
system, which allowed unambiguous evaluation of the 383
DNA quality. In recent publications [17, 19, 23, 26, 29, 40], DNA concentration values 384
were in the range of 0.1 - 2.5 ng/µl (final concentration). Fernandez-Espinar (2001) 385
showed that the optimal DNA quantities ranged from 0.6 to 2.5 ng/µl (final 386
concentration). The highest number of bands was amplified using the concentration of 387
2.5 ng/µl, which is similar to the concentration used throughout this work (4 ng/µl). In 388
the publications mentioned above, optimal MgCl2 concentrations ranged from 1.5 to 3.0 389
mM, whereas the primer and dNTP concentrations were in the range of 1 to 1.67 µM 390
and 200 to 400 µM, respectively. In our (unpublished) optimization approaches, we 391
found that more fragments were amplified when using 3.0 mM MgCl2, 400 µM dNTPs 392
and 1.67 µM of each primer. We suppose that these higher concentrations of primers 393
and dNTPs are necessary to amplify a group of fragments, contrarily to a PCR reaction 394
where just one single band is amplified. 395
The main objective of the present work was to show the extent of variation due to 396
factors such as the DNA polymerase or the thermal cycler. A commercial Taq DNA 397
polymerase and an in-house cloned and produced Taq were used, and different 398
amplification patterns were found. In our (unpublished) optimization approaches several 399
commercial Taq enzymes were tested, whereas the Taq polymerase used in this study 400
revealed to be most suitable for interdelta amplification. The choice of the polymerase is 401
therefore important before setting up PCR reactions. Several factors can contribute to 402
19
the differences found between the commercial and the in-house cloned Taq, such as the 403
preparation method (residual salt content), and/or an inaccurately measured enzymatic 404
activity of the in-house Taq. Besides, this Taq might be less purified and contain 405
residual cellular compounds that could contribute to better performance. All references 406
regarding interdelta amplification report a quite low annealing temperature 407
(predominantly 43ºC to 46ºC) [17-20, 22, 26, 29, 41]. Higher temperatures (55ºC) lead 408
to a more stable fragment profile, but reduce significantly the number of bands that are 409
amplified [21]. Our previous (unpublished) data revealed that 43.2ºC was the best 410
temperature to achieve both a high number of amplified bands and increased 411
reproducibility of the electrophoretic profiles. 412
Although the DNA samples used for interdelta fragments amplification were the same 413
for both laboratories, the accomplishment of experiments in different laboratories, the 414
use of different Taq DNA polymerases and thermal cyclers reduced reproducibility. In 415
fact, the same isolate could be considered as a different strain if typed in different 416
laboratories, due to the experimental variation associated with the conditions A-E. The 417
highest variability was associated with the source of Taq DNA polymerase and to 418
laboratory specific technical details, whereas the effect of the thermal cycler was low. 419
Both laboratories used the same aliquot of Taq polymerase. If different batches from the 420
same supplier were used in both laboratories, it is possible that the reproducibility 421
would be even more affected. Despite the mentioned limitations, PCR amplification of 422
interdelta sequences is most indicated for the typing of large strain collections, and a 423
high reproducibility is achieved for replicates within the same experimental conditions. 424
When considering interlaboratory experiments, a careful standardization of all the 425
factors that can interfere with the PCR reaction is mandatory to eliminate variability 426
caused by the source of Taq DNA polymerase and minor experimental differences 427
20
between laboratories. This study also demonstrates that, for reliable data sharing 428
between laboratories, comparative interdelta sequence analysis should be based on a 429
reduced number of bands that lead to reproducible banding pattern profiles. 430
431
ACKNOWLEDGEMENTS 432
This work was funded by the fellowship SFRH/BD/48591/2008 and by the projects 433
POCI/AGR/56102/2004, PTDC/BIA-BCM/64745/2006 and PTDC/AGR-434
ALI/103392/2008 from the Portuguese Research Agency (Fundação para a Ciência e 435
Tecnologia). The research leading to these results has also received funding from the 436
European Community´s Seventh Framework Programme (FP7/2007-2013) under grant 437
agreement nº 232454, and MCI grant MTM2008-01603. 438
21
References 439
[1] Aucott, J. N., Fayen, J., Grossnicklas, H., Morrissey, A., et al., Rev Infect Dis 1990, 440
12, 406-411. 441
[2] Hazen, K. C., Clin Microbiol Rev 1995, 8, 462-478. 442
[3] Blondin, B., Vezinhet, F., Revue Française d' Oenologie 1988, 28, 7-11. 443
[4] Carle, G. F., Olson, M. V., PNAS (USA) 1985, 82, 3756-3760. 444
[5] Dubordieu, D., Sokol, A., Zucca, J., Thalouarn, P., et al., Connais Vigne Vin 1984, 445
21, 267-278. 446
[6] Lopez, V., Querol, A., Ramon, D., Fernandez-Espinar, M. T., Int J Food Microbiol 447
2001, 68, 75-81. 448
[7] Querol, A., Barrio, E., Huerta, T., Ramon, D., Appl Environ Microbiol 1992, 58, 449
2948-2953. 450
[8] Vezinhet, F., Blondin, B., Hallet, J. N., Appl. Microbiol. Biotechnol. 1990, 32, 658–451
671. 452
[9] Corte, L., Lattanzi, M., Buzzini, P., Bolano, A., et al., J Appl Microbiol 2005, 99, 453
609-617. 454
[10] Baleiras Couto, M. M., Eijsma, B., Hofstra, H., Huis in't Veld, J. H., van der 455
Vossen, J. M., Appl Environ Microbiol 1996, 62, 41-46. 456
[11] Ayoub, M. J., Legras, J. L., Saliba, R., Gaillardin, C., J Appl Microbiol 2006, 100, 457
699-711. 458
[12] Hennequin, C., Thierry, A., Richard, G. F., Lecointre, G., et al., J Clin Microbiol 459
2001, 39, 551-559. 460
[13] Legras, J. L., Ruh, O., Merdinoglu, D., Karst, F., Int J Food Microbiol 2005, 102, 461
73-83. 462
[14] Perez, M. A., Gallego, F. J., Martinez, I., Hidalgo, P., Lett Appl Microbiol 2001, 463
33, 461-466. 464
[15] Martorell, P., Querol, A., Fernandez-Espinar, M. T., Appl Environ Microbiol 2005, 465
71, 6823-6830. 466
[16] Hierro, N., Esteve-Zarzoso, B., Gonzalez, A., Mas, A., Guillamon, J. M., Appl 467
Environ Microbiol 2006, 72, 7148-7155. 468
[17] Legras, J. L., Karst, F., FEMS Microbiol Lett 2003, 221, 249-255. 469
[18] Ness, F., Lavalee, F., Dubordieu, D., Aigle, M., Dulau, L., J. Sci. Food Agric 1993, 470
62, 89-94. 471
[19] Schuller, D., Valero, E., Dequin, S., Casal, M., FEMS Microbiol Lett 2004, 231, 472
19-26. 473
[20] Fernandez-Espinar, M. T., Lopez, V., Ramon, D., Bartra, E., Querol, A., Int J Food 474
Microbiol 2001, 70, 1-10. 475
[21] Ciani, M., Mannazzu, I., Marinangeli, P., Clementi, F., Martini, A., Ant 476
Leeuwenhoek 2004, 85, 159-164. 477
[22] Lavallée, F., Salvas, Y., Lamy, S., Thomas, D. Y., et al., Am J Enol Viticult 1994, 478
45, 86-91. 479
[23] Pramateftaki, P. V., Lanaridis, P., Typas, M. A., J Appl Microbiol 2000, 89, 236-480
248. 481
[24] Lopes, C. A., van Broock, M., Querol, A., Caballero, A. C., J Appl Microbiol 2002, 482
93, 608-615. 483
[25] Cappello, M. S., Bleve, G., Grieco, F., Dellaglio, F., Zacheo, G., Journal of 484
Applied Microbiology 2004, 97, 1274–1280. 485
[26] Demuyter, C., Lollier, M., Legras, J. L., Le Jeune, C., J Appl Microbiol 2004, 97, 486
1140-1148. 487
22
[27] Terefework, Z., Kaijalainen, S., Lindstrom, K., J Biotechnol 2001, 91, 169-180. 488
[28] Papa, R., Troggio, M., Ajmone-Marsan, P., Nonnis Marzano, F., J Anim Breed 489
Genet 2005, 122, 62-68. 490
[29] Tristezza, M., Gerardi, C., Logrieco, A., Grieco, F., J Microbiol Methods 2009, 78, 491
286-291. 492
[30] Vilioen, G. J., Nel, L. H., Crowther, J. R., Molecular Diagnostic PCR Handbook, 493
Springer, P.O. Box 17, 3300 AA Dordrecht, The Netherlands. 2005. 494
[31] Tudos, A. J., Besselink, G. A. J., Schasfoort, R. B. M., Lab on a Chip 2001, 1, 83-495
95. 496
[32] Verpoorte, E., Electrophoresis 2002, 23, 677-712. 497
[33] Ryley, J., Pereira-Smith, O. M., Yeast 2006, 23, 1065-1073. 498
[34] Whitesides, G. M., Nature 2006, 442, 368-373. 499
[35] Lion, N., Reymond, F., Girault, H. H., Rossier, J. S., Current Opinion in 500
Biotechnology 2004, 15, 31-37. 501
[36] Mark, D., Haeberle, S., Roth, G., von Stetten, F., Zengerle, R., Chem Soc Rev 502
2010, 39, 1153-1182. 503
[37] Schuller, D., Casal, M., Ant Leeuwenhoek 2007. 504
[38] Aires-de-Sousa, J., Aires-de-Sousa, L., Bioinformatics 2003, 19, 30-36. 505
[39] Conover, W. J., Iman, R. L., Technical Report, LA-7677-MS. Los Alamos Scientific 506
Laboratory 1979. 507
[40] Fernandez-Gonzalez, M., Espinosa, J. C., Ubeda, J. F., Briones, A. I., Syst Appl 508
Microbiol 2001, 24, 634-638. 509
[41] Masneuf, I., Dubourdieu, D., Journal International Des Sciences De La Vigne Et 510
Du Vin 1994, 28, 153-160. 511
512
513
23
Figure 1 514 Electrophoretic profile of the PCR-amplified interdelta regions of 12 Saccharomyces 515
cerevisiae strains. Amplification was performed using primers δ12 and δ2, and PCR 516
products were analyzed in the Caliper LabChip® 90 Electrophoresis System. The darker 517
bands at 15 and 7000 bp represent co-injected internal markers. 518
519
Figure 2 520
Replicates of the interdelta banding patterns of S. cerevisiae strain R81, obtained under 521
different amplification conditions. A - Commercial Taq, BioRad thermal cycler, 522
laboratory A; B - In-house Taq, BioRad thermal cycler, laboratory A; C - In-house Taq, 523
Eppendorff thermal cycler, laboratory A; D - Commercial Taq, BioRad thermal cycler, 524
laboratory B; E - In-house Taq, BioRad thermal cycler, laboratory B. 525
526
Figure 3 527
Comparison between the tested conditions for the delimitation of 12 yeast strains, 528
regarding fragment sizes (in bp), absolute and relative DNA concentration values. 529
Percentages indicate the differences found between strains when performing statistical 530
analysis of the differences between group medians considering each experimental 531
condition: A - Commercial Taq, BioRad thermal cycler, laboratory A; B - In-house Taq, 532
BioRad thermal cycler, laboratory A; C - In-house Taq, Eppendorff thermal cycler, 533
laboratory A; D - Commercial Taq, BioRad thermal cycler, laboratory B; E - In-house 534
Taq, BioRad thermal cycler, laboratory B. 535
536
24
Table 1: Comparison between experimental conditions (enzymes, thermal cyclers and 537
laboratories) for each strain, based on the fragment sizes (bp), absolute and relative 538
DNA concentration of each band of each strain, using Multiple Pairwise Testing based 539
on a t-student distribution. Colored squares represent statistical significant differences. 540
Each square is associated with one pair of comparisons. 541
542
543
544
545
546
547
548
549
550
551
552
553
554
555
556
557
558
559
560
561

25
Table 2: Fragment sizes (bp, average value and standard deviation) that were present in all 32 replicates of each strain 562
563
R8 R16 R20 R21 R30 R58 R61 R62 R81 R88 R101
97 97 ± 2,1 96 ± 2,4
96 ± 2,1 96 ± 2,1 96 ± 2,2 96 ± 1,9 96 ± 2 96 ± 2,1 96 ± 1,9 107 ± 1,8
134
134 ± 2
134 ± 1,9
161
156 ± 1,7
167 ± 2 157 ± 1,3
162 ± 3
188
189 ± 2,1
186 ± 1,3
205
205 ± 1,7
231
232 ± 2
231 ± 1,5 231 ± 4,4
262 262 ± 2,1
285
285 ± 2
320
326 ± 3,5
314 ± 4
348 348 ± 8,7
349 ± 4,5
347 ± 4,4
346 ± 4,4
371
371 ± 3,7
425 425 ± 4 425 ± 7 427 ± 5,7 427 ± 3,5 424 ± 3,7 427 ± 3,9
423 ± 3,4 426 ± 3,2
421 ± 4,8
458
453 ± 6,2 462 ± 3,5
486
482 ± 5,8
489 ± 5,3
531
531 ± 13,2
680
680 ± 8,7
721
721 ± 18,5
899 899 ± 15,6
564
Av
era
ge
size
(b
p)
of
rep
rod
uci
ble
fr
agm
ents
Strains
26
Figure1 565
566
567
568
569
570
571
572
573
574
575
576
577
578
27
Figure 2 579
580
581
582
583
584
585
586
587
28
Figure 3 588
589
590
591
592
593
594
595
596
A B C D E A B C D E A B C D E