Genome-wide association study identifies novel loci predisposing to
12
Genome-wide association study identifies novel loci predisposing to cutaneous melanoma { Christopher I. Amos 1, ∗, { , Li-E Wang 1, { , Jeffrey E. Lee 2, { , Jeffrey E. Gershenwald 2 , Wei V. Chen 1 , Shenying Fang 1 , Roman Kosoy 4 , Mingfeng Zhang 5 , Abrar A. Qureshi 5,6 , Selina Vattathil 1 , Christopher W. Schacherer 2 , Julie M. Gardner 2 , Yuling Wang 2 , D. Tim Bishop 7 , Jennifer H. Barrett 7 , GenoMEL Investigators, Stuart MacGregor 8 , Nicholas K. Hayward 8 , Nicholas G. Martin 8 , David L. Duffy 8 , Q-Mega Investigators, Graham J. Mann 9 , Anne Cust 10 , John Hopper 11 , AMFS Investigators, Kevin M. Brown 12 , Elizabeth A. Grimm 3 , Yaji Xu 1 , Younghun Han 1 , Kaiyan Jing 1 , Caitlin McHugh 13 , Cathy C. Laurie 13 , Kim F. Doheny 14 , Elizabeth W. Pugh 14 , Michael F. Seldin 4, { , Jiali Han 5,6,15, { and Qingyi Wei 1, ∗, { 1 Department of Epidemiology, 2 Department of Surgical Oncology and 3 Department of Melanoma Medical Oncology, The University of Texas MD Anderson Cancer Center, Houston, TX 77030, USA, 4 Rowe Program in Genetics, University of California, UC Davis, Davis, CA, USA, 5 Department of Dermatology and 6 Channing Laboratory, Department of Medicine, Brigham and Women’s Hospital, Harvard Medical School, Boston, MA 02115, USA, 7 Section of Epidemiology and Biostatistics, Leeds Institute of Molecular Medicine, University of Leeds, Leeds, UK, 8 Queensland Institute of Medical Research, Brisbane QLD 4029, Australia, 9 Westmead Institute of Cancer Research, University of Sydney at Westmead Millennium Institute and Melanoma Institute Australia, Westmead, NSW 2145, Australia, 10 Cancer Epidemiology and Services Research (CESR), Sydney School of Public Health, The University of Sydney, Sydney, Australia, 11 Centre for Molecular, Environmental, Genetic and Analytic (MEGA) Epidemiology, Melbourne School of Population Health, University of Melbourne, Melbourne, Australia, 12 Laboratory of Translational Genomics, Division of Cancer Epidemiology and Genetics, National Cancer Institute, Bethesda, MD, USA, 13 Department of Biostatistics, University of Washington, Seattle, WA, USA, 14 Center for Inherited Disease Research, School of Medicine, Johns Hopkins University, Baltimore, MD, USA and 15 Department of Epidemiology, Channing Laboratory, Harvard University, Boston, MA, USA Received June 27, 2011; Revised and Accepted September 7, 2011 We performed a multistage genome-wide association study of melanoma. In a discovery cohort of 1804 melanoma cases and 1026 controls, we identified loci at chromosomes 15q13.1 (HERC2/OCA2 region) and 16q24.3 (MC1R) regions that reached genome-wide significance within this study and also found strong evidence for genetic effects on susceptibility to melanoma from markers on chromosome 9p21.3 in the p16/ARF region and on chromosome 1q21.3 (ARNT/LASS2/ANXA9 region). The most significant single-nu- cleotide polymorphisms (SNPs) in the 15q13.1 locus (rs1129038 and rs12913832) lie within a genomic region that has profound effects on eye and skin color; notably, 50% of variability in eye color is associated with variation in the SNP rs12913832. Because eye and skin colors vary across European populations, we fur- ther evaluated the associations of the significant SNPs after carefully adjusting for European substructure. We also evaluated the top 10 most significant SNPs by using data from three other genome-wide scans. Additional in silico data provided replication of the findings from the most significant region on chromosome † See Appendix for the list of investigators involved in the study. ∗ To whom correspondence should be addressed at: Department of Epidemiology, Unit 1340, The University of Texas MD Anderson Cancer Center, 1155 Pressler Boulevard, Houston, TX 77030, USA. Tel: +1 7137452480; Fax: +1 7137928261; Email: [email protected] (C.I.A.); qwei@mda nderson.org (Q.W.) ‡ These authors contributed equally to this work. # The Author 2011. Published by Oxford University Press. All rights reserved. For Permissions, please email: [email protected] Human Molecular Genetics, 2011, Vol. 20, No. 24 5012–5023 doi:10.1093/hmg/ddr415 Advance Access published on September 17, 2011 Downloaded from https://academic.oup.com/hmg/article-abstract/20/24/5012/588193 by guest on 05 April 2019
Transcript of Genome-wide association study identifies novel loci predisposing to
Genome-wide association study identifies novelloci predisposing to cutaneous melanoma
{
Christopher I. Amos1,∗,{, Li-E Wang1,{, Jeffrey E. Lee2,{, Jeffrey E. Gershenwald2, Wei V. Chen1,
Shenying Fang1, Roman Kosoy4, Mingfeng Zhang5, Abrar A. Qureshi5,6, Selina Vattathil1,
Christopher W. Schacherer2, Julie M. Gardner2, Yuling Wang2, D. Tim Bishop7,
Jennifer H. Barrett7, GenoMEL Investigators, Stuart MacGregor8, Nicholas K. Hayward8,
Nicholas G. Martin8, David L. Duffy8, Q-Mega Investigators, Graham J. Mann9, Anne Cust10,
John Hopper11, AMFS Investigators, Kevin M. Brown12, Elizabeth A. Grimm3, Yaji Xu1,
Younghun Han1, Kaiyan Jing1, Caitlin McHugh13, Cathy C. Laurie13, Kim F. Doheny14,
Elizabeth W. Pugh14, Michael F. Seldin4,{, Jiali Han5,6,15,{ and Qingyi Wei1,∗,{
1Department of Epidemiology, 2Department of Surgical Oncology and 3Department of Melanoma Medical Oncology,
The University of Texas MD Anderson Cancer Center, Houston, TX 77030, USA, 4Rowe Program in Genetics,
University of California, UC Davis, Davis, CA, USA, 5Department of Dermatology and 6Channing Laboratory,
Department of Medicine, Brigham and Women’s Hospital, Harvard Medical School, Boston, MA 02115, USA, 7Section
of Epidemiology and Biostatistics, Leeds Institute of Molecular Medicine, University of Leeds, Leeds, UK, 8Queensland
Institute of Medical Research, Brisbane QLD 4029, Australia, 9Westmead Institute of Cancer Research, University of
Sydney at Westmead Millennium Institute and Melanoma Institute Australia, Westmead, NSW 2145, Australia,10Cancer Epidemiology and Services Research (CESR), Sydney School of Public Health, The University of Sydney,
Sydney, Australia, 11Centre for Molecular, Environmental, Genetic and Analytic (MEGA) Epidemiology, Melbourne
School of Population Health, University of Melbourne, Melbourne, Australia, 12Laboratory of Translational Genomics,
Division of Cancer Epidemiology and Genetics, National Cancer Institute, Bethesda, MD, USA, 13Department of
Biostatistics, University of Washington, Seattle, WA, USA, 14Center for Inherited Disease Research, School of
Medicine, Johns Hopkins University, Baltimore, MD, USA and 15Department of Epidemiology, Channing Laboratory,
Harvard University, Boston, MA, USA
Received June 27, 2011; Revised and Accepted September 7, 2011
We performed a multistage genome-wide association study of melanoma. In a discovery cohort of 1804melanoma cases and 1026 controls, we identified loci at chromosomes 15q13.1 (HERC2/OCA2 region) and16q24.3 (MC1R) regions that reached genome-wide significance within this study and also found strongevidence for genetic effects on susceptibility to melanoma from markers on chromosome 9p21.3 in thep16/ARF region and on chromosome 1q21.3 (ARNT/LASS2/ANXA9 region). The most significant single-nu-cleotide polymorphisms (SNPs) in the 15q13.1 locus (rs1129038 and rs12913832) lie within a genomicregion that has profound effects on eye and skin color; notably, 50% of variability in eye color is associatedwith variation in the SNP rs12913832. Because eye and skin colors vary across European populations, we fur-ther evaluated the associations of the significant SNPs after carefully adjusting for European substructure.We also evaluated the top 10 most significant SNPs by using data from three other genome-wide scans.Additional in silico data provided replication of the findings from the most significant region on chromosome
†See Appendix for the list of investigators involved in the study.
∗To whom correspondence should be addressed at: Department of Epidemiology, Unit 1340, The University of Texas MD Anderson Cancer Center,1155 Pressler Boulevard, Houston, TX 77030, USA. Tel: +1 7137452480; Fax: +1 7137928261; Email: [email protected] (C.I.A.); [email protected] (Q.W.)
‡These authors contributed equally to this work.
# The Author 2011. Published by Oxford University Press. All rights reserved.For Permissions, please email: [email protected]
Human Molecular Genetics, 2011, Vol. 20, No. 24 5012–5023doi:10.1093/hmg/ddr415Advance Access published on September 17, 2011
Dow
nloaded from https://academ
ic.oup.com/hm
g/article-abstract/20/24/5012/588193 by guest on 05 April 2019
1q21.3 rs7412746 (P 5 6 3 10210). Together, these data identified several candidate genes for additionalstudies to identify causal variants predisposing to increased risk for developing melanoma.
INTRODUCTION
Cutaneous melanoma (CM) is among the more commoncancers, with more than 70 000 estimated new cases in theUSA (excluding melanoma in situ) in 2011 (1). The risk forsiblings of index cases who have CM is �2-fold higher thanthat for the general population (2). Linkage studies andgenome-wide association studies (GWASs) have identifiedseveral loci influencing CM risk. Cyclin-dependent kinaseinhibitor 2A (CDKN2A or p16), an alternate reading frameof CDKN2A (ARF or p14), and cyclin-dependent kinase 4(CDK4) in region 9p21.3 have been identified as high-penetrance CM susceptibility genes (3), but mutations inthese genes are rare and explain only a small fraction of famil-ial CM risk. However, GWASs found evidence that commonvariation in the CDKN2A region also commonly influencerisk for melanoma (4,5). Mutations in the melanocortin 1receptor (MC1R) gene in the chromosomal region 16q24.3influence skin pigmentation, and a candidate gene analysis fol-lowed by several confirmatory studies documented an �40%increased risk of CM in those who carried the variants confer-ring lighter skin pigmentation according to specific mutations(6–8).
In addition, GWASs have identified several other loci thatmay contribute to CM risk. GWAS analyses have revealedseveral additional genes associated with skin pigmentation,including TYR (tyrosinase, chromosome 11q21) (9), TYRP1(tyrosinase-related protein 1, chromosome 9p23) (10),SLC45A2 (solute carrier family 45, member 2, chromosome5p13.3), SLC24A4 (solute carrier family 24, member 4,chromosome 14q32.12) and IRF4 (interferon regulatoryfactor 4, chromosome 6p25.3). A case–control study (11)that used a pooling approach to identify common variants in-fluencing CM risk found several genetic factors influencingrisk across a broad region of chromosome 20q11.2 that encom-passes the genetic loci, PIGU, EIF2S2, NCOA6 and MYH17B.Finally, the locus PLA2G6 (4) on chromosome 22q13 was alsopreviously associated with CM risk in a GWAS. The goal ofthe current GWAS was to identify novel variants associatedwith CM risk by using dense single-nucleotide polymorphism(SNP) arrays on a large population of CM cases that were col-lected uniformly from a single cancer center in the USA and tothen validate these findings with use of additional data fromUS, Australian and European populations.
RESULTS
To identify risk variants for CM, we used an IlluminaOmni1-Quad_v1-0_B array to genotype 1 016 423 SNPs in3115 participants. After the application of quality control(QC) criteria (Supplementary Material, Tables S1 and S2and Fig. 1), genotypes were available for 1804 CaucasianCM patients presenting to clinics (other than dermatology)at The University of Texas MD Anderson Cancer Center
and 1026 Caucasian cancer-free controls who were friendsor acquaintances accompanying patients at their clinicalvisits. We analyzed 1 012 904 probes with a mean samplecall rate of 99.66%. After applying QC filters, we retaineddata for analysis from 818 977 SNPs (818 237 autosomal orX chromosome SNPs and 740 psuedoautosomal SNPs) thathad a minor allele frequency (MAF) of .1%, were genotypedfor 95% or more of retained participants and did not deviatefrom Hardy–Weinberg equilibrium (P . 1 × 1025). Individ-ual genotypes that had Illumina GenTrain version 1.0 qualityscores of ≤0.15 were set to missing. Figure 1 and Supplemen-tary Tables 1 and 2 present an overall description of thesample processing and in silico replication phases of thisstudy.
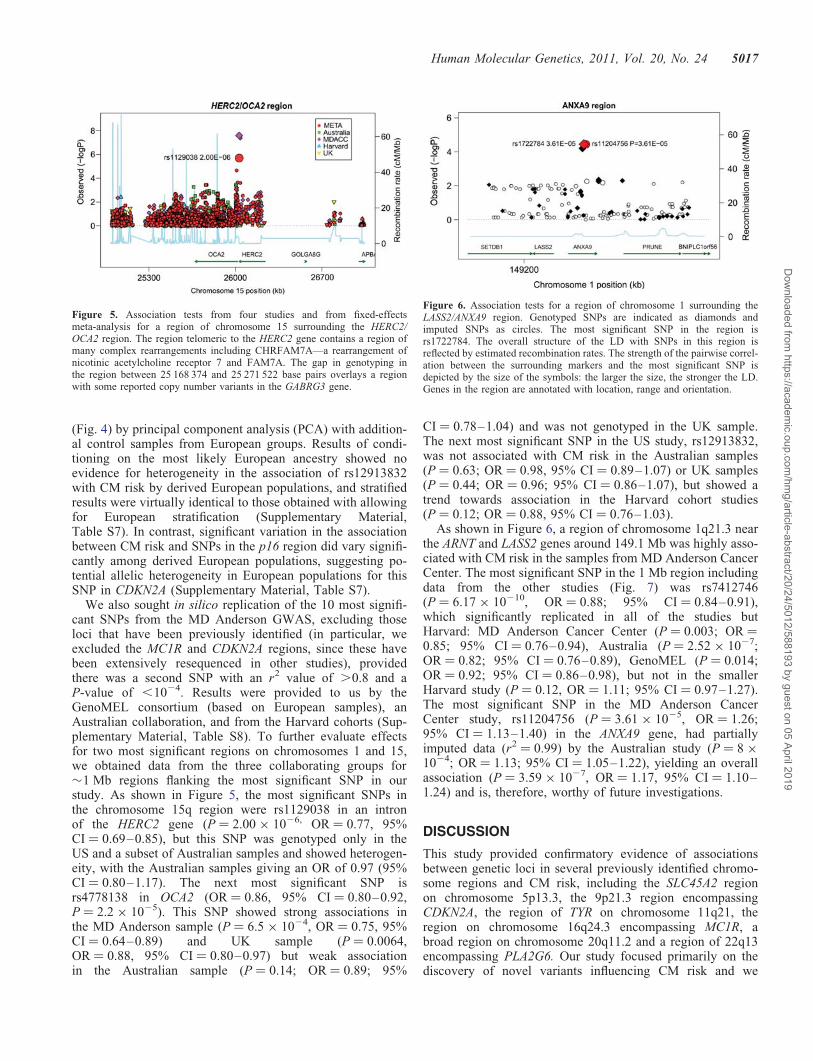
Initial analyses were performed using the additive logisticregression model implemented in PLINK (12). The Q–Qplots for the discovery sample are shown in SupplementaryMaterial, Figures S1 and S2. The genomic inflation factor(l) for the discovery sample was 1.020, and this wasreduced when the first two principal components (PCs) wereincluded as covariates (l ¼ 1.011). Association resultsacross the genome after correcting for the two PCs areshown in Figure 2 and Supplementary Material, Table S3 (as-sociation tests with P , 1 × 1024). The two regions reachinggenome-wide significance (5 × 1028) are located on 15q13.1(HERC2/OCA2 region) and 16q24.3 (MC1R region) centeredat or near the MC1R and HERC2/OCA2 genes, with a thirdhighly significant region at chromosome 9p21.3 (nearCDKN2A/ARF genes). In Table 1, we present the results forpreviously reported associations of CM risk with SNPs. Ofthe previously reported 27 risk-associated SNPs, 21 were sig-nificant in our study at P , 0.05. Individual SNPs that werepreviously associated with CM risk but did not reach signifi-cance in our study included rs1408799 in TYRP1,rs12896399 in SLC24A4, rs1800407 in OCA2, rs1805006 inMC1R, rs4911414 in LOC729547 and rs1015362 in EIF2S2,but associations for most previously reported SNPs were sup-ported in our study, and except for the region around SLC24A4on chromosome 14q32.12 there was at least one SNP in aregion showing P , 1 × 1024.
To understand whether associations in regions that werepreviously reported to be associated with CM risk werelikely to be due to effects from a single or multiple variants,we performed analyses in which the association of SNPs ina region was conditioned on the most significant SNP in thatregion. Conditioning on the most significant SNP in MC1Rreduced the level of significance for all other SNPs, butsome SNPs retained significance levels of 1023 or higher(Supplementary Material, Fig. S3). Similarly, conditioningon the most significant SNP in the p16 region removedsome, but not all, of the evidence for association in thatregion. These results suggest that multiple variants influenceCM risk in these regions, or the SNP on which we conditionedmay not be the causal variant, but was only in strong linkage
Human Molecular Genetics, 2011, Vol. 20, No. 24 5013
Dow
nloaded from https://academ
ic.oup.com/hm
g/article-abstract/20/24/5012/588193 by guest on 05 April 2019
disequilibrium (LD) with the causal variant, so that thereremained some residual association. For 9p21.3 (CDKN2Aregion), associations were detected across a broad regionthat includes recombination hotspots even after conditioningon the most significant SNP, suggesting that multiple variantsare involved.
Figure 3 shows results from an association analysis of CMwith SNPs in the HERC2/OCA2 region in samples from MDAnderson Cancer Center. The HERC2 SNP rs1129038 wasthe most significantly associated variant in the region[P ¼ 2.58 × 1028; odds ratio (OR) ¼ 0.69; 95% confidenceinterval (CI) ¼ 0.61–0.79]. The next most significant geno-typed SNP in this region was rs12913832 (P ¼ 4.31 × 1028;OR ¼ 0.69; 95% CI ¼ 0.61–0.79). The variants rs1129038
and rs12913832 are in very high LD (r2 ¼ 98.5%), butrs1129038 was not genotyped on other platforms used insubsequent studies; hence, further analyses were restricted tors12913832.
The SNP rs1800407 in the flanking region of 15q13.1(HERC2/OCA2 region) showed moderate evidence (P ¼0.004) for association with CM risk in a candidate genestudy but was not associated with CM risk in this study(P ¼ 0.62, OR ¼ 0.95; 95% CI ¼ 0.78–1.16). The most sig-nificant SNPs near the OCA2 gene yielded P-values(rs73377792, P ¼ 6.3 × 1024; rs4778138, P ¼ 6.52 × 1024)that were less extreme than those observed in the 15q13.1(HERC2/OCA2) region in our study population. Further ana-lyses conditioning on rs1129038 (Supplementary Material,Fig. S3) removed all remaining significant SNPs in the region.
Because the HERC2 gene was previously shown to be asso-ciated with pigmentary phenotypes (13), we further evaluatedthe association of the rs12913832 SNP with pigmentary pheno-types by using samples from MD Anderson (SupplementaryMaterial, Table S4). Table 2 describes additional findingsfrom the analysis of SNP rs12913832 in the MD Anderson par-ticipants. Results showed overwhelming evidence associatingHERC2 rs12913832 with skin, eye and hair color phenotypes.Further analysis to evaluate the effect that this SNP had onthese phenotypes showed that rs12913832 alone explained50% of eye color (Supplementary Material, Table S5). In add-ition, we evaluated the association of HERC2 rs12913832 withpigmentary phenotypes in 10 183 participants in the Nurses’Health Study (NHS) and Health Professionals Follow-UpStudy (HPFS). In these analyses, 567 cases and 7329 controlswere genotyped using Illumina Bead arrays for HERC2 SNPrs12913832. We found extremely significant associations(Table 3). Stratifying by skin color, we observed strongesteffects of the HERC2 SNP in lighter-skinned individuals(n ¼ 1009, P ¼ 0.0003, OR ¼ 0.66, 95% CI ¼ 0.53–0.83), a
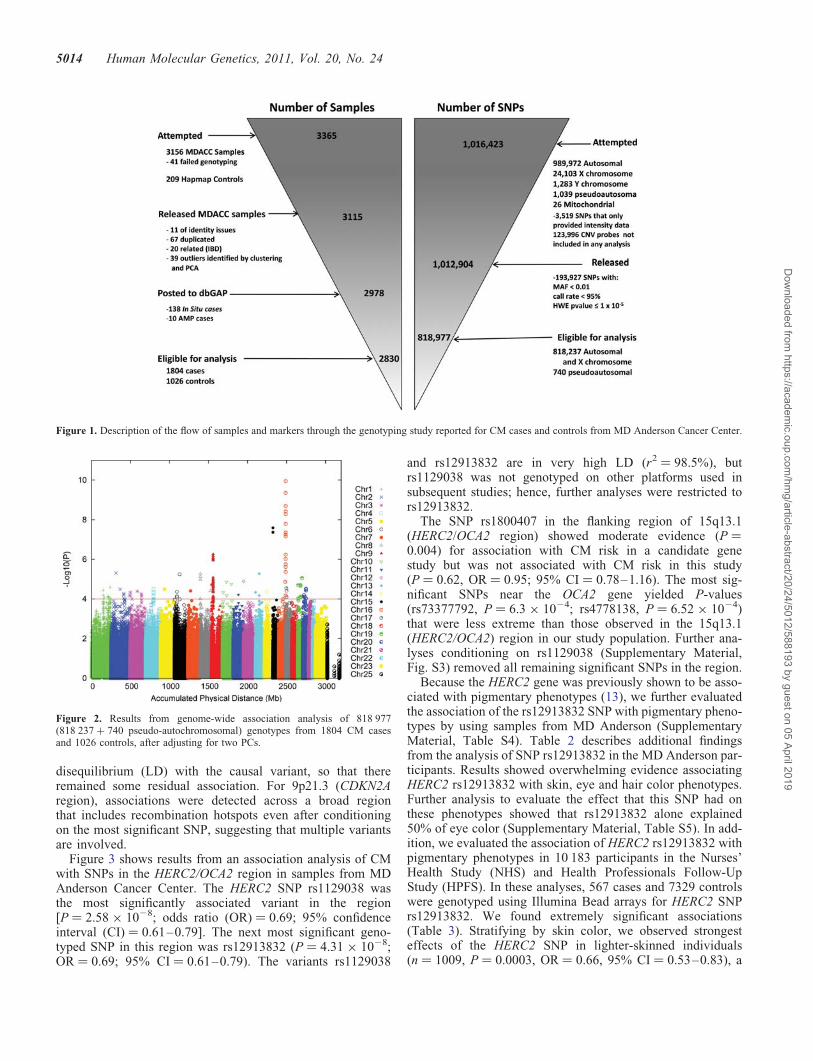
Figure 1. Description of the flow of samples and markers through the genotyping study reported for CM cases and controls from MD Anderson Cancer Center.
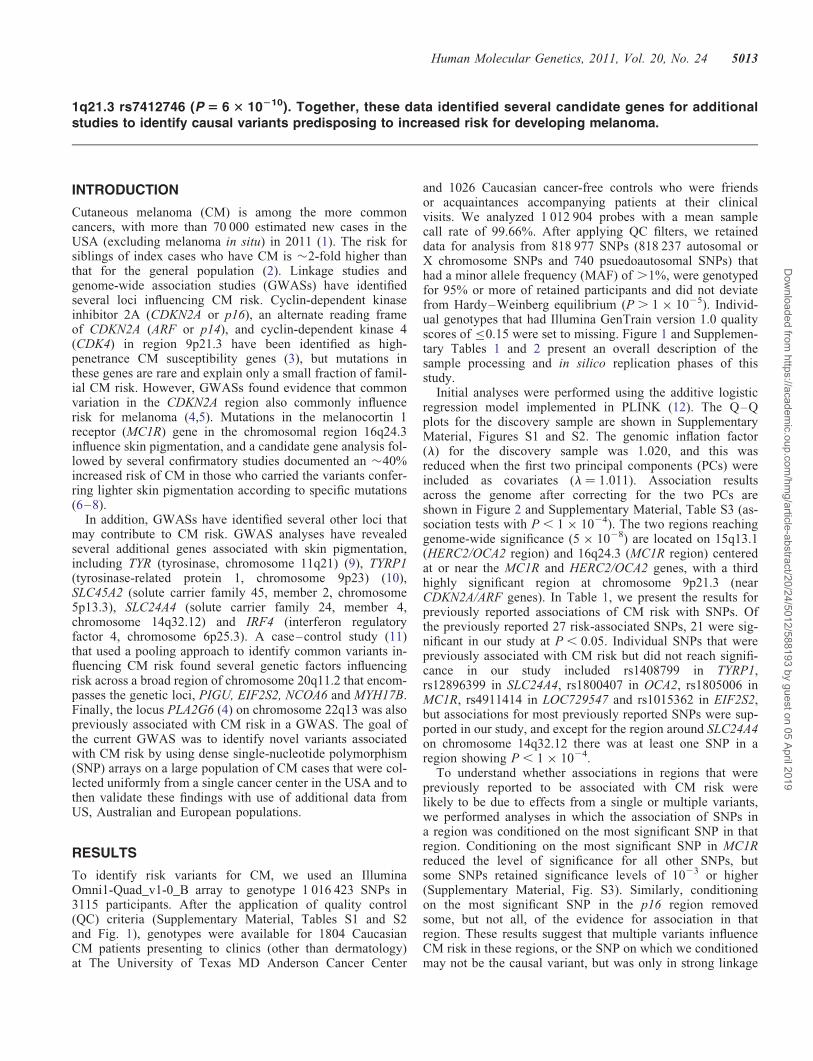
Figure 2. Results from genome-wide association analysis of 818 977(818 237 + 740 pseudo-autochromosomal) genotypes from 1804 CM casesand 1026 controls, after adjusting for two PCs.
5014 Human Molecular Genetics, 2011, Vol. 20, No. 24
Dow
nloaded from https://academ
ic.oup.com/hm
g/article-abstract/20/24/5012/588193 by guest on 05 April 2019

weaker effect in medium-skinned individuals (n ¼ 828,P ¼ 0.02, OR ¼ 0.77, 95% CI ¼ 0.61–0.96) and no effect indark-skinned individuals (n ¼ 117, P ¼ 0.75, OR ¼ 1.10,95% CI ¼ 0.61–2.00). In the Harvard cohort studies, the stron-gest effect was observed in light-skinned individuals (n ¼2173, P ¼ 0.08 OR ¼ 0.80, 95% CI ¼ 0.63–1.03), and noeffect was observed in medium-skinned (n ¼ 1916, P ¼ 0.64,OR ¼ 1.05, 95% CI ¼ 0.85–1.32) or dark-skinned individuals(n ¼ 1916, P ¼ 0.72, OR ¼ 0.94, 95% CI ¼ 0.67–1.32).
Because skin pigmentation and the HERC2 SNP frequency(Supplementary Material, Table S6) showed highly significant
variability across European populations (14) and the CM riskis higher for northern European than for southern Europeanpopulations, a potential concern can be raised that northern/southern European ancestry may be a confounder, causing aspurious association to be observed. We therefore derivedthe most likely European ancestry of the study participants
Figure 3. Association tests for the HERC2/OCA2 region on chromosome15q13.1. Genotyped SNPs are indicated as diamonds and imputed SNPs ascircles. The most significant SNP in the region is HERC2 rs1129038. Thestrength of the pairwise correlation between the surrounding markers andthe most significant SNP is depicted by the size of the symbols: the largerthe size, the stronger the LD. Genes in the region are annotated with location,range and orientation.
Table 1. Associations of SNPs previously found in GWASs to be associated with CM risk, A1 is the minor allele in forward strand
Chr. SNP Source Gene r2 MAF Reference Position P-value Ref. All. OR 95% CI
5 rs16891982 Imputed SLC45A2 0.89 0.022 13 33 987 450 0.0026 C 0.54 0.37–0.815 rs35391 Typed SLC45A2 0.014 13 33 991 430 0.020 A 0.58 0.37–0.915 rs28777 Typed SLC45A2 0.017 13 33 994 716 0.0048 C 0.56 0.37–0.849 rs1408799 Typed TYRP1 0.30 9,10, 13 12 662 097 0.70 T 0.98 0.87–1.109 rs2218220 Imputed near MTAP 1.00 0.48 4 21 746 089 0.00014 T 0.81 0.73–0.909 rs1335510 Imputed near MTAP 1.00 0.39 4 21 747 803 5.01 × 1025 G 0.79 0.71–0.899 rs935053 Imputed near MTAP 0.99 0.47 4 21 773 922 4.49 × 1025 A 0.80 0.71–0.899 rs10757257 Imputed MTAP 0.99 0.38 4 21 796 564 1.96 × 1025 A 0.78 0.70–0.889 rs7023329 Typed MTAP 0.47 4 21 806 528 1.86 × 1025 G 0.79 0.71–0.8811 rs1042602 Typed TYR 0.36 4, 10 88 551 344 0.045 A 0.89 0.79–1.0011 rs1393350 Typed TYR 0.30 4, 10 88 650 694 0.0085 A 1.18 1.04–1.3311 rs1847142 Imputed TYR 0.99 0.34 4 88 661 222 0.0021 A 1.20 1.07–1.3511 rs10830253 Imputed TYR 0.99 0.34 4 88 667 691 0.0022 G 1.20 1.07–1.3411 rs1806319 Typed TYR 0.39 4 88 677 584 0.0050 C 1.17 1.05–1.3114 rs12896399 Typed SLC24A4 0.46 10 91 843 416 0.33 T 1.06 0.95–1.1815 rs1800407 Typed OCA2 0.08 13 25 903 913 0.67 A 0.95 0.78–1.1716 rs1805006 Typed MC1R 0.01 13 88 513 419 0.053 A 1.67 0.97–2.8616 rs1805007 Imputed MC1R 0.81 0.13 10, 13 88 513 618 4.1 × 1029 T 1.74 1.44–2.1116 rs1805008 Typed MC1R 0.10 10,13 88 513 645 0.001 A 1.37 1.13–1.6720 rs4911414 Typed LOC729547 0.37 11 32 193 105 0.090 T 1.11 0.98–1.2420 rs1015362 Imputed EIF2S2 0.96 0.27 11 32 202 273 0.31 T 0.94 0.83–1.0620 rs910873 Typed PIGU 0.11 11 32 635 433 0.00017 A 1.42 1.18–1.7120 rs17305573 Typed PIGU 0.11 11 32 643 813 0.00017 C 1.42 1.18–1.7120 rs4911442 Imputed NCOA6 0.98 0.15 11 32 818 707 0.0029 G 1.27 1.08–1.4920 rs1885120 Typed MYH7B 0.11 11 33 040 650 0.00016 C 1.43 1.18–1.7222 rs2284063 Imputed PLA2G6 0.97 0.35 4 36 874 244 0.0045 G 0.84 0.75–0.9522 rs6001027 Typed PLA2G6 0.34 4 36 875 565 0.0039 G 0.84 0.75–0.95
Table 2. Association of HERC2 rs12913832 with pigmentary phenotypes inthe MD Anderson study
GWAS phenotype WT/VT MAF Estimate SE P-value
Hair color (blondeto black)
G/A 0.2625 0.3924 0.0407 5.35 × 10222
Eye color (blue tobrown)
G/A 0.2620 0.9193 0.0283 1.79 × 102231
Tanning ability(none to deep)
G/A 0.2589 0.2008 0.0489 4.07 × 1025
WT, wild-type; VT, variant type; SE, standard error.
Table 3. Association of HERC2 rs12913832 with pigmentary phenotypes inthe NHS and the HPFS
GWAS phenotype WT/VT MAF Effect SE P-value
Hair color (blondeto black)
G/A 0.2497 0.3872 0.014 1.39 × 102167
Eye color (blue tobrown)
G/A 0.2647 0.8571 0.0175 7.68 × 102523
Tanning ability(none to deep)
G/A 0.2534 0.1359 0.0139 1.44 × 10222
WT, wild-type; VT, variant type; SE, standard error.
Human Molecular Genetics, 2011, Vol. 20, No. 24 5015
Dow
nloaded from https://academ
ic.oup.com/hm
g/article-abstract/20/24/5012/588193 by guest on 05 April 2019

Figure 4. PCA of CM cases and controls showing the relationship among populations of European and Middle-Eastern origin. (A) Analyses of 1804 CM cases and 1026controls, with an additional 5001 Caucasians of known origin, are shown for PC1 and PC2 (A1, A2, A3), and for PC1 and PC3 (A4, A5, A6). The results are shown witheither the known population groups color-coded (A1 and A4) or with controls color-coded (A2 and A5) or cases color-coded (A3 and A6). The population groups areindicated in the legend key. AJA 4GP are Ashkenazi Jewish Americans with four grandparents of Ashkenazi heritage. The group denoted ‘ALL’ are Americans of Euro-pean ancestry. Results show similarity of PCA loadings for cases and controls in A2–A6. (B) The color code indicates the correspondence of controls or cases to sevendifferent population groups with graphs for PC1 and PC2 (B1 and B3), and PC1 and PC3 (B2 and B4). The population groups were based on correspondence to PCA. Thepopulation groups corresponded to the range of the self-identified population group member defined by the first three PCs (see A). Where overlaps were present, the mid-points in the overlapped region were used to define the boundary between the population group assignment. The legend key shows the corresponding population groupswith abbreviations for the following groups: Ashkenazi Jewish (ASHKEN), eastern European (EEUR), German (GER), Scandinavian (SCAN) and United Kingdom (UK).Analysis of CM case–control data alone yielded two PCs, whereas analysis including additional European controls yielded the additional third PC, shown in this figure.
5016 Human Molecular Genetics, 2011, Vol. 20, No. 24
Dow
nloaded from https://academ
ic.oup.com/hm
g/article-abstract/20/24/5012/588193 by guest on 05 April 2019
(Fig. 4) by principal component analysis (PCA) with addition-al control samples from European groups. Results of condi-tioning on the most likely European ancestry showed noevidence for heterogeneity in the association of rs12913832with CM risk by derived European populations, and stratifiedresults were virtually identical to those obtained with allowingfor European stratification (Supplementary Material,Table S7). In contrast, significant variation in the associationbetween CM risk and SNPs in the p16 region did vary signifi-cantly among derived European populations, suggesting po-tential allelic heterogeneity in European populations for thisSNP in CDKN2A (Supplementary Material, Table S7).
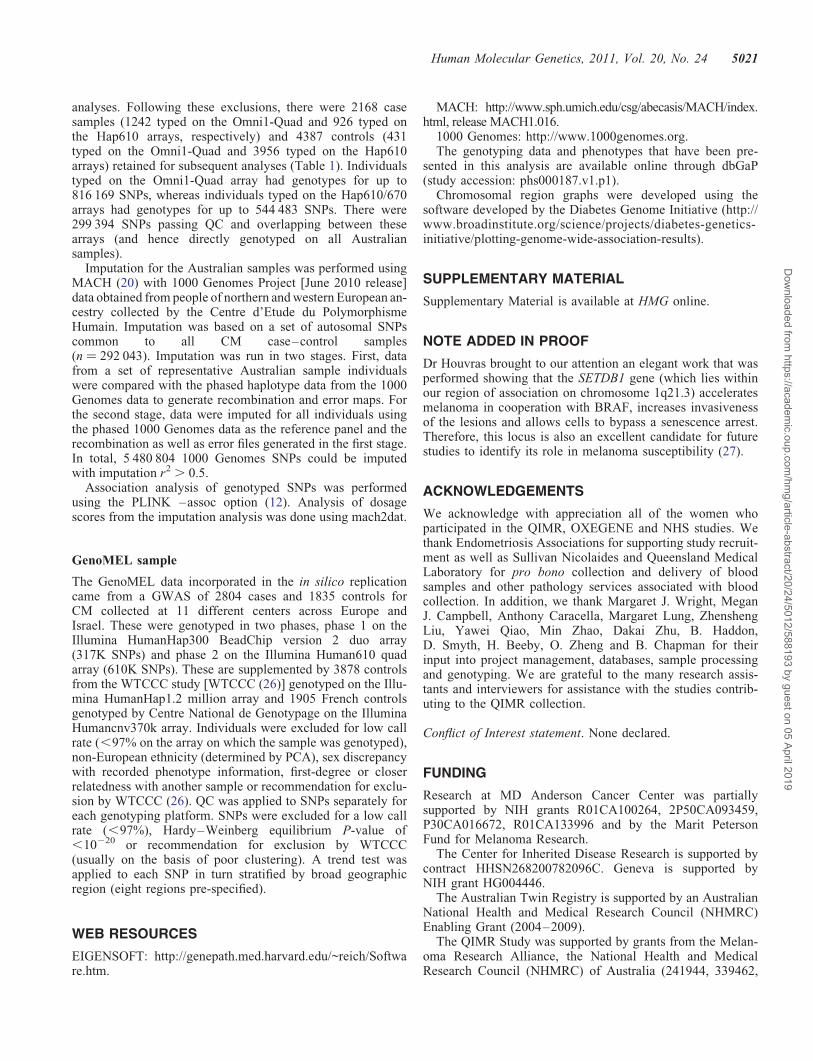
We also sought in silico replication of the 10 most signifi-cant SNPs from the MD Anderson GWAS, excluding thoseloci that have been previously identified (in particular, weexcluded the MC1R and CDKN2A regions, since these havebeen extensively resequenced in other studies), providedthere was a second SNP with an r2 value of .0.8 and aP-value of ,1024. Results were provided to us by theGenoMEL consortium (based on European samples), anAustralian collaboration, and from the Harvard cohorts (Sup-plementary Material, Table S8). To further evaluate effectsfor two most significant regions on chromosomes 1 and 15,we obtained data from the three collaborating groups for�1 Mb regions flanking the most significant SNP in ourstudy. As shown in Figure 5, the most significant SNPs inthe chromosome 15q region were rs1129038 in an intronof the HERC2 gene (P ¼ 2.00 × 1026, OR ¼ 0.77, 95%CI ¼ 0.69–0.85), but this SNP was genotyped only in theUS and a subset of Australian samples and showed heterogen-eity, with the Australian samples giving an OR of 0.97 (95%CI ¼ 0.80–1.17). The next most significant SNP isrs4778138 in OCA2 (OR ¼ 0.86, 95% CI ¼ 0.80–0.92,P ¼ 2.2 × 1025). This SNP showed strong associations inthe MD Anderson sample (P ¼ 6.5 × 1024, OR ¼ 0.75, 95%CI ¼ 0.64–0.89) and UK sample (P ¼ 0.0064,OR ¼ 0.88, 95% CI ¼ 0.80–0.97) but weak associationin the Australian sample (P ¼ 0.14; OR ¼ 0.89; 95%
CI ¼ 0.78–1.04) and was not genotyped in the UK sample.The next most significant SNP in the US study, rs12913832,was not associated with CM risk in the Australian samples(P ¼ 0.63; OR ¼ 0.98, 95% CI ¼ 0.89–1.07) or UK samples(P ¼ 0.44; OR ¼ 0.96; 95% CI ¼ 0.86–1.07), but showed atrend towards association in the Harvard cohort studies(P ¼ 0.12; OR ¼ 0.88, 95% CI ¼ 0.76–1.03).
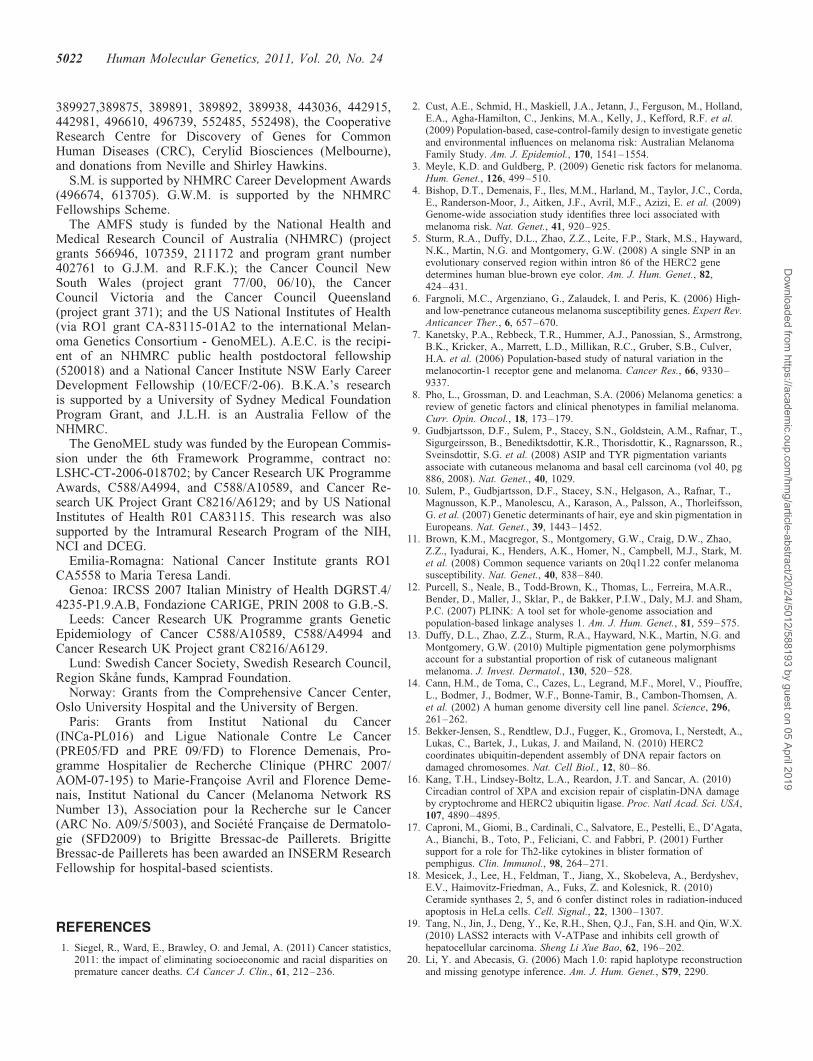
As shown in Figure 6, a region of chromosome 1q21.3 nearthe ARNT and LASS2 genes around 149.1 Mb was highly asso-ciated with CM risk in the samples from MD Anderson CancerCenter. The most significant SNP in the 1 Mb region includingdata from the other studies (Fig. 7) was rs7412746(P ¼ 6.17 × 10210, OR ¼ 0.88; 95% CI ¼ 0.84–0.91),which significantly replicated in all of the studies butHarvard: MD Anderson Cancer Center (P ¼ 0.003; OR ¼0.85; 95% CI ¼ 0.76–0.94), Australia (P ¼ 2.52 × 1027;OR ¼ 0.82; 95% CI ¼ 0.76–0.89), GenoMEL (P ¼ 0.014;OR ¼ 0.92; 95% CI ¼ 0.86–0.98), but not in the smallerHarvard study (P ¼ 0.12, OR ¼ 1.11; 95% CI ¼ 0.97–1.27).The most significant SNP in the MD Anderson CancerCenter study, rs11204756 (P ¼ 3.61 × 1025, OR ¼ 1.26;95% CI ¼ 1.13–1.40) in the ANXA9 gene, had partiallyimputed data (r2 ¼ 0.99) by the Australian study (P ¼ 8 ×1024; OR ¼ 1.13; 95% CI ¼ 1.05–1.22), yielding an overallassociation (P ¼ 3.59 × 1027, OR ¼ 1.17, 95% CI ¼ 1.10–1.24) and is, therefore, worthy of future investigations.
DISCUSSION
This study provided confirmatory evidence of associationsbetween genetic loci in several previously identified chromo-some regions and CM risk, including the SLC45A2 regionon chromosome 5p13.3, the 9p21.3 region encompassingCDKN2A, the region of TYR on chromosome 11q21, theregion on chromosome 16q24.3 encompassing MC1R, abroad region on chromosome 20q11.2 and a region of 22q13encompassing PLA2G6. Our study focused primarily on thediscovery of novel variants influencing CM risk and we
Figure 5. Association tests from four studies and from fixed-effectsmeta-analysis for a region of chromosome 15 surrounding the HERC2/OCA2 region. The region telomeric to the HERC2 gene contains a region ofmany complex rearrangements including CHRFAM7A—a rearrangement ofnicotinic acetylcholine receptor 7 and FAM7A. The gap in genotyping inthe region between 25 168 374 and 25 271 522 base pairs overlays a regionwith some reported copy number variants in the GABRG3 gene.
Figure 6. Association tests for a region of chromosome 1 surrounding theLASS2/ANXA9 region. Genotyped SNPs are indicated as diamonds andimputed SNPs as circles. The most significant SNP in the region isrs1722784. The overall structure of the LD with SNPs in this region isreflected by estimated recombination rates. The strength of the pairwise correl-ation between the surrounding markers and the most significant SNP isdepicted by the size of the symbols: the larger the size, the stronger the LD.Genes in the region are annotated with location, range and orientation.
Human Molecular Genetics, 2011, Vol. 20, No. 24 5017
Dow
nloaded from https://academ
ic.oup.com/hm
g/article-abstract/20/24/5012/588193 by guest on 05 April 2019

identified strong associations of SNPs in the HERC2/OCA2region on chromosome 15q13.1 as well as a region of chromo-some 1q21.3 that had not previously been well characterized.The HERC2 SNPs had previously been noted to associatestrongly with pigmentation (5), but our finding is the firstreport that these SNPs influence CM risk in US populations.In the previous analysis of pigmentary phenotypes and SNPsin the HERC2/OCA2 region, the strongest association wasfound with SNPs rs12913832 and rs1129038 (13). TheseSNPs lie in a region that is in LD with both exons ofHERC2 as well as the regulatory region of OCA2, so thatfurther studies are needed to identify whether variation inHERC2 or OCA2 accounts for CM risk and pigmentarychanges in this region. We also identified the SNPrs4778138 in OCA2, which showed a suggestive associationwith CM risk among the studies in which it was genotyped.These results implicate HERC2/OCA2 variation as apigment-related gene that affects CM risk. Risk of CMcould also be influenced by the effects of HERC2, whichhas recently been shown to play a role in ubiquitinationafter DNA damage (15) and to post-translationally regulatelevels of XPA (16), a core protein involved innucleotide-excision repair. HERC2 variants could reduceCM risk by increasing levels of XPA, a hypothesis thatneeds further mechanistic studies. Variation in the associationof the HERC2 region SNPs among US, Australian and Euro-pean regions may reflect varying patterns of sun exposureand thus further gene–environment studies are needed.
Pigmentation varies among European populations, as doesthe frequency of variants in rs12913832, but cases and controlsfrom the two US studies were collected from the same institu-tion and cohorts, respectively, limiting possible confoundingeffects. The GenoMEL study encompasses several countrieswithin Europe. Differences in allelic background as well asvariation in sun exposure may underlie the differencesbetween US and Australian or GenoMEL study findings forthe effect of HERC2/OCA2, chromosome 15q13.1 regionSNPs on the risk of CM.
For the region on chromosome 1q21.3 that was highly asso-ciated with CM risk, the evidence of an association was thestrongest for a region that includes ANXA9, LASS2, SETDB1and ARNT, which are closely located. ANXA9 is an annexin
that has previously been associated with TH2-relatedresponses that are induced during pemphigus (17). LASS2 isa ceramide synthase that has previously been shown to influ-ence apoptosis after ionizing irradiation (18) and to play arole in tumor suppression in hepatocellular carcinoma celllines (19). SETDB1 plays a role in trimethylation requiredfor proviral silencing, which would seem a less likely candi-date for influencing CM risk. ARNT is the aryl hydrocarbonnuclear translocator and plays a key role in regulating responseto exogenous compounds that are catabolized by P450enzymes. In summary, this study identified signals in severalchromosomal regions and suggests that candidate genes in-cluding OCA2, HERC2, ARNT, ANXA9 and LASS2 warrantadditional investigations.
MATERIALS AND METHODS
MD Anderson Cancer Center Study
The study participants for the discovery analysis were from ahospital-based case–control study of CM, for which caseswere recruited from non-Hispanic white patients and controlsat MD Anderson between March 1998 and August 2008.Samples and data were available from 931 CM patients and1026 cancer-free controls (friends or acquaintances of patientsreporting to other clinics), who were frequency-matched onage and sex, completed a comprehensive skin lifestyle ques-tionnaire and passed QC filters for genotyping. This question-naire was administered by an interviewer to 70% of patientsand controls and was self-administered for the remaining30%. An additional case series comprising 873 individualspresenting for the treatment for CM at MD Anderson wasalso included, bringing the total number of CM patients to1804. The study protocols were approved by the InstitutionalReview Board at MD Anderson, and informed consent wasobtained from all participants.
Genotyping and data QC
Tissue samples were collected as whole blood, using variousDNA extraction methods (including Gentra, Qiagen andphenol/chloroform). DNA samples for the first-stage GWASwere genotyped with use of the Illumina HumanOmni1-Quad_v1-0_B array and were called using the BeadStudio al-gorithm, at the John Hopkins University Center for InheritedDisease Research (CIDR). We were able to satisfactorilygenotype 1 012 904 of the 1 016 423 SNPs attempted(99.6%) with a mean sample call rate of 99.86% (Supple-mentary Material, Table S1). Supplementary Material,Table S1 summarizes a series of SNP filters applied to theoriginal 1 140 419 SNPs and CNV probes. Before datarelease, 3519 SNPs failed the CIDR QC process with amissing call rate of .5%. SNPs with an MAF of ≤0.01,call rate of ,95% or Hardy–Weinberg equilibrium in con-trols with a P-value of ≤1025 were excluded.
After the above criteria were applied, 818 237 genotypedautosomal or X chromosome SNPs and 740 pseudo-autosomalSNPs were available for the final association analysis. Imput-ation of ungenotyped SNPs in candidate regions (at least twogenotyped SNPs in one region having P , 1024) was
Figure 7. Association tests from four studies using fixed-effects meta-analysisfor a region of chromosome 1 spanning the ARNT/LASS2/ANXA9 region.
5018 Human Molecular Genetics, 2011, Vol. 20, No. 24
Dow
nloaded from https://academ
ic.oup.com/hm
g/article-abstract/20/24/5012/588193 by guest on 05 April 2019

performed for case and control samples with the use of theMACH program (20) using 1000 Genomes CEU (March2010 release) as a reference panel. An additional 12 009SNPs were imputed from those regions. In addition, genome-wide imputation using MACH and Hapmap2 Release 22 usingthe CEU population has been completed and data are availableupon request for 2 373 692 SNPs with r2 . 0.8, with anaverage quality score of 99.35%.For the most significantSNP in the HERC2 region, rs12913832, we performed con-firmatory genotyping of 528 cases and controls usingTaqMan. One subject was misclassified between the two plat-forms, one subject was genotyped as G/G by TaqMan and A/Gby Illumina and one subject could not be genotyped byTaqMan but was found to have the G/G genotype by Illumina.
Of the samples that were genotyped, 41 failed genotypingwith a .10% missing rate across all SNPs; 11 samples hadidentity problems that could not be resolved. For this study,the identity-by-descent (IBD) coefficients were estimatedusing 116 002 autosomal SNPs in PLINK (12) and 5 unexpect-ed duplicates and 15 related samples were removed. In total,126 duplicated (67 expected duplicates), related (IBD) or out-liers identified by PCA were excluded from the study. Afterthese exclusions, 1952 cases and 1026 controls remained. Sup-plementary Material, Table S1 summarizes the whole-samplefilters. From the total 2978 case and control subjects withdata after QC, 138 in situ cases were removed from thestudy because they had indeterminate phenotypes; in addition,10 patients with atypical melanocytic proliferation wereexcluded because they did not have invasive cancers. Datafrom 1804 cases and 1026 controls were analyzed for theassociation study of CM susceptibility.
PCA and population structure of the MD Anderson sample
We used an LD-pruned SNP set provided by the GENEVA(21) coordinating center for PCA adjustment to evaluate popu-lation structure. To select a set of SNPs for identifying popu-lation stratification, GENEVA thinned the initial SNPs toreduce LD to a set of 75 210 SNPs. SNPs were pruned usingpairwise genotypic correlation in PLINK. The pruning proced-ure consisted of two stages. In the first stage, short-range LDwas removed. We used a window size of 50 SNPs with a 5SNP offset and r2 cut-off point of 0.2. For the second stage,we aimed to remove long-range LD. We used a window sizeof 150 SNPs with an offset of 5 Mb and r2 cut-off point of0.2. We adjusted for the first two components from PCA inour GWAS. No other PCs varied significantly between casesand controls. Those two eigenvectors were treated as covari-ables to adjust for population structure among study subjects.The GENEVA coordinating center provided an initial qualityassessment of data and helped to organize the data for submis-sion to dbGAP.
Association analysis of the MD Anderson sample
Association analysis with CM of genotyped SNPs or mostlikely genotypes from the imputation study was performedusing the PLINK –logistic and –covar options (12). A logisticregression model was built to measure the additive effect ofeach SNP on susceptibility to CM. A likelihood ratio test
was performed under the null hypothesis of x2 distributionwith one degree of freedom. The first two PCs were includedto adjust for population structure. Q–Q plots portraying theassociations of markers with CM risk are shown in Supple-mentary Material, Figure S1, including all of the directly gen-otyped markers, and in Supplementary Material, Figure S2after excluding previously identified genes strongly associatedwith CM risk (MC1R and p16/arf). Significant regions withmultiple SNPs that each had a P-value of ,1024 wereselected for further validation in other independent studies.
To evaluate associations with pigmentary phenotypes, weregressed ordinal coding for hair color (1 ¼ blonde, 2 ¼ red,3 ¼ brown and 4 ¼ black), eye color (1 ¼ blue/gray, 2 ¼hazel/green and 3 ¼ brown/black) and frequency of burns ona 1–4 scale (1 ¼ always or usually burn, 2 ¼ moderatelyburn, 3 ¼ minimally burn and 4 ¼ rarely or never burn). Weused linear regression to test the association between minorallele counts and pigmentary phenotypes, and the model wasadjusted for age and sex.
Genomic imputation
MACH was used to impute ungenotyped SNPs in the candi-date regions according to 1000 Genomes Project data. Basedon the reference data with a denser set of markers, thoseuntyped markers can be filled in by means of maximum-likelihood estimation. Imputation was run in one step sinceit was for small candidate regions. A total of 1682 SNPswith P-values of ,1024 were found among 16 regions on12 chromosomes, excluding chromosome 9 near the centro-mere where p16/ARF/CDKN2A is located and chromosome16 near MC1R, each of which contained at least two signifi-cant SNPs. Within a region of 50 kb from each side of thesetop SNPs, untyped genotypes were inferred with the use ofMACH. Finally 12 009 SNPs were obtained with averager2 . 0.875 for those candidate regions. The average posteriorprobability for the most likely genotype was 97.7%. As newerversions of the 1000 Genomes Project become available,better inference from it should be possible.
Further adjustment for population structure in the MDAnderson sample
Because skin pigmentation and CM risk show a North–Southgradient across European populations, and allele frequenciesin genes associated with skin pigmentation also show variationin allele frequencies, confounding between allele frequencyand northern/southern European ancestry is a concern. Wetherefore performed additional studies to characterize theEuropean ethnic background of study participants from MDAnderson and to allow for this inferred ancestry. Results,shown in Figure 4, demonstrate the inferred origins of studyparticipants from MD Anderson according to the first twoPCs. Supplementary Material, Table S7 displays results fromanalyses that were conditioned on the inferred most likely an-cestral origin of each participant. The approach to selectingpopulations for characterizing European ancestry has beenpreviously presented (22). Cases and controls that did notcluster within European ancestry groups were removed fromanalysis. In this analysis, 1795 cases and 931 controls were
Human Molecular Genetics, 2011, Vol. 20, No. 24 5019
Dow
nloaded from https://academ
ic.oup.com/hm
g/article-abstract/20/24/5012/588193 by guest on 05 April 2019

retained, whereas an additional 1587 controls genotyped on610K platforms that had genotypes close to the existingcases according to the first six PCs were used as additionalcontrols in the analysis.
Materials and methods from Harvard cohort studies
We have conducted several GWASs on different disease out-comes [NHS: breast cancer by Illumina 550, and pancreaticcancer by Illumina 550; HPFS: advanced prostate cancer byIllumina 610; both NHS (part of the CGEMS) (23–25) andHPFS: coronary heart disease by Affymetrix 6.0, type 2 dia-betes by Affymetrix 6.0, kidney stone by Illumina 610 andglaucoma by Illumina 660]. We included only controls ineach study, except for the kidney stone study, in which weused both cases and controls. We excluded those with personalhistory of squamous cell carcinoma and basal cell carcinoma.Participants with CM diagnosis were the CM cases in thisstudy, and those without CM diagnosis were the controls. Inaddition, we genotyped the rest of the CM cases identifiedin both cohorts who were not in these previous GWASsby Illumina 610. Finally, we included 494 CM cases and5628 controls.
Based on the genotyped SNPs and haplotype information inthe NCBI Build 35 of phase II Hapmap CEU data, we imputedgenotypes for .2.5 million SNPs using the program MACH(20). Only SNPs with imputation quality r2 . 0.95 and withMAF . 2.5% in each study were included in the final analysis.A total of 1 579 307 (NHS: 1 518 067; HPFS: 1 533 499) SNPswere included in the final meta-analysis of the NHS set andHPFS set.
Information on natural hair color at age 20 years and onchildhood and adolescent tanning tendency was collected inboth the NHS and HPFS prospective questionnaires, and infor-mation on natural eye color was collected in the HPFS only.The summary of the basic information of the five-componentcohort studies used in the GWAS of pigmentation is shownin Supplementary Material, Table S4. The imputed dosagedata on chromosome 15 were used for the association study.We regressed ordinal coding for hair color (1 ¼ blonde, 2 ¼light brown, 3 ¼ dark brown and 4 ¼ black; the participantswith red hair color were excluded from the hair colorGWAS), eye color (1 ¼ blue/light, 2 ¼ hazel/green/medium,3 ¼ brown/dark) and tanning ability (1 ¼ practically none,2 ¼ light tan, 3 ¼ average tan, 4 ¼ deep tan in NHS; and1 ¼ pain: burn/peel, 2 ¼ burn then tan, 3 ¼ tan without burnin HPFS). We used linear regression to test the associationbetween minor allele counts and pigmentary phenotypes, andthe model was adjusted for the first four PCs separately foreach SNP and trait; within-cohort association results werecombined in an inverse variance weighted meta-analysis,and the software METAL (http://www.sph.umich.edu/csg/abecasis/Metal/index.html) was used for the meta-analysisacross the different cohorts that were analyzed. Controllingfor case–control status within each collection (e.g. type 2 dia-betes in the HPFS) made no material difference to results(hence no adjustment was made). A summary of informationfrom the five component studies used for SNP studies ofpigmentation is shown in Supplementary Material, Table S4.
For the study on CM risk, the eligible cases consisted ofparticipants in the NHS and the HPFS with pathologically con-firmed CM, diagnosed any time after the baseline up to the2006 follow-up cycle (for both cohorts), who had no previouslydiagnosed cancer. The controls were randomly selected fromparticipants in the same cohorts who were free of cancer upto their participation and including the questionnaire cycle inwhich the case was diagnosed. In addition, after excludingthe breast cancer cases in the NHS-BC set and the individualsdiagnosed with skin cancer (CM, basal cell carcinoma, orsquamous cell carcinoma), the participants in the fiveGWAS sets mentioned above were also included as controls.All subjects were US non-Hispanic Caucasians. We included585 CM cases (mean age at diagnosis, 61.5 years) and 7363controls. Laboratory personnel were blinded to case–controlstatus, and blinded QC samples were inserted to validate geno-typing procedures; concordance for the blinded samples was100%. Primers, probes and conditions for genotyping assaysare available upon request.
We regressed a binary coding for CM case and control (0 or 1)on each SNP (dosage file used) that passed QC filters. Amongthe 10 largest PCs, the first 5 were significantly associatedwith nevus count at a two-sided alpha of 0.05. Therefore, weadjusted for top five PCs of genetic variation in the regressionmodel along with age. These PCs were calculated for all indivi-duals on the basis of approximately 10 000 unlinked markersusing the EIGENSTRAT software.
In silico replication studies
Confirmatory in silico replication was sought from GenoMEL,Harvard cohorts and the Australian consortium for the top 10SNPs of significance for which another nearby SNP with LDr2 . 0.8 also reached a significance level of ,1024.
Australian sample
DNA was extracted from peripheral blood or saliva samples.Australian twin and endometriosis sample controls were gen-otyped at deCODE Genetics (Reykjavik, Iceland) on the Illu-mina HumanHap610W Quad and Illumina HumanHap660Quad Beadarrays, respectively. AMFS controls were geno-typed by Illumina (San Diego) on Illumina Omni1-Quadarrays. Cases were genotyped by Illumina (San Diego) on Illu-mina Omni1-Quad (568 AMFS cases, 699 Q-MEGA cases)and HumanHap610W Quad arrays (998 Q-MEGA cases).All genotypes were called with the Illumina BeadStudio soft-ware. SNPs with a mean BeadStudio GenCall score ,0.7were excluded from the control data sets. All samples had suc-cessful genotypes for .95% of SNPs. SNPs with call rateseither ,0.95 (MAF . 0.05) or ,0.99 (MAF . 0.01),Hardy–Weinberg equilibrium in controls P , 1026 and/orMAF , 0.01 were excluded. Cryptic relatedness between indi-viduals was assessed through the production of a fullidentity-by-state matrix. Ancestry outliers were identified byPC analysis, using data from 11 populations of the HapMap3 Project and 5 northern European populations genotyped bythe GenomeEUtwin consortium, using the EIGENSOFTpackage. Individuals lying ≥2 standard deviations from themean PC1 and PC2 scores were excluded from subsequent
5020 Human Molecular Genetics, 2011, Vol. 20, No. 24
Dow
nloaded from https://academ
ic.oup.com/hm
g/article-abstract/20/24/5012/588193 by guest on 05 April 2019
analyses. Following these exclusions, there were 2168 casesamples (1242 typed on the Omni1-Quad and 926 typed onthe Hap610 arrays, respectively) and 4387 controls (431typed on the Omni1-Quad and 3956 typed on the Hap610arrays) retained for subsequent analyses (Table 1). Individualstyped on the Omni1-Quad array had genotypes for up to816 169 SNPs, whereas individuals typed on the Hap610/670arrays had genotypes for up to 544 483 SNPs. There were299 394 SNPs passing QC and overlapping between thesearrays (and hence directly genotyped on all Australiansamples).
Imputation for the Australian samples was performed usingMACH (20) with 1000 Genomes Project [June 2010 release]data obtained from people of northern and western European an-cestry collected by the Centre d’Etude du PolymorphismeHumain. Imputation was based on a set of autosomal SNPscommon to all CM case–control samples(n ¼ 292 043). Imputation was run in two stages. First, datafrom a set of representative Australian sample individualswere compared with the phased haplotype data from the 1000Genomes data to generate recombination and error maps. Forthe second stage, data were imputed for all individuals usingthe phased 1000 Genomes data as the reference panel and therecombination as well as error files generated in the first stage.In total, 5 480 804 1000 Genomes SNPs could be imputedwith imputation r2 . 0.5.
Association analysis of genotyped SNPs was performedusing the PLINK –assoc option (12). Analysis of dosagescores from the imputation analysis was done using mach2dat.
GenoMEL sample
The GenoMEL data incorporated in the in silico replicationcame from a GWAS of 2804 cases and 1835 controls forCM collected at 11 different centers across Europe andIsrael. These were genotyped in two phases, phase 1 on theIllumina HumanHap300 BeadChip version 2 duo array(317K SNPs) and phase 2 on the Illumina Human610 quadarray (610K SNPs). These are supplemented by 3878 controlsfrom the WTCCC study [WTCCC (26)] genotyped on the Illu-mina HumanHap1.2 million array and 1905 French controlsgenotyped by Centre National de Genotypage on the IlluminaHumancnv370k array. Individuals were excluded for low callrate (,97% on the array on which the sample was genotyped),non-European ethnicity (determined by PCA), sex discrepancywith recorded phenotype information, first-degree or closerrelatedness with another sample or recommendation for exclu-sion by WTCCC (26). QC was applied to SNPs separately foreach genotyping platform. SNPs were excluded for a low callrate (,97%), Hardy–Weinberg equilibrium P-value of,10220 or recommendation for exclusion by WTCCC(usually on the basis of poor clustering). A trend test wasapplied to each SNP in turn stratified by broad geographicregion (eight regions pre-specified).
WEB RESOURCES
EIGENSOFT: http://genepath.med.harvard.edu/~reich/Software.htm.
MACH: http://www.sph.umich.edu/csg/abecasis/MACH/index.html, release MACH1.016.
1000 Genomes: http://www.1000genomes.org.The genotyping data and phenotypes that have been pre-
sented in this analysis are available online through dbGaP(study accession: phs000187.v1.p1).
Chromosomal region graphs were developed using thesoftware developed by the Diabetes Genome Initiative (http://www.broadinstitute.org/science/projects/diabetes-genetics-initiative/plotting-genome-wide-association-results).
SUPPLEMENTARY MATERIAL
Supplementary Material is available at HMG online.
NOTE ADDED IN PROOF
Dr Houvras brought to our attention an elegant work that wasperformed showing that the SETDB1 gene (which lies withinour region of association on chromosome 1q21.3) acceleratesmelanoma in cooperation with BRAF, increases invasivenessof the lesions and allows cells to bypass a senescence arrest.Therefore, this locus is also an excellent candidate for futurestudies to identify its role in melanoma susceptibility (27).
ACKNOWLEDGEMENTS
We acknowledge with appreciation all of the women whoparticipated in the QIMR, OXEGENE and NHS studies. Wethank Endometriosis Associations for supporting study recruit-ment as well as Sullivan Nicolaides and Queensland MedicalLaboratory for pro bono collection and delivery of bloodsamples and other pathology services associated with bloodcollection. In addition, we thank Margaret J. Wright, MeganJ. Campbell, Anthony Caracella, Margaret Lung, ZhenshengLiu, Yawei Qiao, Min Zhao, Dakai Zhu, B. Haddon,D. Smyth, H. Beeby, O. Zheng and B. Chapman for theirinput into project management, databases, sample processingand genotyping. We are grateful to the many research assis-tants and interviewers for assistance with the studies contrib-uting to the QIMR collection.
Conflict of Interest statement. None declared.
FUNDING
Research at MD Anderson Cancer Center was partiallysupported by NIH grants R01CA100264, 2P50CA093459,P30CA016672, R01CA133996 and by the Marit PetersonFund for Melanoma Research.
The Center for Inherited Disease Research is supported bycontract HHSN268200782096C. Geneva is supported byNIH grant HG004446.
The Australian Twin Registry is supported by an AustralianNational Health and Medical Research Council (NHMRC)Enabling Grant (2004–2009).
The QIMR Study was supported by grants from the Melan-oma Research Alliance, the National Health and MedicalResearch Council (NHMRC) of Australia (241944, 339462,
Human Molecular Genetics, 2011, Vol. 20, No. 24 5021
Dow
nloaded from https://academ
ic.oup.com/hm
g/article-abstract/20/24/5012/588193 by guest on 05 April 2019
389927,389875, 389891, 389892, 389938, 443036, 442915,442981, 496610, 496739, 552485, 552498), the CooperativeResearch Centre for Discovery of Genes for CommonHuman Diseases (CRC), Cerylid Biosciences (Melbourne),and donations from Neville and Shirley Hawkins.
S.M. is supported by NHMRC Career Development Awards(496674, 613705). G.W.M. is supported by the NHMRCFellowships Scheme.
The AMFS study is funded by the National Health andMedical Research Council of Australia (NHMRC) (projectgrants 566946, 107359, 211172 and program grant number402761 to G.J.M. and R.F.K.); the Cancer Council NewSouth Wales (project grant 77/00, 06/10), the CancerCouncil Victoria and the Cancer Council Queensland(project grant 371); and the US National Institutes of Health(via RO1 grant CA-83115-01A2 to the international Melan-oma Genetics Consortium - GenoMEL). A.E.C. is the recipi-ent of an NHMRC public health postdoctoral fellowship(520018) and a National Cancer Institute NSW Early CareerDevelopment Fellowship (10/ECF/2-06). B.K.A.’s researchis supported by a University of Sydney Medical FoundationProgram Grant, and J.L.H. is an Australia Fellow of theNHMRC.
The GenoMEL study was funded by the European Commis-sion under the 6th Framework Programme, contract no:LSHC-CT-2006-018702; by Cancer Research UK ProgrammeAwards, C588/A4994, and C588/A10589, and Cancer Re-search UK Project Grant C8216/A6129; and by US NationalInstitutes of Health R01 CA83115. This research was alsosupported by the Intramural Research Program of the NIH,NCI and DCEG.
Emilia-Romagna: National Cancer Institute grants RO1CA5558 to Maria Teresa Landi.
Genoa: IRCSS 2007 Italian Ministry of Health DGRST.4/4235-P1.9.A.B, Fondazione CARIGE, PRIN 2008 to G.B.-S.
Leeds: Cancer Research UK Programme grants GeneticEpidemiology of Cancer C588/A10589, C588/A4994 andCancer Research UK Project grant C8216/A6129.
Lund: Swedish Cancer Society, Swedish Research Council,Region Skane funds, Kamprad Foundation.
Norway: Grants from the Comprehensive Cancer Center,Oslo University Hospital and the University of Bergen.
Paris: Grants from Institut National du Cancer(INCa-PL016) and Ligue Nationale Contre Le Cancer(PRE05/FD and PRE 09/FD) to Florence Demenais, Pro-gramme Hospitalier de Recherche Clinique (PHRC 2007/AOM-07-195) to Marie-Francoise Avril and Florence Deme-nais, Institut National du Cancer (Melanoma Network RSNumber 13), Association pour la Recherche sur le Cancer(ARC No. A09/5/5003), and Societe Francaise de Dermatolo-gie (SFD2009) to Brigitte Bressac-de Paillerets. BrigitteBressac-de Paillerets has been awarded an INSERM ResearchFellowship for hospital-based scientists.
REFERENCES
1. Siegel, R., Ward, E., Brawley, O. and Jemal, A. (2011) Cancer statistics,2011: the impact of eliminating socioeconomic and racial disparities onpremature cancer deaths. CA Cancer J. Clin., 61, 212–236.
2. Cust, A.E., Schmid, H., Maskiell, J.A., Jetann, J., Ferguson, M., Holland,E.A., Agha-Hamilton, C., Jenkins, M.A., Kelly, J., Kefford, R.F. et al.(2009) Population-based, case-control-family design to investigate geneticand environmental influences on melanoma risk: Australian MelanomaFamily Study. Am. J. Epidemiol., 170, 1541–1554.
3. Meyle, K.D. and Guldberg, P. (2009) Genetic risk factors for melanoma.Hum. Genet., 126, 499–510.
4. Bishop, D.T., Demenais, F., Iles, M.M., Harland, M., Taylor, J.C., Corda,E., Randerson-Moor, J., Aitken, J.F., Avril, M.F., Azizi, E. et al. (2009)Genome-wide association study identifies three loci associated withmelanoma risk. Nat. Genet., 41, 920–925.
5. Sturm, R.A., Duffy, D.L., Zhao, Z.Z., Leite, F.P., Stark, M.S., Hayward,N.K., Martin, N.G. and Montgomery, G.W. (2008) A single SNP in anevolutionary conserved region within intron 86 of the HERC2 genedetermines human blue-brown eye color. Am. J. Hum. Genet., 82,424–431.
6. Fargnoli, M.C., Argenziano, G., Zalaudek, I. and Peris, K. (2006) High-and low-penetrance cutaneous melanoma susceptibility genes. Expert Rev.Anticancer Ther., 6, 657–670.
7. Kanetsky, P.A., Rebbeck, T.R., Hummer, A.J., Panossian, S., Armstrong,B.K., Kricker, A., Marrett, L.D., Millikan, R.C., Gruber, S.B., Culver,H.A. et al. (2006) Population-based study of natural variation in themelanocortin-1 receptor gene and melanoma. Cancer Res., 66, 9330–9337.
8. Pho, L., Grossman, D. and Leachman, S.A. (2006) Melanoma genetics: areview of genetic factors and clinical phenotypes in familial melanoma.Curr. Opin. Oncol., 18, 173–179.
9. Gudbjartsson, D.F., Sulem, P., Stacey, S.N., Goldstein, A.M., Rafnar, T.,Sigurgeirsson, B., Benediktsdottir, K.R., Thorisdottir, K., Ragnarsson, R.,Sveinsdottir, S.G. et al. (2008) ASIP and TYR pigmentation variantsassociate with cutaneous melanoma and basal cell carcinoma (vol 40, pg886, 2008). Nat. Genet., 40, 1029.
10. Sulem, P., Gudbjartsson, D.F., Stacey, S.N., Helgason, A., Rafnar, T.,Magnusson, K.P., Manolescu, A., Karason, A., Palsson, A., Thorleifsson,G. et al. (2007) Genetic determinants of hair, eye and skin pigmentation inEuropeans. Nat. Genet., 39, 1443–1452.
11. Brown, K.M., Macgregor, S., Montgomery, G.W., Craig, D.W., Zhao,Z.Z., Iyadurai, K., Henders, A.K., Homer, N., Campbell, M.J., Stark, M.et al. (2008) Common sequence variants on 20q11.22 confer melanomasusceptibility. Nat. Genet., 40, 838–840.
12. Purcell, S., Neale, B., Todd-Brown, K., Thomas, L., Ferreira, M.A.R.,Bender, D., Maller, J., Sklar, P., de Bakker, P.I.W., Daly, M.J. and Sham,P.C. (2007) PLINK: A tool set for whole-genome association andpopulation-based linkage analyses 1. Am. J. Hum. Genet., 81, 559–575.
13. Duffy, D.L., Zhao, Z.Z., Sturm, R.A., Hayward, N.K., Martin, N.G. andMontgomery, G.W. (2010) Multiple pigmentation gene polymorphismsaccount for a substantial proportion of risk of cutaneous malignantmelanoma. J. Invest. Dermatol., 130, 520–528.
14. Cann, H.M., de Toma, C., Cazes, L., Legrand, M.F., Morel, V., Piouffre,L., Bodmer, J., Bodmer, W.F., Bonne-Tamir, B., Cambon-Thomsen, A.et al. (2002) A human genome diversity cell line panel. Science, 296,261–262.
15. Bekker-Jensen, S., Rendtlew, D.J., Fugger, K., Gromova, I., Nerstedt, A.,Lukas, C., Bartek, J., Lukas, J. and Mailand, N. (2010) HERC2coordinates ubiquitin-dependent assembly of DNA repair factors ondamaged chromosomes. Nat. Cell Biol., 12, 80–86.
16. Kang, T.H., Lindsey-Boltz, L.A., Reardon, J.T. and Sancar, A. (2010)Circadian control of XPA and excision repair of cisplatin-DNA damageby cryptochrome and HERC2 ubiquitin ligase. Proc. Natl Acad. Sci. USA,107, 4890–4895.
17. Caproni, M., Giomi, B., Cardinali, C., Salvatore, E., Pestelli, E., D’Agata,A., Bianchi, B., Toto, P., Feliciani, C. and Fabbri, P. (2001) Furthersupport for a role for Th2-like cytokines in blister formation ofpemphigus. Clin. Immunol., 98, 264–271.
18. Mesicek, J., Lee, H., Feldman, T., Jiang, X., Skobeleva, A., Berdyshev,E.V., Haimovitz-Friedman, A., Fuks, Z. and Kolesnick, R. (2010)Ceramide synthases 2, 5, and 6 confer distinct roles in radiation-inducedapoptosis in HeLa cells. Cell. Signal., 22, 1300–1307.
19. Tang, N., Jin, J., Deng, Y., Ke, R.H., Shen, Q.J., Fan, S.H. and Qin, W.X.(2010) LASS2 interacts with V-ATPase and inhibits cell growth ofhepatocellular carcinoma. Sheng Li Xue Bao, 62, 196–202.
20. Li, Y. and Abecasis, G. (2006) Mach 1.0: rapid haplotype reconstructionand missing genotype inference. Am. J. Hum. Genet., S79, 2290.
5022 Human Molecular Genetics, 2011, Vol. 20, No. 24
Dow
nloaded from https://academ
ic.oup.com/hm
g/article-abstract/20/24/5012/588193 by guest on 05 April 2019

21. Cornelis, M.C., Agrawal, A., Cole, J.W., Hansel, N.N., Barnes, K.C.,Beaty, T.H., Bennett, S.N., Bierut, L.J., Boerwinkle, E., Doheny, K.F.et al. (2010) The Gene, environment association studies consortium(GENEVA): maximizing the knowledge obtained from GWAS bycollaboration across studies of multiple conditions. Genet. Epidemiol., 34,364–372.
22. Tian, C., Kosoy, R., Nassir, R., Lee, A., Villoslada, P., Klareskog, L.,Hammarstrom, L., Garchon, H.J., Pulver, A.E., Ransom, M. et al. (2009)European population genetic substructure: further definition of ancestryinformative markers for distinguishing among diverse European ethnicgroups. Mol. Med., 15, 371–383.
23. Han, J., Kraft, P., Nan, H., Guo, Q., Chen, C., Qureshi, A., Hankinson,S.E., Hu, F.B., Duffy, D.L., Zhao, Z.Z. et al. (2008) A genome-wideassociation study identifies novel alleles associated with hair color andskin pigmentation. PLoS Genet., 4, e1000074.
24. Nan, H., Kraft, P., Qureshi, A.A., Guo, Q., Chen, C., Hankinson, S.E., Hu,F.B., Thomas, G., Hoover, R.N., Chanock, S. et al. (2009) Genome-wideassociation study of tanning phenotype in a population of Europeanancestry. J. Invest. Dermatol., 129, 2250–2257.
25. Hunter, D.J., Kraft, P., Jacobs, K.B., Cox, D.G., Yeager, M., Hankinson,S.E., Wacholder, S., Wang, Z., Welch, R., Hutchinson, A. et al. (2007) Agenome-wide association study identifies alleles in FGFR2 associated withrisk of sporadic postmenopausal breast cancer. Nat. Genet., 39, 870–874.
26. WTCCC (2007) Genome-wide association study of 14 000 cases of sevencommon diseases and 3000 shared controls. Nature, 447, 661–678.
27. Ceol, C.J., Houvras, Y., Jane-Valbuena, J., Bilodeau, S., Orlando, D.A.,Battisti, V., Fritsch, L., Lin, W.M., Hollmann, T.J., Ferre, F. et al. (2011)The histone methyltransferase SETDB1 is recurrently amplified inmelanoma and accelerates its onset. Nature, 471, 513–517.
APPENDIX
MEMBERS OF THE GENOMEL COLLABORATION
Australian Melanoma Family Study (AMFS): Graham J. Mann, John
L. Hopper, Joanne F. Aitken, Bruce K. Armstrong, Graham G. Giles,
Richard F. Kefford, Anne E. Cust, Mark A. Jenkins, Helen Schmid.
Barcelona: The participants of GenoMEL in Barcelona: Paula Agui-
lera, Celia Badenas, Cristina Carrera, Francisco Cuellar, Daniel
Gabriel, Estefania Martinez, Melinda Gonzalez, Pablo Iglesias, Josep
Malvehy, Rosa Marti-Laborda, Montse Mila, Zighe Ogbah,
Joan-Anton Puig Butille, Susana Puig, and other members of the Mel-
anoma Unit: Llucia Alos, Ana Arance, Pedro Arguıs, Antonio Campo,
Teresa Castel, Carlos Conill, Jose Palou, Ramon Rull, Marcelo
Sanchez, Sergi Vidal-Sicart, Antonio Vilalta and Ramon Vilella.
Brisbane: The Queensland study of Melanoma: Environmental and
Genetic Associations (Q-MEGA) Principal Investigators: Nicholas
G. Martin, Grant W. Montgomery, David L. Duffy, David C. White-
man, Stuart MacGregor and Nicholas K. Hayward.
The Australian Cancer Study (ACS) Principal Investigators: David
Whiteman, Penny Webb, Adele Green, Peter Parsons, David Purdie
and Nicholas Hayward.
Emilia-Romagna: Maria Teresa Landi, Donato Calista, Giorgio
Landi, Paola Minghetti, Fabio Arcangeli and Pier Alberto Bertazzi.
Genoa: Department of Internal Medicine (DIMI), University of
Genoa: Giovanna Bianchi-Scarra, Paola Ghiorzo, Lorenza Pastorino,
William Bruno, Linda Battistuzzi, Sara Gargiulo, Sabina Nasti, Sara
Gliori, Paola Origone, Virginia Andreotti. Medical Oncology Unit,
National Institute for Cancer Research: Paola Queirolo.
Glasgow: Rona Mackie, Julie Lang.
Leeds: Julia A. Newton Bishop, Paul Affleck, Jennifer H. Barrett,
D. Timothy Bishop, Jane Harrison, Mark M. Iles, Juliette Randerson-
Moor, Mark Harland, John C. Taylor, Linda Whittaker, Kairen
Kukalizch, Susan Leake, Birute Karpavicius, Sue Haynes, Tricia
Mack, May Chan, Yvonne Taylor, John Davies and Paul King.
Leiden: Department of Dermatology, Leiden University Medical
Centre: Nelleke A. Gruis, Frans A. van Nieuwpoort, Coby Out,
Clasine van der Drift, Wilma Bergman, Nicole Kukutsch and Jan
Nico Bouwes Bavinck. Department of Clinical Genetics, Centre of
Human and Clinical Genetics, Leiden University Medical Centre:
Bert Bakker, Nienke van der Stoep, Jeanet ter Huurne. Department
of Dermatology, HAGA Hospital, The Hague: Han van der Rhee.
Department of Dermatology, Reinier de Graaf Groep, Delft: Marcel
Bekkenk. Department of Dermatology, Sint Franciscus Gasthuis,
Rotterdam: Dyon Snels, Marinus van Praag. Department of Derma-
tology, Ghent University Hospital, Ghent, Belgium: Lieve Brochez
and colleagues. Department of Dermatology, St Radboud University
Medical Centre, Nijmegen: Rianne Gerritsen and colleagues. Depart-
ment of Dermatology, Rijnland Hospital, Leiderdorp: Marianne
Crijns and colleagues. Dutch Patient Organization, Stichting Mela-
noom, Purmerend. The Netherlands Foundation for the Detection of
Hereditary Tumors, Leiden: Hans Vasen.
Lund: Lund Melanoma Study Group: Hakan Olsson, Christian
Ingvar, Goran Jonsson, Ake Borg, Anna Masback, Lotta Lundgren,
Katja Baeckenhorn, Kari Nielsen, Anita Schmidt Casslen.
Norway: Oslo University Hospital: Per Helsing, Per Arne Andre-
sen, Helge Rootwelt.
University of Bergen: Lars A. Akslen, Anders Molven.
Paris: Marie-Francoise Avril, Brigitte Bressac-de Paillerets,
Valerie Chaudru, Nicolas Chateigner, Eve Corda, Patricia Jeannin,
Fabienne Lesueur, Mahaut de Lichy, Eve Maubec, Hamida
Mohamdi, Florence Demenais, and the French Family Study Group
including the following oncogeneticists and dermatologists: Pascale
Andry-Benzaquen, Bertrand Bachollet, Frederic Berard, Pascaline
Berthet, Francoise Boitier, Valerie Bonadona, Jean-Louis Bonafe,
Jean-Marie Bonnetblanc, Frederic Cambazard, Olivier Caron, Fred-
eric Caux, Jacqueline Chevrant-Breton, Agnes Chompret (deceased),
Stephane Dalle, Liliane Demange, Olivier Dereure, Martin-Xavier
Dore, Marie-Sylvie Doutre, Catherine Dugast, Laurence Faivre,
Florent Grange, Philippe Humbert, Pascal Joly, Delphine Kerob,
Christine Lasset, Marie Therese Leccia, Gilbert Lenoir, Dominique
Leroux, Julien Levang, Dan Lipsker, Sandrine Mansard, Ludovic
Martin, Tanguy Martin-Denavit, Christine Mateus, Jean-Loıc
Michel, Patrice Morel, Laurence Olivier-Faivre, Jean-Luc Perrot,
Caroline Robert, Sandra Ronger-Savle, Bruno Sassolas, Pierre Sou-
teyrand, Dominique Stoppa-Lyonnet, Luc Thomas, Pierre Vabres
and Eva Wierzbicka.
Philadelphia: David Elder, Peter Kanetsky, Jillian Knorr, Michael
Ming, Nandita Mitra, Althea Ruffin and Patricia Van Belle.
Poland: Tadeusz Debniak, Jan Lubinski, Aneta Mirecka and
Sławomir Ertmanski.
Slovenia: Srdjan Novakovic, Marko Hocevar, Barbara Peric and
Petra Cerkovnik.
Stockholm: Veronica Hoiom and Johan Hansson.
Sydney: Graham J. Mann, Richard F. Kefford, Helen Schmid and
Elizabeth A. Holland.
Tel Aviv: Esther Azizi, Gilli Galore-Haskel, Eitan Friedman, Orna
Baron-Epel, Alon Scope, Felix Pavlotsky, Emanuel Yakobson, Irit
Cohen-Manheim, Yael Laitman, Roni Milgrom, Iris Shimoni and
Evgeniya Kozlovaa.
See also: www.GenoMEL.org.
Human Molecular Genetics, 2011, Vol. 20, No. 24 5023
Dow
nloaded from https://academ
ic.oup.com/hm
g/article-abstract/20/24/5012/588193 by guest on 05 April 2019