Genie Explorer Manual 1.01 - OptiGene · profile on the computer. The default location is set...
23
Genie Explorer User Manual (Software Version v2.0.6.3) ®
Transcript of Genie Explorer Manual 1.01 - OptiGene · profile on the computer. The default location is set...

Genie Explorer
User Manual (Software Version v2.0.6.3)
®

Unit 5, Blatchford Road
Horsham
West Sussex
RH13 5QR
United Kingdom
Tel: +44 (0) 1403-274980
Fax: +44 (0) 1403-271017
www.optigene.co.uk
If you have any feedback or comments about the instrument please email:
Information in this document is subject to change without notice.
OptiGene Ltd. assumes no responsibility for any errors that may appear in this document. This document is believed
to be complete and accurate at the time of publication.
In no event shall OptiGene Ltd. be liable for incidental, multiple, or consequential damages in connection with or
arising from use of this document.
INSTALLATION .................................... 3
GENIE® EXPLORER .............................. 6
Main Menu ........................................ 6
New Profile ........................................ 7
Thermal Profile .............................. 8
Graph Options .............................. 11
Channels ..................................... 12
Notes ............................................ 12
View Active Runs ............................. 13
Profile ........................................... 13
Temperature ................................ 14
Amplification ................................ 14
Amplification Rate ....................... 14
Anneal .......................................... 15
Anneal Derivative......................... 16
Result ........................................... 16
Analysis & Graph Options ................ 18
File .................................................... 19
Service .............................................. 20
Batch Export..................................... 20
Default Directory Options ................ 21
Table of Contents

Version 1.00
3
INSTALLATION
The Genie® range are standalone instruments; however, for software updates, data upload and
additional analysis, it will need to be connected to a PC running Microsoft Windows (XP, Vista
& 7).
Disclaimer: Genie® Explorer is an additional tool and should not be used for patient care or
clinical analysis.
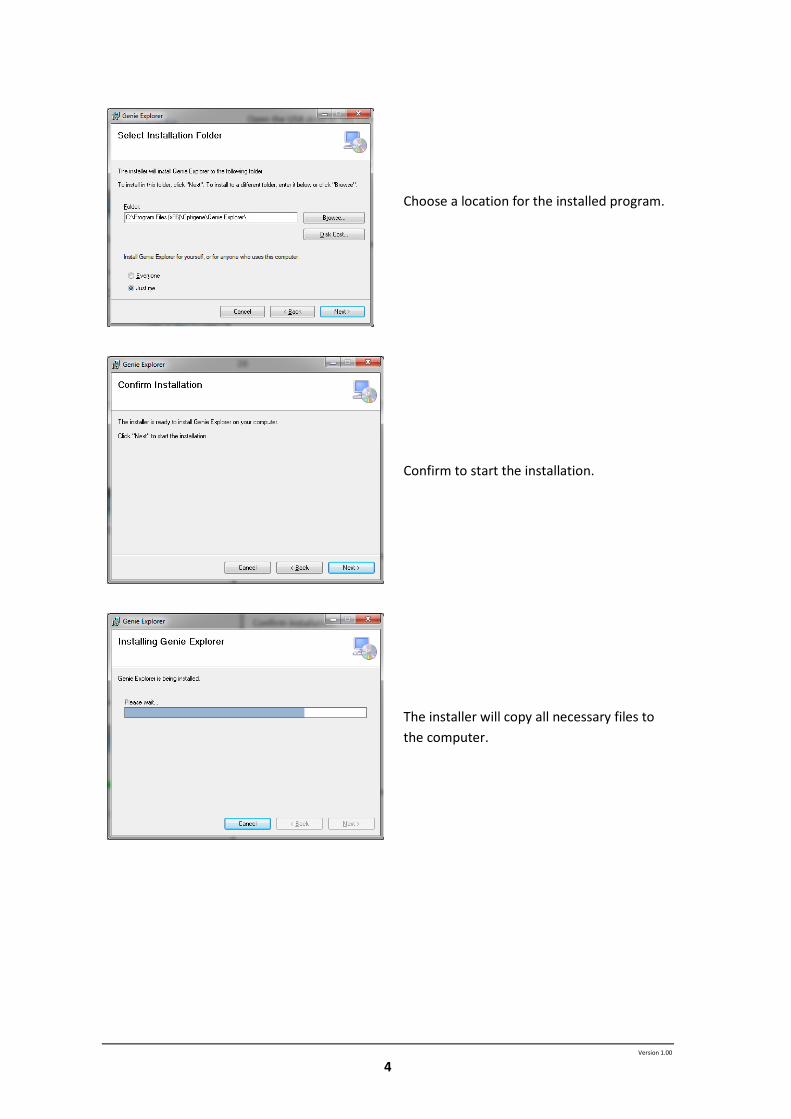
IMPORTANT! Do not plug any Genie® instrument into the computer before installing
Genie® Explorer. Genie® Explorer can be installed from the USB drive included with any Genie®
Instrument.
Open the USB drive in ‘My Computer’.
Run the file ‘GenieInstall.msi’.
Follow the onscreen instructions.
*A prompt may appear requesting
installation of .NET Framework 4.0. This
must be installed prior to installation.
Follow the link to the Microsoft download
page.
http://www.microsoft.com/en-
gb/download/details.aspx?id=17718
Chapter
1 Chapter
1
Version 1.00
4
Choose a location for the installed program.
Confirm to start the installation.
The installer will copy all necessary files to
the computer.

Version 1.00
5
Once the installation is complete, exit by
clicking ‘Close’.
A Genie® instrument can now be connected to the computer. When connected via USB and
switched on, the Genie® instrument will appear as a USB drive and will be accessible from
Genie® Explorer.

Version 1.00
6
GENIE® EXPLORER
In addition to standalone operation, Genie® instruments can be run and completely controlled
by a computer and the results data then stored and analysed. The software that supports
remote operation is called Genie® Explorer and is included on the OptiGene USB memory stick
that is included with the Genie® instrument (installation instruments are in chapter 6).
Disclaimer: Genie® Explorer is an additional tool and should not be used for patient care or
clinical analysis.
To run Genie® Explorer, double click on the icon on the desktop or run from the ‘Start Menu’.
MAIN MENU
When the program has loaded, the first screen that will be displayed is the main menu where
there are several options. ‘New Profile’, ‘View Open Profiles’, ‘View Active Runs’, ‘File’,
‘Service’, ‘Batch Export’, and ‘Default Directory Options’.
Chapter
2
Version 1.00
7
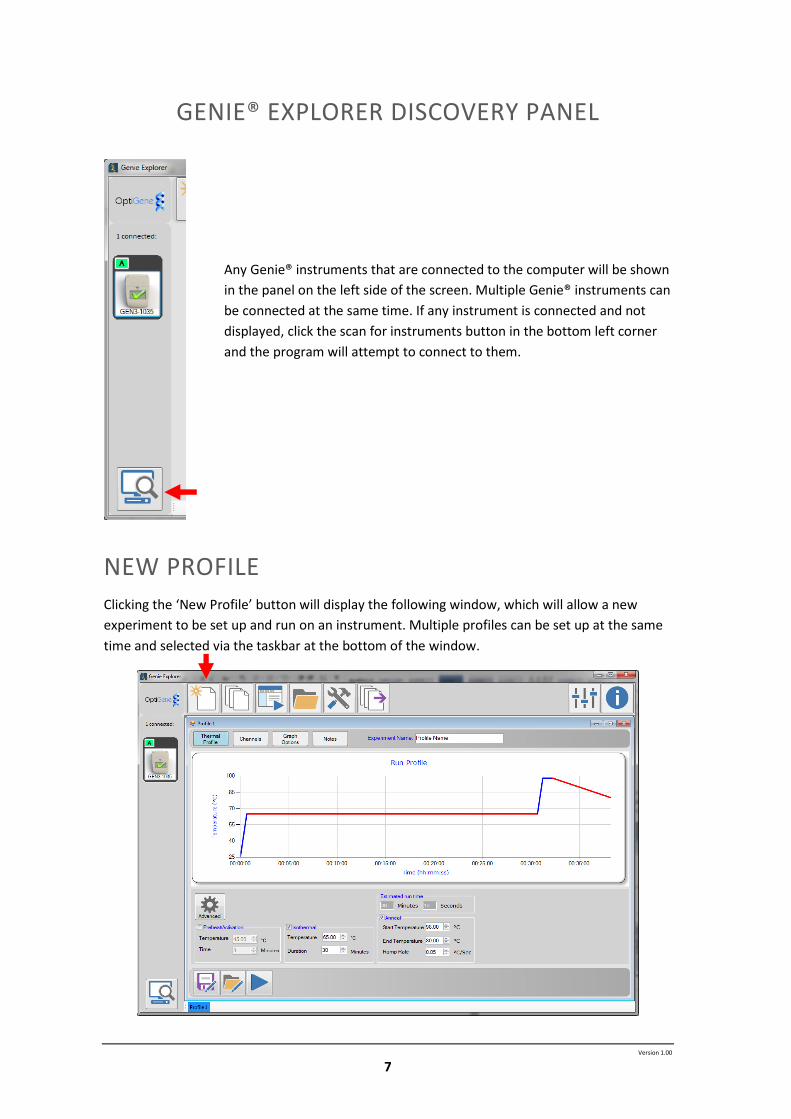
GENIE® EXPLORER DISCOVERY PANEL
Any Genie® instruments that are connected to the computer will be shown
in the panel on the left side of the screen. Multiple Genie® instruments can
be connected at the same time. If any instrument is connected and not
displayed, click the scan for instruments button in the bottom left corner
and the program will attempt to connect to them.
NEW PROFILE
Clicking the ‘New Profile’ button will display the following window, which will allow a new
experiment to be set up and run on an instrument. Multiple profiles can be set up at the same
time and selected via the taskbar at the bottom of the window.
Version 1.00
8
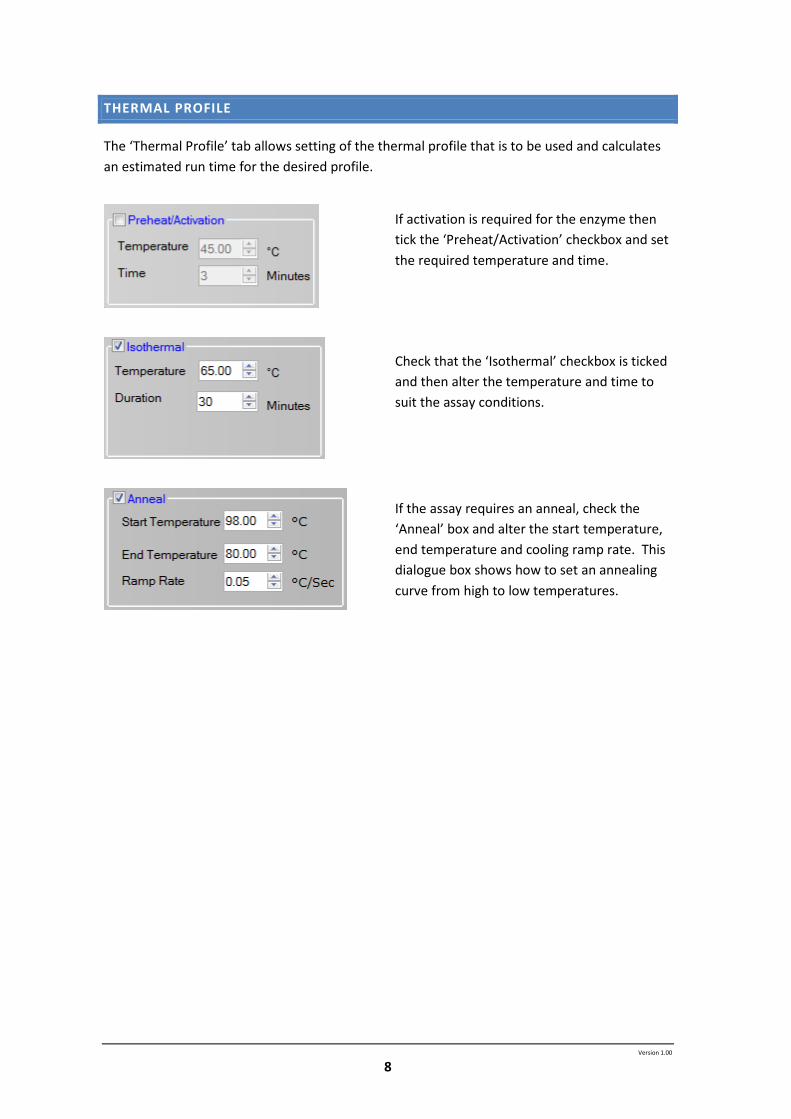
THERMAL PROFILE
The ‘Thermal Profile’ tab allows setting of the thermal profile that is to be used and calculates
an estimated run time for the desired profile.
If activation is required for the enzyme then
tick the ‘Preheat/Activation’ checkbox and set
the required temperature and time.
Check that the ‘Isothermal’ checkbox is ticked
and then alter the temperature and time to
suit the assay conditions.
If the assay requires an anneal, check the
‘Anneal’ box and alter the start temperature,
end temperature and cooling ramp rate. This
dialogue box shows how to set an annealing
curve from high to low temperatures.
Version 1.00
9
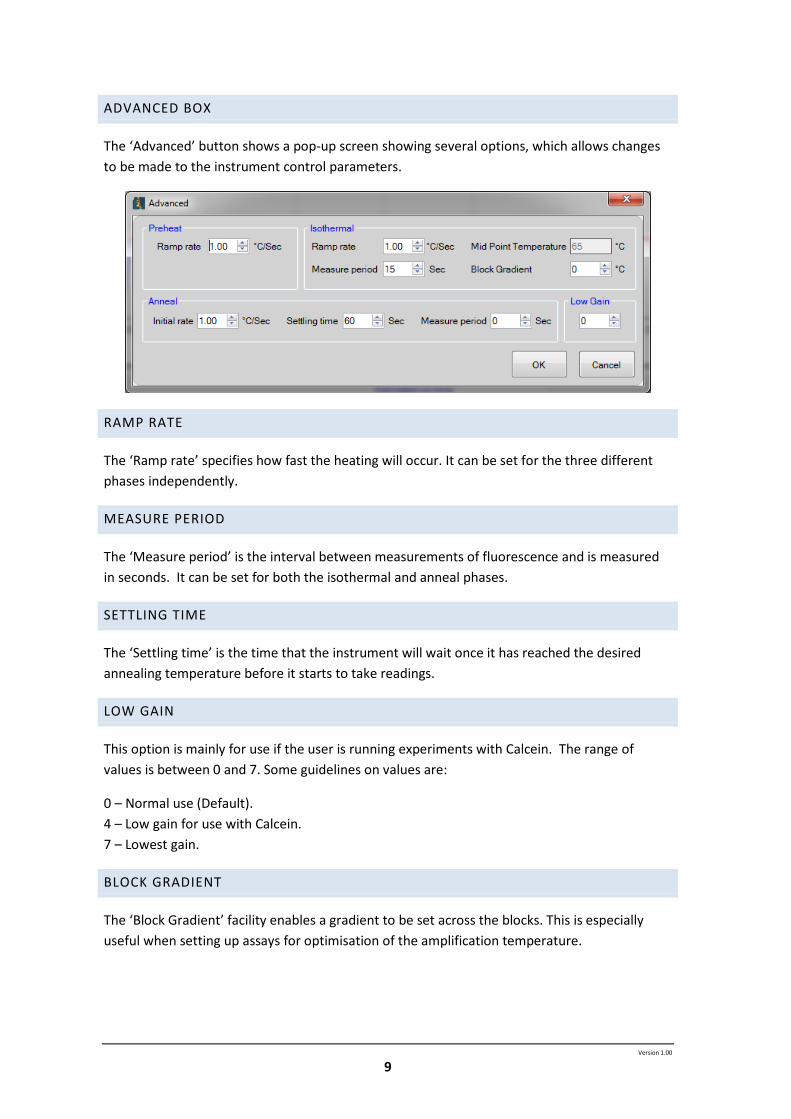
ADVANCED BOX
The ‘Advanced’ button shows a pop-up screen showing several options, which allows changes
to be made to the instrument control parameters.
RAMP RATE
The ‘Ramp rate’ specifies how fast the heating will occur. It can be set for the three different
phases independently.
MEASURE PERIOD
The ‘Measure period’ is the interval between measurements of fluorescence and is measured
in seconds. It can be set for both the isothermal and anneal phases.
SETTLING TIME
The ‘Settling time’ is the time that the instrument will wait once it has reached the desired
annealing temperature before it starts to take readings.
LOW GAIN
This option is mainly for use if the user is running experiments with Calcein. The range of
values is between 0 and 7. Some guidelines on values are:
0 – Normal use (Default).
4 – Low gain for use with Calcein.
7 – Lowest gain.
BLOCK GRADIENT
The ‘Block Gradient’ facility enables a gradient to be set across the blocks. This is especially
useful when setting up assays for optimisation of the amplification temperature.

Version 1.00
10
Example of setting up a gradient:
Set temperature of the midpoint of the
block as the temperature of the
‘Isothermal’ stage on the Temperature
Profile screen.
Then set the temperature range for the
block, by adjusting the ‘Block Gradient’
parameter. For example, if the midpoint
temperature is set to 63.5°C, and the
gradient is set to 7°C, that will set well 1
to 60°C, well 2 to 61
°C, etc. through to
67°C in well 8.
SAVE
Profiles can be saved in order to repeat experiments. Clicking the ‘Save’ button will store the
profile on the computer. The default location is set within Genie® Explorer, and can be changed
if desired. Any saved profiles from Genie® Explorer can also be copied to a Genie® instrument’s
internal memory and run directly from the instrument. Copy the saved profile to the ‘Profile’
folder on the Genie® instrument and then access it on the instrument as normal.
OPEN
Any saved profiles from either Genie® Explorer or a Genie® instrument can be run from Genie®
Explorer. Navigate to the profile file, select it and all the parameters will be loaded in.
RUN
Pressing ‘Run’ will start the experiment.
On clicking ‘Run’ this box will appear. This
allows selection of which block is being
used and also options for saving of the
run file. The default location for saving
the files is set within Genie® Explorer, and
can be changed in ‘Options’.
If the Genie® instrument only has one
block, then only block A will be
selectable.
Version 1.00
11
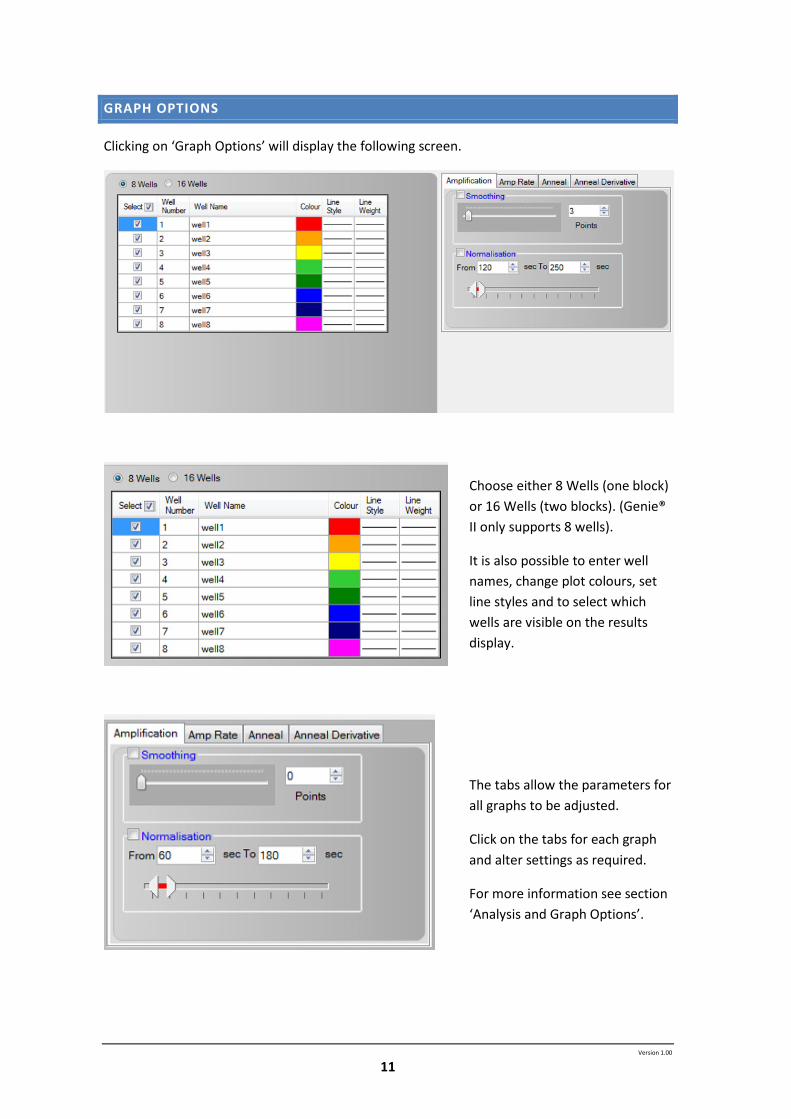
GRAPH OPTIONS
Clicking on ‘Graph Options’ will display the following screen.
Choose either 8 Wells (one block)
or 16 Wells (two blocks). (Genie®
II only supports 8 wells).
It is also possible to enter well
names, change plot colours, set
line styles and to select which
wells are visible on the results
display.
The tabs allow the parameters for
all graphs to be adjusted.
Click on the tabs for each graph
and alter settings as required.
For more information see section
‘Analysis and Graph Options’.

Version 1.00
12
CHANNELS
If the Genie® instrument supports multiple channels, such as the Genie® III, the ‘Channels’
button will be available.
Select which channels are to be used
in the profile by checking the
corresponding tick box.
NOTES
Clicking on the ’Notes’ button allows
experimental notes to be entered and
saved as part of the profile.
Version 1.00
13
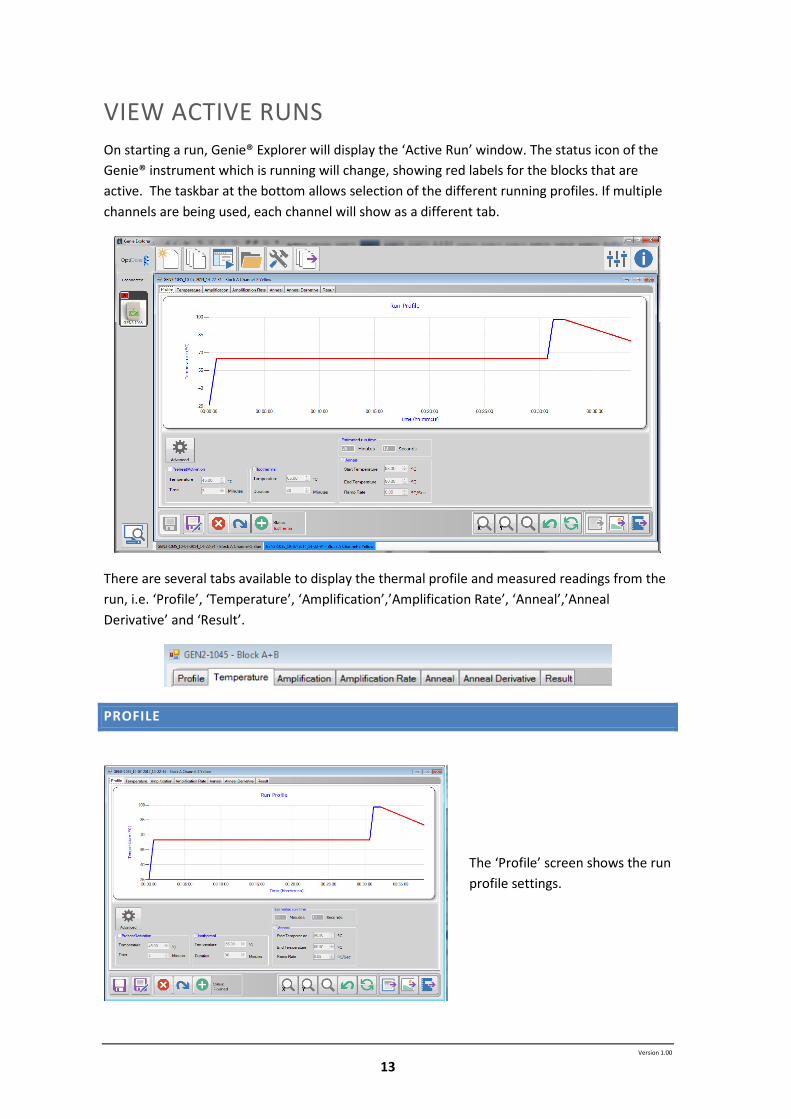
VIEW ACTIVE RUNS
On starting a run, Genie® Explorer will display the ‘Active Run’ window. The status icon of the
Genie® instrument which is running will change, showing red labels for the blocks that are
active. The taskbar at the bottom allows selection of the different running profiles. If multiple
channels are being used, each channel will show as a different tab.
There are several tabs available to display the thermal profile and measured readings from the
run, i.e. ‘Profile’, ‘Temperature’, ‘Amplification’,’Amplification Rate’, ‘Anneal’,’Anneal
Derivative’ and ‘Result’.
PROFILE
The ‘Profile’ screen shows the run
profile settings.

Version 1.00
14
TEMPERATURE
The ‘Temperature’ screen
displays the measured
temperatures of the blocks and
the heated lids plotted against
time.
AMPLIFICATION
The ‘Amplification’ screen
displays the fluorescence
measurements for each well
made during the Amplification
phase plotted against time.
AMPLIFICATION RATE
‘Isothermal Ratio’ shows the
amplification take off time
during the Amplification
phase.
Isothermal Ratio peak time is
similar to the Ct or Cq values
in qPCR assays.
Genie® Explorer can detect the trace peaks and report them automatically. To access the graph
options click ‘Settings’ on the graph and a side panel will appear.
Version 1.00
15
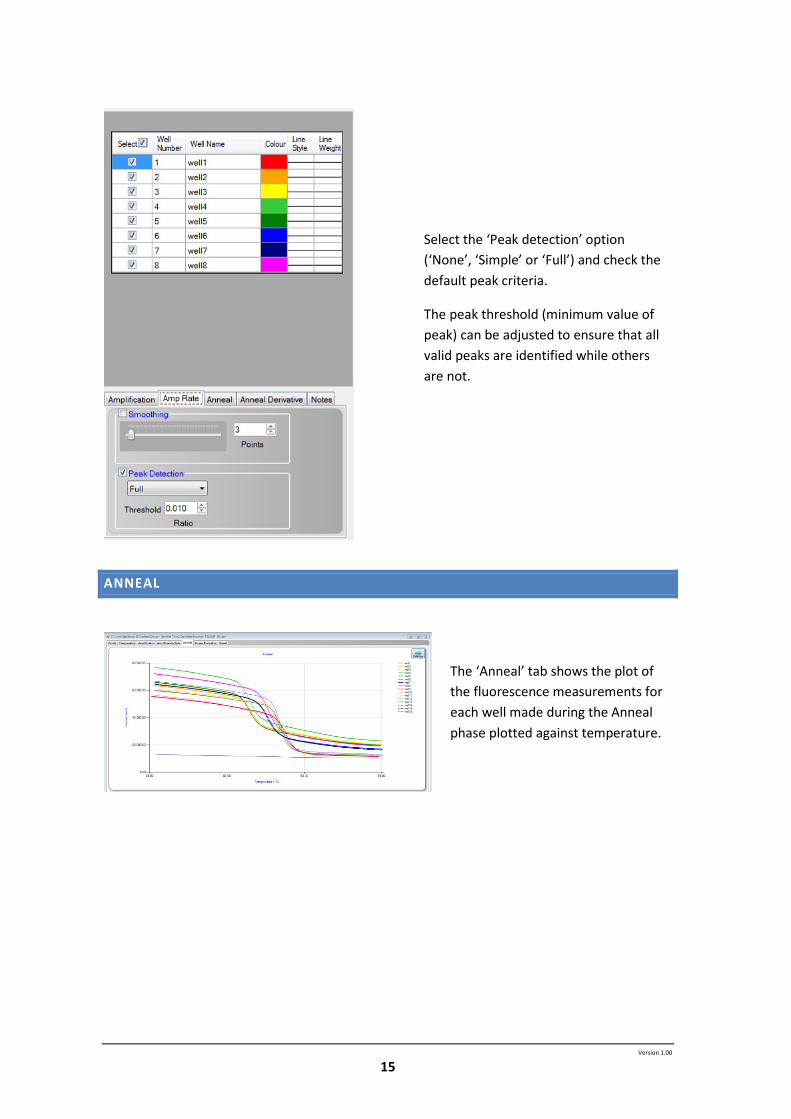
Select the ‘Peak detection’ option
(‘None’, ‘Simple’ or ‘Full’) and check the
default peak criteria.
The peak threshold (minimum value of
peak) can be adjusted to ensure that all
valid peaks are identified while others
are not.
ANNEAL
The ‘Anneal’ tab shows the plot of
the fluorescence measurements for
each well made during the Anneal
phase plotted against temperature.
Version 1.00
16
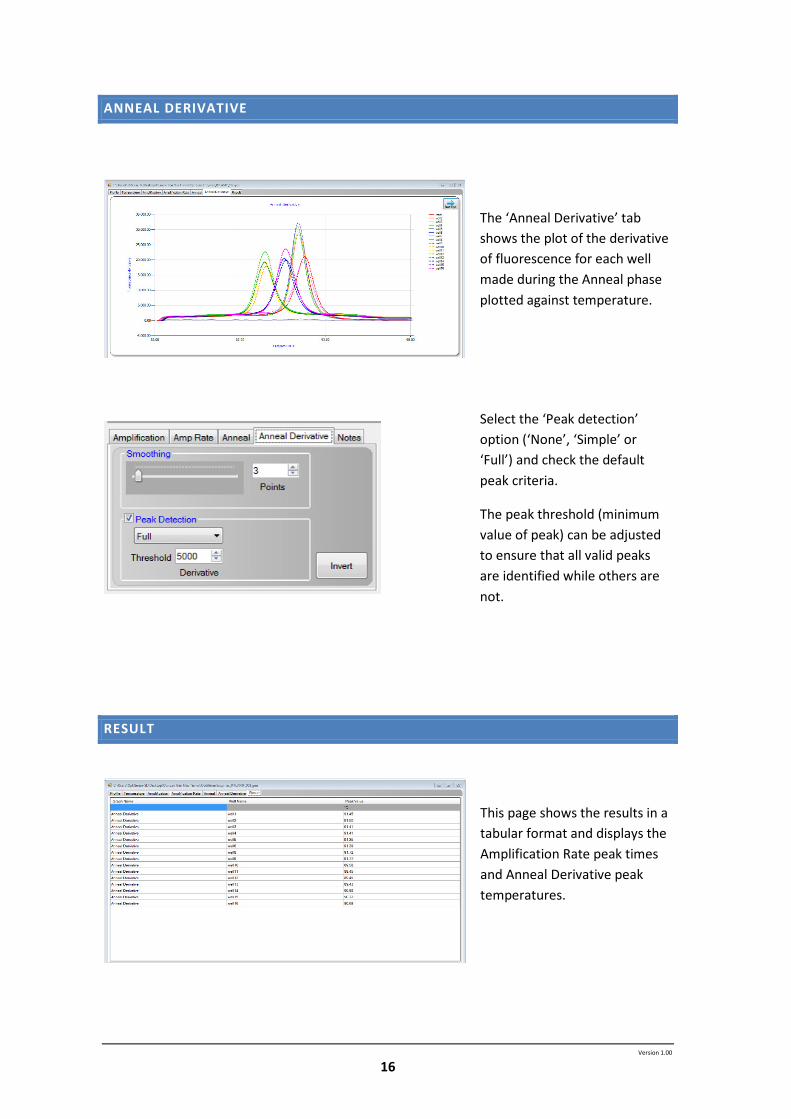
ANNEAL DERIVATIVE
The ‘Anneal Derivative’ tab
shows the plot of the derivative
of fluorescence for each well
made during the Anneal phase
plotted against temperature.
Select the ‘Peak detection’
option (‘None’, ‘Simple’ or
‘Full’) and check the default
peak criteria.
The peak threshold (minimum
value of peak) can be adjusted
to ensure that all valid peaks
are identified while others are
not.
RESULT
This page shows the results in a
tabular format and displays the
Amplification Rate peak times
and Anneal Derivative peak
temperatures.
Version 1.00
17
ADDITIONAL TOOLS
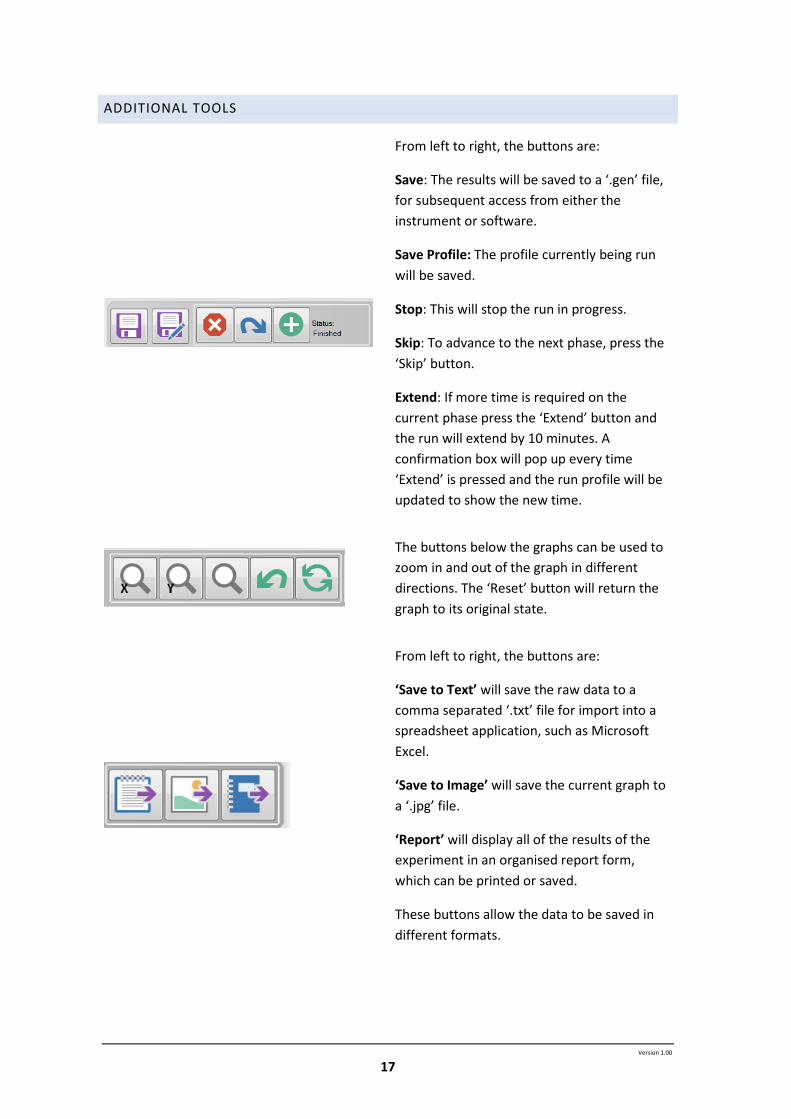
From left to right, the buttons are:
Save: The results will be saved to a ‘.gen’ file,
for subsequent access from either the
instrument or software.
Save Profile: The profile currently being run
will be saved.
Stop: This will stop the run in progress.
Skip: To advance to the next phase, press the
‘Skip’ button.
Extend: If more time is required on the
current phase press the ‘Extend’ button and
the run will extend by 10 minutes. A
confirmation box will pop up every time
‘Extend’ is pressed and the run profile will be
updated to show the new time.
The buttons below the graphs can be used to
zoom in and out of the graph in different
directions. The ‘Reset’ button will return the
graph to its original state.
From left to right, the buttons are:
‘Save to Text’ will save the raw data to a
comma separated ‘.txt’ file for import into a
spreadsheet application, such as Microsoft
Excel.
‘Save to Image’ will save the current graph to
a ‘.jpg’ file.
‘Report’ will display all of the results of the
experiment in an organised report form,
which can be printed or saved.
These buttons allow the data to be saved in
different formats.

Version 1.00
18
ANALYSIS & GRAPH OPTIONS
Click the ‘Settings’ button on a graph and Genie® Explorer will display the graph options for
that graph. From this window several aspects of the graphical information can be modified.
SMOOTHING
Smoothing can be applied to all of the graphs.
Drag the slider or change the ‘Points’ value to
set the number of readings that are averaged
to create a data point on the graph.
NORMALISATION
Normalisation allows all the fluorescent
signals to have their background level
removed, calculated over a specified period
of time.
Select by ticking the ‘Normalisation’
checkbox and setting the start and end
times for calculating the background level
e.g. 60 seconds to 180 seconds.
This screenshot shows data that has not
been normalised; the initial signal levels are
different for each well.
With normalisation, the levels come
together and allow for easier analysis.

Version 1.00
19
PEAK DETECTION
Simple: The software looks at the plot and
assigns the peak to the highest plotted
point that is above the ‘Threshold’ value.
Multiple peaks can be detected.
Full: The software performs more
complicated analysis of peaks above the
‘Threshold’ value. Multiple peaks can be
detected.
Invert: inverts the graph
FILE
To view previously run data go to the main menu and click the ‘File’ button. Then click on either
a Genie® instrument or ‘PC’ to browse for a run file.
Files are saved as ‘.gen’ files by default in the folders specified in Genie® Explorer ‘Options’, or
in the Log folder on a Genie® instrument. The run file is encrypted.
The requested file will be loaded
and analysis of the data can be
performed. The file will load and
be displayed in the same way as an
active run.

Version 1.00
20
SERVICE
Clicking the ‘Service’ button on the main menu will produce the following screen.
From here, it is possible to change
the date and time of the
instrument’s clock, and update
firmware or FPGA code on the
instrument (instead of using the drag
& drop method described in the
instrument user manual).
BATCH EXPORT
Clicking the ‘Batch Export’ button on the main menu will allow the user to export amplification
data from multiple log files into a single comma separated value (.CSV) file.
Genie® Explorer will ask for a
filename and location as to where to
save the .CSV file.
Genie® Explorer will then ask the
user to select the files to be
exported.
Select as many files as required and
then click ‘Open’.
The files will automatically open in
Genie® Explorer. When the final file
has loaded, the .CSV file will be
complete.

Version 1.00
21
DEFAULT DIRECTORY OPTIONS
The ‘Default Directory Options’ button allows the default locations of files to be set.
Profile: Default location for saving
profiles.
Data: Default location for saving run files.
Default Profile File: Sets a default profile
to be used when a new run is started. To
reset back to the program defaults, click
‘Reset Default Profile’.
Click ‘Save’ to save changes to the default
locations.

Version 1.00
22
Unit 5, Blatchford Road
Horsham
West Sussex
RH13 5QR
United Kingdom
Tel: +44 (0) 1403-274980
Fax: +44 (0) 1403-271017
www.optigene.co.uk
If you have any feedback or comments about the instrument please email:
Information in this document is subject to change without notice.
OptiGene Ltd. assumes no responsibility for any errors that may appear in this document.
This document is believed to be complete and accurate at the time of publication.
In no event shall OptiGene Ltd. be liable for incidental, multiple, or consequential damages in connection
with or arising from use of this document.
Genie® II and its design is a registered trademark of OptiGene Ltd. or its subsidiaries in the UK and other
countries.
Version Date Changes Approved
V1.00 03/11/15 Initial Release SUL
V1.01 20/11/15 Updated with batch export function SUL