Genetics: Published Articles Ahead of Print, published on ... · PDF file1 Eae19, a new locus...
26
1 Eae19, a new locus on rat chromosome 15 regulating experimental autoimmune encephalomyelitis Jian Rong Sheng, Maja Jagodic, Ingrid Dahlman, Kristina Becanovic, Rita Nohra, Monica Marta, Ellen Iacobaeus, Tomas Olsson and Erik Wallström Center for Molecular Medicine, Department of Clinical Neuroscience, Neuroimmunology Unit, Karolinska Institutet, SE-17176 Stockholm, Sweden To whom correspondence should be addressed: Erik Wallström Neuroimmunology Unit Center for Molecular Medicine, L8:04 SE-17176 Stockholm, Sweden Tel: +46 8 51776246, Fax: +46 8 51776248 E-mail: [email protected] Key words: EAE, rat, QTL, MS, autoimmunity, gene regulation, neuroinflammation Genetics: Published Articles Ahead of Print, published on February 16, 2005 as 10.1534/genetics.104.035261
Transcript of Genetics: Published Articles Ahead of Print, published on ... · PDF file1 Eae19, a new locus...
1
Eae19, a new locus on rat chromosome 15 regulating experimental autoimmune
encephalomyelitis
Jian Rong Sheng, Maja Jagodic, Ingrid Dahlman, Kristina Becanovic, Rita Nohra,
Monica Marta, Ellen Iacobaeus, Tomas Olsson and Erik Wallström
Center for Molecular Medicine, Department of Clinical Neuroscience,
Neuroimmunology Unit, Karolinska Institutet, SE-17176 Stockholm, Sweden
To whom correspondence should be addressed:
Erik Wallström
Neuroimmunology Unit
Center for Molecular Medicine, L8:04
SE-17176 Stockholm, Sweden
Tel: +46 8 51776246, Fax: +46 8 51776248
E-mail: [email protected]
Key words: EAE, rat, QTL, MS, autoimmunity, gene regulation, neuroinflammation
Genetics: Published Articles Ahead of Print, published on February 16, 2005 as 10.1534/genetics.104.035261

2
Abstract
Multiple sclerosis (MS) and its animal model myelin oligodendrocyte glycoprotein-
induced experimental autoimmune encephalomyelitis (MOG-EAE) share a complex
genetic predisposition with contributions from the major histocompatibility complex
class II genes and multiple other genes. Linkage mapping in F2 crosses between the
susceptible DA rat strain and the resistant ACI or BN rat strains in various models of
autoimmune neuroinflammation have repeatedly displayed suggestive linkage to a
region on rat chromosome 15. A direct study of this region was undertaken in
congenic strains by transferring resistant ACI alleles to the susceptible DA
background. Phenotypic analysis demonstrated lower maximal and cumulative EAE
scores in the DA.ACI–D15Rat6-D15Rat 71 (C15), DA.ACI–D15Rat6-D15Rat48,
D15Rat126-D15Rat71 (C15R3b) and DA.ACI–D15Rat23-D15rat71 (C15R4) strains
compared to the parental DA rat strain. Linkage analysis was then performed in an
(DAxPVG.AV1)F7 advanced intercross line, resulting in a LOD score of 4.7 for the
maximal EAE score phenotype at the peak marker D15Rat71 and a confidence
interval of 13 Mb overlapping with the congenic fragment defined by the C15R3b and
the C15R4 strains. Thus, a new MOG-EAE locus with the designation Eae19 is
identified on rat chromosome 15. There are 32 confirmed or predicted genes in the
confidence interval, including immune-responsive gene 1 and neuronal ceroid
lipofuscinose gene 5. Definition of loci such as Eae19 enable the characterization of
genetically regulated, evolutionary conserved, disease pathways in complex
neuroinflammatory diseases.

3
Introduction
Multiple sclerosis (MS) is a chronic inflammatory demyelinating disease that affects
the central nervous system (CNS). Susceptibility to MS is based on interactions
between several genes and influences by, largely unknown, non-genetic factors
(EBERS 1996; EBERS et al. 1986; EBERS et al. 1995; SADOVNICK et al. 1993;
SADOVNICK et al. 1996). The major histocompatibility complex (MHC) is since 1972
known to regulate MS (EBERS et al. 1986; JERSILD et al. 1973; OLERUP and HILLERT
1991). So far, very few individual non-MHC genes regulating MS have been
identified by whole genome scans or association studies due to the heterogeneity,
polygeneity and environmental influences in MS (AKESSON et al. 2002; BAN et al.
2002; BROADLEY 2001; CHATAWAY et al. 1998; CORADDU 2001; EBERS et al. 1996;
HAINES et al. 2002; HAINES et al. 1996; KUOKKANEN et al. 1997; SAWCER et al.
1996). Animal models of MS, such as experimental autoimmune encephalomyelitis
(EAE), can circumvent these problems by minimizing the heterogeneity and
controlling the environmental conditions (LASSMANN et al. 2001; LUCCHINETTI et al.
1996). Unbiased identification of genes controlling autoimmune neuroinflammation is
important, since such genes represent evolutionary conserved disease pathways that
are prime candidates for therapeutic interventions. A major problem for other
approaches in MS, such as studying selected candidate regulatory molecules and
cellular subsets, is to determine if the observed deviation is a cause or consequence of
disease and if the pathway is involved in disease progression or protection.
EAE induced with myelin oligodendrocyte glycoprotein (MOG), in certain rat strains,
share features of MS such as a relapsing-remitting disease course and a prominent
demyelination (ADELMANN et al. 1995; JOHNS et al. 1995). The formation of
demyelinated lesions in MOG-EAE depends on both T cells and anti-MOG antibodies
4
(LININGTON et al. 1988). MHC class II genes and multiple other genes influence this
response (DAHLMAN et al. 1999b; JAGODIC et al. 2001; WEISSERT et al. 1998b). An
autoimmune response against MOG in MS patients suggests that MOG plays an
important role also in the pathogenesis of MS (DE ROSBO et al. 1993; SUN et al. 1991;
WALLSTROM et al. 1998). Thus, MOG-EAE is a relevant model to utilize in studies of
mechanisms underlying the development of autoimmune neuroinflammation. The DA
rat strain is susceptible to MOG-EAE, while the PVG.AV1 and the ACI strains are
relatively resistant (WEISSERT et al. 1998b). The DA, PVG.AV1 and ACI rat strains
all share the MHC haplotype RT1.AV1 (HEDRICH 1990). This allows the
establishment of intercrosses and congenic strains specifically aimed at identifying
non-MHC loci regulating MOG-EAE.
Previous studies of MOG-EAE, whole spinal cord-induced EAE and experimental
autoimmune neuritis (EAN) have found suggestive linkage (LANDER and KRUGLYAK
1995) to a region on rat chromosome 15. In MOG-EAE and EAN, the suggestive
linkage was observed in (DAxACI)F2 rats subjected to genome scans with
microsatellite markers (DAHLMAN et al. 2001; DAHLMAN et al. 1999b). In spinal cord-
induced EAE, a suggestive linkage was observed in (DAxBN)F2 rats (DAHLMAN et
al. 1999a).
To determine if the rat chromosome 15 region indeed is important for the
development of MOG-EAE, we transferred this region from the EAE–resistant ACI to
the susceptible DA background with a speed congenic approach (WAKELAND et al.
1997). Linkage mapping was then performed in an (DA×PVG.AV1)F7 advanced
intercross line (AIL) (DARVASI and SOLLER 1995; DARVASI and SOLLER 1997;
JAGODIC et al. 2004). An AIL is created by random intercross breeding of two inbred
strains for several generations, resulting in genetically unique individuals with a

5
mixture of founder chromosomal fragments. Theoretically, an AIL gives at least a t/2
fold reduction in the confidence interval compared to an F2 cross given that t, where t
is the number of generations, is large enough (DARVASI and SOLLER 1997; XIONG and
GUO 1997). We combine the congenic strain and the AIL analysis to define a new
MOG-EAE locus designated Eae19.
Materials and methods
Parental rat strains and basic conditions
Dark Agouti (DA) rats were originally obtained from the Zentralinstitut for
Versuchstierzucht (Prof. Hans Hedrich, Hannover, Germany) and A×C 9935 Irish
(ACI) rats were from Harlan Sprague Dawley (Indianapolis, IN). MHC-congenic
(RT1.AV1) Piebald-Viral-Glaxo (PVG) rats, PVG.AV1 (also previously referred to as
PVG-RT1a), were obtained from Harlan UK Limited (Blackthorn, UK). All the rats
were locally bred in the animal facility at the Center for Molecular Medicine,
Karolinska Institutet. Eight to fifteen weeks old male and female rats were used in the
six experiments with congenic rats. Rats were routinely tested for specific pathogens
according to a health-monitoring program for rats at the National Veterinary Institute
in Uppsala, Sweden. They were kept in a 12-h light/12-h dark cycle and housed in
polystyrene cages containing aspen wood shavings, with free access to water and
autoclaved standard rodent chow. The local ethical committee approved the
experiments.

6
Breeding of the chromosome 15 congenic strains and the advanced intercross line
Speed congenics were generated with a marker-assisted selection technique, mainly as
described by Wakeland (WAKELAND et al. 1997). An approximately 25cM fragment
of ACI alleles from the D15Rat6 marker to the D15Rat71 marker was transferred to
the DA rat background. Initially, (DA×ACI)F1 rats were backcrossed to DA rats.
From the N2 generation, the rats were genotyped with 70 microsatellite markers
outside the congenic region, with a mean distance between markers of 20cM. One
male rat from each generation, having the least amount of remaining donor (ACI)
alleles in the genome, was selected for further breeding and mated with several DA
female rats. In the N6 generation, all 70 background markers were fixed as DA
homozygous. One further backcross was performed and heterozygous rats for the
chromosome 15 region were subsequently intercrossed to produce the congenic strain
DA.ACI–D15Rat6-D15Rat 71 (N7F1). From the first intercross, offspring rats were
genotyped with eight microsatellite markers within the congenic region to detect
intra-regional recombinations. We selected the full-length congenic strain DA.ACI–
D15Rat6-D15Rat 71 (C15) and the recombinant congenic strains: DA.ACI–D15Rat
6-D15rat13 (C15R1), DA.ACI–D15Rat6-D15Rat48 (C15R3) and DA.ACI–
D15Rat23-D15rat71 (C15R4) for experiments. After the fifth experiment we re-
genotyped the rats and found that some C15R3 rats shared a region with the C15R4
from D15Rat126 to D15Rat71, so we separated the C15R3 into DA.ACI–D15Rat6-
D15Rat48 (C15R3a) and DA.ACI–D15Rat6-D15rat48, D15Rat126-D15Rat71
(C15R3b) according to the genotyping results.

7
The advanced intercross line originated from the DA and the PVG.AV1 rat
strains that share the RT1.AV1 MHC haplotype, thus allowing identification of non-
MHC genes. One important reason for choosing the DAxPVG strain combination was
to permit dense genotyping, since these strains display a high rate of polymorphic
microsatellite markers: ~60% (compared to ~10% for the DAxACI strain
combination) according to the Whitehead Institute (http://www-
genome.wi.mit.edu/rat/public/). The breeding scheme for the (DAxPVG.AV1) AIL
has previously been reported (JAGODIC et al. 2004). Briefly, to create the F1
generation, breeding pairs with DA female founders and PVG.AV1 female founders
were established. The F2 generation was produced from seven couples each of F1 rats
with DA and PVG.AV1 as female founders, respectively. The F3 generation
originated from 50 breeding couples with both types of female founders. Random
breeding of 50 males and females, consistently avoiding brother-sister mating,
produced the subsequent generations. Three F7 litters were produced from the 50 F6
breeding couples for the MOG-EAE experiments.
Induction and clinical assessment of MOG-EAE
The rats were anaesthetized with sevoflurane and immunized intradermally in
the tail base. Each rat received 200 µl inoculums containing 100 µl recombinant rat
MOG (a.a. 1–125) in saline emulsified in 100 µl IFA (Sigma-Aldrich, St. Louis, MO).
The dose of rMOG (a.a. 1-125) was selected upon titration in the susceptible parental
DA rats. In the congenic strain experiments the dose was 13, 20 or 65µg/rat,
depending on the batch of rMOG, and 40µg/rat for the AIL animals. Animals were
weighed and clinical signs of disease were evaluated from day 7 to day 33-40 post
immunization (p.i.). The clinical signs were scored as follows: 1, tail weakness or tail

8
paralysis, 2, hind leg paraparesis (gait disturbance) or hemiparesis, 3, hind leg
paraparalysis or hemiparalysis, 4, tetraparalysis, urinary and/or fecal incontinence. A
relapsing/remitting disease course was defined as an improvement in the disease score
from either 3 or 4 to 1, or from 2, 3, or 4 to 0, that was maintained for at least two
consecutive days and followed by an increase in the clinical score of at least two
points that lasted for at least two days.
Genotyping
A total of 152 clinically affected rats and 162 randomly selected unaffected
rats in the (DAxPVG.AV1)F7 AIL were genotyped. Affected animals were selected
on the basis of displaying unambiguous signs of the disease (minimum score 1 for
more than 2 days accompanied with weight loss). Rats in the unaffected group did not
display any signs of disease, including a steady increase in weight (JAGODIC et al.
2004). DNA was extracted from the tail tip according to a standard protocol (LAIRD et
al. 1991). The region analyzed in the AIL included the region defined in the full-
length congenic C15 strain (Fig. 1). This 25 cM (~53 Mb) large region, extending
from D15Rat6 to D15Rat71, was first genotyped with fifteen microsatellite markers,
then another region (~15Mb) from D15Rat 71 to D15Rat103 nearby the telomere was
mapped with four additional microsatellite markers (Fig. 4). The microsatellite
markers were obtained from Proligo France SAS (Paris, France). Polymerase chain
reaction (PCR) amplification was performed as previously described with [ -33P]
ATP end-labeling of the forward primer (JACOB et al. 1995). The PCR products were
size fractionated on 6% polyacrylamide gels and visualized by autoradiography. All
genotypes were evaluated manually and double-checked.

9
Fig. 1 Fig. 1. A schematic illustration of the distal part of rat chromosome 15, aligned with
the intervals defined in the congenic strains. The full-length congenic strain DA.ACI–
D15Rat6-D15Rat71 (C15) and the recombinant congenic strains DA.ACI–D15rat 6-
D15rat13 (C15R1), DA.ACI–D15Rat6-D15Rat48 (C15R3a), DA.ACI–D15Rat6-
D15rat48, D15Rat126-D15Rat71 (C15R3b) and DA.ACI–D15Rat23-D15rat71
(C15R4) are depicted. The thin vertical line represents rat chromosome 15 along with
microsatellite markers placed according to positions in Mb derived from the rat
genome sequence (http://www.ensembl.org/Rattus_norvegicus/). Markers not mapped
to assembly in the current Ensembl database are marked n.m. and positioned
according to the SHRSPxBN version 7 linkage map (http://rgd.mcw.edu/). The thick
black vertical lines represent different ACI rat intervals transferred to the DA rat
background and the dashed lines represents the interval within which recombination
has occurred. The white vertical line represents DA rat background genes.
D15Rat6 (n.m.)
D15Rat88 (n.m.)
D15Rat13 (43.8 Mb)
D15Rat11 (51.5 Mb)
D15Rat48 (61.2 Mb)
D15Rat23 (83.1 Mb)D15Rat126 (n.m.)D15Rat71 (85.5 Mb)
D15Rat156 (100.8 Mb)
RNO15 C15 R1 R3a R3b R4

10
Statistical analysis
Differences in binominal traits (incidence, relapsing/remitting disease,
mortality) were tested with the Fisher's exact test. Differences in the maximal score,
the cumulative scores and onset day were tested with the Wilcoxon two-sample test
after normalization of the six separate experiments. Normalization was performed by
subtracting the mean maximal or cumulative EAE score for the particular experiment
from each individual rats corresponding score and then the sum was divided with the
standard deviation (SD) for the particular experiment. This allowed all experiments to
be analyzed together, despite the variation in the severity of disease in the parental
DA rat strain. The JMP 5.1 software (SAS Institute, Cary, NC) was utilized for the
analysis above. Linkage analysis in the AIL was performed with the R/qtl software
(BROMAN et al. 2003). Permutation tests in the R/qtl software was used to determine
the significance levels (CHURCHILL and DOERGE 1994). The LOD levels for
significant linkage generated with 5000 permutations were: 2.3 for the incidence of
EAE, 2.0 for the day of onset, 2.9 for the maximum EAE score and 2.2 for the
cumulative EAE score. The confidence interval was defined as drops of 1 in the LOD
score (LANDER and BOTSTEIN 1989).

11
Results
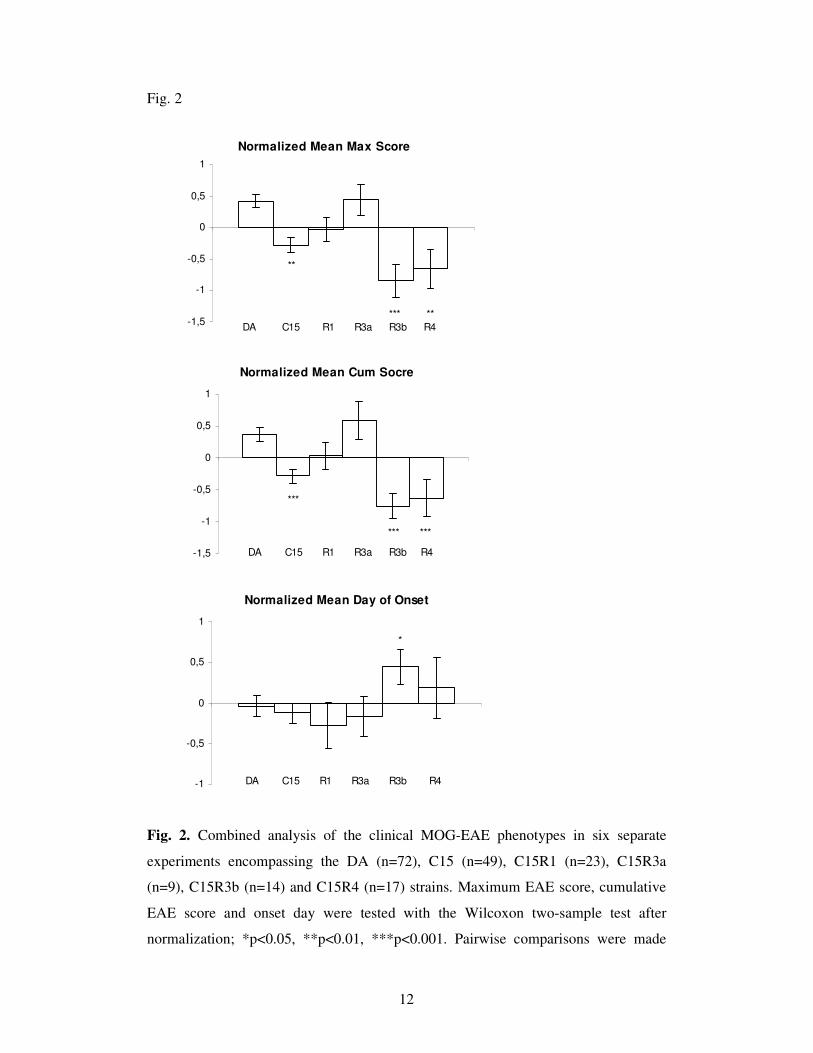
A reduced MOG-EAE severity in the C15, C15R3b and C15R4 strains
Fig2 gives the mean maximal, cumulative score and onset day of the EAE in DA rats,
congenic C15 and recombinant congenic C15R1, C15R3a, C15R3b and C15R4 rats
pooled from six separate experiments after the normalization. DA, C15R1 and
C15R3a rats developed EAE with a high maximal and cumulative EAE score while
the C15, C15R3b and C15R4 rats had less severe MOG-EAE, with lower maximal
and cumulative EAE scores (p<0.05-0.001); C15R3b rats had late onset of disease
compared to DA rats (p<0.05). The disease incidence, the numbers of rats displaying
a relapsing-remitting disease, or a lethal EAE were not significantly different in any
of the congenic strains compared to the DA strain (data not shown). However, the
power of this analysis was reduced due to the variable expression of EAE in the DA
strain, as depicted in Fig 3. In experiment 3 (Fig. 3a), there were only mild signs of
disease in the DA rats and almost no disease signs in the C15 rats. The disease signs
in the DA rats were much more severe in exp. 5, while the R3b and R4 displayed a
reduced disease severity (Fig. 3b). The overall disease severity was intermediate in
exp. 1, mild in exp. 2 and severe in exp. 4, exp. 6 (data not shown).
12
Fig. 2
Normalized Mean Max Score
-1,5
-1
-0,5
0
0,5
1
DA C15 R1 R3a R3b R4*** **
**
Normalized Mean Cum Socre
-1,5
-1
-0,5
0
0,5
1
DA C15 R1 R3a R3b R4
***
*** ***
Normalized Mean Day of Onset
-1
-0,5
0
0,5
1
DA C15 R1 R3a R3b R4
*
Fig. 2. Combined analysis of the clinical MOG-EAE phenotypes in six separate
experiments encompassing the DA (n=72), C15 (n=49), C15R1 (n=23), C15R3a
(n=9), C15R3b (n=14) and C15R4 (n=17) strains. Maximum EAE score, cumulative
EAE score and onset day were tested with the Wilcoxon two-sample test after
normalization; *p<0.05, **p<0.01, ***p<0.001. Pairwise comparisons were made

13
with the congenic strains and the DA strain. Mean values and SEM for disease onset
day after immunization calculated only for affected rats.
Fig3a
0
0,5
1
1,5
8 10 12 14 16 18 20 22 24 26 28 30 32 34
Day post-immunization
Clin
ical
Sco
re
DA
C15
Fig3b
Fig. 3. The clinical course of rMOG (a.a. 1-125)-induced EAE in selected strains and
experiments. (a) Experiment 3: a mild disease course in DA rats (n=11) and almost
complete protection in C15 rats (n=8). (b) Experiment 5: a severe disease in DA rats
(n=16) and reduced disease severity in C15R3b (n=5) and C15R4 (n=9) rats.
0
0,5
1
1,5
2
2,5
3
3,5
8 9 10 11 12 13 14 15 16 17 18 19 20 21 22 23 24 25 26 27 28 29 30 31 32 33
Day post-imm unization
Clin
ical
sco
re
DAR4R3b
14
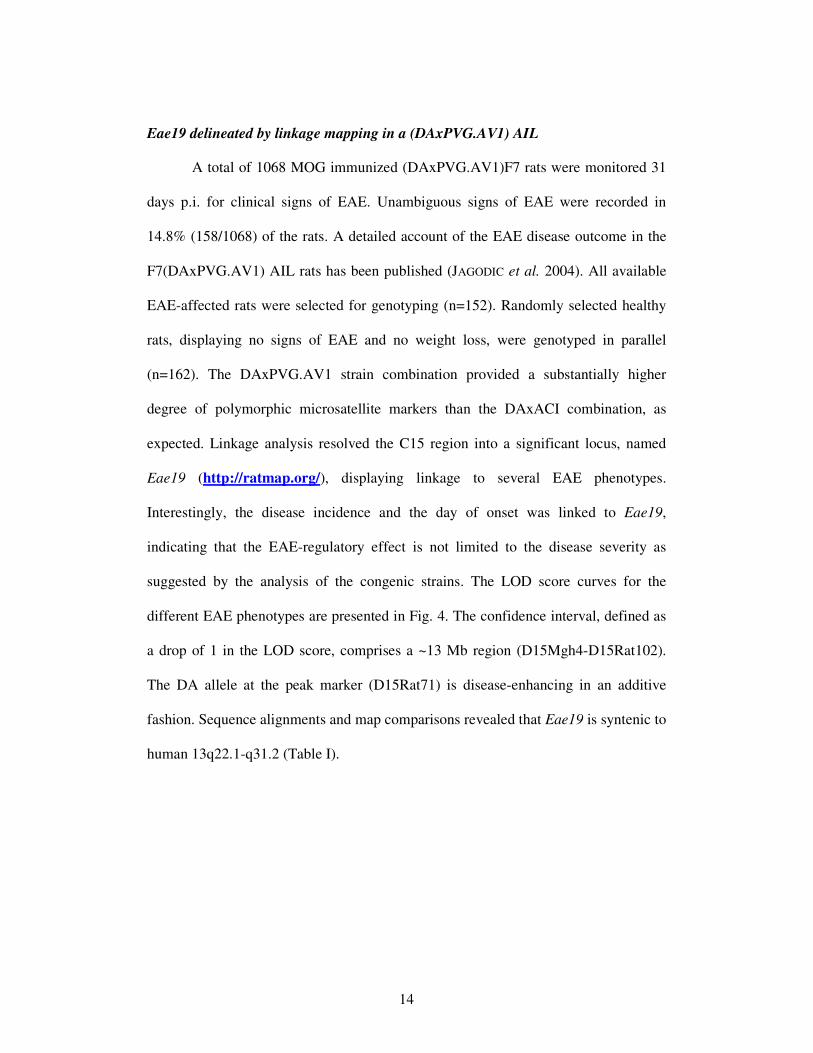
Eae19 delineated by linkage mapping in a (DAxPVG.AV1) AIL
A total of 1068 MOG immunized (DAxPVG.AV1)F7 rats were monitored 31
days p.i. for clinical signs of EAE. Unambiguous signs of EAE were recorded in
14.8% (158/1068) of the rats. A detailed account of the EAE disease outcome in the
F7(DAxPVG.AV1) AIL rats has been published (JAGODIC et al. 2004). All available
EAE-affected rats were selected for genotyping (n=152). Randomly selected healthy
rats, displaying no signs of EAE and no weight loss, were genotyped in parallel
(n=162). The DAxPVG.AV1 strain combination provided a substantially higher
degree of polymorphic microsatellite markers than the DAxACI combination, as
expected. Linkage analysis resolved the C15 region into a significant locus, named
Eae19 (http://ratmap.org/), displaying linkage to several EAE phenotypes.
Interestingly, the disease incidence and the day of onset was linked to Eae19,
indicating that the EAE-regulatory effect is not limited to the disease severity as
suggested by the analysis of the congenic strains. The LOD score curves for the
different EAE phenotypes are presented in Fig. 4. The confidence interval, defined as
a drop of 1 in the LOD score, comprises a ~13 Mb region (D15Mgh4-D15Rat102).
The DA allele at the peak marker (D15Rat71) is disease-enhancing in an additive
fashion. Sequence alignments and map comparisons revealed that Eae19 is syntenic to
human 13q22.1-q31.2 (Table I).
15
Fig. 4
Fig. 4. Log-likelihood plot of Eae19, identified in the (DAxPVG.AV1)F7 AIL. Eae19
displayed significant linkage to all clinical EAE phenotypes: EAE incidence and day
of onset, maximum and cumulative EAE scores. The markers in the region are listed
on the X-axis (R=D15Rat, M=D15Mgh, G=D15Got). Eae19 is 13 Mb and contains 32
confirmed or predicted genes according to the rat physical map retrieved from
http://www.ensembl.org.
R10
R13
R17
R61
R122
R123
R37
R68
R96
R126
M4
R71
G112
R154
R103
G93
R102
G86
G88
16
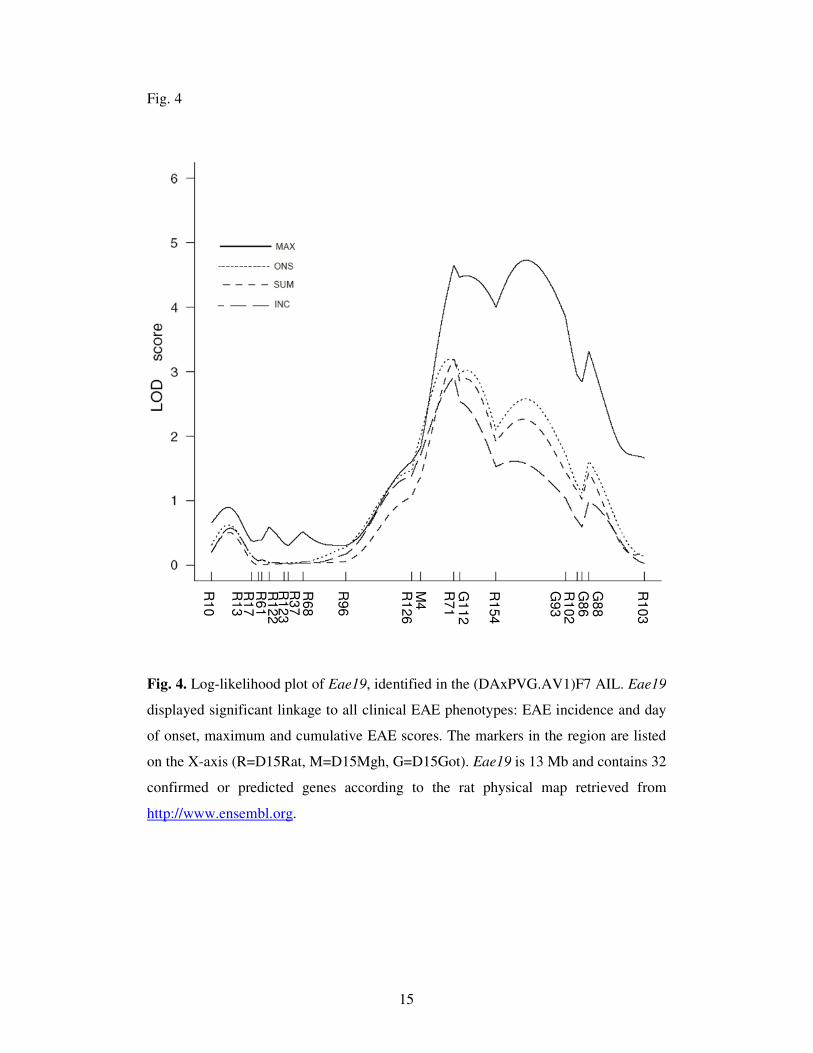
Table I. Position and LOD scores for Eae19 in the (DAxPVG.AV1)F7 advanced
intercross line.
LOD scorea QTL Inc Ons Max Cum
Peak marker
Marker Interval
CIb
(Mb)
Syntenic human regionc
Eae19
2.9
3.2
4.7
3.2
D15Rat71 D15Mgh4-
D15Rat102
13Mb 13q22.1-
q31.2
a LOD scores and thresholds for significance based on 5000 permutations were
generated with R/qtl. Significance threshold: 2.3 for Inc (Incidence of EAE); 2.0 for
Ons (Day of onset), 2.9 for Max (Maximum EAE score) and 2.2 for Cum (Cumulative
EAE score).
b Confidence intervals (CI) defined as a drop of 1 in the LOD score and the closest
corresponding microsatellite markers are reported.
c Synteny data derived from http://www.ensembl.org/.
Discussion
The definition of Eae19 in two different strain combinations (DAxACI and
DAxPVG.AV1) strengthens the importance of this locus. Further mapping of genes
may also be facilitated by comparisons of genetic polymorphisms between the three
different strains, especially since the low polymorphism rate between the DA and the
ACI strain may decrease the number of relevant genetic polymorphisms substantially.
However, it is at this stage impossible to rule out that Eae19 is composed of several
genes and/or genes that differ between the different strains (MOREL et al. 2001;
BECANOVIC et al. 2004). Definition of subcongenic strains from the C15R4 strain will

17
be performed to further reduce the size of the congenic fragment contributing to
relative disease protection. Positional cloning is then needed to define the exact genes
responsible for the EAE-regulating effect of Eae19. Successful positional cloning
through the definition of smaller and smaller congenic fragments has recently been
demonstrated in rat experimental arthritis (OLOFSSON et al. 2003).
A possible problem with gene-mapping in congenic strains is the presence of
contaminating fragments of DNA from the donor strain, contributing to differences in
the disease phenotype between the congenic strains and the parental strains that
wrongly would be interpreted as genetically localized to the congenic fragment. The
speed congenic strategy applied in the present study is a way to improve the control of
contaminating fragments as well as speeding up the process of generating congenic
strains. Mapping of the disease expression in recombinant congenic strains is another
way to rule out significant contributions from genes outside the investigated congenic
fragment. The lack of clinical effects in the C15R1 and C15R3a congenic strains
strongly argues against any significant contributions from contaminating ACI DNA
fragments outside Eae19, since those strains are expected to share possible
contaminating fragments with the C15R3b and the C15R4 strains. Another issue in
the analysis of EAE QTLs is the stability of the models and the observed genetic
effects. In the present study, there were clear differences in the six different
experiments regarding disease severity in the parental DA rat strain (Fig. 3 a and b) as
well as a variable difference between the full-length C15 and the DA strain.
Differences in the disease expression in parental / control strains are possible to
minimize by applying strict protocols for immunization and environmental
monitoring, but it is in practice very difficult to obtain completely stable conditions in
EAE. It may also be argued that repeating experiments with different disease severity
18
maximizes the possibility to detect weak genetic effects. It is highly likely that most
genetic effects in MOG-EAE (and MS) are relatively weak and/or only present in
certain disease subphenotypes (MOREL et al. 2000). This may help to explain the
relative lack of progress in QTL mapping in EAE since the first published whole
genome scan in 1995 (SUNDVALL et al. 1995).
Linkage mapping in the (DAxPVG.AV1)F7 AIL localized Eae19 within a 13 Mb
confidence interval, that overlaps with the congenic fragment defined by C15R4. The
linkage analysis in the AIL both increased the LOD score and decreased the
confidence interval of Eae19 compared to previous F2 analysis. This region contains
only 32 confirmed and predicted genes, including genes such as immune-responsive
gene 1 and neuronal ceroid lipofuscinose gene 5. A current list of genes mapped to the
interval can be retrieved at www.ensembl.org. There were few obvious candidate
genes, which may be explained by the presence of yet unmapped genes, the presence
of regulatory elements altering the expression of genes mapping outside Eae19 or by
complex interactions. Eae19 also overlaps with adjuvant induced arthritis QTL 4
(Aia4) (KAWAHITO et al. 1998), serum cholesterol level QTL 1 (KATO et al. 2000),
blood pressure QTL cluster 12 (STOLL et al. 2000) and gastric cancer susceptibility
QTL 1 (USHIJIMA et al. 2000). Aia4 may be the most interesting of these QTLs, since
we previously have demonstrated EAE-regulatory effects in rats strains congenic for
arthritis-regulating QTLs (BECANOVIC et al. 2003). It is highly likely that some
genetically regulated disease mechanisms are shared between arthritis and EAE
(BECKER et al. 1998). Given the emerging evidence for the importance of immune-
mechanisms also in cardiovascular diseases and cancer, a shared genetic regulation
also with these conditions as suggested by the overlapping QTLs is another intriguing
possibility. However, due to the large numbers of QTLs described and the usual size

19
of the confidence intervals, a certain degree of overlap between QTLs is expected by
chance. Eae19 is syntenic to the human chromosome 13q22.1-q31.2 that has not
shown evidence of linkage to MS. An explanation, besides the lack of power to
exclude gene regions in human linkage and association studies, is that pathways but
not the regulating genes are shared between the animal model and the human disease.
In conclusion, a new EAE-regulating locus on rat chromosome 15, Eae19, is mapped
in congenic and recombinant congenic strains in combination with linkage analysis in
an AIL. Further dissection of Eae19 is possible by the creation of congenic strains
with increasingly smaller congenic fragments. The identification of genetic
polymorphisms regulating autoimmune neuroinflammation will reveal disease-
relevant mechanistic pathways and thereby provide new targets for therapeutic
interventions.

20
References
ADELMANN, M., J. WOOD, I. BENZEL, P. FIORI, H. LASSMANN et al., 1995 The N-
terminal domain of the myelin oligodendrocyte glycoprotein (MOG) induces acute
demyelinating experimental autoimmune encephalomyelitis in the Lewis rat. J
Neuroimmunol 63: 17-27.
AKESSON, E., A. OTURAI, A. SVEJGAARD, P. HOLMANS, A. COMPSTON et al., 2002 A
genome-wide screen for linkage in Nordic sib-pairs with multiple sclerosis. Genes
Immun 3: 279-285.
BAN, M., G. STEWART, B. BENNETTS, R. HEARD, R. SIMMONS et al., 2002 A genome
screen for linkage in Australian sibling-pairs with multiple sclerosis. Genes Immun 3:
464-469.
BECANOVIC, K., L. BACKDAHL, E. WALLSTROM, F. ABOUL-ENEIN, H. LASSMANN et
al., 2003 Paradoxical effects of arthritis-regulating chromosome 4 regions on myelin
oligodendrocyte glycoprotein-induced encephalomyelitis in congenic rats. Eur J
Immunol 33: 1907-1916.
BECANOVIC, K., M. JAGODIC, E. WALLSTROM and T. OLSSON, 2004 Current gene
mapping strategies in experimental models of multiple sclerosis. Scand J Immunol 60:
39-51.
BECKER, K. G., R. M. SIMON, J. E. BAILEY-WILSON, B. FREIDLIN, W. E. BIDDISON et
al., 1998 Clustering of non-major histocompatibility complex susceptibility candidate
loci in human autoimmune diseases. Proc Natl Acad Sci U S A 95: 9979-9984.
BROADLEY, S., 2001 A genome screen for multiple sclerosis in Italian families. Gene
Immune 2: 205-210.

21
BROMAN, K., H. WU, S. SEN and G. CHURCHILL, 2003 R/qtl: QTL mapping in
experimental crosses. Bioinformatics. 1: 889-890.
CHATAWAY, J., R. FEAKES, F. CORADDU, J. GRAY, J. DEANS et al., 1998 The genetics
of multiple sclerosis: principles, background and updated results of the United
Kingdom systematic genome screen. Brain 121: 1869-1887.
CHURCHILL, G. A., and R. W. DOERGE, 1994 Empirical threshold values for
quantitative trait mapping. Genetics 138: 963-971.
CORADDU, F., 2001 A genome screen for multiple sclerosis in Sardinian multiplex
families. European Journal of Human Genetics 9: 621-626.
DAHLMAN, I., L. JACOBSSON, A. GLASER, J. C. LORENTZEN, M. ANDERSSON et al.,
1999a Genome-wide linkage analysis of chronic relapsing experimental autoimmune
encephalomyelitis in the rat identifies a major susceptibility locus on chromosome 9. J
Immunol 162: 2581-2588.
DAHLMAN, I., E. WALLSTROM, H. JIAO, H. LUTHMAN, T. OLSSON et al., 2001
Polygenic control of autoimmune peripheral nerve inflammation in rat. J
Neuroimmunol 119: 166-174.
DAHLMAN, I., E. WALLSTROM, R. WEISSERT, M. STORCH, B. KORNEK et al., 1999b
Linkage analysis of myelin oligodendrocyte glycoprotein-induced experimental
autoimmune encephalomyelitis in the rat identifies a locus controlling demyelination
on chromosome 18. Human Molecular Genetics 8: 2183-2190.
DARVASI, A., and M. SOLLER, 1995 Advanced intercross lines, an experimental
population for fine genetic mapping. Genetics 141: 1199-1207.
DARVASI, A., and M. SOLLER, 1997 A simple method to calculate resolving power
and confidence interval of QTL map location. Behav Genet 27: 125-132.
22
DE ROSBO, N. K., R. MILO, M. B. LEES, D. BURGER, C. C. BERNARD et al., 1993
Reactivity to myelin antigens in multiple sclerosis. Peripheral blood lymphocytes
respond predominantly to myelin oligodendrocyte glycoprotein. Journal of Clinical
Investigation 92: 2602-2608.
EBERS, G. C., 1996 Genetic epidemiology of multiple sclerosis. Current Opinion in
Neurology 9: 155-158.
EBERS, G. C., D. E. BULMAN, A. D. SADOVNICK, D. W. PATY, S. WARREN et al., 1986
A population-based study of multiple sclerosis in twins. New England Journal of
Medicine 315: 1638-1642.
EBERS, G. C., K. KUKAY, D. E. BULMAN, A. D. SADOVNICK, G. RICE et al., 1996 A
full genome search in multiple sclerosis. Nature Genetics 13: 472-476.
EBERS, G. C., A. D. SADOVNICK, N. J. RISCH and C. C. S. GROUP, 1995 A genetic basis
for familial aggregation in multiple sclerosis. Nature 377: 150-151.
HAINES, J., Y. BRADFORD, M. GARCIA, A. REED, E. NEUMEISTER et al., 2002 Multiple
susceptibility loci for multiple sclerosis. Hum Mol Genet 11: 2251-2256.
HAINES, J. L., M. TER-MINASSIAN, A. BAZYK, J. F. GUSELLA, D. J. KIM et al., 1996 A
complete genomic screen for multiple sclerosis underscores a role for the major
histocompatability complex. Nature Genetics 13: 469-471.
HEDRICH, H. J., 1990 Genetic Monitoring of Inbred Strains of Rats. Gustav Fischer
Verlag, New York.
JACOB, H. J., D. M. BROWN, R. K. BUNKER, M. J. DALY, V. J. DZAU et al., 1995 A
genetic linkage map of the laboratory rat, Rattus norvegicus. Nature Genetics 9: 63-
69.
23
JAGODIC, M., K. BECANOVIC, J. R. SHENG, X. WU, L. BACKDAHL et al., 2004 An
advanced intercross line resolves Eae18 into two narrow quantitative trait loci
syntenic to multiple sclerosis candidate loci. J Immunol 173: 1366-1373.
JAGODIC, M., B. KORNEK, R. WEISSERT, H. LASSMANN, T. OLSSON et al., 2001
Congenic mapping confirms a locus on rat chromosome 10 conferring strong
protection against myelin oligodendrocyte glycoprotein-induced experimental
autoimmune encephalomyelitis. Immunogenetics 53: 410-415.
JERSILD, C., T. FOG, G. S. HANSEN, M. THOMSEN, A. SVEJGAARD et al., 1973
Histocompatibility determinants in multiple sclerosis, with special reference to
clinical course. Lancet 2: 1221-1225.
JOHNS, T. G., N. KERLERO DE ROSBO, K. K. MENON, S. ABO, M. F. GONZALES et al.,
1995 Myelin oligodendrocyte glycoprotein induces a demyelinating
encephalomyelitis resembling multiple sclerosis. Journal of Immunology 154: 5536-
5541.
KATO, N., T. TAMADA, T. NABIKA, K. UENO, T. GOTODA et al., 2000 Identification of
quantitative trait loci for serum cholesterol levels in stroke-prone spontaneously
hypertensive rats. Arterioscler Thromb Vasc Biol 20: 223-229.
KAWAHITO, Y., G. W. CANNON, P. S. GULKO, E. F. REMMERS, R. E. LONGMAN et al.,
1998 Localization of quantitative trait loci regulating adjuvant-induced arthritis in
rats: evidence for genetic factors common to multiple autoimmune diseases [In
Process Citation]. J Immunol 161: 4411-4419.
KUOKKANEN, S., M. GSCHWEND, J. D. RIOUX, M. J. DALY, J. D. TERWILLIGER et al.,
1997 Genomewide scan of multiple sclerosis in Finnish multiplex families. American
Journal of Human Genetics 61: 1379-1387.
24
LAIRD, P. W., A. ZIJDERVELD, K. LINDERS, M. A. RUDNICKI, R. JAENISCH et al., 1991
Simplified mammalian DNA isolation procedure. Nucleic Acids Res 19: 4293.
LANDER, E. S., and D. BOTSTEIN, 1989 Mapping mendelian factors underlying
quantitative traits using RFLP linkage maps. Genetics. 121(1): 185-199.
LANDER, E. S., and L. KRUGLYAK, 1995 Genetic dissection of complex traits:
guidelines for interpreting and reporting linkage results. Nature Genetics 11: 241-247.
LASSMANN, H., W. BRUCK and C. LUCCHINETTI, 2001 Heterogeneity of multiple
sclerosis pathogenesis: implications for diagnosis and therapy. Trends Mol Med. 7:
115-121.
LININGTON, C., M. BRADL, H. LASSMANN, C. BRUNNER and K. VASS, 1988
Augmentation of demyelination in rat acute allergic encephalomyelitis by circulating
mouse monoclonal antibodies directed against a myelin/oligodendrocyte glycoprotein.
American Journal of Pathology 130: 443-454.
LUCCHINETTI, C. F., W. BRUCK, M. RODRIGUEZ and H. LASSMANN, 1996 Distinct
patterns of multiple sclerosis pathology indicates heterogeneity in pathogenesis. Brain
Pathology 6: 259-274.
MOREL, L., K. R. BLENMAN, B. P. CROKER and E. K. WAKELAND, 2001 The major
murine systemic lupus erythematosus susceptibility locus, Sle1, is a cluster of
functionally related genes. Proc Natl Acad Sci U S A 98: 1787-1792.
MOREL, L., B. P. CROKER, K. R. BLENMAN, C. MOHAN, G. HUANG et al., 2000
Genetic reconstitution of systemic lupus erythematosus immunopathology with
polycongenic murine strains. Proc Natl Acad Sci U S A 97: 6670-6675.
OLERUP, O., and J. HILLERT, 1991 HLA class II-associated genetic susceptibility in
multiple sclerosis: a critical evaluation. Tissue Antigens 38: 1-15.

25
OLOFSSON, P., J. HOLMBERG, J. TORDSSON, S. LU, B. AKERSTROM et al., 2003
Positional identification of Ncf1 as a gene that regulates arthritis severity in rats. Nat
Genet 33: 25-32.
SADOVNICK, A. D., H. ARMSTRONG, G. P. RICE, D. BULMAN, L. HASHIMOTO et al.,
1993 A population-based study of multiple sclerosis in twins: update. Annals of
Neurology 33: 281-285.
SADOVNICK, A. D., G. C. EBERS, D. A. DYMENT, N. J. RISCH, D. BULMAN et al., 1996
Evidence for genetic basis of multiple sclerosis. Lancet 347: 1728-1730.
SAWCER, S., H. B. JONES, R. FEAKES, J. GRAY, N. SMALDON et al., 1996 A genome
screen in multiple sclerosis reveals susceptibility loci on chromosome 6p21 and
17q22. Nature Genetics 13: 464-468.
STOLL, M., A. E. KWITEK-BLACK, A. W. J. COWLEY, E. L. HARRIS, S. B. HARRAP et
al., 2000 New target regions for human hypertension via comparative genomics.
Genome Res. 10(4):473-82.
SUN, J., H. LINK, T. OLSSON, B. G. XIAO, G. ANDERSSON et al., 1991 T and B cell
responses to myelin-oligodendrocyte glycoprotein in multiple sclerosis. Journal of
Immunology 146: 1490-1495.
SUNDVALL, M., J. JIRHOLT, H. T. YANG, L. JANSSON, A. ENGSTROM et al., 1995
Identification of murine loci associated with susceptibility to chronic experimental
autoimmune encephalomyelitis. Nature Genetics 10: 313-317.
USHIJIMA, T., M. YAMAMOTO, M. SUZUI, T. KURAMOTO, Y. YOSHIDA et al., 2000
Chromosomal mapping of genes controlling development, histological grade, depth of
invasion, and size of rat stomach carcinomas. Cancer Res 60: 1092-1096.
26
WAKELAND, E., L. MOREL, K. ACHEY, M. YUI and J. LONGMATE, 1997 Speed
congenics: a classic technique in the fast lane (relatively speaking). Immunol Today
18: 472-477.
WALLSTROM, E., M. KHADEMI, M. ANDERSSON, R. WEISSERT, C. LININGTON et al.,
1998 Increased reactivity to myelin oligodendrocyte glycoprotein peptides and
epitope mapping in HLA DR2(15)+ multiple sclerosis. Eur J Immunol 28: 3329-3335.
WEISSERT, R., E. WALLSTROM, M. K. STORCH, A. STEFFERL, J. LORENTZEN et al.,
1998b MHC haplotype-dependent regulation of MOG-induced EAE in rats. J Clin
Invest 102: 1265-1273.
XIONG, M., and S. GUO, 1997 Fine-scale mapping of quantitative trait loci using
historical recombinations. Genetics 145: 1201-1218.