Mercury toxicity: Genetic susceptibility and synergistic effects
RESEARCH ARTICLE Open Access
Genetic investigation into an increasedsusceptibility to biliary atresia in anextended New Zealand Māori familySophia R. Cameron-Christie1 , Justin Wilde2, Andrew Gray3, Rick Tankard4,7, Melanie Bahlo4,7, David Markie5,Helen M. Evans6 and Stephen P. Robertson1*
Abstract
Background: Biliary atresia (BA), a fibrosing disorder of the developing biliary tract leading to liver failure in infancy,has an elevated incidence in indigenous New Zealand (NZ) Māori. We investigated a high rate of BA in a group ofchildren (n = 12) belonging to a single Māori iwi (or ‘tribe’, related through a remote ancestor).
Methods: Population and geographical data was used to estimate the rate of BA in Māori sub-groups, and apedigree linking most of the affected children was constructed from oral and documented history. Arraygenotyping was used to examine hypotheses about the inheritance of a possible genetic risk factor, and the historyof the affected population, and Exome Sequencing to search for candidate genes.
Results: Most of these affected children (n = 7) link to a self-reported pedigree and carry a 50-fold increase in BArisk over unrelated Māori (χ2 = 296P < 0.001, 95% CI 23–111). Genetic analysis using FEstim and SNP array genotypesrevealed no evidence for elevated consanguinity between parents of affected children (FEstim: F (2,21) = 0.469,P > 0.63). Genome-wide quantitation of intervals of contiguous, homozygous-by-state markers reached a similarconclusion (F (2,399) = 1.99, P = 0.138). Principal component analysis and investigation with STRUCTURE found noevidence of increased allele frequency of either a recessive variant, or additive, low-risk variants due to reproductiveisolation. To identify candidate causal factors, Exome Sequencing datasets were scrutinised for shared rare codingvariants across 8 affected individuals. No rare, non-synonymous, phylogenetically conserved variants were commonto 6 or more affected children.
Conclusion: The substantially elevated risk for development of BA in this subgroup could be mediated by geneticfactors, but the iwi exhibits no properties indicative of recent or remote reproductive isolation. Resolution of anyrisk loci may rely on extensive genomic sequencing studies in this iwi or investigation of other mechnaisms suchas copy number variation.
Keywords: Biliary atresia, Exome sequencing, Population genetics, Paediatric disease
BackgroundBiliary atresia (BA) is a phenotype of unknown, likelycomplex, aetiology characterized by congenital, fibroticobliteration of bile ducts that evolves over the late fetaland early infant periods of development. It is the mostcommon reason for paediatric liver transplant referral[1] and leads to liver failure and death without early
surgical intervention [2]. BA usually presents as an iso-lated clinical phenomenon but can be a component of asyndromic entity with major malformations [3] and bil-iary cysts [4], leading to the classification of the diseaseinto multiple categories [5, 6]. The heterogeneity of itspresentation in a variety of syndromes, and the incon-sistency of correlative factors between different studies,suggests it is not likely to be a single disease with a uni-fying aetiology, but more a phenotype with multiple con-tributing factors converging on a similar pathology [5].‘Isolated BA’, when BA occurs in isolation from other
* Correspondence: [email protected] of Women’s and Children’s Health, Dunedin School ofMedicine, University of Otago, Dunedin 9054, New ZealandFull list of author information is available at the end of the article
© The Author(s). 2018 Open Access This article is distributed under the terms of the Creative Commons Attribution 4.0International License (http://creativecommons.org/licenses/by/4.0/), which permits unrestricted use, distribution, andreproduction in any medium, provided you give appropriate credit to the original author(s) and the source, provide a link tothe Creative Commons license, and indicate if changes were made. The Creative Commons Public Domain Dedication waiver(http://creativecommons.org/publicdomain/zero/1.0/) applies to the data made available in this article, unless otherwise stated.
Cameron-Christie et al. BMC Medical Genomics (2018) 11:121 https://doi.org/10.1186/s12920-018-0440-0
non-hepatic or biliary symptoms, is the most commonform of the disease [7]. The influence of environmentalfactors is implied by possible correlations between season-ality and disease onset in some cohorts [8–14] (althoughevidence is lacking in others [7, 15–22]), putative associa-tions with viral infections [23–26], the isolation of a planttoxin that causes the disease in livestock of multiple spe-cies [27, 28], and evidence of greater risk in non-urbanchildren [8] and those resident in regions with lowerpopulation density [8]. Genetic factors have also been im-plicated in isolated BA, including a chromosome 10q24.2region identified by Genome Wide Association Studies(GWAS) in both SE Asian and European populations withan odds ratio of 1.45–1.77 [29–31]. However, no highlypenetrant genetic factors involved in the isolated form ofthe disease have been identified to date.There are well-replicated differences in the preva-
lence of BA, both between ethnically different popula-tions [12, 21, 32–35], and between ethnic groups livingwithin the same region [36, 37], and the establishedpredisposition to this disease in New Zealand Māoriwhich was re-evaluated recently (author HME, In press,[38]). Elevated rates are found in certain populationsacross different countries, climates and socio-economiccontexts, with particularly high rates in East-Asian [11, 21,22, 32, 39–43] and Polynesian groups [14, 18, 35, 44],including New Zealand Māori [38]. A difference inresponse to treatment has also been observed inAfrican-Americans [45], who also have a higher rate ofBA than European Americans [9, 46]. Together thesedata suggest that ethnicity-specific, possibly genetic,risk factors influence the incidence and course of thisdisease.Māori are the indigenous population of New Zealand,
descended from Polynesian explorers c.750 years ago [47].During the migration of large numbers of Europeans inthe early nineteenth century, the Māori population de-clined precipitously due to introduced diseases and con-flict [48, 49]. Subsequently the population has grown toover 600,000 people, living in NZ and overseas. There hasbeen substantial admixture with post-colonial settlers ofmainly European descent [50], although approximatelyhalf of those who identify as Māori do not also identifywith another ethnicity [51]. Studies three decades ago re-ported a 10-fold increase in the rate of BA in Māori rela-tive to NZ Europeans [52]. Over the last two decades,mandatory referral of all cases of BA to a national centrefor treatment (Starship Children's Health, Auckland) hasfacilitated the recalculation of the risk for this disorderamongst Māori to approximately 3-fold over that ob-served in NZ Europeans [38]. This recent study also foundthat BA in children with Māori ancestry is qualitativelydifferent from those of European-only descent, in thatMāori children with BA are more likely to be effectively
palliated by the Kasai procedure, and hence develop a re-quirement for liver transplant much later.An iwi (often translated as “tribe” but also the less struc-
tured “people” [53]) is the largest unit of Māori societyoperating as both a social and legal distinction. Identifica-tion with an iwi is a cultural connection that also signifiescommon biological ancestry [49] back to the original Poly-nesian founders of New Zealand [54]. This ancestry is re-corded by Māori through detailed whakapapa (‘genealogy’)as a fundamental aspect of their culture. Māori member-ship of an iwi, along with smaller societal units such ashāpu (‘clan’) and whanau (‘extended family’) are thereforeof genealogical relevance. However, Māori social organisa-tion has been dynamic and adaptive prior to, and afterEuropean colonisation [53, 55]. Historical evidence showssignificant geographical movement and intermarriage ofthe communities who now identify as iwi [56, 57]. Thispaper investigates BA in two New Zealand iwi, withshared history and intermarriage (referred to as a singleiwi here), named Ngāiterangi and Ngāti Ranginui. A muchgreater number of BA cases than expected, based on NZprevalence rates, has been reported in this iwi over the lasttwenty-five years.We hypothesise that the elevated rate of BA in the
iwi is due to a genetic susceptibility. We show that theiwi as a whole does not exhibit characteristics of repro-ductive isolation, making it unlikely that a major shiftin the allele frequency of many low-risk alleles couldhave occurred by drift to confer a susceptibility to thedevelopment of BA. These observations are congruentwith a model that proposes that a dominantly-acting,low-penetrance susceptibility factor could explain thiscluster of BA cases.
MethodsEthicsAll subjects were ascertained by physician-initiated re-ferral and consented to participate under a protocolapproved by the Southern Regional Ethics Committee(13/STH/56).
Patient ascertainment and ethnicityPatient information was ascertained from the nationalregistry of BA patients and curated by one of the au-thors (HME). Patients were classified as Māori follow-ing interview to ascertain a prioritized ethnicity, ahierarchical system commonly used in NZ to attributea single ethnicity to those with multiple contributingethnicities. In this system, Māori ethnicity is classifiedas the highest hierarchy. Mothers of affected iwi indi-viduals retrospectively self-reported their health statusand any medical issues of note during the course oftheir pregnancies.
Cameron-Christie et al. BMC Medical Genomics (2018) 11:121 Page 2 of 13
DNA genotyping and sequencingES was performed and SNP array data was genotyped forthe following individuals within the iwi (see iwi descrip-tion below): all living, affected individuals (J-5 to J-7 andI-1 to I-5) and their parents (with the exception of thefather of J-5), the I-1 sibling with a choledochal cyst, themother of J-1, and the parents of J-4. DNA extractionfrom blood was performed using Wizard® Genomic DNAPurification Kit from Promega. FFPE DNA extracted byZymo FFPE DNA miniprep and Zymo purification kit(ZR-96 DNA Clean & Concentrator™-5) was used forFFPE samples. Genotyping was performed using theOmni1-Quad and Omni5 chip platforms (Illumina) andExome Sequencing (ES) (Roche SeqCap EZ2, AgilentSureSelect Human AV4, and AV4 +UTR Exon capturechips) was performed by Otogenetics (Atlanta, GA, USA)on the Illumina HiSeq 2000 platform.FASTQ files were aligned, processed and called on a
pipeline consistent with the Genome Analysis Toolkit(GATK) Best Practices [58], and used BWA-MEM [59] foralignment, Picard for sorting and marking duplicates, andGATK IndelRealigner for indel realigning followed by basequality score recalibration and GATK’s Haplotypecallerfor individual variant calling followed by joint genotypingwith GenotypeGVCFs to produce a multi-sample VariantCall Format (VCF) file. Variant annotation performed withSNPeff [60]. Over the patient group, variants were fittedto either a monoallelic (dominant) model or a biallelic(recessive) model.
Population dataRates of BA across the entire iwi were determined usingpopulation estimates from census data of New Zealandersciting membership of the iwi who were born from 1988onwards, a period for which census and national BA datawere available and which incorporates the period duringwhich the iwi children with BA were born. Populationsize estimates for affected Pedigree J individuals (seeiwi description below) were estimated as ~ 850 peopleborn in the last 30 years, based on historical records offounder pair J’s children and the growth of the Māoripopulation since the birth of those children (Additionalfile 1: Table S1).
SoftwareSTRUCTURE and EIGENSOFT’s Principal componentanalysis (PCA) were used to investigate populationstructure in the samples. STRUCTURE is an algorithmthat uses Bayesian clustering to both estimate allele fre-quencies for a given number of populations, and assignsamples to those populations, without a priori informa-tion about the samples’ expected groupings. STRUC-TURE was run iteratively over 10 populations, each with5 iterations and random seeds. StructureHarvester [61]
was used to determine the most likely number of discretepopulations (K) across the whole cohort using data gener-ated by STRUCTURE [62]. CLUMPAK [63] was used tosummate and visualise the data for the selected K-value(population number). EIGENSOFT uses PCA to definediscrete patterns across many dimensions of data (in thiscase, > 7000 genetic markers). Germline [64] was used tocall runs of markers for homozygosity analysis. Allelefrequencies used in FEstim [65] were estimated usingPlink [66] from 28 unrelated Māori.
Statistical analysisR Software [67] was used for statistical analysis ofFEstim and homozygous-by-state (HBS) data, while Stata14.2 [68] was used for other statistical analyses includingcalculating relative risks. Incidence rate ratios wereobtained from Poisson regression using calendar monthor season (quartiles of January–March, April–June, July–September, and October–December) while adjusting foryear as a continuous predictor. Probability that the riskof BA is altered by birth month was expressed using theWald test [69, 70]. For one-sided statistical analyses(Chi-squared, Wald) P < 0.05 indicates threshold ofstatistical significance, for two-sided (two-sided T-tests),P < 0.025 indicates threshold of statistical significance(signficance P < 0.05 when accounting for both tails).
Description of iwi cluster and pedigree structureOver the period 1991–2009, incidental note was made ofa high rate (n = 7) of BA in Māori children resident in theBay of Plenty region of New Zealand, on the east coast ofthe North Island. Some family members were related toother historical BA cases from the area, and also to an-other affected child born elsewhere in New Zealand.These family members identified as part of two Bay ofPlenty iwi, which will be referred to as ‘the iwi’ singular forbrevity. At the 2013 census, 3.1% of all Māori identify aspart of this iwi, as well as 11.6% of Māori who were resi-dent in the Bay of Plenty [51], making them the 3rd and5th most common iwi reported in this region. However,all the children born with BA in this Bay of Plenty clusteridentified in this iwi except for one (I-5, Fig. 1 & Fig. 2),and this child reported close geographical and familialconnections to other affected children. Five other affectedindividuals living elsewhere in NZ also had whakapapaconnections to the iwi and were also born during the sametime period.Extensive whakapapa (recounting of lineage and familial
relationships) by family members was used to construct apedigree of the seven children with known relatedness(Fig. 1, J-1 to J-7), extending back seven generations to aMāori-European founder pair in the early nineteenthCentury (Founder Pair J). This extended family (denoted‘Pedigree J’ in this work) in the context of the wider
Cameron-Christie et al. BMC Medical Genomics (2018) 11:121 Page 3 of 13
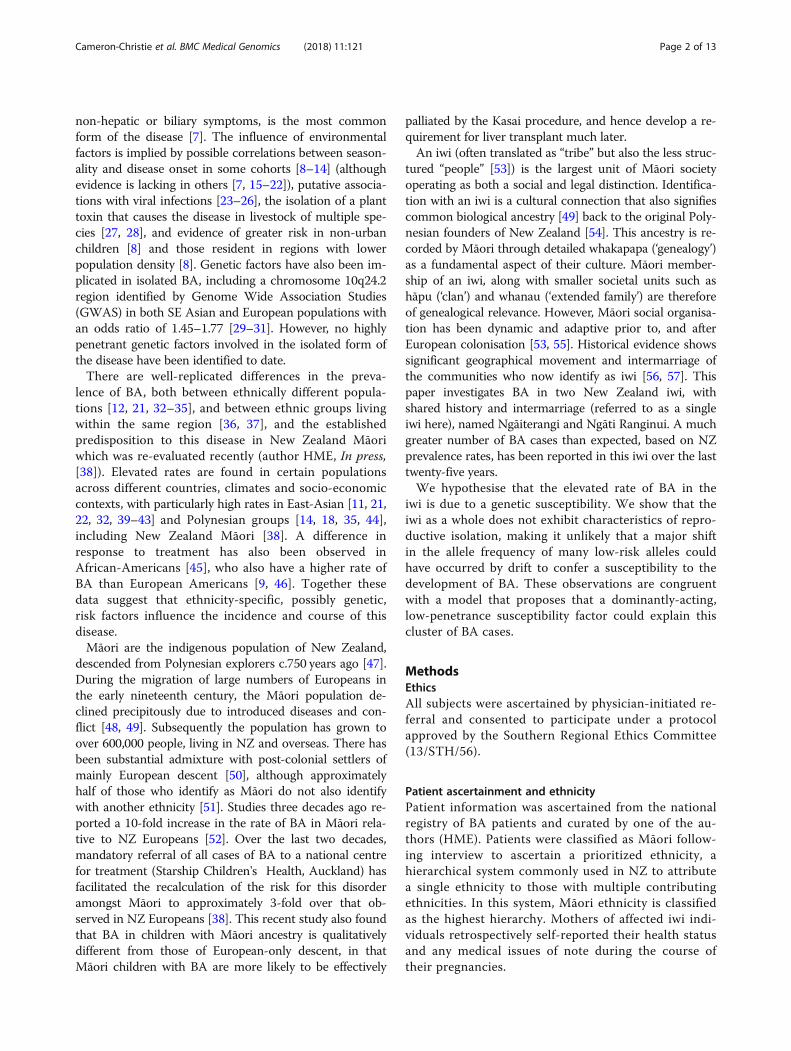
pedigree is shown in Fig. 1. The remaining five affectedindividuals (I-1 to I-5) could not be explicitly linked to thispedigree by unbroken lines of ancestry but neverthelesscan be considered to be related to the iwi with high confi-dence given the centrality of whakapapa and lineage toMāori culture.This entire group of 12 affected individuals are therefore
considered to be ancestrally connected. Eleven of these in-dividuals had isolated BA, while one (J-2) was excludedfrom analysis because they presented with syndromic BAwith co-existing complex congenital heart disease in thecontext of a history of poorly controlled maternal diabetesduring pregnancy. They were excluded from geneticanalysis, but were included in calculations of populationincidence figures in keeping with previously publishedliterature, as syndromic BA is not distinguished fromnon-syndromic presentations in most population-widestudies of the disorder. A thirteenth individual, who is thesibling of an individual with BA, underwent surgery for acongenital choledochal cyst (CC) but had no atresia of thebile ducts. This child was not included in calculations ofBA incidence but had ES and array data collected. Apartfrom this instance there were no instances of recurrenceof BA among 20 siblings of affected individuals (by 2009).
Furthermore, there were no cases of BA reported fromwithin the iwi or pedigree prior to 1991, even after exten-sive liaison and questioning with the extended family iwikuia and kaumatua (elders) and their constituent whānau(extended families, friends and supporters).
ResultsThe clinical observation of an apparently elevated rate ofBA prompted us to formally calculate the incidence ofBA in this iwi. The rate of BA was estimated relative tothat observed in all Māori who did not identify as amember of the iwi. For this estimation, the affected indi-viduals in the iwi were divided into two groups; thosethat could name shared ancestors through unbrokenlineages (J-1 to J-7 or “Group J”), and a broader groupthat included the pedigree and also those who had con-nections to the iwi but could not cite them explicitly(I-1 to I-5). Census data from 2013 of living individualsborn since 1988 was used as a denominator for estimat-ing rates because these data covered the period of allaffected iwi births and included iwi identification. Nonew BA cases had been reported in the iwi since theinitial 2009 observation of the cluster. The populationsize of the affected generation descended from Couple J
Fig. 1 Pedigree of the twelve BA families from the iwi (twelve shaded individuals with BA, one half-shaded with a choledochal cyst). The birthdates for the children of the Pedigree J founders are in the mid to early nineteenth century. Affected individuals born after the year 2000 areshown in the bottom row while those before the year 2000 are in the row immediately above. Many other siblings and family members are notshown for brevity. Dotted lines represent instances where explicit, contiguous connections to the rest of the iwi via named individuals wereabsent, but the members reported kinship via older ancestors. Affected individuals in the J-group are labelled J-1 to J-7, while those from thewider iwi are I-1 to I-5. The sibling with a choledochal cyst is labelled as ‘cc’. Generation labels are given only for the J-Group, beginning withCouple J (indicated with an asterix)
Cameron-Christie et al. BMC Medical Genomics (2018) 11:121 Page 4 of 13
(Additional file 1: Table S1) was estimated by beginningwith documented numbers of children and extrapolatingtheir offspring at each subsequent generation from thepopulation growth rates of Māori at each generation[48]. This assumes that an average of one in three ances-tral couples were from within the same lineage based onthe rate of intermarriage calculated empirically in the re-ported pedigree.Excluding the affected individuals who identify as part
of the iwi, 49 children with Māori ancestry were born withBA in the same period as the iwi BA cases, from a popula-tion ~ 30 times larger than the iwi population under study.Over the same period, 43 children of European ethnicitywere diagnosed with BA. This translates to a rate of BA inthe wider iwi of 1 in 903 live births, compared to a rate of1 in 6110 in the general Māori population and 1 in 22,228in the NZ European population. The incidence of thedisorder in the central pedigree (Group J) as defined inFig. 1 is even higher than the wider iwi, estimated at 1in 121.
Relative rates are shown in Table 1, which shows theratio of BA incidence in the iwi and sub-groups com-pared to relevant control populations; multiple ratios forthe J-Group are shown, comparing them to the iwi andto the Māori population whether or not the iwi is includedin this control group. Children who identify as a memberof the iwi have a 7-fold greater risk of BA than Māori chil-dren in New Zealand who are not part of this iwi (RR 7,χ21 = 44.2, 95% Confidence Interval (CI) 4–13, P < 0.001).However, Pedigree J individuals have a 19-fold greater riskthan iwi children who are not part of the pedigree (RR 19,χ21 = 42.69, 95% CI 6–64, P < 0.001) and a 50-fold greaterrisk of BA compared to non-iwi Māori (RR 50, χ21 =296, 95% CI 23–111, P < 0.001). In contrast, iwi indi-viduals outside the central pedigree have a 2.7 timesincrease in BA rates compared to non-iwi Māori (χ21 =3.93, 95% CI 1–7, P = 0.048). As expected from previ-ous reports on the incidence of BA in New Zealand,and in Asian and Pacific populations, Māori have asignificantly higher risk of BA compared to Europeans
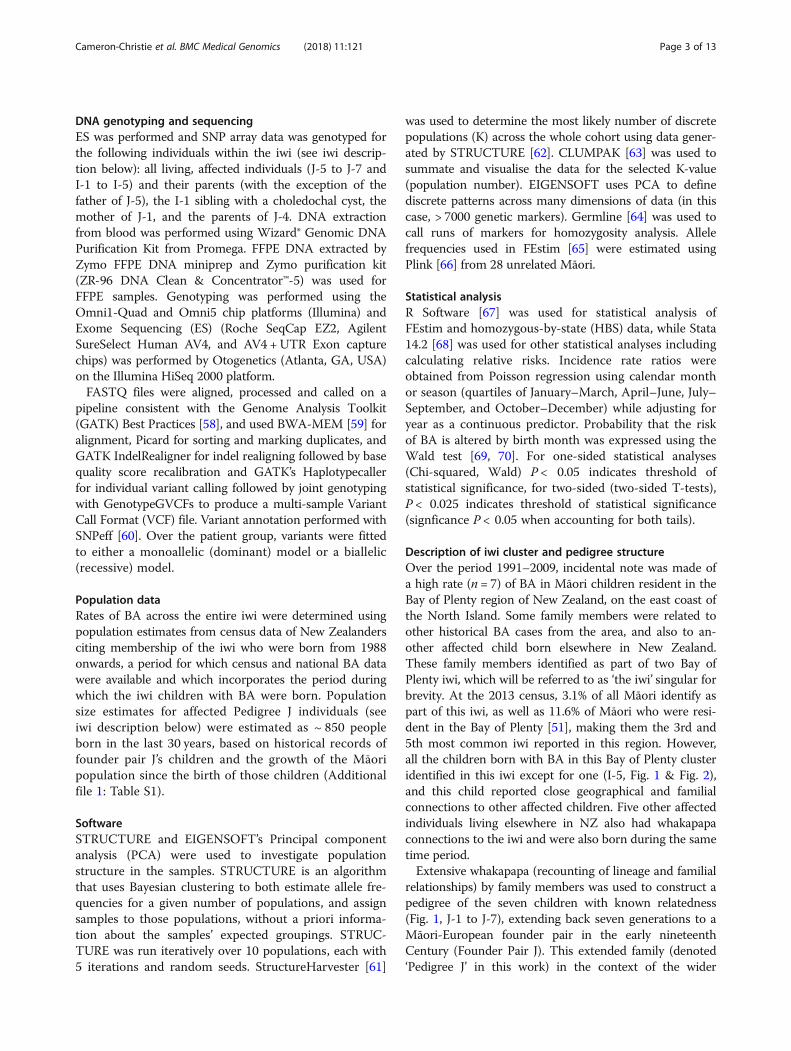
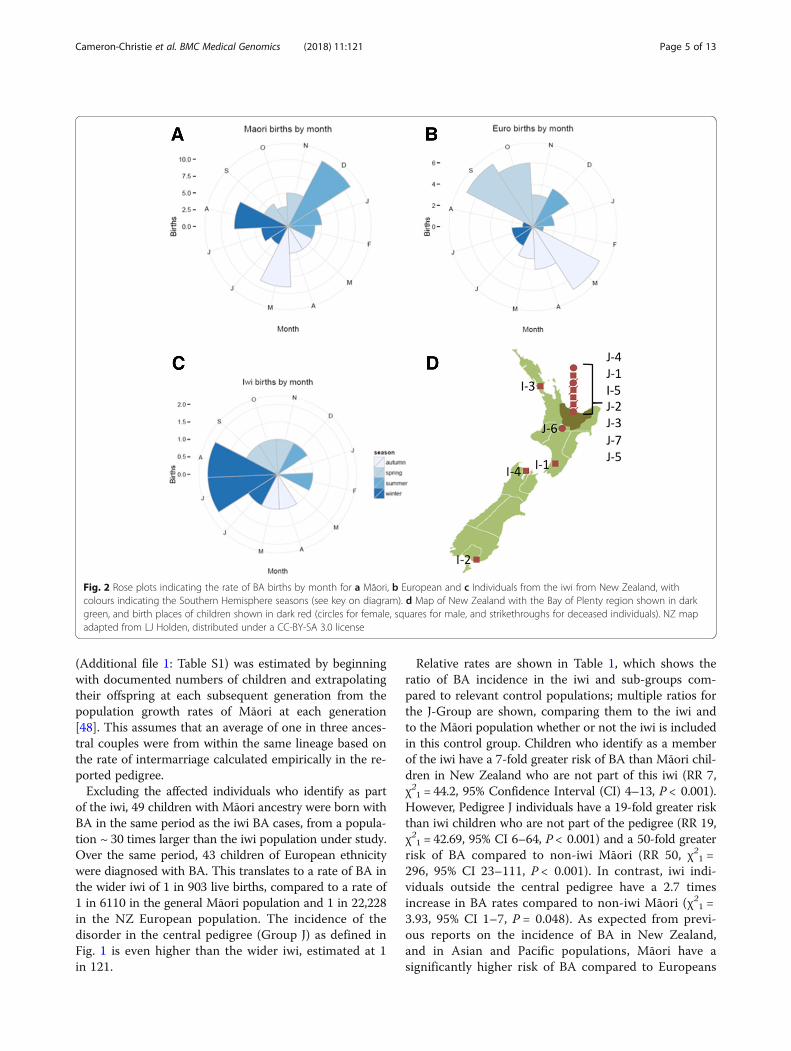
Fig. 2 Rose plots indicating the rate of BA births by month for a Māori, b European and c Individuals from the iwi from New Zealand, withcolours indicating the Southern Hemisphere seasons (see key on diagram). d Map of New Zealand with the Bay of Plenty region shown in darkgreen, and birth places of children shown in dark red (circles for female, squares for male, and strikethroughs for deceased individuals). NZ mapadapted from LJ Holden, distributed under a CC-BY-SA 3.0 license
Cameron-Christie et al. BMC Medical Genomics (2018) 11:121 Page 5 of 13
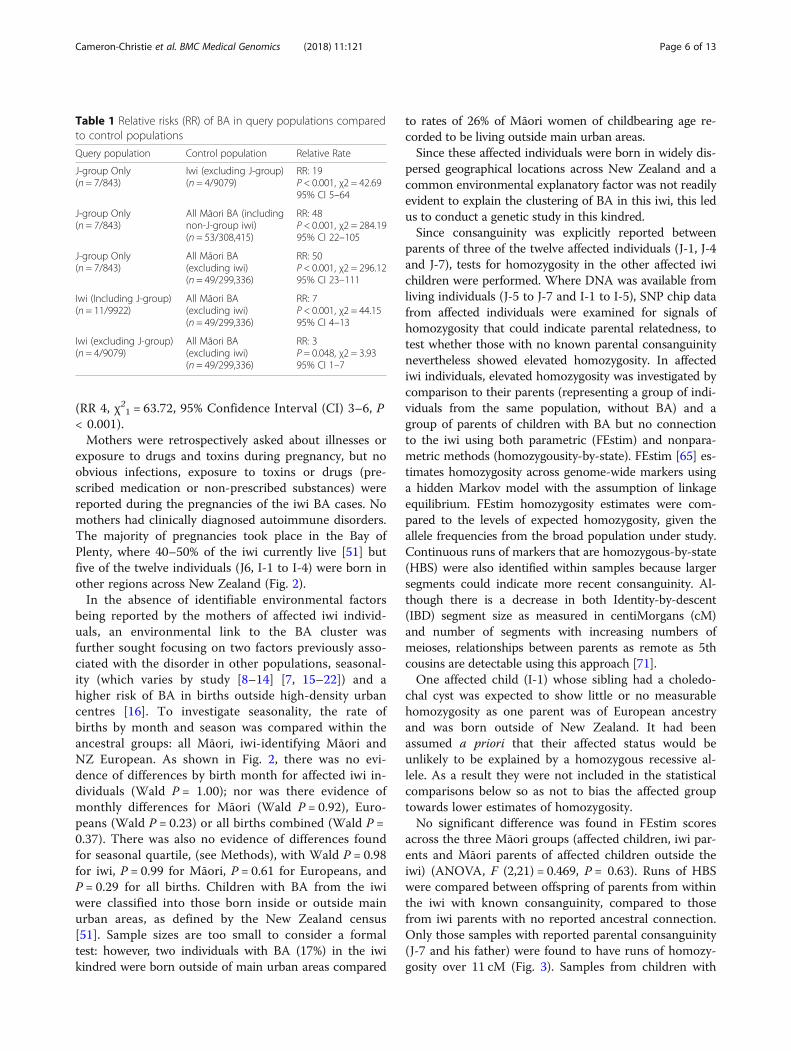
(RR 4, χ21 = 63.72, 95% Confidence Interval (CI) 3–6, P< 0.001).Mothers were retrospectively asked about illnesses or
exposure to drugs and toxins during pregnancy, but noobvious infections, exposure to toxins or drugs (pre-scribed medication or non-prescribed substances) werereported during the pregnancies of the iwi BA cases. Nomothers had clinically diagnosed autoimmune disorders.The majority of pregnancies took place in the Bay ofPlenty, where 40–50% of the iwi currently live [51] butfive of the twelve individuals (J6, I-1 to I-4) were born inother regions across New Zealand (Fig. 2).In the absence of identifiable environmental factors
being reported by the mothers of affected iwi individ-uals, an environmental link to the BA cluster wasfurther sought focusing on two factors previously asso-ciated with the disorder in other populations, seasonal-ity (which varies by study [8–14] [7, 15–22]) and ahigher risk of BA in births outside high-density urbancentres [16]. To investigate seasonality, the rate ofbirths by month and season was compared within theancestral groups: all Māori, iwi-identifying Māori andNZ European. As shown in Fig. 2, there was no evi-dence of differences by birth month for affected iwi in-dividuals (Wald P = 1.00); nor was there evidence ofmonthly differences for Māori (Wald P = 0.92), Euro-peans (Wald P = 0.23) or all births combined (Wald P =0.37). There was also no evidence of differences foundfor seasonal quartile, (see Methods), with Wald P = 0.98for iwi, P = 0.99 for Māori, P = 0.61 for Europeans, andP = 0.29 for all births. Children with BA from the iwiwere classified into those born inside or outside mainurban areas, as defined by the New Zealand census[51]. Sample sizes are too small to consider a formaltest: however, two individuals with BA (17%) in the iwikindred were born outside of main urban areas compared
to rates of 26% of Māori women of childbearing age re-corded to be living outside main urban areas.Since these affected individuals were born in widely dis-
persed geographical locations across New Zealand and acommon environmental explanatory factor was not readilyevident to explain the clustering of BA in this iwi, this ledus to conduct a genetic study in this kindred.Since consanguinity was explicitly reported between
parents of three of the twelve affected individuals (J-1, J-4and J-7), tests for homozygosity in the other affected iwichildren were performed. Where DNA was available fromliving individuals (J-5 to J-7 and I-1 to I-5), SNP chip datafrom affected individuals were examined for signals ofhomozygosity that could indicate parental relatedness, totest whether those with no known parental consanguinitynevertheless showed elevated homozygosity. In affectediwi individuals, elevated homozygosity was investigated bycomparison to their parents (representing a group of indi-viduals from the same population, without BA) and agroup of parents of children with BA but no connectionto the iwi using both parametric (FEstim) and nonpara-metric methods (homozygousity-by-state). FEstim [65] es-timates homozygosity across genome-wide markers usinga hidden Markov model with the assumption of linkageequilibrium. FEstim homozygosity estimates were com-pared to the levels of expected homozygosity, given theallele frequencies from the broad population under study.Continuous runs of markers that are homozygous-by-state(HBS) were also identified within samples because largersegments could indicate more recent consanguinity. Al-though there is a decrease in both Identity-by-descent(IBD) segment size as measured in centiMorgans (cM)and number of segments with increasing numbers ofmeioses, relationships between parents as remote as 5thcousins are detectable using this approach [71].One affected child (I-1) whose sibling had a choledo-
chal cyst was expected to show little or no measurablehomozygosity as one parent was of European ancestryand was born outside of New Zealand. It had beenassumed a priori that their affected status would beunlikely to be explained by a homozygous recessive al-lele. As a result they were not included in the statisticalcomparisons below so as not to bias the affected grouptowards lower estimates of homozygosity.No significant difference was found in FEstim scores
across the three Māori groups (affected children, iwi par-ents and Māori parents of affected children outside theiwi) (ANOVA, F (2,21) = 0.469, P = 0.63). Runs of HBSwere compared between offspring of parents from withinthe iwi with known consanguinity, compared to thosefrom iwi parents with no reported ancestral connection.Only those samples with reported parental consanguinity(J-7 and his father) were found to have runs of homozy-gosity over 11 cM (Fig. 3). Samples from children with
Table 1 Relative risks (RR) of BA in query populations comparedto control populations
Query population Control population Relative Rate
J-group Only(n = 7/843)
Iwi (excluding J-group)(n = 4/9079)
RR: 19P < 0.001, χ2 = 42.6995% CI 5–64
J-group Only(n = 7/843)
All Māori BA (includingnon-J-group iwi)(n = 53/308,415)
RR: 48P < 0.001, χ2 = 284.1995% CI 22–105
J-group Only(n = 7/843)
All Māori BA(excluding iwi)(n = 49/299,336)
RR: 50P < 0.001, χ2 = 296.1295% CI 23–111
Iwi (Including J-group)(n = 11/9922)
All Māori BA(excluding iwi)(n = 49/299,336)
RR: 7P < 0.001, χ2 = 44.1595% CI 4–13
Iwi (excluding J-group)(n = 4/9079)
All Māori BA(excluding iwi)(n = 49/299,336)
RR: 3P = 0.048, χ2 = 3.9395% CI 1–7
Cameron-Christie et al. BMC Medical Genomics (2018) 11:121 Page 6 of 13
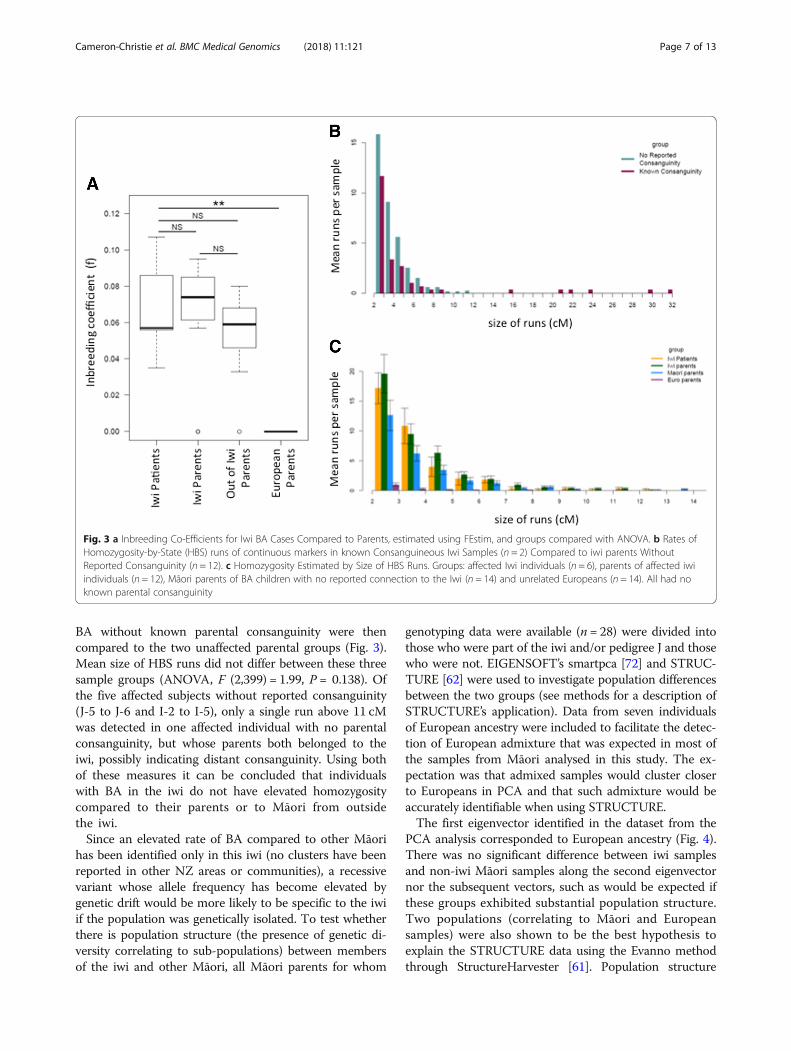
BA without known parental consanguinity were thencompared to the two unaffected parental groups (Fig. 3).Mean size of HBS runs did not differ between these threesample groups (ANOVA, F (2,399) = 1.99, P = 0.138). Ofthe five affected subjects without reported consanguinity(J-5 to J-6 and I-2 to I-5), only a single run above 11 cMwas detected in one affected individual with no parentalconsanguinity, but whose parents both belonged to theiwi, possibly indicating distant consanguinity. Using bothof these measures it can be concluded that individualswith BA in the iwi do not have elevated homozygositycompared to their parents or to Māori from outsidethe iwi.Since an elevated rate of BA compared to other Māori
has been identified only in this iwi (no clusters have beenreported in other NZ areas or communities), a recessivevariant whose allele frequency has become elevated bygenetic drift would be more likely to be specific to the iwiif the population was genetically isolated. To test whetherthere is population structure (the presence of genetic di-versity correlating to sub-populations) between membersof the iwi and other Māori, all Māori parents for whom
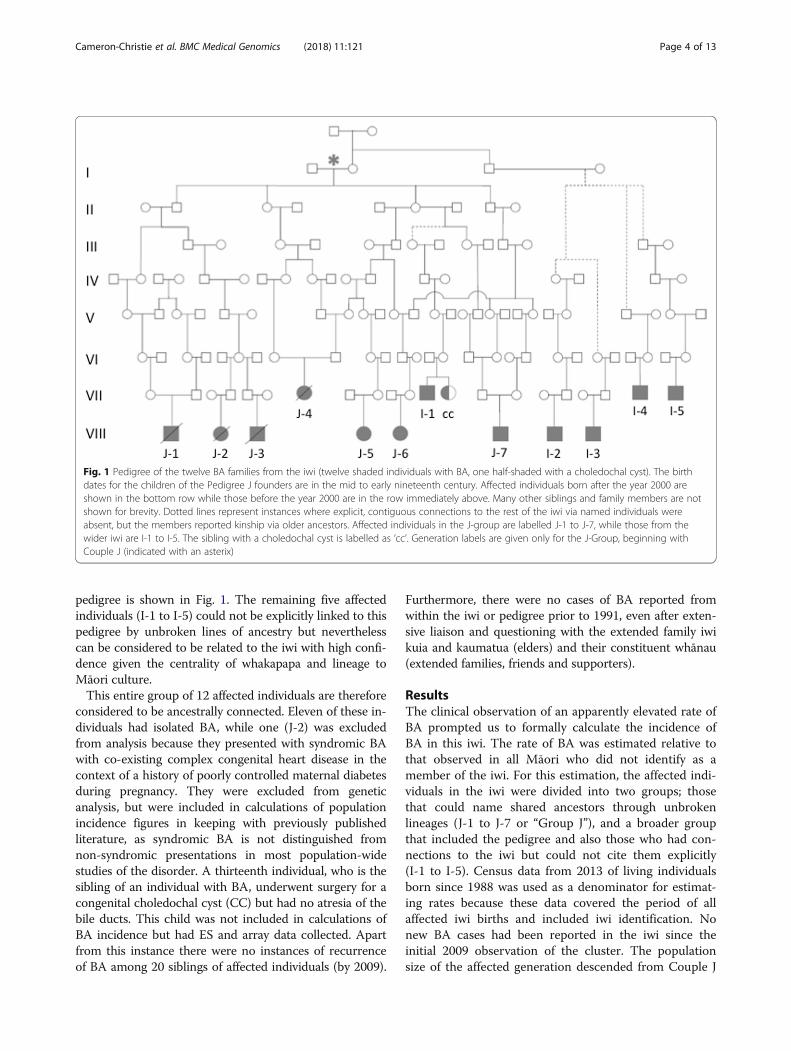
genotyping data were available (n = 28) were divided intothose who were part of the iwi and/or pedigree J and thosewho were not. EIGENSOFT’s smartpca [72] and STRUC-TURE [62] were used to investigate population differencesbetween the two groups (see methods for a description ofSTRUCTURE’s application). Data from seven individualsof European ancestry were included to facilitate the detec-tion of European admixture that was expected in most ofthe samples from Māori analysed in this study. The ex-pectation was that admixed samples would cluster closerto Europeans in PCA and that such admixture would beaccurately identifiable when using STRUCTURE.The first eigenvector identified in the dataset from the
PCA analysis corresponded to European ancestry (Fig. 4).There was no significant difference between iwi samplesand non-iwi Māori samples along the second eigenvectornor the subsequent vectors, such as would be expected ifthese groups exhibited substantial population structure.Two populations (correlating to Māori and Europeansamples) were also shown to be the best hypothesis toexplain the STRUCTURE data using the Evanno methodthrough StructureHarvester [61]. Population structure
Fig. 3 a Inbreeding Co-Efficients for Iwi BA Cases Compared to Parents, estimated using FEstim, and groups compared with ANOVA. b Rates ofHomozygosity-by-State (HBS) runs of continuous markers in known Consanguineous Iwi Samples (n = 2) Compared to iwi parents WithoutReported Consanguinity (n = 12). c Homozygosity Estimated by Size of HBS Runs. Groups: affected Iwi individuals (n = 6), parents of affected iwiindividuals (n = 12), Māori parents of BA children with no reported connection to the Iwi (n = 14) and unrelated Europeans (n = 14). All had noknown parental consanguinity
Cameron-Christie et al. BMC Medical Genomics (2018) 11:121 Page 7 of 13
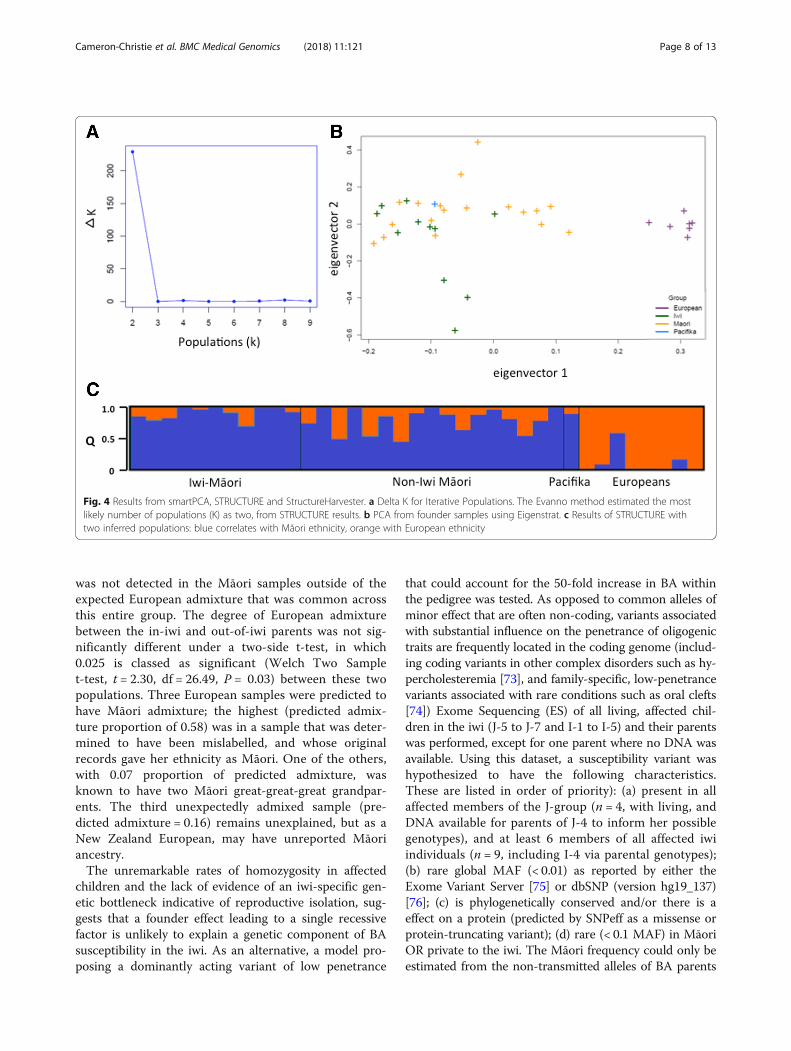
was not detected in the Māori samples outside of theexpected European admixture that was common acrossthis entire group. The degree of European admixturebetween the in-iwi and out-of-iwi parents was not sig-nificantly different under a two-side t-test, in which0.025 is classed as significant (Welch Two Samplet-test, t = 2.30, df = 26.49, P = 0.03) between these twopopulations. Three European samples were predicted tohave Māori admixture; the highest (predicted admix-ture proportion of 0.58) was in a sample that was deter-mined to have been mislabelled, and whose originalrecords gave her ethnicity as Māori. One of the others,with 0.07 proportion of predicted admixture, wasknown to have two Māori great-great-great grandpar-ents. The third unexpectedly admixed sample (pre-dicted admixture = 0.16) remains unexplained, but as aNew Zealand European, may have unreported Māoriancestry.The unremarkable rates of homozygosity in affected
children and the lack of evidence of an iwi-specific gen-etic bottleneck indicative of reproductive isolation, sug-gests that a founder effect leading to a single recessivefactor is unlikely to explain a genetic component of BAsusceptibility in the iwi. As an alternative, a model pro-posing a dominantly acting variant of low penetrance
that could account for the 50-fold increase in BA withinthe pedigree was tested. As opposed to common alleles ofminor effect that are often non-coding, variants associatedwith substantial influence on the penetrance of oligogenictraits are frequently located in the coding genome (includ-ing coding variants in other complex disorders such as hy-percholesteremia [73], and family-specific, low-penetrancevariants associated with rare conditions such as oral clefts[74]) Exome Sequencing (ES) of all living, affected chil-dren in the iwi (J-5 to J-7 and I-1 to I-5) and their parentswas performed, except for one parent where no DNA wasavailable. Using this dataset, a susceptibility variant washypothesized to have the following characteristics.These are listed in order of priority): (a) present in allaffected members of the J-group (n = 4, with living, andDNA available for parents of J-4 to inform her possiblegenotypes), and at least 6 members of all affected iwiindividuals (n = 9, including I-4 via parental genotypes);(b) rare global MAF (< 0.01) as reported by either theExome Variant Server [75] or dbSNP (version hg19_137)[76]; (c) is phylogenetically conserved and/or there is aeffect on a protein (predicted by SNPeff as a missense orprotein-truncating variant); (d) rare (< 0.1 MAF) in MāoriOR private to the iwi. The Māori frequency could only beestimated from the non-transmitted alleles of BA parents
Fig. 4 Results from smartPCA, STRUCTURE and StructureHarvester. a Delta K for Iterative Populations. The Evanno method estimated the mostlikely number of populations (K) as two, from STRUCTURE results. b PCA from founder samples using Eigenstrat. c Results of STRUCTURE withtwo inferred populations: blue correlates with Māori ethnicity, orange with European ethnicity
Cameron-Christie et al. BMC Medical Genomics (2018) 11:121 Page 8 of 13
as no Māori genome-wide datasets are publically available;(e) affects a coding region of the genome (including + 2/− 2bases from a splice-site boundary).Exome coverage across all affected iwi individuals
was above 10 reads for at least 97% of all targetedbases. No variants under a monoallelic or biallelicmodel of inheritance were identified that fulfilled all ofthe criteria listed above. Māori MAF, for which onlylimited information was available, was not used as anexclusionary factor as it did not distriminate betweenany variants already excluded by other means. No vari-ant was observed in 5 or more individuals with BA, thatexhibited at least moderate levels of phylogenetic con-servation (scoring above 0.5 using phastCons [77]), andwas predicted to be protein-altering in ANNOVAR[78]. Variants present in all available J-Group affectedindividuals were also examined (J-5, J-6, J-7, and eitheror both of J-4’s parents), with no requirement to bepresent in other samples. One variant fitted theremaining criteria, a known polymorphism in ERAP1,rs118132132, also carried by I-2. rs118132132 alters ahighly conserved amino acid and is reported only inEast-Asian populations [79], where it is present at aMAF of 1%. The absence of this candidate in 4/9 af-fected iwi individuals despite its relatively high fre-quency in East-Asian populations makes it implausiblethat it could explain this unusual BA cluster.
DiscussionBA has a greater incidence in South-East Asian and Pa-cific populations compared to Europeans, but an elevatedrate has only recently been rigorously demonstrated forNew Zealand Māori. Due to the informal centralised refer-ral of all cases of BA in New Zealand, a cluster of cases inthe Bay of Plenty region was recognised, and multiple af-fected families identified reported distant relatedness toeach other (the pedigree or J-group) or identified theirlineage to the same two overlapping iwi. This iwi repre-sents a unique opportunity to study BA in a cohort whichlikely shares a much stronger common genetic etiology.Taking the iwi and the pedigree as delineated groups, itwas found that significantly more children with BA wereborn into these groups than would be expected in theMāori population not connected to the iwi - 6.8 times therate of BA in the wider iwi and 50-fold in the pedigree.No unusual environmental factors were reported thatwere common to all or most affected children, many ofwhom were born in widely dispersed locations across thecountry. Seasonality was not found to be associated withBA as it has been in other populations.Regional geographical clusters of BA have not been re-
ported before, apart from a high rate reported in FrenchPolynesia [14, 35] and a slight increase in one Scottish re-gion [80], although the NZ iwi risk is an order of magnitude
greater than the incidence in these areas. Of particular noteis that all of the affected iwi children were born in the lastquarter-century, suggesting a recently encountered environ-mental factor could have precipitated the development ofBA in the presence of a genetic predisposition. Identifyingenvironmental factors retrospectively is challenging, espe-cially for a relatively small cohort, but studies are underwayto study possible correlations with BA in the iwi.The sporadic occurrence of BA within the iwi and pedi-
gree makes it difficult to prioritise a genetic model tosearch for these hypothesised factors. Binary traits canoccur both because of discrete, Mendelian factors or dueto the presence of a liability threshold around which theadditive risk from many loci leads to the expression of aphenotype. The study design pursued here can only iden-tify discrete Mendelian factors, as additive risk contributedby many loci needs to be investigated with much largersample sizes and is best pursued with a GWAS design.In this iwi there was no evidence for elevated rates of
homozygosity in most affected individuals whose parentshad no known consanguinity, though high levels of homo-zygosity were noted generally in affected and unaffectedMāori samples from both inside and outside of the iwi.This suggests that if a recessively-acting, high-risk factoris responsible for BA in this iwi, it is attributable torelatedness to common remote ancestors that is not dis-cernible from the high rate of homozygosity in the Māoripopulation more generally, at least using the genomictools deployed here. This level of homozygosity is not un-usual in populations with a recent history of founder ef-fects, such as seen in present-day Finland [79, 80], Iceland[82] and the Greater Middle East [83]. For instance, simi-lar levels of HBS have been seen in Finnish populationsoriginating from founder groups 300–400 years ago [81],in which 90% of samples had runs of HBS > 5 cM.Diseases that exist in a binary state (presence/absence of
the disease) may be explained by the additive effect ofmany low-risk alleles [84], the genetics of which can bedescribed using a liability threshold model. Given thesporadic occurrence of the disease, genetic factors withminor influence on the risk of BA are likely to be presentin this cohort, similar to the ADD3 SNP identified byprevious GWAS [29, 30] with an odds ratio of 1.45 inEuropean and East-Asian populations. Such minor riskfactors may be transmitted by the relatively high-riskMāori background on which the disease cluster has oc-curred. It is possible that a confluence of these low-riskfactors, already present in the general population, couldexplain a higher rate of the disease in one genetically con-nected group. However, a threshold model involving manyloci would require an aggregation of many risk alleles inthe iwi compared to the parental Māori population. Thesealleles would also have to be sufficiently numerous or ofhigh enough risk, to increase the rate of BA by ~ 50-fold.
Cameron-Christie et al. BMC Medical Genomics (2018) 11:121 Page 9 of 13
The greater the number of low-risk alleles proposed by athreshold liability model, the greater the divergence be-tween populations must be, and we found no evidence forthis in this study. If a liability threshold model accuratelyapplied in this instance, it would require some populationhistory that distinguishes the iwi from other Māori, suchas a founder effect coupled with reproductive isolationfrom other Māori. Alternatively there would need to beevidence for dramatic selection (such as for a geographic-ally limited pathogen) acting across many loci, or signifi-cant admixture with an unidentified population carryingthe risk alleles. Likewise, for a recessive factor, the spreadof a causal allele from a very distant ancestor across theiwi would usually be accompanied by demonstrable repro-ductive isolation of the iwi to account for the 50-foldhigher rate of BA in this community compared to thewider population. However, the history of the iwi and thearea is indicative of frequent migrations, intermarriagesand conflict between diverse groups over the past fewhundred years [56, 57] and does not support the separ-ation of the iwi from the Māori population. Supportingthis historical data, PCA analysis (EIGENSOFT) andBayesian clustering (STRUCTURE), found no evidencethat the iwi demonstrated detectable genetic structurecompared to the wider Māori population. If differentialpopulation structure was present between iwi and non-iwiMāori, the two groups would separate along the secondeigenvector in Fig. 4, or a third population correlating withiwi identity would have been found with STRUCTURE(Fig. 4). However, there was no significant difference inthe values of the two groups along this second eigen-vector, and a hypothesis of only two populations (Māoriand European) was shown to be the best hypothesis toexplain the STRUCTURE data. This indicates there hasbeen historic gene flow between the iwi and the widerMāori population. This is counter to a hypothesis ofgenetic isolation favouring an ancestral recessive variantspecific to the iwi, or multiple risk variants, leading to sus-ceptibility to develop BA.An alternative model that was considered here was a
factor inherited from a relatively recent common ancestorwith the low-penetrance of this factor and/or dependenceon environmental modifiers invoked to explain the rela-tively recent appearance of the phenotype. Using ExomeSequencing (ES), no clear candidate variants were identi-fied under either a dominant or recessive model withinthe coding genome to support such a model. Furtherinvestigation to define which regions of the genome theaffected individuals share may reduce the search space forthis putative susceptibility conferring factor. Relevantgenetic elements that could not be considered as poten-tially predisposing to the development of BA in this studyinclude intergenic variants, which are not captured for se-quencing by the exome approach used here but can effect
expression and regulation of one or more genes, and largestructural variants that may not be detected withshort-read sequencing but could change the copy numberof one or more genes. The cluster of BA cases in this iwirepresents a globally and historically unique chance to fur-ther understanding of the etiology of BA.
ConclusionsWe presented a cluster of biliary atresia cases that toour knowledge is unique in the literature, with up to 50times the incidence of the disease compared to analready elevated rate in an indigenous, understudiedNew Zealand Māori population. Despite a complicatedpopulation history of bottlenecking and spare consan-guinity, we found no evidence of elevated homozygosityacross most of the affected children, nor evidence thatthe affected iwi had a history of reproductive isolationfrom the wider Māori population. We proposed that adominant, low-penetrance variant in combination withenvironmental factors could explain this pattern of biliaryatresia, possibly inherited by most of the affected childrenwithin the two centuries spanned by their pedigree. How-ever, Exome Sequencing of all available affected individ-uals did not uncover a plausible candidate variant under amono- or biallelic model, and further research is required,such as investigating alternative categories of variationsuch a copy number.
Additional files
Additional file 1: Table S1. Estimates of the number of extantdescendents of Couple J (DOCX 80 kb)
AbbreviationsANOVA: Analysis of Variance; BA: Biliary Atresia; BWA: Burrows-WheelerAligner; CI: Confidence Interval; cM: centiMorgans; GATK: Genome AnalysisToolkit; GWAS: Genome Wide Association Study; HBS: Homozygosity-by-state;IBD: Identity-by-descent; IBS: Identity-by-state; NZ: New Zealand;PCA: Principal component analysis; RR: Relative Rate; WES: Whole ExomeSequencing
AcknowledgementsThe authors would like to thank all participants for their support for this work.
FundingSRCC was supported by the CureKids Kirsty McDermott MemorialScholarship. SPR was supported by the Health Research Council of NewZealand and Cure Kids New Zealand. RT was supported by an AustralianPostgraduate Award scholarship. MB was supported by an NHMRC SeniorResearch Fellowship (1002098) and NHMRC Program Grant (1054618). Theresearch was funded by CureKids and the Health Research Council of NewZealand, but the funding bodies were not involved in the design of thestudy or the collection, analysis and interpretation of data or the writing ofthe manuscript.
Availability of data and materialsThe sequencing and genotype datasets generated and analysed during thecurrent study are not publicly available as consent for the use of geneticmaterial and subsequent sequencing and genotype data is limited to thestudy of biliary atresia, and sharing of genetic data beyond the scope of thisstudy is contingent on re-consent from the participant/s who provided the
Cameron-Christie et al. BMC Medical Genomics (2018) 11:121 Page 10 of 13
material. Please contact the corresponding author (SR) about the sharing ofdata for the study of biliary atresia. Census population data for NZ is availablethrough Statistics NZ (http://archive.stats.govt.nz) [51].
Authors’ contributionsAll authors contributed to the writing and editing of this manuscript. SRCCperformed the majority of the bioinformatics and writing of the manuscript,JW identified and supported participants in the study, AG performed andadvised statisical analysis, RT and MB made substantial contributions to theconception of the population genetics aspects of the study as well asplanning the bioinformatic analyses. Both reviewed and revised versions ofthe manuscript, DM performed preperatory sequencing bioinformatics andmanaged the sequencing database, HME was the primary contact withparticipants, provided clinical guidance and expertise about biliary atresiaand study design, and SPR the main supervisor and advisor to the projectand a major contact with participants. All authors have read and approvedthis manuscript.
Ethics approval and consent to participateAll subjects were ascertained by physician-initiated referral and consented toparticipate under a protocol approved by the Southern Regional EthicsCommittee, (13/STH/56). All individuals gave written consent for DNAresearch for the purpose of studying BA, or consent was provided by aparent or guardian for underage or deceased individuals.
Consent for publicationNot applicable.
Competing interestsThe authors declare that they have no conflicts of interest. SRCC would liketo declare that since the completion of this study and manuscript, she hasaccepted a role as AstraZeneca UK, in a position which has no relation tothe work described here.
Publisher’s NoteSpringer Nature remains neutral with regard to jurisdictional claims inpublished maps and institutional affiliations.
Author details1Department of Women’s and Children’s Health, Dunedin School ofMedicine, University of Otago, Dunedin 9054, New Zealand. 2Department ofPaediatrics, Tauranga Hospital, Tauranga, New Zealand. 3Department ofPreventive and Social Medicine, University of Otago, Dunedin 9054, NewZealand. 4Population Health and Immunity Division, The Walter and Eliza HallInstitute of Medical Research, 1G Royal Parade, Parkville, VIC 3052, Australia.5Department of Pathology, University of Otago, Dunedin 9054, New Zealand.6Paediatric Gastroenterology and Hepatology, Starship Children’s Health, 2Park Road, Grafton, Auckland 1023, New Zealand. 7Department of MedicalBiology, The University of Melbourne, Parkville, VIC 3010, Australia.
Received: 3 January 2018 Accepted: 27 November 2018
References1. Whitington PF, Balistreri WF. Liver transplantation in pediatrics: indications,
contraindications, and pretransplant management. J Pediatr. 1991;118(2):169–77.
2. Davenport M. Biliary atresia: outcome and management. Indian J Pediatr.2006;73(9):825–8.
3. Guttman OR, Roberts EA, Schreiber RA, Barker CC, Ng VL. The Canadianpediatric hepatology research G: biliary atresia with associated structuralmalformations in Canadian infants. Liver Int. 2011;31(10):1485–93.
4. Tanaka H, Sasaki H, Wada M, Sato T, Kazama T, Nishi K, Kudo H, NakamuraM, Nio M. Postnatal management of prenatally diagnosed biliary cysticmalformation. J Pediatr Surg. 2015;50(4):507–10.
5. Petersen C, Davenport M. Aetiology of biliary atresia: what is actuallyknown? Orphanet J Rare Dis. 2013;8(1):128.
6. Asai A, Miethke A, Bezerra JA. Pathogenesis of biliary atresia: definingbiology to understand clinical phenotypes. Nat Rev Gastroenterol Hepatol.2015;12(6):342–52.
7. Davenport M, FRCS C, Dhawan A. Epidemiologic study of infants with biliaryatresia. Pediatrics. 1998;101(4):729–30.
8. Strickland AD, Shannon K. Studies in the etiology of extrahepatic biliaryatresia: time-space clustering. J Pediatr. 1982;100(5):749–53.
9. Yoon PW, Bresee JS, Olney RS, James LM, Khoury MJ. Epidemiology ofbiliary atresia: a population-based study. Pediatrics. 1997;99(3):376–82.
10. The NS, Honein MA, Caton AR, Moore CA, Siega-Riz AM, Druschel CM. Riskfactors for isolated biliary atresia, National Birth Defects Prevention Study,1997–2002. Am J Med Genet A. 2007;143A(19):2274–84.
11. Nakamizo M, Toyabe S-I, Kubota M, Komata O, Suzuki H, Akazawa K.Seasonality in the incidence of biliary atresia in Japan. Acta Paediatr.2006;95(4):511–2.
12. Fister P, Orel R, Sedmak M, Gvardijančič D, Homan M. Congenitalextrahepatic biliary atresia in children in Slovenia - epidemiologicalretrospective data. Zdravniški Vestnik. 2013;82(2):86–92.
13. Fischler B, Papadogiannakis N, Nemeth A. Aetiological factors in neonatalcholestasis. Acta Paediatr. 2001;90(1):88–92.
14. Girard M, Jannot AS, Besnard M, Leutenegger AL, Jacquemin E, Lyonnet S,Henrion-Caude A. Polynesian ecology determines seasonality of biliaryatresia. Hepatology. 2011;54(5):1893–4.
15. Ayas MF, Hillemeier AC, Olson AD. Lack of evidence for seasonal variation inextrahepatic biliary atresia during infancy. J Clin Gastroenterol. 1996;22(4):292–4.
16. Livesey E, Borja MC, Sharif K, Alizai N, McClean P, Kelly D, Hadzic N,Davenport M. Epidemiology of biliary atresia in England and Wales (1999–2006). Arch Dis Child Fetal Neonatal Ed. 2009;94(6):F451–5.
17. Fischler B, Haglund B, Hjern A. A population-based study on the incidenceand possible pre- and perinatal etiologic risk factors of biliary atresia. JPediatr. 2002;141(2):217–22.
18. Chardot C, Carton M, Spire-Bendelac N, Pommelet CL, Golmard J-L, AuvertB. Epidemiology of biliary atresia in France: a national study 1986–96. JHepatol. 1999;31(6):1006–13.
19. Houwen RHJ, Kerremans IIA, Vansteenselmoll HA, Vanromunde LKJ, BijleveldCMA, Schweizer P. Time-space distribution of extrahepatic biliary atresia inthe Netherlands and West-Germany. Zeitschrift Fur Kinderchirurgie-Surgeryin Infancy and Childhood. 1988;43(2):68–71.
20. Wildhaber BE, Majno P, Mayr J, Zachariou Z, Hohlfeld J, Schwoebel M, KistlerW, Meuli M, Le Coultre C, Mentha G, et al. Biliary Atresia: Swiss NationalStudy, 1994–2004. J Pediatr Gastroenterol Nutr. 2008;46(3):299–307. https://doi.org/10.1097/MPG.1090b1013e3181633562.
21. Tiao M-M, Tsai S-S, Kuo H-W, Chen C-L, Yang C-Y. Epidemiological featuresof biliary atresia in Taiwan, a national study 1996–2003. J GastroenterolHepatol. 2008;23(1):62–6.
22. Wada H, Muraji T, Yokoi A, Okamoto T, Sato S, Takamizawa S, Tsugawa J,Nishijima E. Insignificant seasonal and geographical variation in incidence ofbiliary atresia in Japan: a regional survey of over 20 years. J Pediatr Surg.2007;42(12):2090–2.
23. Fischler B, Ehrnst A, Forsgren M, Örvell C, Nemeth A. The viral Association ofNeonatal Cholestasis in Sweden: a possible link between cytomegalovirusinfection and extrahepatic biliary atresia. J Pediatr Gastroenterol Nutr. 1998;27(1):57–64.
24. De Tommaso A, Andrade P, Costa S, Escanhoela C, Hessel G. High frequencyof human cytomegalovirus DNA in the liver of infants with extrahepaticneonatal cholestasis. BMC Infect Dis. 2005;5:108.
25. Brindley SM, Lanham AM, Karrer FM, Tucker RM, Fontenot AP, Mack CL.Cytomegalovirus-specific T-cell reactivity in biliary atresia at the time ofdiagnosis is associated with deficits in regulatory T cells. Hepatology. 2012;55(4):1130–8.
26. Riepenhoff-Talty M, Gouvea V, Evans MJ, Svensson L, Hoffenberg E, Sokol RJ,Uhnoo I, Greenberg SJ, Schäkel K, Zhaori G, et al. Detection of group C rotavirusin infants with extrahepatic biliary atresia. J Infect Dis. 1996;174(1):8–15.
27. Harper PAW, Plant JW, Ungers DB. Congenital biliary atresia and jaundice inlambs and calves. Aust Vet J. 1990;67(1):18–22.
28. Lorent K, Gong WL, Koo KA, Waisbourd-Zinman O, Karjoo S, Zhao X, Sealy I,Kettleborough RN, Stemple DL, Windsor PA, et al. Identification of a plantisoflavonoid that causes biliary atresia. Sci Transl Med. 2015;7(286);286ra67.
29. Garcia-Barcela M-M, Yeung M-Y, Miao X-P, Tang CS-M, Cheng G, So M-T,Ngan E-W, Lui VC-H, Chen Y, Liu X-L, et al. Genome-wide association studyidentifies a susceptibility locus for biliary atresia on 10q24.2. HumanMolecular Genetics. 2011;20(5):1048.
30. Tsai E, Grochowski C, Loomes K, Bessho K, Hakonarson H, Bezerra J, Russo P,Haber B, Spinner N, Devoto M. Replication of a GWAS signal in a Caucasian
Cameron-Christie et al. BMC Medical Genomics (2018) 11:121 Page 11 of 13
population implicates ADD3 in susceptibility to biliary atresia. Hum Genet.2014;133(2):235–43.
31. Zeng S, Sun P, Chen Z, Mao J, Wang J, Wang B, Liu L. Association betweensingle nucleotide polymorphisms in the ADD3 gene and Susceptibility tobiliary atresia. PLoS One. 2014;9(10):e107977.
32. Nio M, Ohi R, Miyano T, Saeki M, Shiraki K, Tanaka K. Five- and 10-yearsurvival rates after surgery for biliary atresia: a report from the Japanesebiliary atresia registry. J Pediatr Surg. 2003;38(7):997–1000.
33. McKiernan PJ, Baker AJ, Kelly DA. The frequency and outcome of biliaryatresia in the UK and Ireland. Lancet. 2000;355(9197):25–9.
34. Hsiao C-H, Chang M-H, Chen H-L, Lee H-C, Wu T-C, Lin C-C, Yang Y-J, ChenA-C, Tiao M-M, Lau B-H, et al. Universal screening for biliary atresia using aninfant stool color card in Taiwan. Hepatology. 2008;47(4):1233–40.
35. Vic P, Gestas P, Mallet EC, Arnaud JP. Biliary atresia in French Polynesia - a10 year retrospective study. Archives De Pediatrie. 1994;1(7):646–51.
36. Girard M, Jannot A-S, Besnard M, Jacquemin E, Henrion-Caude A. Biliaryatresia: does ethnicity matter? J Hepatol. 2012;57(3):700–1.
37. Jimenez-Rivera C, Jolin-Dahel KS, Fortinsky KJ, Gozdyra P, Benchimol EI.International incidence and outcomes of biliary atresia. J PediatrGastroenterol Nutr. 2013;56(4):344–54.
38. Evans HM, Asher MI, Cameron-Christie S, Farthing S, McCall J, Robertson SP,Wong H, Morreau PN. Ethnic Disparity in the Incidence and Outcome ofBiliary Atresia in New Zealand. J Pediatr Gastroenterol Nutr. 2017;66(2);218–21.
39. Matsui A, Sasakia N, Arakawa Y, Ishikawa T, Momoya T, Kasano Y,Yanagisawa M, Tsukagoshi N, Kawai T. Neonatal mass screening for biliaryatresia: a pilot study in Tochigi prefecture, Japan. Screening. 1993;2(4):201–9.
40. Gu Y-H, Yokoyama K, Mizuta K, Tsuchioka T, Kudo T, Sasaki H, Nio M, Tang J,Ohkubo T, Matsui A. Stool Color Card Screening for Early Detection of BiliaryAtresia and Long-Term Native Liver Survival: A 19-Year Cohort Study inJapan. J Pediatr. 2015;166(4):897–902.e891.
41. Lin Y-C, Chang M-H, Liao S-F, Wu J-F, Ni Y-H, Tiao M-M, Lai M-W, Lee H-C,Lin C-C, Wu T-C, et al. Decreasing rate of biliary atresia in Taiwan: a survey,2004–2009. Pediatrics. 2011;128(3):e530–6.
42. Hung PY, Chen CC, Chen WJ, Lai HS, Hsu WM, Lee PH, Ho MC, Chen TH, NiYH, Chen HL, et al. Long-term prognosis of patients with biliary atresia: a 25year summary. J Pediatr Gastroenterol Nutr. 2006;42(2):190–5.
43. Chiu C-Y, Chen P-H, Chan C-F, Chang M-H, Wu T-C. Biliary Atresia in PretermInfants in Taiwan: A Nationwide Survey. J Pediatr. 2013;163(1):100–103.e101.
44. Shim WK, Kasai M, Spence MA. Racial influence on the incidence of biliaryatresia. Prog Pediatr Surg. 1974;6.
45. Arva NC, Russo PA, Erlichman J, Hancock WW, Haber BA, Bhatti TR. Theinflammatory phenotype of the fibrous plate is distinct from the liver andcorrelates with clinical outcome in biliary atresia. Pathology - Res Prac. 2015;211(3):252–60.
46. Caton AR, Druschel CM, McNutt LA. The epidemiology of extrahepaticbiliary atresia in New York state, 1983–98. Paediatr Perinat Epidemiol. 2004;18(2):97–105.
47. Whyte ALH. Human evolution in Polynesia: a molecular biological study;2002.
48. Taupori Māori – Māori population change - Population changes. 1769–1840.[https://teara.govt.nz/en/population-change].
49. Glover M, Rousseau B. 'Your child is your whakapapa': Maori considerationsof assisted reproduction and human relatedness. Sites: J Social AnthropolCult Stud. 2007;4(2):117–36.
50. Edinur HA, Dunn PPJ, Hammond L, Selwyn C, Velickovic ZM, Lea RA,Chambers GK. Using HLA loci to inform ancestry and health in Polynesianand Maori populations. Tissue Antigens. 2012;80(6):509–22.
51. New Zealand Census 2013 [http://www.stats.govt.nz/Census/2013-census.aspx].
52. Schroeder D, Pease PB. Biliary atresia a review of the Auckland experience.Pediatr Surg Int. 1989;4(2):101–4.
53. Ballara A: Iwi: The dynamics of Māori tribal organisation from c. 1769 to c.1945: Victoria University Press; 1998.
54. Mead HM: Tikanga Māori: living by Māori values: Huia publishers; 2003.55. Van Meijl T. Maori socio-political organization in pre-and proto-history: on
the evolution of post-colonial constructs. Oceania. 1995:304–22.56. Steedman JAW: Nga ohaaki o nga whanau o Tauranga Moana - known
genealogies and history of the Maori families of Tauranga and surroundingdistricts. Tauranga, J. A. W. Steedman; 1986.
57. Stafford DM: Te Arawa: a history of the Arawa people: reed; 1967.
58. McKenna A, Hanna M, Banks E, Sivachenko A, Cibulskis K, Kernytsky A,Garimella K, Altshuler D, Gabriel S, Daly M. The genome analysis toolkit: aMapReduce framework for analyzing next-generation DNA sequencing data.Genome Res. 2010;20(9):1297–303.
59. Li H: Aligning sequence reads, clone sequences and assembly contigs withBWA-MEM. arXiv preprint arXiv:13033997 2013.
60. Cingolani P, Platts A, Wang LL, Coon M, Nguyen T, Wang L, Land SJ, Lu X,Ruden DM. A program for annotating and predicting the effects of singlenucleotide polymorphisms, SnpEff: SNPs in the genome of Drosophilamelanogaster strain w1118; iso-2; iso-3. Fly. 2012;6(2):80–92.
61. Earl DA. STRUCTURE HARVESTER: a website and program for visualizingSTRUCTURE output and implementing the Evanno method. Conserv GenetResour. 2012;4(2):359–61.
62. Pritchard JK, Stephens M, Donnelly P. Inference of population structureusing multilocus genotype data. Genetics. 2000;155(2):945–59.
63. Kopelman NM, Mayzel J, Jakobsson M, Rosenberg NA, Mayrose I. Clumpak: aprogram for identifying clustering modes and packaging populationstructure inferences across K. Mol Ecol Resour. 2015;15(5):1179–91.
64. Gusev A, Lowe J, Stoffel M, Daly M, Altshuler D, Breslow J, Friedman J, Pe'erI. Whole population, genome-wide mapping of hidden relatedness.Genome Res. 2009;19(2):318–26.
65. Leutenegger A-L, Prum B, Génin E, Verny C, Lemainque A, Clerget-DarpouxF, Thompson EA. Estimation of the inbreeding coefficient through use ofgenomic data. Am J Hum Genet. 2003;73(3):516–23.
66. Purcell S, Neale B, Todd-Brown K, Thomas L, Ferreira M, Bender D, Maller J,Sklar P, de Bakker P, Daly M, et al. Plink: a tool set for whole-genomeassociation and population-based linkage analyses. Am J Hum Genet. 2007;81(3):559–75.
67. R Core Team: R: A language and environment for statistical computing. In.:R Foundation for Statistical Computing, Vienna, Austria.; 2015.
68. StataCorp: Stata Statistical Software: Release 14. In.: College Station, TX:StataCorp LP; 2015.
69. Wald A: Sequential Tests of Statistical Hypotheses. 1945:117–186.70. Vittinghoff E, Glidden D, Shiboski S, McCulloch C. Regression methods in
biostatistics: linear, logistic, survival, and repeated measures models. NewYork: Springer; 2005.
71. Henn BM, Hon L, Macpherson JM, Eriksson N, Saxonov S, Pe'er I, MountainJL. Cryptic distant relatives are common in both isolated and cosmopolitangenetic samples. PLoS One. 2012;7(4):e34267.
72. Patterson N, Price AL, Reich D. Population structure and Eigenanalysis. PLoSGenet. 2006;2(12):e190.
73. Khera AV, Won H-H, Peloso GM, Lawson KS, Bartz TM, Deng X, van LeeuwenEM, Natarajan P, Emdin CA, Bick AG. Diagnostic yield and clinical utility ofsequencing familial hypercholesterolemia genes in patients with severehypercholesterolemia. J Am Coll Cardiol. 2016;67(22):2578–89.
74. Bureau A, Parker MM, Ruczinski I, Taub MA, Marazita ML, Murray JC,Mangold E, Noethen MM, Ludwig KU, Hetmanski JB, et al. Whole exomesequencing of distant relatives in multiplex families implicates rare variantsin candidate genes for Oral clefts. Genetics. 2014;197(3):1039–44.
75. NHLBI GO Exome Sequencing Project (ESP) [http://evs.gs.washington.edu/EVS/].
76. Sherry ST, Ward M-H, Kholodov M, Baker J, Phan L, Smigielski EM. Sirotkin K:dbSNP: the NCBI database of genetic variation. Nucleic Acids Res. 2001;29(1):308–11.
77. Hubisz MJ, Pollard KS, Siepel A: PHAST and RPHAST: phylogenetic analysiswith space/time models. Briefings in bioinformatics 2010:bbq072.
78. Wang K, Li M, Hakonarson H. ANNOVAR: functional annotation of geneticvariants from high-throughput sequencing data. Nucleic Acids Res. 2010;38(16):e164.
79. Yates A, Akanni W, Amode MR, Barrell D, Billis K, Carvalho-Silva D, CumminsC, Clapham P, Fitzgerald S, Gil L. Ensembl 2016. Nucleic Acids Res. 2015;44(D1):D710–6.
80. Henderson P, Sutton E, Tayler R, Barclay A, Hansen R. PWE-137 theepidemiology and outcome of biliary atresia in Scotland 2002–2013. Gut.2015;64(Suppl 1):A272–3.
81. Jakkula E, Rehnström K, Varilo T, Pietiläinen OPH, Paunio T, Pedersen NL,deFaire U, Järvelin M-R, Saharinen J, Freimer N, et al. The genome-widepatterns of variation expose significant substructure in a founderpopulation. Am J Hum Genet. 2008;83(6):787–94.
82. Helgason A, Nicholson G, Stefánsson K, Donnelly P. A reassessment ofgenetic diversity in Icelanders: strong evidence from multiple loci for
Cameron-Christie et al. BMC Medical Genomics (2018) 11:121 Page 12 of 13
relative homogeneity caused by genetic drift. Ann Hum Genet. 2003;67(4):281–97.
83. Scott EM, Halees A, Itan Y, Spencer EG, He Y, Azab MA, Gabriel SB, Belkadi A,Boisson B, Abel L, et al. Characterization of greater middle eastern geneticvariation for enhanced disease gene discovery. Nat Genet. 2016;48(9):1071–6.
84. Yi N, Xu S. Bayesian mapping of quantitative trait loci for complex binarytraits. Genetics. 2000;155(3):1391–403.
Cameron-Christie et al. BMC Medical Genomics (2018) 11:121 Page 13 of 13