Genetic diversity in four tribal groups of western India: a survey of polymorphism in 15 STR loci...
7
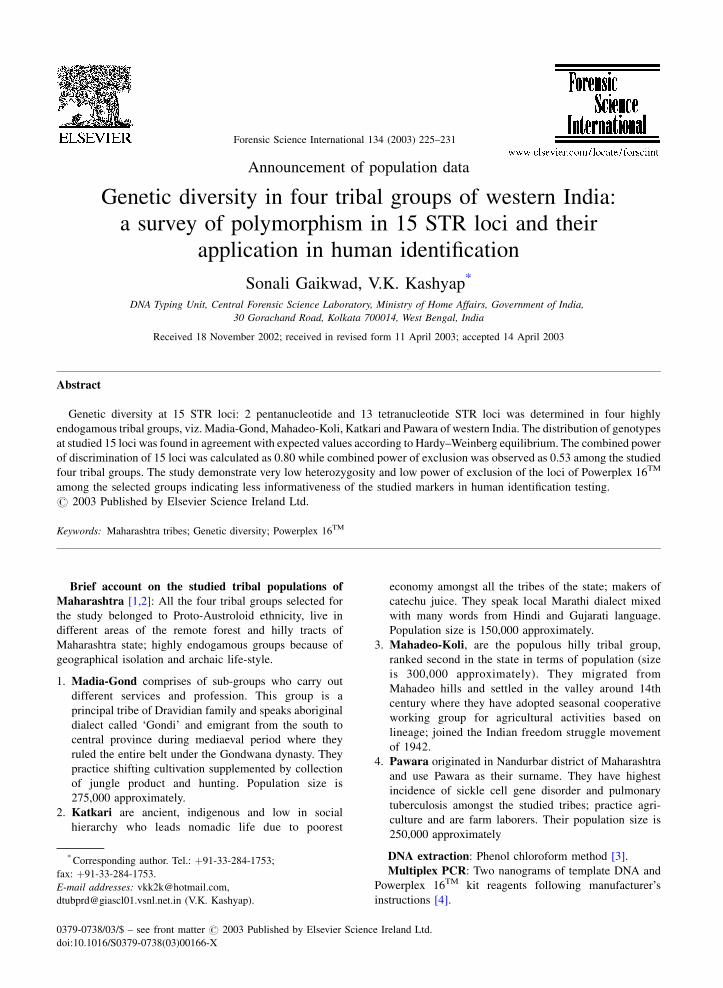
Announcement of population data Genetic diversity in four tribal groups of western India: a survey of polymorphism in 15 STR loci and their application in human identification Sonali Gaikwad, V.K. Kashyap * DNATyping Unit, Central Forensic Science Laboratory, Ministry of Home Affairs, Government of India, 30 Gorachand Road, Kolkata 700014, West Bengal, India Received 18 November 2002; received in revised form 11 April 2003; accepted 14 April 2003 Abstract Genetic diversity at 15 STR loci: 2 pentanucleotide and 13 tetranucleotide STR loci was determined in four highly endogamous tribal groups, viz. Madia-Gond, Mahadeo-Koli, Katkari and Pawara of western India. The distribution of genotypes at studied 15 loci was found in agreement with expected values according to Hardy–Weinberg equilibrium. The combined power of discrimination of 15 loci was calculated as 0.80 while combined power of exclusion was observed as 0.53 among the studied four tribal groups. The study demonstrate very low heterozygosity and low power of exclusion of the loci of Powerplex 16 TM among the selected groups indicating less informativeness of the studied markers in human identification testing. # 2003 Published by Elsevier Science Ireland Ltd. Keywords: Maharashtra tribes; Genetic diversity; Powerplex 16 TM Brief account on the studied tribal populations of Maharashtra [1,2]: All the four tribal groups selected for the study belonged to Proto-Austroloid ethnicity, live in different areas of the remote forest and hilly tracts of Maharashtra state; highly endogamous groups because of geographical isolation and archaic life-style. 1. Madia-Gond comprises of sub-groups who carry out different services and profession. This group is a principal tribe of Dravidian family and speaks aboriginal dialect called ‘Gondi’ and emigrant from the south to central province during mediaeval period where they ruled the entire belt under the Gondwana dynasty. They practice shifting cultivation supplemented by collection of jungle product and hunting. Population size is 275,000 approximately. 2. Katkari are ancient, indigenous and low in social hierarchy who leads nomadic life due to poorest economy amongst all the tribes of the state; makers of catechu juice. They speak local Marathi dialect mixed with many words from Hindi and Gujarati language. Population size is 150,000 approximately. 3. Mahadeo-Koli, are the populous hilly tribal group, ranked second in the state in terms of population (size is 300,000 approximately). They migrated from Mahadeo hills and settled in the valley around 14th century where they have adopted seasonal cooperative working group for agricultural activities based on lineage; joined the Indian freedom struggle movement of 1942. 4. Pawara originated in Nandurbar district of Maharashtra and use Pawara as their surname. They have highest incidence of sickle cell gene disorder and pulmonary tuberculosis amongst the studied tribes; practice agri- culture and are farm laborers. Their population size is 250,000 approximately DNA extraction: Phenol chloroform method [3]. Multiplex PCR: Two nanograms of template DNA and Powerplex 16 TM kit reagents following manufacturer’s instructions [4]. Forensic Science International 134 (2003) 225–231 * Corresponding author. Tel.: þ91-33-284-1753; fax: þ91-33-284-1753. E-mail addresses: [email protected], [email protected] (V.K. Kashyap). 0379-0738/03/$ – see front matter # 2003 Published by Elsevier Science Ireland Ltd. doi:10.1016/S0379-0738(03)00166-X
-
Upload
sonali-gaikwad -
Category
Documents
-
view
216 -
download
1
Transcript of Genetic diversity in four tribal groups of western India: a survey of polymorphism in 15 STR loci...
Announcement of population data
Genetic diversity in four tribal groups of western India:a survey of polymorphism in 15 STR loci and their
application in human identification
Sonali Gaikwad, V.K. Kashyap*
DNA Typing Unit, Central Forensic Science Laboratory, Ministry of Home Affairs, Government of India,
30 Gorachand Road, Kolkata 700014, West Bengal, India
Received 18 November 2002; received in revised form 11 April 2003; accepted 14 April 2003
Abstract
Genetic diversity at 15 STR loci: 2 pentanucleotide and 13 tetranucleotide STR loci was determined in four highly
endogamous tribal groups, viz. Madia-Gond, Mahadeo-Koli, Katkari and Pawara of western India. The distribution of genotypes
at studied 15 loci was found in agreement with expected values according to Hardy–Weinberg equilibrium. The combined power
of discrimination of 15 loci was calculated as 0.80 while combined power of exclusion was observed as 0.53 among the studied
four tribal groups. The study demonstrate very low heterozygosity and low power of exclusion of the loci of Powerplex 16TM
among the selected groups indicating less informativeness of the studied markers in human identification testing.
# 2003 Published by Elsevier Science Ireland Ltd.
Keywords: Maharashtra tribes; Genetic diversity; Powerplex 16TM
Brief account on the studied tribal populations of
Maharashtra [1,2]: All the four tribal groups selected for
the study belonged to Proto-Austroloid ethnicity, live in
different areas of the remote forest and hilly tracts of
Maharashtra state; highly endogamous groups because of
geographical isolation and archaic life-style.
1. Madia-Gond comprises of sub-groups who carry out
different services and profession. This group is a
principal tribe of Dravidian family and speaks aboriginal
dialect called ‘Gondi’ and emigrant from the south to
central province during mediaeval period where they
ruled the entire belt under the Gondwana dynasty. They
practice shifting cultivation supplemented by collection
of jungle product and hunting. Population size is
275,000 approximately.
2. Katkari are ancient, indigenous and low in social
hierarchy who leads nomadic life due to poorest
economy amongst all the tribes of the state; makers of
catechu juice. They speak local Marathi dialect mixed
with many words from Hindi and Gujarati language.
Population size is 150,000 approximately.
3. Mahadeo-Koli, are the populous hilly tribal group,
ranked second in the state in terms of population (size
is 300,000 approximately). They migrated from
Mahadeo hills and settled in the valley around 14th
century where they have adopted seasonal cooperative
working group for agricultural activities based on
lineage; joined the Indian freedom struggle movement
of 1942.
4. Pawara originated in Nandurbar district of Maharashtra
and use Pawara as their surname. They have highest
incidence of sickle cell gene disorder and pulmonary
tuberculosis amongst the studied tribes; practice agri-
culture and are farm laborers. Their population size is
250,000 approximately
DNA extraction: Phenol chloroform method [3].
Multiplex PCR: Two nanograms of template DNA and
Powerplex 16TM kit reagents following manufacturer’s
instructions [4].
Forensic Science International 134 (2003) 225–231
* Corresponding author. Tel.: þ91-33-284-1753;
fax: þ91-33-284-1753.
E-mail addresses: [email protected],
[email protected] (V.K. Kashyap).
0379-0738/03/$ – see front matter # 2003 Published by Elsevier Science Ireland Ltd.
doi:10.1016/S0379-0738(03)00166-X
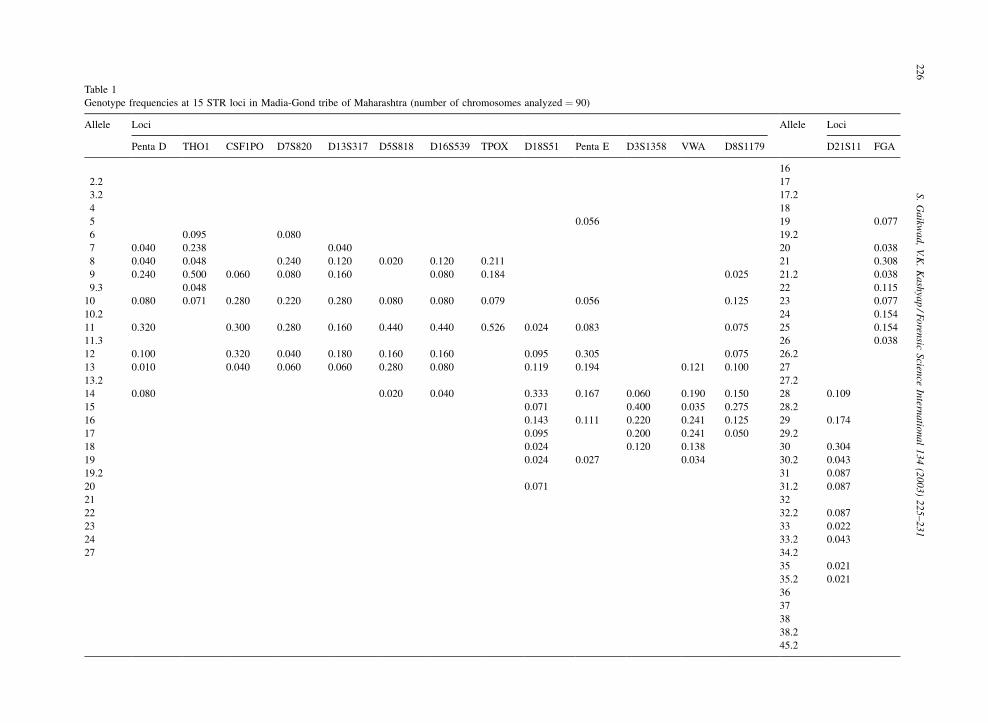
Table 1
Genotype frequencies at 15 STR loci in Madia-Gond tribe of Maharashtra (number of chromosomes analyzed ¼ 90)
Allele Loci Allele Loci
Penta D THO1 CSF1PO D7S820 D13S317 D5S818 D16S539 TPOX D18S51 Penta E D3S1358 VWA D8S1179 D21S11 FGA
16
2.2 17
3.2 17.2
4 18
5 0.056 19 0.077
6 0.095 0.080 19.2
7 0.040 0.238 0.040 20 0.038
8 0.040 0.048 0.240 0.120 0.020 0.120 0.211 21 0.308
9 0.240 0.500 0.060 0.080 0.160 0.080 0.184 0.025 21.2 0.038
9.3 0.048 22 0.115
10 0.080 0.071 0.280 0.220 0.280 0.080 0.080 0.079 0.056 0.125 23 0.077
10.2 24 0.154
11 0.320 0.300 0.280 0.160 0.440 0.440 0.526 0.024 0.083 0.075 25 0.154
11.3 26 0.038
12 0.100 0.320 0.040 0.180 0.160 0.160 0.095 0.305 0.075 26.2
13 0.010 0.040 0.060 0.060 0.280 0.080 0.119 0.194 0.121 0.100 27
13.2 27.2
14 0.080 0.020 0.040 0.333 0.167 0.060 0.190 0.150 28 0.109
15 0.071 0.400 0.035 0.275 28.2
16 0.143 0.111 0.220 0.241 0.125 29 0.174
17 0.095 0.200 0.241 0.050 29.2
18 0.024 0.120 0.138 30 0.304
19 0.024 0.027 0.034 30.2 0.043
19.2 31 0.087
20 0.071 31.2 0.087
21 32
22 32.2 0.087
23 33 0.022
24 33.2 0.043
27 34.2
35 0.021
35.2 0.021
36
37
38
38.2
45.2
22
6S
.G
aikw
ad
,V.K
.K
ash
yap
/Fo
rensic
Scien
ceIn
terna
tiona
l1
34
(20
03
)2
25
–2
31

Table 2
Genotype frequencies at 15 STR loci in Mahadeo-Koli tribe of Maharashtra (number of chromosomes analyzed ¼ 90)
Allele Loci Allele Loci
Penta D THO1 CSF1PO D7S820 D13S317 D5S818 D16S539 TPOX D18S51 Penta E D3S1358 VWA D8S1179 D21S11 FGA
16
2.2 17 0.129
3.2 17.2 0.064
4 18 0.016
5 0.117 19
6 0.132 19.2 0.016
7 0.073 0.114 0.033 20 0.064
8 0.061 0.132 0.286 0.392 0.027 0.359 0.033 21 0.064
9 0.242 0.515 0.100 0.040 0.054 0.229 0.203 0.017 21.2
9.3 0.147 22 0.064
10 0.182 0.071 0.171 0.094 0.122 0.135 0.094 0.015 0.033 0.243 23 0.113
10.2 24 0.242
11 0.258 0.243 0.186 0.257 0.405 0.271 0.344 0.029 0.133 0.071 25 0.113
11.3 26 0.032
12 0.212 0.557 0.100 0.162 0.216 0.149 0.073 0.167 0.228 26.2
13 0.015 0.100 0.043 0.054 0.176 0.122 0.147 0.150 0.071 27 0.064
13.2 27.2
14 0.030 0.028 0.027 0.067 0.338 0.100 0.068 0.243 0.143 28 0.230 0.016
15 0.191 0.167 0.270 0.203 0.100 28.2
16 0.015 0.017 0.203 0.122 0.128 29 0.230
17 0.088 0.017 0.338 0.243 0.014 29.2
18 0.029 0.017 0.122 0.149 30 0.162
19 0.044 0.027 30.2 0.027
19.2 31 0.108
20 0.015 0.013 31.2 0.054
21 32
22 32.2 0.162
23 33
24 33.2 0.027
25 0.015 34.2
27 35
35.2
36
37
38
38.2
45.2
S.
Ga
ikwa
d,
V.K
.K
ash
yap
/Fo
rensic
Scien
ceIn
terna
tiona
l1
34
(20
03
)2
25
–2
31
22
7
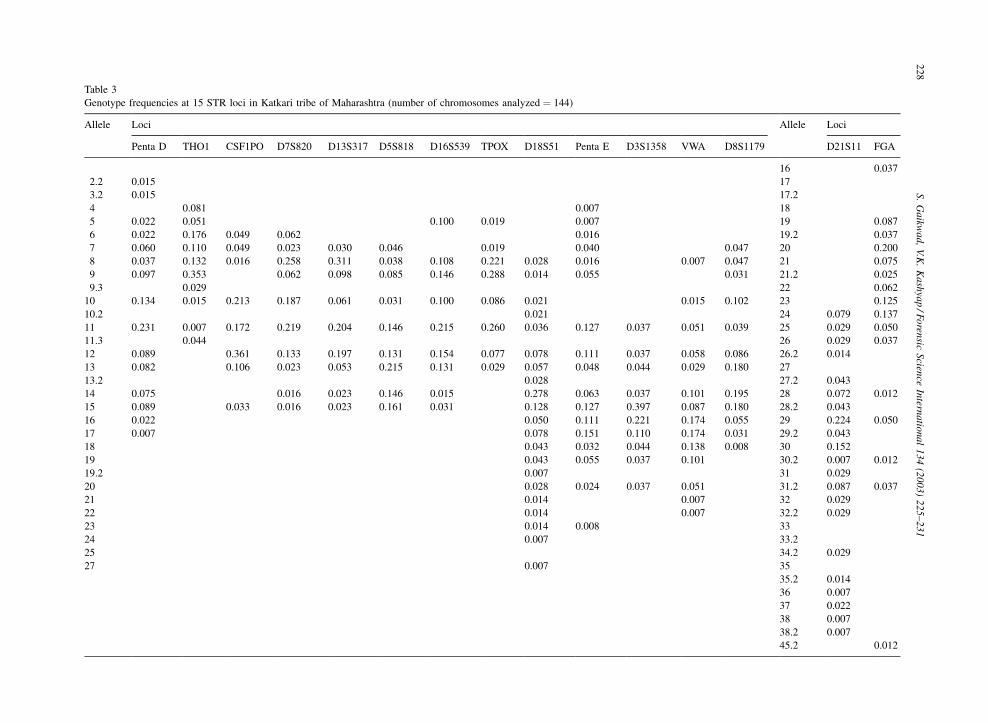
Table 3
Genotype frequencies at 15 STR loci in Katkari tribe of Maharashtra (number of chromosomes analyzed ¼ 144)
Allele Loci Allele Loci
Penta D THO1 CSF1PO D7S820 D13S317 D5S818 D16S539 TPOX D18S51 Penta E D3S1358 VWA D8S1179 D21S11 FGA
16 0.037
2.2 0.015 17
3.2 0.015 17.2
4 0.081 0.007 18
5 0.022 0.051 0.100 0.019 0.007 19 0.087
6 0.022 0.176 0.049 0.062 0.016 19.2 0.037
7 0.060 0.110 0.049 0.023 0.030 0.046 0.019 0.040 0.047 20 0.200
8 0.037 0.132 0.016 0.258 0.311 0.038 0.108 0.221 0.028 0.016 0.007 0.047 21 0.075
9 0.097 0.353 0.062 0.098 0.085 0.146 0.288 0.014 0.055 0.031 21.2 0.025
9.3 0.029 22 0.062
10 0.134 0.015 0.213 0.187 0.061 0.031 0.100 0.086 0.021 0.015 0.102 23 0.125
10.2 0.021 24 0.079 0.137
11 0.231 0.007 0.172 0.219 0.204 0.146 0.215 0.260 0.036 0.127 0.037 0.051 0.039 25 0.029 0.050
11.3 0.044 26 0.029 0.037
12 0.089 0.361 0.133 0.197 0.131 0.154 0.077 0.078 0.111 0.037 0.058 0.086 26.2 0.014
13 0.082 0.106 0.023 0.053 0.215 0.131 0.029 0.057 0.048 0.044 0.029 0.180 27
13.2 0.028 27.2 0.043
14 0.075 0.016 0.023 0.146 0.015 0.278 0.063 0.037 0.101 0.195 28 0.072 0.012
15 0.089 0.033 0.016 0.023 0.161 0.031 0.128 0.127 0.397 0.087 0.180 28.2 0.043
16 0.022 0.050 0.111 0.221 0.174 0.055 29 0.224 0.050
17 0.007 0.078 0.151 0.110 0.174 0.031 29.2 0.043
18 0.043 0.032 0.044 0.138 0.008 30 0.152
19 0.043 0.055 0.037 0.101 30.2 0.007 0.012
19.2 0.007 31 0.029
20 0.028 0.024 0.037 0.051 31.2 0.087 0.037
21 0.014 0.007 32 0.029
22 0.014 0.007 32.2 0.029
23 0.014 0.008 33
24 0.007 33.2
25 34.2 0.029
27 0.007 35
35.2 0.014
36 0.007
37 0.022
38 0.007
38.2 0.007
45.2 0.012
22
8S
.G
aikw
ad
,V.K
.K
ash
yap
/Fo
rensic
Scien
ceIn
terna
tiona
l1
34
(20
03
)2
25
–2
31
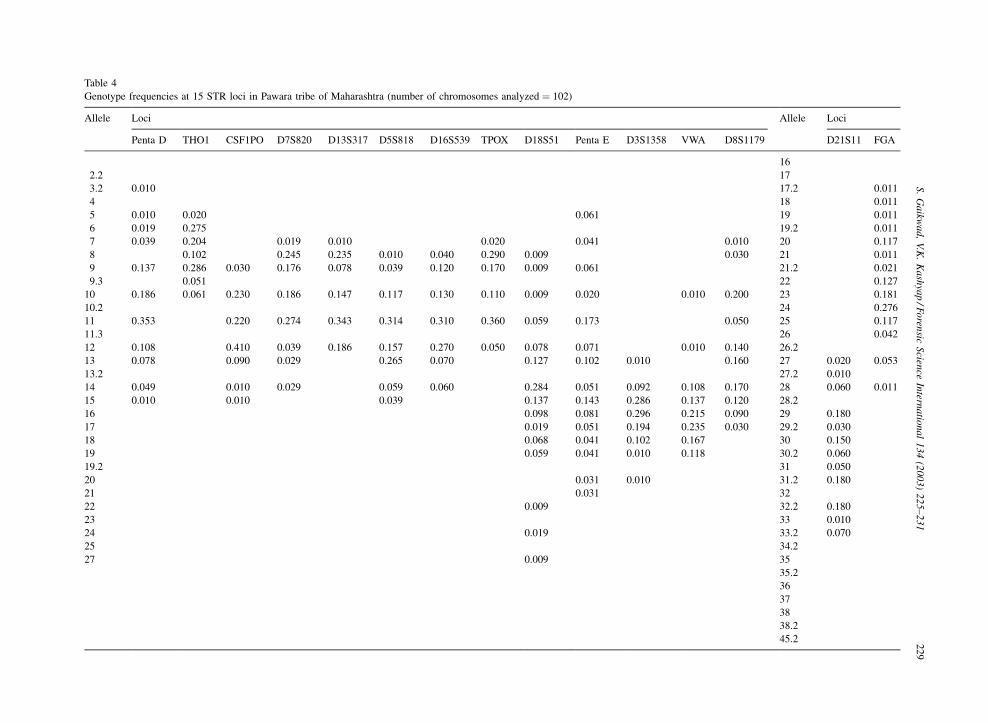
Table 4
Genotype frequencies at 15 STR loci in Pawara tribe of Maharashtra (number of chromosomes analyzed ¼ 102)
Allele Loci Allele Loci
Penta D THO1 CSF1PO D7S820 D13S317 D5S818 D16S539 TPOX D18S51 Penta E D3S1358 VWA D8S1179 D21S11 FGA
16
2.2 17
3.2 0.010 17.2 0.011
4 18 0.011
5 0.010 0.020 0.061 19 0.011
6 0.019 0.275 19.2 0.011
7 0.039 0.204 0.019 0.010 0.020 0.041 0.010 20 0.117
8 0.102 0.245 0.235 0.010 0.040 0.290 0.009 0.030 21 0.011
9 0.137 0.286 0.030 0.176 0.078 0.039 0.120 0.170 0.009 0.061 21.2 0.021
9.3 0.051 22 0.127
10 0.186 0.061 0.230 0.186 0.147 0.117 0.130 0.110 0.009 0.020 0.010 0.200 23 0.181
10.2 24 0.276
11 0.353 0.220 0.274 0.343 0.314 0.310 0.360 0.059 0.173 0.050 25 0.117
11.3 26 0.042
12 0.108 0.410 0.039 0.186 0.157 0.270 0.050 0.078 0.071 0.010 0.140 26.2
13 0.078 0.090 0.029 0.265 0.070 0.127 0.102 0.010 0.160 27 0.020 0.053
13.2 27.2 0.010
14 0.049 0.010 0.029 0.059 0.060 0.284 0.051 0.092 0.108 0.170 28 0.060 0.011
15 0.010 0.010 0.039 0.137 0.143 0.286 0.137 0.120 28.2
16 0.098 0.081 0.296 0.215 0.090 29 0.180
17 0.019 0.051 0.194 0.235 0.030 29.2 0.030
18 0.068 0.041 0.102 0.167 30 0.150
19 0.059 0.041 0.010 0.118 30.2 0.060
19.2 31 0.050
20 0.031 0.010 31.2 0.180
21 0.031 32
22 0.009 32.2 0.180
23 33 0.010
24 0.019 33.2 0.070
25 34.2
27 0.009 35
35.2
36
37
38
38.2
45.2
S.
Ga
ikwa
d,
V.K
.K
ash
yap
/Fo
rensic
Scien
ceIn
terna
tiona
l1
34
(20
03
)2
25
–2
31
22
9
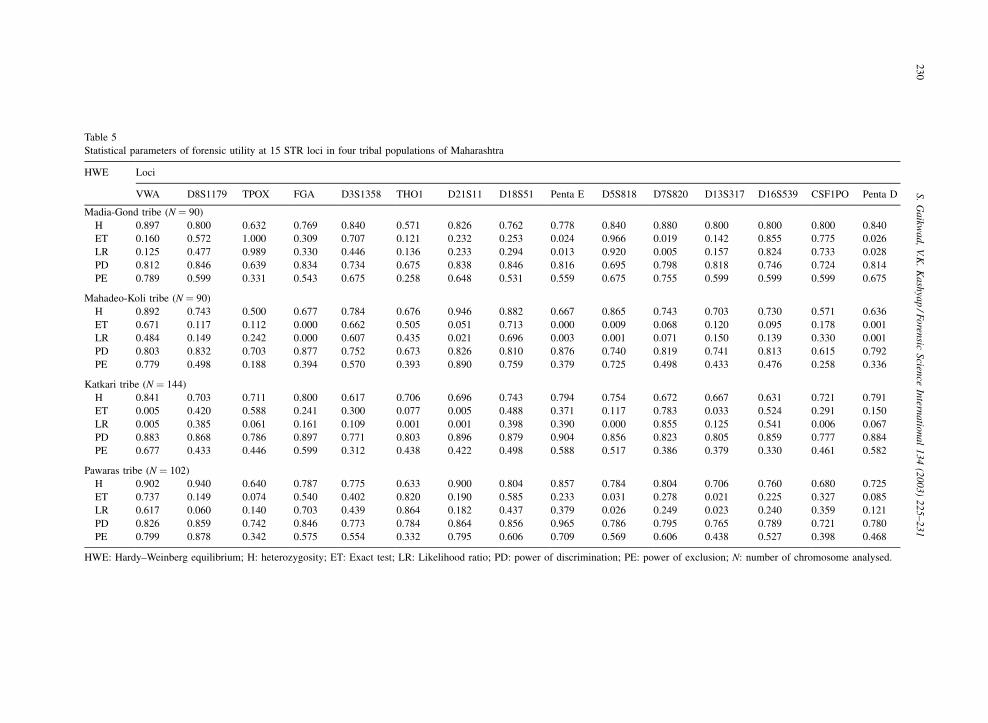
Table 5
Statistical parameters of forensic utility at 15 STR loci in four tribal populations of Maharashtra
HWE Loci
VWA D8S1179 TPOX FGA D3S1358 THO1 D21S11 D18S51 Penta E D5S818 D7S820 D13S317 D16S539 CSF1PO Penta D
Madia-Gond tribe (N ¼ 90)
H 0.897 0.800 0.632 0.769 0.840 0.571 0.826 0.762 0.778 0.840 0.880 0.800 0.800 0.800 0.840
ET 0.160 0.572 1.000 0.309 0.707 0.121 0.232 0.253 0.024 0.966 0.019 0.142 0.855 0.775 0.026
LR 0.125 0.477 0.989 0.330 0.446 0.136 0.233 0.294 0.013 0.920 0.005 0.157 0.824 0.733 0.028
PD 0.812 0.846 0.639 0.834 0.734 0.675 0.838 0.846 0.816 0.695 0.798 0.818 0.746 0.724 0.814
PE 0.789 0.599 0.331 0.543 0.675 0.258 0.648 0.531 0.559 0.675 0.755 0.599 0.599 0.599 0.675
Mahadeo-Koli tribe (N ¼ 90)
H 0.892 0.743 0.500 0.677 0.784 0.676 0.946 0.882 0.667 0.865 0.743 0.703 0.730 0.571 0.636
ET 0.671 0.117 0.112 0.000 0.662 0.505 0.051 0.713 0.000 0.009 0.068 0.120 0.095 0.178 0.001
LR 0.484 0.149 0.242 0.000 0.607 0.435 0.021 0.696 0.003 0.001 0.071 0.150 0.139 0.330 0.001
PD 0.803 0.832 0.703 0.877 0.752 0.673 0.826 0.810 0.876 0.740 0.819 0.741 0.813 0.615 0.792
PE 0.779 0.498 0.188 0.394 0.570 0.393 0.890 0.759 0.379 0.725 0.498 0.433 0.476 0.258 0.336
Katkari tribe (N ¼ 144)
H 0.841 0.703 0.711 0.800 0.617 0.706 0.696 0.743 0.794 0.754 0.672 0.667 0.631 0.721 0.791
ET 0.005 0.420 0.588 0.241 0.300 0.077 0.005 0.488 0.371 0.117 0.783 0.033 0.524 0.291 0.150
LR 0.005 0.385 0.061 0.161 0.109 0.001 0.001 0.398 0.390 0.000 0.855 0.125 0.541 0.006 0.067
PD 0.883 0.868 0.786 0.897 0.771 0.803 0.896 0.879 0.904 0.856 0.823 0.805 0.859 0.777 0.884
PE 0.677 0.433 0.446 0.599 0.312 0.438 0.422 0.498 0.588 0.517 0.386 0.379 0.330 0.461 0.582
Pawaras tribe (N ¼ 102)
H 0.902 0.940 0.640 0.787 0.775 0.633 0.900 0.804 0.857 0.784 0.804 0.706 0.760 0.680 0.725
ET 0.737 0.149 0.074 0.540 0.402 0.820 0.190 0.585 0.233 0.031 0.278 0.021 0.225 0.327 0.085
LR 0.617 0.060 0.140 0.703 0.439 0.864 0.182 0.437 0.379 0.026 0.249 0.023 0.240 0.359 0.121
PD 0.826 0.859 0.742 0.846 0.773 0.784 0.864 0.856 0.965 0.786 0.795 0.765 0.789 0.721 0.780
PE 0.799 0.878 0.342 0.575 0.554 0.332 0.795 0.606 0.709 0.569 0.606 0.438 0.527 0.398 0.468
HWE: Hardy–Weinberg equilibrium; H: heterozygosity; ET: Exact test; LR: Likelihood ratio; PD: power of discrimination; PE: power of exclusion; N: number of chromosome analysed.
23
0S
.G
aikw
ad
,V.K
.K
ash
yap
/Fo
rensic
Scien
ceIn
terna
tiona
l1
34
(20
03
)2
25
–2
31

Genotyping: PAGE using ABI Prism 377 DNA Sequencer
and allelic ladder [4].
Results: The studied 15 STR loci were found to be less
polymorphic and low of information value among the four
tribes. Power of exclusion is low as compared to forward
community of state (Tables 1–5).
Quality control: Laboratory internal control standards
and kit controls.
Analytical tool: The frequency of different allele for
various locus was calculated by gene count method. The
Exact test and Likelihood ratio were carried out using DNA
TYPE software to find out possible divergence from Hardy–
Weinberg equilibrium [5], power of discrimination, power of
exclusion [6] were calculated for evaluating the statistical
probabilities related to human identity testing and under-
standing the genetic diversity in Indian populations [7–21].
Other remarks: The THO1 locus in Madia-Gond showed
low heterozygosity compared to reported populations,
CSF1PO locus was found to be less informative in Maha-
deo-Koli and Pawaras, Penta E locus was highly discrimi-
natory in all three tribes except in Madia-Gond where
D8S1179 was highly polymorphic.
This paper follows the guidelines for publication of
population data requested by the journal [22].
Acknowledgements
The work is carried out from the financial support of
Bureau of Police Research and development, Ministry of
Home Affairs, Government of India. The above study would
not have been possible without the active collaboration of
Dr. S.L. Kate, a Emeritus Medical Scientist, Pune in collec-
tion of blood samples from the consenting participants.
References
[1] K.S. Singh, India’s Communities: People of India, Oxford
University Press, Oxford, 1998.
[2] G.M. Gare, M.B. Aphale, The Tribes of Maharashtra, Tribal
Research and Training Institute, Pune, India, 1982.
[3] J. Sambrook, E.F. Fritsch, T. Maniatis, Molecular Cloning: A
Laboratory Manual, second ed., Cold Spring Harbor Labora-
tory Press, Cold Spring Harbor, NY, 1989.
[4] Powerplex 16TM System Technical Manual No. D012,
Promega Corp., USA, 2000.
[5] R. Chakraborty, D. Stivers, Y. Zhong, DNA TYPE Software,
Windows 95/NT Version, Human Genetics Center, University
of Texas Health Science Center, Houston, TX, USA.
[6] R.A. Garber, J.W. Morris, General equations for the average
power of exclusion for genetic system of n codominant alleles
in one-parent cases of disputed parentage, in: R.H. Walker
(Ed.), Inclusion Probabilities in Parentage Testing, American
Association of Blood Bank, Arlington, VA, 1983, pp. 277–
280.
[7] B.M. Reddy, G. Sun, R. Dutta, R. Deka, STR data for the
AmpFlSTR Profiler Plus loci among Golla population of
southern Andhra Pradesh, India, J. Forensic. Sci. 46 (3)
(2001) 734–735.
[8] P. Chattopadhyay, R. Dutta, V.K. Kashyap, Population data
for nine fluorescent based STR loci among four important
tribal populations of India, J. Forensic Sci. 47 (3) (2002) 184–
188.
[9] S. Agrawal, B. Muller, U. Bharadwaj, S. Bhatnagar, F. Khan,
Distribution of allele frequencies of six STR markers in North
Indians, J. Forensic Sci. 47 (3) (2002) 682–685.
[10] S. Sahoo, V.K. Kashyap, Allele frequency of data for
Powerplex 16TM loci in four major population of Orissa,
India, J. Forensic Sci. 47 (4) (2002) 912–915.
[11] R. Rajkumar, V.K. Kashyap, Distribution of alleles of fifteen
STR Loci of the Powerplex 16TM multiplex in four pre-
dominant population groups of South India, Forensic Sci. Int.
126 (2) (2002) 175–179.
[12] R. Ashma, V.K. Kashyap, Genetic study of 15 important STR
loci among four major ethnic groups of Bihar, India, J.
Forensic Sci. 47 (5) (2002) 1139–1142.
[13] S. Gaikwad, V.K. Kashyap, Polymorphism at fifteen
hypervariable microsatellite loci in four populations of
Maharashtra, India, Forensic Sci. Int. 126 (3) (2002) 267–
271.
[14] T. Sitalaximi, R. Trivedi, V.K. Kashyap, Genotype profile for
thirteen tetranucleotide repeat loci and two pentanucleotide
repeat loci in four endogamous Tamil populations groups of
India, J. Forensic Sci. 47 (5) (2002) 1168–1173.
[15] V.K. Kashyap, S. Guha, R. Trivedi, Concordance study on 15
STR loci in three major population of Himalayan state
Sikkim, J. Forensic Sci. 47 (5) (2002) 1163–1167.
[16] R. Trivedi, P. Chattopadhyay, B.M. Maity, V.K. Kashyap,
Genetic polymorphism at nine microsatellite loci in four
altitude Himalayan desert human populations, Forensic Sci.
Int. 127 (1) (2002) 150–155.
[17] N. Sarkar, V.K. Kashyap, Genetic diversity at two pentanu-
cleotide STR and thirteen tetranucleotide STR loci by
multiplex PCR in four predominant population groups of
central India, Forensic Sci. Int. 128 (3) (2002) 196–201.
[18] R. Ashma, V.K. Kashyap, Genetic polymorphism at 15 STR
loci among three important sub-population of Bihar, India,
Forensic Sci. Int. 130 (1) (2002) 58–62.
[19] S. Sahoo, V.K. Kashyap, Genetic variation at fifteen
autosomal microsatellite loci in three highly endogamous
tribal population of Orissa, India, Forensic Sci. Int. 130 (2–3)
(2002) 189–193.
[20] T. Sitalaximi, R. Trivedi, V.K. Kashyap, Autosomal micro-
satellite profile of three socially diverse ethnic Tamil popula-
tion of India, J. Forensic Sci. 48 (1) (2003) 211–214.
[21] B. Maity, S.C. Nunga, V.K. Kashyap, Genetic polymorphism
revealed by thirteen tetrameric and two pentameric STR loci
in four predominant populations of Mizoram, Forensic Sci.
Int., in press.
[22] P. Lincoln, A. Carracedo, Publication of population data of
human polymorphisms, Forensic Sci. Int. 110 (2000) 3–5.
S. Gaikwad, V.K. Kashyap / Forensic Science International 134 (2003) 225–231 231