Genetic characterization of field-evolved resistance to ...
39
Genetic characterization of field-evolved resistance to phosphine in the rusty grain beetle, Cryptolestes ferrugineus (Laemophloeidae: Coleoptera) Rajeswaran Jagadeesan, Patrick J. Collins, Manoj K. Nayak, David I. Schlipalius, Paul R. Ebert PII: S0048-3575(15)30033-X DOI: doi: 10.1016/j.pestbp.2015.09.008 Reference: YPEST 3864 To appear in: Received date: 21 July 2015 Revised date: 18 September 2015 Accepted date: 21 September 2015 Please cite this article as: Rajeswaran Jagadeesan, Patrick J. Collins, Manoj K. Nayak, David I. Schlipalius, Paul R. Ebert, Genetic characterization of field-evolved resis- tance to phosphine in the rusty grain beetle, Cryptolestes ferrugineus (Laemophloeidae: Coleoptera), (2015), doi: 10.1016/j.pestbp.2015.09.008 This is a PDF file of an unedited manuscript that has been accepted for publication. As a service to our customers we are providing this early version of the manuscript. The manuscript will undergo copyediting, typesetting, and review of the resulting proof before it is published in its final form. Please note that during the production process errors may be discovered which could affect the content, and all legal disclaimers that apply to the journal pertain.
Transcript of Genetic characterization of field-evolved resistance to ...
�������� ����� ��
Genetic characterization of field-evolved resistance to phosphine in the rustygrain beetle, Cryptolestes ferrugineus (Laemophloeidae: Coleoptera)
Rajeswaran Jagadeesan, Patrick J. Collins, Manoj K. Nayak, David I.Schlipalius, Paul R. Ebert
PII: S0048-3575(15)30033-XDOI: doi: 10.1016/j.pestbp.2015.09.008Reference: YPEST 3864
To appear in:
Received date: 21 July 2015Revised date: 18 September 2015Accepted date: 21 September 2015
Please cite this article as: Rajeswaran Jagadeesan, Patrick J. Collins, Manoj K. Nayak,David I. Schlipalius, Paul R. Ebert, Genetic characterization of field-evolved resis-tance to phosphine in the rusty grain beetle, Cryptolestes ferrugineus (Laemophloeidae:Coleoptera), (2015), doi: 10.1016/j.pestbp.2015.09.008
This is a PDF file of an unedited manuscript that has been accepted for publication.As a service to our customers we are providing this early version of the manuscript.The manuscript will undergo copyediting, typesetting, and review of the resulting proofbefore it is published in its final form. Please note that during the production processerrors may be discovered which could affect the content, and all legal disclaimers thatapply to the journal pertain.

ACC
EPTE
D M
ANU
SCR
IPT
ACCEPTED MANUSCRIPT
Pesticide Biochemistry and Physiology
Genetic characterization of field-evolved resistance to phosphine in the rusty grain beetle,
Cryptolestes ferrugineus (Laemophloeidae: Coleoptera)
Rajeswaran Jagadeesana*, Patrick J Collinsa, Manoj K Nayaka, David I Schlipaliusa and Paul R Ebertb
aDepartment of Agriculture and Fisheries, Ecosciences Precinct, Level 3C West, GPO Box 267,
Brisbane, Queensland 4001, Australia
bSchool of Biological Sciences, The University of Queensland, St. Lucia, Queensland 4072, Australia.
*Corresponding Author
Ecosciences Precinct,
Level 3C- West,
GPO Box 267,
Brisbane, QLD 4001, Australia.
Tel.: +61 7 3255 7446
Fax: +61 7 3846 6371
*E-mail address: [email protected]
Running Title: Genetic basis of phosphine resistance in C. ferrugineus

ACC
EPTE
D M
ANU
SCR
IPT
ACCEPTED MANUSCRIPT
Abstract
Inheritance of resistance to phosphine fumigant was investigated in three field-collected strains of
rusty grain beetle, Cryptolestes ferrugineus, Susceptible (S-strain), Weakly Resistant (Weak-R) and
Strongly Resistant (Strong-R). The strains were purified for susceptibility, weak resistance and strong
resistance to phosphine, respectively, to ensure homozygosity of resistance genotype. Crosses were
established between S-strain x Weak-R, S-strain x Strong-R and Weak-R x Strong-R, and the dose
mortality responses to phosphine of these strains and their F1, F2 and F1-backcross progeny were
obtained. The fumigations were undertaken at 25°C and 55% RH for 72 hours.
Weak-R and Strong-R showed resistance factors of 6.3× and 505× compared with S-strain at the LC50.
Both weak and strong resistances were expressed as incompletely recessive with degrees of
dominance of -0.48 and -0.43 at the LC50, respectively. Responses of F2 and F1-backcross progeny
indicated the existence of one major gene in Weak-R, and at least two major genes in Strong-R, one
of which was allelic with the major factor in Weak-R. Phenotypic variance analyses also estimated
that the number of independently segregating genes conferring weak resistance was 1 (nE = 0.89)
whereas there were two genes controlling strong resistance (nE = 1.2). The second gene, unique to
Strong-R, interacted synergistically with the first gene to confer a very high level of resistance (~80×).
Neither of the two major resistance genes was sex linked. Despite the similarity of the genetics of
resistance to that previously observed in other pest species, a significant proportion (~15 to 30%) of
F1 individuals survived at phosphine concentrations higher than predicted. Thus it is likely that
additional dominant heritable factors, present in some individuals in the population, also influenced
the resistance phenotype.
Our results will help in understanding the process of selection for phosphine resistance in the field
which will inform resistance management strategies. In addition, this information will provide a basis
for the identification of the resistance genes.
Keywords: genetics, dominance, gene interactions, selection pressure, management

ACC
EPTE
D M
ANU
SCR
IPT
ACCEPTED MANUSCRIPT
1. Introduction
The rusty grain beetle, Cryptolestes ferrugineus (Stephens) is a cosmopolitan insect pest that
infests a wide range of stored cereals and processed commodities [1, 2]. Until recently, phosphine
(PH3) fumigation has been effective in controlling this species in Australia, however, strongly
resistant populations of C. ferrugineus have now been detected that threaten market access of
infested commodities [3]. Resistant populations detected in Australia are capable of developing very
high levels of resistance to phosphine, up to 1300×, significantly higher than levels reported in other
grain insect pests [4].
The development of resistance is an evolutionary process in which a heritable change occurs
within an insect population as an intrinsic response to selection imposed by humans [5]. An
understanding of the genetics of resistance in C. ferrugineus may help us identify the factors driving
the development of strong resistance to phosphine in this species. This information is crucial to the
development of rational and sustainable resistance management. Strong resistance to phosphine in
the lesser grain borer, Rhyzopertha dominca (Fabricius)[6], the red flour beetle, Tribolium castaneum
(Herbst)[7], and the rice weevil, Sitophilus oryzae (Linnaeus) [8], is mediated by two major
autosomal recessive genes, rph1 and rph2. In homozygous isolation, each of these genes confers
only weak resistance, ~4-30×, however, when they occur together in one individual, they interact
synergistically and provide a very high level of resistance, up to ~600× [6-8]. Genes rph1 and rph2 are
expressed as incompletely recessive in all the three species, irrespective of the phenotypes, and are
not sex linked [6-9]. This genetic information together with well-established efficacy data against R.
dominica [10], T. castaneum [11] and S. oryzae [12-14] facilitated the development and
implementation of a resistance management strategy that has been effective in containing the
resistance problem [15] or at least delaying further evolution of high level of resistance in these pest
species in Australia [16].
ACC
EPTE
D M
ANU
SCR
IPT
ACCEPTED MANUSCRIPT
No prior information is available on the genetics of phosphine resistance in C. ferrugineus
despite the extraordinary levels of resistance detected in this species [4, 17]. To support the
development of a rational, effective resistance management strategy, our aim was to determine the
inheritance of resistance to phosphine in this species. We investigated key determinants in the
selection of resistance including the number of resistance genes, their mode of inheritance, their
relative dominance and gene interactions, if any, in two field-evolved resistant strains.
2. Materials and Methods
2.1 Insect strains
Three field-derived strains of C. ferrugineus were used in this study; phosphine-susceptible,
QCF31, weakly resistant, QCF37 and strongly resistant, QCF73 [4]. Throughout this report we refer
to these strains as S-strain, Weak-R and Strong-R, respectively. Before the commencement of
genetic crosses, both Weak-R and Strong-R were fumigated at 0.04 mg L-1 over 48 hours and 1.0 mg
L-1 over 144 hours, respectively, for three successive generations to promote homozygosity within
the strains. All insects were cultured on a standard dietary medium of rolled oats + cracked sorghum
+ yeast (75:20:5%) at 30°C and 65% RH [18].
2.2 Inheritance of phosphine resistance
2.2.1 Genetic crosses
2.2.1.1 Multiply mated intercrosses (MIC)
To determine the mode of inheritance of phosphine resistance in C. ferrugineus three
multiply mated (mass) intercrosses (MIC) were set up: S-strain x Weak-R; S-strain x Strong-R and
Weak-R x Strong-R. Each cross consisted of 100 virgin adult males (♂) of one parent and 100 virgin
adult females (♀) of the other parent. The resulting F1 hybrids were used to produce segregating F2
intercross and backcross progeny (F1-BC). F2 insects were obtained by allowing F1 progeny to
randomly mate with each other for two weeks. In the case of backcross, two F1-BC populations were

ACC
EPTE
D M
ANU
SCR
IPT
ACCEPTED MANUSCRIPT
obtained from each parental cross; S-strain x Weak-R; S-strain x Strong-R and Weak-R x Strong-R, by
crossing virgin F1 females from each cross, back to virgins males of each parental strain [(F1♀ X
Weak-R♂ and F1 ♀x S♂); (F1 ♀x Strong-R♂ and F1 ♀x S♂); (F1 ♀X Strong-R♂ and F1 ♀x Weak-R♂)].
In F1, F2 and F1-BC, reciprocals (F1‘, F2‘ and F1-BC‘) were also established as a replicate to the original
cross and their dose mortality response was compared and pooled with originals for analysis, if the
responses were not significantly different.
2.2.1.2 Single pair intercrosses (SIC)
Three single pair intercrosses (SIC) (one ♀ + one ♂) were also established with the virgin
parents (S-strain x Weak-R; S-strain x Strong-R and Weak-R x Strong-R) to investigate the expression
of resistance at higher concentrations of phosphine in the F1 generation. The mortality response
data of three F1 hybrid populations obtained from single pair intercrossing and multiply mated
intercrossing were compared to control for skewness or errors associated with sexing, multiple
mating or other strain based genetic background variation unrelated to phosphine resistance.
2.3 Phosphine susceptibility tests
Phosphine was generated from aluminium phosphide and its concentration measured using
a gas chromatograph (Perkin-Elmer Clarus 580) according to a procedure described previously by
Daglish et al [14]. Phosphine susceptibility in adults of the parental strains and the crosses (MIC and
SIC) was assessed using the FAO recommended bioassay method at a range of phosphine
concentrations (0.005 to 8.0 mg L-1) in gas-tight desiccators (4 to 6 L) for 72 hours at 25 °C and 55%
RH [4]. Mortality was assessed 7 days after the completion of the exposure period. The entire
experiment was replicated twice with each test concentration for each replicate consisting of three
batches of 50 adult beetles.
The parents and F1 hybrids from each of the three MIC were also fumigated at exposure
periods of 48 and 144 hours, in addition to the standard 72 hour exposure, to detect any variation in

ACC
EPTE
D M
ANU
SCR
IPT
ACCEPTED MANUSCRIPT
the expression of resistance (degree of dominance) associated with length of exposure period,
especially at the higher concentrations of phosphine. The estimated LC50 values under the respective
exposure periods were fitted to the standard equation Cnt=k, where k is constant and n is the toxicity
index that decides the effect of exposure period over concentrations [13]. A value of n less than 1.0
is expected in the case that the expression of resistance factors vary significantly with exposure
period on these strains/hybrids [14].
2.4 Data analysis
2.4.1 Resistance factor, dominance and sex linkage
The response of parental strains and reciprocal F1 progeny in each cross were analysed and
fitted to log dose-probit mortality response curves [19] using Genstat software version 16.0 [20].
Resistance factors were calculated as the ratio between LC50 value of resistant parental strains or F1
hybrids with LC50 value of S-strain or Weak-R [21], depending on the crossing scheme. Sex linkage
(influence of maternal factors) [19] was tested by overlap of 95% fiducial limits at LC50 and relative
potency analysis in the response of reciprocal F1 hybrids. The degree of dominance was estimated
from the response of parental strains and reciprocal F1 hybrids in each cross, based on LC50 and
LC99.9, according to the method of Stone [22] to reveal variations (if any) in the expression of the
phenotype in F1 hybrids against concentration. A high number of test insects (n = 600) were used for
each concentration in the probit analysis for estimating LC99.9, so that the estimates were reliable
and closely representative of the observed data.
2.4.2 Number of genes conferring resistance
Three methods were used to determine the number of genes conferring resistance to
phosphine in C. ferrugineus. First, the observed response of the F2 and F1-BC progeny to phosphine
was compared visually to an expected response assuming monogenic inheritance. According to
Tsukumoto et al. [23], if resistance is conferred by a single recessive gene, then a plateau or point of

ACC
EPTE
D M
ANU
SCR
IPT
ACCEPTED MANUSCRIPT
inflection should occur in the log dose-probit response line of the F2 at around 75% and in the F1-BC
response line at around 50%. Second, the null hypothesis of monogenic inheritance of resistance
was tested on the basis of goodness-of-fit [24] between observed mortality and the theoretical
expectations of F2 and F1-BC curves according to Georgiou et al. [25] using a modified chi-square
[26], that incorporates the heterogeneity factor of the parental strains. Since, the observed response
of F1 hybrids in the three crosses differed significantly at high concentrations from the expected
response for incompletely recessive inheritance, a theoretical F1 curve was established based on
incomplete recessive inheritance model and used in predicting the expectations for monogenic F2
and F1-BC response curves. The third test was based on the procedure outlined by Lande et al. [27]
to approximate the number of freely segregating genetic factors (nE) associated with a heritable
phenotype. The nE was estimated by comparing the genotypic and phenotypic variances that
contribute quantitative trait difference between two populations. Thus, nE = (µP2- µP1)2 / 8 σ2
S ≤ n,
where µP1 and µP2 are the log10 of the LC50 values of the resistant and susceptible or weakly resistant
strains, respectively, depending on the crossing scheme, and n was the actual number of genes. The
additional genetic variance (σ2S-Var) associated with the F1-BC generation was estimated as:
σ2S-Var = σ
2B1 + σ2
B2 + * σ2F1 +0.5*( σ2
P1) + 0.5*(σ2P2)], where, σ
2B1 , σ
2B2 , σ
2F1 , σ
2P1 and σ2
P2 refer
to the phenotypic variances of the backcross to susceptible, backcross to resistant, the F1 hybrid,
homozygous resistant and susceptible insects, respectively. The phenotypic variance in each case
was estimated from the slope of the probit regression [27].
3 Results
3.1 Inheritance of weak resistance to phosphine (S-strain x Weak-R)
3.1.1 Resistance levels, maternal effects and degree of dominance
The response of the parental strains, S-strain and Weak-R, and their reciprocal F1 hybrids (F1
and F1‘) were highly homogenous with a low heterogeneity and non-significant chi-square values,
indicating good fit to the probit model (Table 1). The resistance ratio (RR) of Weak-R was 6.3×
compared with the S-strain at the LC50, whereas it was 1.6× and 2.0× for the F1 and F1’, respectively.

ACC
EPTE
D M
ANU
SCR
IPT
ACCEPTED MANUSCRIPT
The responses of reciprocal F1 hybrids were very close to each other, as evident from the significant
overlap of their fiducial limits at LC50 (0.007-0.012) (Table 1). In addition, the estimated relative
potency value of F1 was 0.8 relative to the response of F1‘ with fiducial limits [0.68-1.0], which
include the value 1.0, confirming that there was no significant difference between the responses of
the reciprocal F1 hybrids. These results suggest that weak resistance was autosomal and maternal
factors were absent and therefore the data of reciprocal F1 hybrids was pooled for further
interpretation. At the LC50 the degree of dominance (DD) was -0.48, indicating the resistance is
expressed as an incompletely recessive trait. However, a significant proportion (~15%) of individuals
survived at higher doses (0.01 to 0.1 mg L-1) suggesting that there may be a dose-dependent
variation in expression of resistance trait in F1 or additional resistant factors present at low
frequency in the parental strains (S-strain or in Weak-R), perhaps a variant of the weak resistance
gene (Figure 1). This is clearly evident as the DD approaches 1.0 when the LC99.9 value was used as a
reference instead of the LC50 (Table 1).
3.1.2 Number of genes conferring weak resistance
Visual examination of the observed F2 and F1-BC progeny response curves showed plateaus
at ~75% (0.008 to 0.025 mg L-1) and ~50% (0.018 to 0.035 mg L-1) mortality levels conforming with
the expected response from single, recessive gene inheritance (Figure 1A and B). However, modified
chi-square analysis of individual concentrations of the observed F2 and F1-BC response curves
identified significantly higher mortalities than expected at lower concentrations from 0.004 to 0.008
mg L-1 (P<0.001, df = 1) for F2 and 0.01 to 0.014 mg L-1 (P = 0.01, df = 1) for F1-BC (Figure 1A and B).
These differences were reflected in the overall chi-square analysis of the F2 (χ 2 = 32.3, df = 14, P =
0.001) and F1-BC (χ 2 = 29.3, df = 14, P= 0.04) curves, allowing us to reject the null hypothesis of
single gene inheritance (Tables S1 and S2). Analysis of the number of effective segregating factors
between the S-strain and Weak-R gave nE = 0.8, indicating the presence of a single major gene
between the two strains (Table 2). Thus, while both visual inspection and phenotypic variance
analysis showed strong conformity to a single major gene being responsible for inheritance of the

ACC
EPTE
D M
ANU
SCR
IPT
ACCEPTED MANUSCRIPT
Weak-R phenotype, the chi-square analyses and the response of F1 hybrids at higher concentrations
suggested the possible presence of additional factors. Based on these results, we hypothesise that
resistance in Weak-R may be mediated by single major gene and one or more additional minor
genes.
3.2 Inheritance of strong resistance to phosphine (S-strain x Strong-R)
3.2.1 Resistance levels, maternal effects and degree of dominance
Compared with the response of the S-strain, Strong-R and reciprocal F1 hybrids were 505×
and 6.0× more resistant, respectively, at the LC50 (Table 1). The 95% confidence intervals of the
responses of F1 and F1‘ hybrids overlapped at all concentrations tested, including at the LC50 [0.026-
0.041 and 0.024-0.042], and were statistically indistinguishable (Table 1). The relative potency
analysis of the responses of F1 and F1‘ yielded a value of 0.95 with the fiducial limits [0.69-1.33]
including the value 1.0, confirming the absence of sex-linked inheritance of strong resistance genes.
Thus, the response data of F1 reciprocal crosses were pooled for further analysis. The degree of
dominance of the pooled F1 was -0.43, showing that strong resistance was expressed as an
incompletely recessive trait. However, as observed with the F1 hybrids of the cross S-strain x Weak-
R, a significant proportion (~25%) of the individuals within the F1 cohort survived at higher
concentrations of phosphine (0.06 to 1.0 mg L-1) than expected (Figure 2). The calculated degree of
dominance of the pooled F1 at LC99.9 was 0.39, indicating, a variation in expression of resistance in F1,
possibly contributed by additional resistance factors present in the S-strain or Strong-R at low
frequency.
3.2.2 Number of genes conferring strong resistance
The observed F2 curve exhibited a small point of inflection at 75% mortality at 0.08 to 0.1
mg L-1 and a significant plateauing response at 94% mortality at 0.3 to 2 .0 mg L-1 (Figure 2A). The
expected response for monogenic inheritance would show a distinct plateau at 75% mortality
(Figure 2A). Therefore we can formally reject the null hypothesis of monogenic inheritance. The
response lines more closely resembled those expected from resistance controlled by two completely
ACC
EPTE
D M
ANU
SCR
IPT
ACCEPTED MANUSCRIPT
recessive genes, where the F2 population consists of four distinct phenotypes, in the proportion
9:3:3:1. In this model of inheritance, three distinct plateaus are expected at approximately at 56%,
75% and 94% mortality. The first plateau occurs once all of the homozygous susceptible insects have
died (9/16), the second, once insects homozygous resistant for gene_1 alone have also died (12/16).
The third plateau is reached once insects homozygous resistant for gene_2 alone have died (15/16).
Insects that are homozygous resistant for both gene_1 and gene_2 (1/16) do not begin to die until
they are exposed to more than 0.6 mgL-1. Lack of a plateau at 56% mortality in the observed F2
response (Figure 2A) may be because insect heterozygous for gene_1 cannot be distinguished from
susceptible insects at these concentrations. Although, the overall experimental data were
insufficient to allow a firm conclusion, they were consistent with an inheritance pattern of two major
incompletely recessive genes with the possible involvement of other factors.
Visual examination of the observed F1-BC curve, indicated two plateaus at ~25 and ~75%
mortality levels, at concentrations of 0.08 to 0.1 mg L-1 and 0.8 to 5.0 mg L-1, respectively, instead of
a major plateau at 50% (Figure 2B) as would be expected from the single gene model. Resistance
controlled by two recessive genes would be expected to produce three significant plateaus in the
response line of F1-BC, at 25%, 50% and 75% mortality, resulting from the segregation of four
different genotypes (25% heterozygous for both genes, 25% each homozygous resistant for either
gene_1 or gene_2 but not both, and 25% homozygous resistant for both genes. However, the curve
did not exhibit a plateau at 50% mortality, indicating that the phenotypic response of the two
individual homozygote genotypes were similar.
The chi-square analysis of the observed responses of the F2 and F1-BC at each concentration
showed significant deviations at high concentrations, 0.6 to 4.0 mg L-1 for F2 (χ 2 = 4.58, df = 1, P =
0.032) and at both lower, 0.06 and 0.08 mg L-1 and higher concentrations, 0.6 to 3.0 mg L-1 for F1-BC
(χ 2 = 16.33, df = 1, P < 0.001) curves (Table S3 and S4). The overall chi-square values of the F2 (χ 2 =
25.2, df = 14, P = 0.014) and F1-BC (χ 2 = 76.4, df = 14, P < 0.001) also support rejection of the null
hypothesis of single gene inheritance. The analysis of phenotypic variance estimated the number of

ACC
EPTE
D M
ANU
SCR
IPT
ACCEPTED MANUSCRIPT
freely segregating factors (nE) to be greater than 1. This is consistent with the results of the chi-
square analysis of monogenic inheritance, and confirms the likely involvement of two major genes in
the expression of resistance in Strong-R (Table 2).
3.3 Interactions between weak and strong resistance genes (Weak-R x Strong-R)
3.3.1 Resistance levels, maternal effects and degree of dominance
Mortality testing showed that Strong-R was 80× more resistant to phosphine than Weak-R
(Table 1). There was a significant overlap between the dose response curves of the reciprocal F1
hybrids at almost all concentrations and at the LC50 (0.17-0.24 and 0.20-0.36), indicating that there
was no significant difference in the responses of the reciprocal hybrids. Relative potency analysis of
the reciprocal F1 hybrids resulted in 95% confidence interval of 0.54-1.01, which included the value
1.0, confirming the absence of maternal factors contributing to the trait. Thus, the response data of
F1 reciprocal crosses were pooled for further analyses and interpretation. Comparison of degree of
dominance estimated at the LC50 (-0.14) and LC99.9 (0.78) from the pooled F1 mortality curve
confirmed a change in expression of dominance in heterozygotes in response to the increased
phosphine concentrations, as was also observed with F1 hybrids of other crosses, S-strain x Weak-R
and S-strain x Strong-R (Figures 1-3). Together, these results support the hypothesis that both Weak-
R and Strong-R may have (possibly dominant) resistant factors at low frequency additional to the
major incompletely recessive factors.
3.3.2 Number of genes shared between weak and strong resistance phenotypes
The observed F2 response curve exhibited a significant plateau at ~75% mortality, at 0.3 to
1.0 mg L-1, conforming to the pattern expected for monogenic inheritance (Figure 3A). These results
were reflected in the modified chi-square analysis for individual concentrations as well as in the
overall deviation in the response of the observed F2 (χ 2 = 9.6, df = 14, P = 0.65) in comparison to the
expected F2 (Table S5).
The F1-BC response curve showed a significant plateau at ~50% mortality, at phosphine
concentrations from 0.3 to 1.0 mg L-1, and followed the pattern expected for monogenic inheritance
ACC
EPTE
D M
ANU
SCR
IPT
ACCEPTED MANUSCRIPT
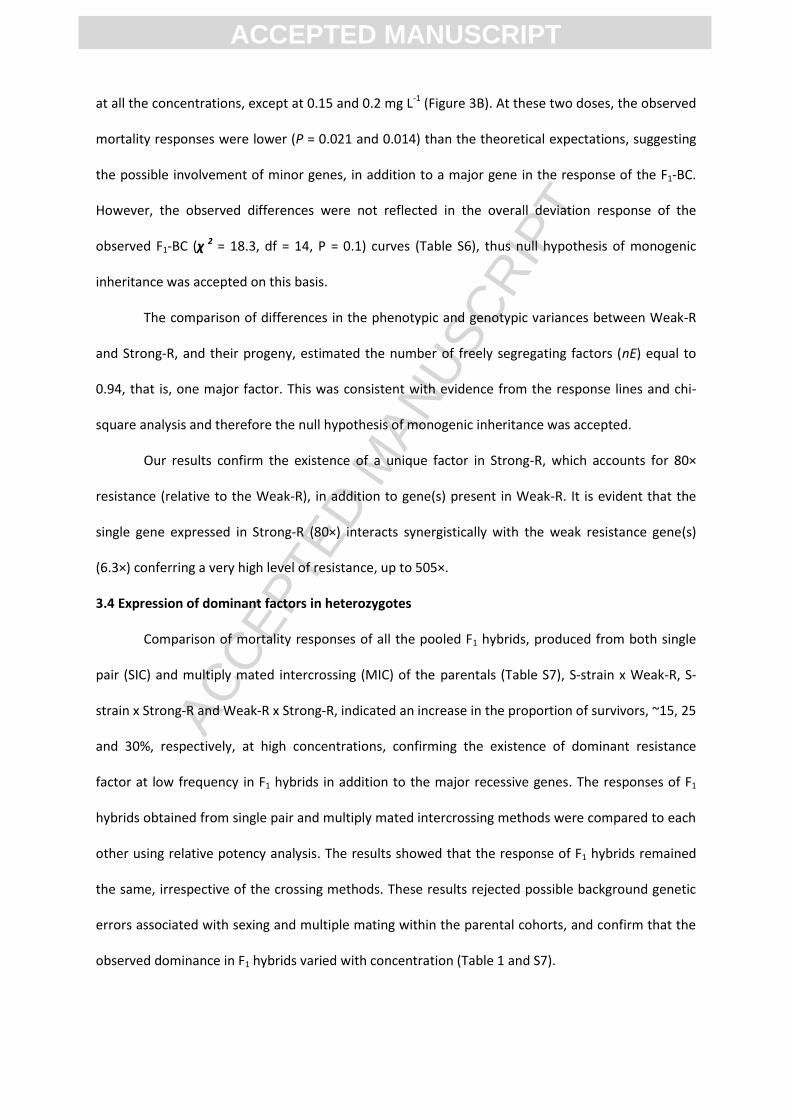
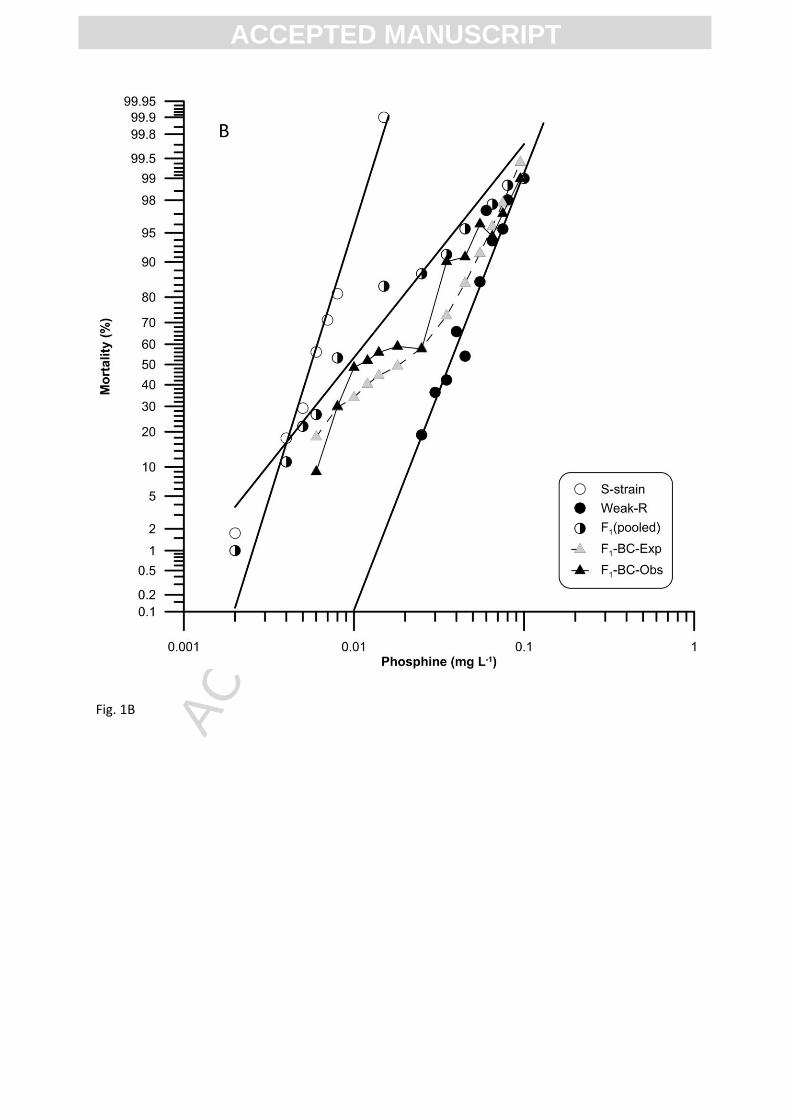
at all the concentrations, except at 0.15 and 0.2 mg L-1 (Figure 3B). At these two doses, the observed
mortality responses were lower (P = 0.021 and 0.014) than the theoretical expectations, suggesting
the possible involvement of minor genes, in addition to a major gene in the response of the F1-BC.
However, the observed differences were not reflected in the overall deviation response of the
observed F1-BC (χ 2 = 18.3, df = 14, P = 0.1) curves (Table S6), thus null hypothesis of monogenic
inheritance was accepted on this basis.
The comparison of differences in the phenotypic and genotypic variances between Weak-R
and Strong-R, and their progeny, estimated the number of freely segregating factors (nE) equal to
0.94, that is, one major factor. This was consistent with evidence from the response lines and chi-
square analysis and therefore the null hypothesis of monogenic inheritance was accepted.
Our results confirm the existence of a unique factor in Strong-R, which accounts for 80×
resistance (relative to the Weak-R), in addition to gene(s) present in Weak-R. It is evident that the
single gene expressed in Strong-R (80×) interacts synergistically with the weak resistance gene(s)
(6.3×) conferring a very high level of resistance, up to 505×.
3.4 Expression of dominant factors in heterozygotes
Comparison of mortality responses of all the pooled F1 hybrids, produced from both single
pair (SIC) and multiply mated intercrossing (MIC) of the parentals (Table S7), S-strain x Weak-R, S-
strain x Strong-R and Weak-R x Strong-R, indicated an increase in the proportion of survivors, ~15, 25
and 30%, respectively, at high concentrations, confirming the existence of dominant resistance
factor at low frequency in F1 hybrids in addition to the major recessive genes. The responses of F1
hybrids obtained from single pair and multiply mated intercrossing methods were compared to each
other using relative potency analysis. The results showed that the response of F1 hybrids remained
the same, irrespective of the crossing methods. These results rejected possible background genetic
errors associated with sexing and multiple mating within the parental cohorts, and confirm that the
observed dominance in F1 hybrids varied with concentration (Table 1 and S7).

ACC
EPTE
D M
ANU
SCR
IPT
ACCEPTED MANUSCRIPT
3.4.1 Effect of exposure period on the expression of dominant factors in heterozygotes at high
concentrations
Mortality data of parental strains, S-strain, Weak-R and Strong-R and their F1 hybrids from
three multiply mated intercrosses, S-strain x Weak-R, S-strain x Strong-R and Weak-R x Strong-R
were compared at three exposure periods, 48, 72 and 144 hours. These results indicated small
differences in the overall response of parental strains and F1 hybrids to phosphine with time,
specifically between 48 and 144 hours exposure periods (Table 3 and 4) and suggested that increase
of exposure period improved the degree of linearity and homogeneity. With regard to the specific
proportion of survivors of F1 at higher concentrations in each cross, the response was evident in all
the tested exposure periods, confirming the expression of dominant heritable factors at low
frequency in addition to the major recessive factors for weak and strong resistance phenotypes.
Grouped regression analysis on the mortality data and exposure periods showed that within each of
the parent strains and F1 hybrids, the concentration required to achieve 50% mortality (LC50) could
be best described by parallel curves (R2=0.993, F (6,17) = P<0.001), indicating that the observed
changes in LC50 are proportionate to the amount of increase in the exposure period. Thus neither the
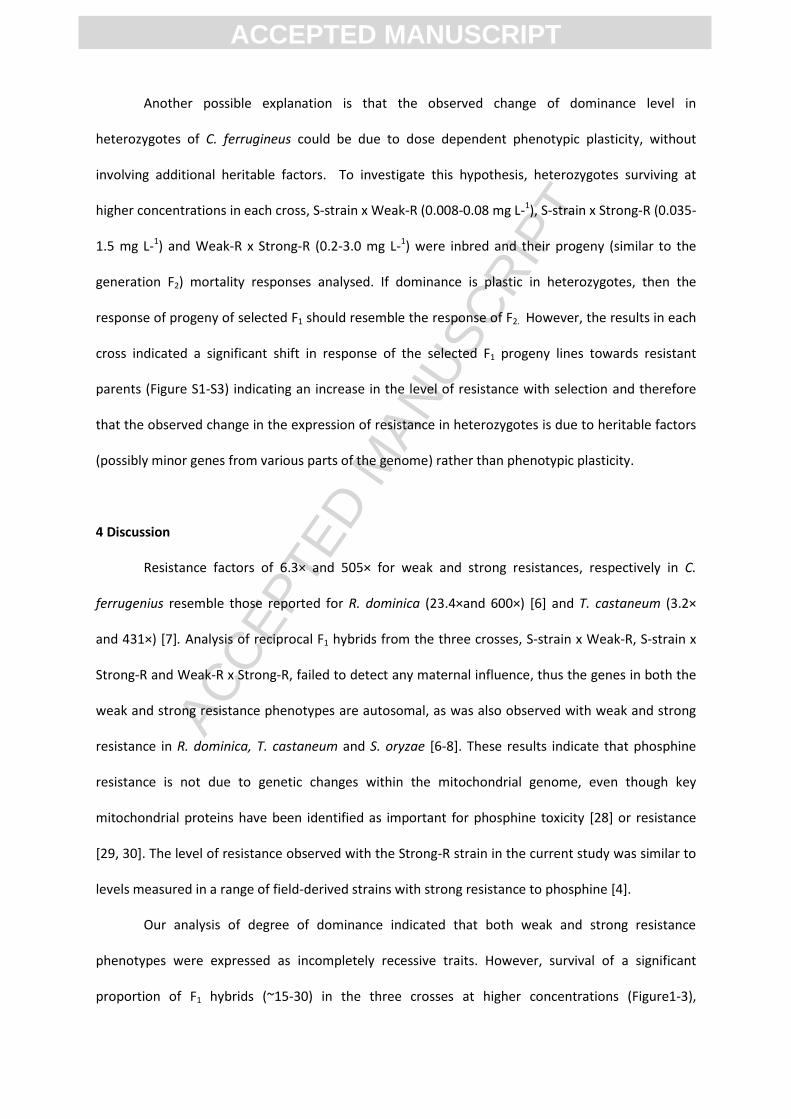
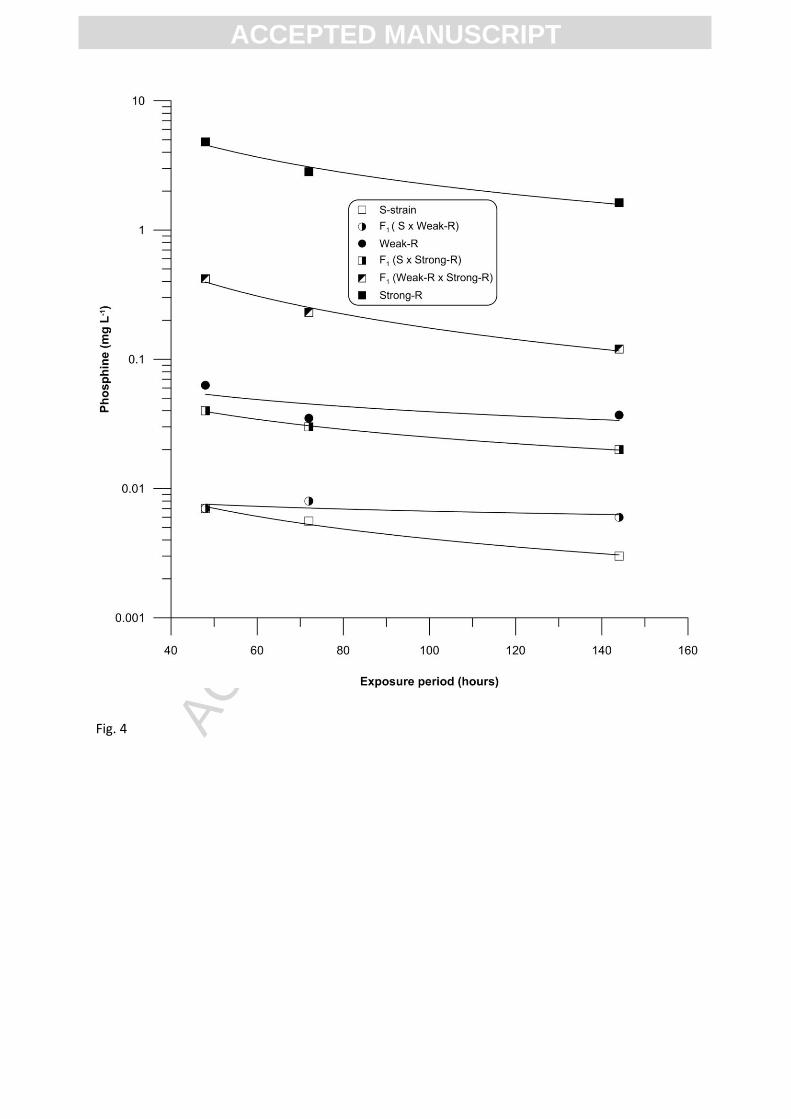
resistance nor the dominance factors were influenced by exposure period (Table 5 and Figure 4). The
concentration (C) and time (t) relationship analysis yielded a toxicity index (n), value of 1.23, which is
>1, suggesting that the effect of exposure period was not more significant than concentration on the
expression of resistance factors in these strains/hybrids in this bioassay system.
In addition, the estimated degree of dominance at two mortality reference points, LC50 and
LC99.9, over three different exposure periods, 48, 72 and 144 hours, indicated that the expression of
resistance in F1 hybrids of all the crosses, varied from incomplete recessivity (-1) to complete
dominance (+1). The latter occurring at higher concentrations of phosphine (Table 1 and Figures 1-
3), confirming that the heterozygotes of weakly and strongly resistant C. ferrugineus have an
additional resistance gene (s) expressing a dominant phenotype at low frequency, which provides a
survival advantage at very high concentrations, irrespective of the length of the exposure period.
ACC
EPTE
D M
ANU
SCR
IPT
ACCEPTED MANUSCRIPT
Another possible explanation is that the observed change of dominance level in
heterozygotes of C. ferrugineus could be due to dose dependent phenotypic plasticity, without
involving additional heritable factors. To investigate this hypothesis, heterozygotes surviving at
higher concentrations in each cross, S-strain x Weak-R (0.008-0.08 mg L-1), S-strain x Strong-R (0.035-
1.5 mg L-1) and Weak-R x Strong-R (0.2-3.0 mg L-1) were inbred and their progeny (similar to the
generation F2) mortality responses analysed. If dominance is plastic in heterozygotes, then the
response of progeny of selected F1 should resemble the response of F2. However, the results in each
cross indicated a significant shift in response of the selected F1 progeny lines towards resistant
parents (Figure S1-S3) indicating an increase in the level of resistance with selection and therefore
that the observed change in the expression of resistance in heterozygotes is due to heritable factors
(possibly minor genes from various parts of the genome) rather than phenotypic plasticity.
4 Discussion
Resistance factors of 6.3× and 505× for weak and strong resistances, respectively in C.
ferrugenius resemble those reported for R. dominica (23.4×and 600×) [6] and T. castaneum (3.2×
and 431×) [7]. Analysis of reciprocal F1 hybrids from the three crosses, S-strain x Weak-R, S-strain x
Strong-R and Weak-R x Strong-R, failed to detect any maternal influence, thus the genes in both the
weak and strong resistance phenotypes are autosomal, as was also observed with weak and strong
resistance in R. dominica, T. castaneum and S. oryzae [6-8]. These results indicate that phosphine
resistance is not due to genetic changes within the mitochondrial genome, even though key
mitochondrial proteins have been identified as important for phosphine toxicity [28] or resistance
[29, 30]. The level of resistance observed with the Strong-R strain in the current study was similar to
levels measured in a range of field-derived strains with strong resistance to phosphine [4].
Our analysis of degree of dominance indicated that both weak and strong resistance
phenotypes were expressed as incompletely recessive traits. However, survival of a significant
proportion of F1 hybrids (~15-30) in the three crosses at higher concentrations (Figure1-3),

ACC
EPTE
D M
ANU
SCR
IPT
ACCEPTED MANUSCRIPT
irrespective of the length of exposure period, indicated the presence of other heritable factors
(possibly dominant in expression) contributing to the resistance phenotype, in addition to the major
incompletely recessive resistance genes. The selected F1 hybrids from the three crosses also
revealed the existence of additional heritable factors, corroborating this hypothesis (Figures S1-S3).
On the other hand it is possible that the S-strain carried a factor, possibly a variant of a resistance
gene present in Weak-R, that contributed to higher resistance in the F1s of the S-strain x Weak-R and
S-strain x Strong-R crosses. However, probit analysis indicated a homogenous phenotypic response
to phosphine in S-strain (Table 1), making this explanation less likely. In addition, survival at higher
concentrations was also observed in the F1 progeny of Weak-R x Strong-R cross (Figure 3A and 3B),
an effect that cannot be explained by an S-strain genotype. The most parsimonious explanation,
therefore, is that at least one additional dominant resistance factor is present at a low frequency in
each of Weak-R and Strong-R. The possibility of an additional dominant factor contributing to
phosphine resistance was also observed in R. dominica [6] in heterozygotes from a cross of Weak-R x
Strong-R. However, this effect was not observed either in T. castaneum [7] or S. oryzae [8, 9],
indicating the existence of differences between species in background genetic factors contributing
to the expression of the resistance phenotype. Similarly, higher survival of F1 (R x S) hybrids than
expected in permethrin-resistant tobacco budworm, Heliothis virescens (F.), was attributed to the
presence of minor dominant factors in addition to a major recessive factor, regulating the overall
expression of resistance phenotype in this pest [31]. The practical significance of our results is that
resistant heterozygotes of C. ferrugineus that carry a dominant allele have a greater chance than
expected of surviving field fumigations. This may be a factor in the rapid development and selection
of high level resistance in this species.
The novel resistance factors observed in C. ferrugineus could be new copies of already
described weak or strong resistance genes resulting from gene duplication [32], or multiple
mutations within the same gene as has occurred in several field insect pests [33-35], or they could
be unique minor factors [31, 36]. These additional factors may contribute to the ability of C.

ACC
EPTE
D M
ANU
SCR
IPT
ACCEPTED MANUSCRIPT
ferrugineus to withstand very high concentrations of phosphine over lengthy exposure periods (1 mg
L-1 for 168 h) [4], a rate that would readily kill strongly resistant individuals of other species.
The mortality responses of the F2 and F1-BC progeny and the additive phenotypic variance
analyses from S-strain x Weak-R and Weak-R x Strong-R crosses provided strong evidence for a single
major gene being responsible for each stepwise increase in resistance. It is also clear that full
expression of the strong resistance phenotype requires that individuals are homozygous for each of
these major, recessive resistance factors. The results from the S-strain x Strong-R cross were broadly
consistent with this interpretation. However, consistent with the results from the analysis of the F1
responses, the results from the F2 and F1-BC progeny indicate the possible contribution of other
minor factors to the resistance trait. As with other phosphine resistant pest species, the very high
level of resistance exhibited by the Strong-R (505×) appears to be the result of strong synergistic
interactions between two major genes. These results are consistent with inheritance of weak and
strong resistance to phosphine in R. dominica, T. castaneum and S. oryzae, where the weak
resistance phenotype was predominantly controlled by a single major gene, rph1, and strong
resistance was governed by the synergistic interaction of two major genes, rph1 and rph2 [6-8, 37].
Based on the overall genetic analyses, we propose that repeated fumigation of commercial
grain stores under conditions designed to control other pest insect species, rapidly selected strongly
resistant heterozygotes of C. ferrugineus that could then breed to produce strongly resistant
homozygotes. More research on this aspect is needed to develop resistance management strategies
[38] that can effectively eliminate resistant heterozygotes in the field.
5 Conclusion
While it is not possible to control strongly resistant C. ferrugineus using current registered
phosphine dosages [39], the similarity in the resistance genetics across the four key grain insect
pests, R. dominca, T. castaneum, S. oryzae and C. ferrugineus, indicates that a highly conserved
genetic response to phosphine selection exists in these insects. In this context, a suitable alternative

ACC
EPTE
D M
ANU
SCR
IPT
ACCEPTED MANUSCRIPT
fumigant with a different mode of action can effectively be used to curtail the selection of resistant
individuals of C. ferrugineus and other grain insect species [40]. In addition, the results of this work
will assist with identification of the rph1 gene, which may provide new control opportunities to
manage resistance to phosphine in grain insect pests. The similarity to the resistance in other species
suggests that it will be straightforward to develop PCR-based rapid diagnostics [41] to support
management of resistance to phosphine in C. ferrugineus.
Acknowledgements
The authors thank Dr Greg Daglish for his valuable comments on the manuscript and
Hervoika Pavic, Virgine Tenshia Singarayan and Linda Bond for technical assistance throughout this
study. We wish to acknowledge the support of Australia-India Grand Challenge Research Fund
(GCF010006), jointly supported by Department of Industry and Science (DIS), Australia
(http://www.industry.gov.au) and Department of Science and Technology (DST), India
(http://www.dst.gov.in) for their support of this research.
REFERENCES
[1] J.E. Throne, M.P. Culik, Progeny production and duration of development of rusty grain beetles, Cryptolestes ferrugineus (Stephens) (Coleoptera: Cucujidae), on cracked and whole corn, Journal of Entomological Science, 24 (1989) 150-155.
[2] E.R. Sinclair, M. Bengston, The frequency of Cryptolestes spp. in grain in south-east Queensland, Australian Journal of Experimental Agriculture and Animal Husbandry, 20 (1980) 234-239.
[3] J. Holloway, Survey detects super-strong phosphine resistance in flat grain beetles, Australian Grain, Grain Research Development Corporation (GRDC), Canberra, Australia, 2008, pp. 1.
[4] M.K. Nayak, J.C. Holloway, R.N. Emery, H. Pavic, J. Bartlet, P.J. Collins, Strong resistance to phosphine in the rusty grain beetle, Cryptolestes ferrugineus (Stephens) (Coleoptera: Laemophloeidae): its characterisation, a rapid assay for diagnosis and its distribution in Australia, Pest Management Science, 69 (2012) 48-53.
[5] R.T. Roush, J.A. McKenzie, Ecological genetics of insecticide and acaricide resistance., Annual Review of Entomology, 32 (1987) 361-380.

ACC
EPTE
D M
ANU
SCR
IPT
ACCEPTED MANUSCRIPT
[6] P.J. Collins, G.J. Daglish, M. Bengston, T.M. Lambkin, H. Pavic, Genetics of resistance to phosphine in Rhyzopertha dominica (Coleoptera : Bostrichidae), Journal of Economic Entomology, 95 (2002) 862-869.
[7] R. Jagadeesan, P.J. Collins, G.J. Daglish, P. Ebert, D.I. Schlipalius, Phosphine resistance in the rust red flour beetle, Tribolium castaneum (Coleoptera: Tenebrionidae): Inheritance, Gene interactions and Fitness costs, PLoS ONE, 7 () (2012) e3152.
[8] T.T. Nguyen, P.J. Collins, P.R. Ebert, Inheritance and Characterization of Strong Resistance to Phosphine in Sitophilus oryzae (L.). PLoS ONE, 10 (4) (2015) e0124335.
[9] G.J. Daglish, K.M. Nayak, H. Pavic, Phosphine resitsance in Sitophilus oryzae (L.) form eastern Australia: Inheritance, fitness and prevalence, Journal of Stored Product Research, 59 (2014) 237-244. .
[10] P.J. Collins, G.J. Daglish, H. Pavic, R.A. Kopittke, Response of mixed-age cultures of phosphine-resistant and susceptible strains of lesser grain borer, Rhyzopertha dominica, to phosphine at a range of concentrations and exposure periods, Journal of Stored Products Research, 41 (2005) 373-385.
[11] L.A. Price, K.A. Mills, The toxicity of phosphine to the immature stages of resistant and susceptible strains of some common stored product beetles and implications for their control, Journal of Stored Products Research, 24 (1988) 51-60.
[12] B.D. Hole, C.H. Bell, K.A. Mills, G. Goodship, The toxicity of phosphine to all developmental stages of thirteen species of stored product beetles, Journal of Stored Products Research, 12 (1976) 235-244.
[13] G.J. Daglish, P.J. Collins, H. Pavic, R.A. Kopittke, Effects of time and concentration on mortality of phosphine-resistant Sitophilus oryzae (L) fumigated with phosphine, Pest Management Science, 58 (2002) 1015-1021.
[14] G.J. Daglish, Effect of exposure period on degree of dominance of phosphine resistance in adults of Rhyzopertha dominica (Coleoptera : Bostrychidae) and Sitophilus oryzae (Coleoptera : Curculionidae), Pest Management Science, 60 (2004) 822-826.
[15] P.J. Collins, R.N. Emery, B.E. Wallbank, Two decades of monitoring and managing phosphine resistance in Australia, Advances in Stored Product Protection. Proceedings of the 8th International Working Conference on Stored Product Protection, York, UK, 22-26 July 2002, 2003, pp. 570-575.
[16] Grain Trade Australia, Phosphine strategy, in: P.J. Collins (Ed.) National Working Party on Grain Protection (NWPGP)http://www.graintrade.org.au/nwpgp, 2015.
[17] D.X. Wang, P.J. Collins, X.W. Gao, Optimising indoor phosphine fumigation of paddy rice bag-stacks under sheeting for control of resistant insects, Journal of Stored Products Research, 42 (2006) 207-217.

ACC
EPTE
D M
ANU
SCR
IPT
ACCEPTED MANUSCRIPT
[18] R. Jagadeesan, M.K. Nayak, K. Dawson, V. Byrne, P.J. Collins, Dietary media for mass rearing of rusty grain beetle, Cryptolestes ferrugineus (Stephens) and flat grain beetle, Cryptolestes pusillus (Schonherr) (Coleoptera), Journal of Stored Product Research, 55 (2013) 68-72.
[19] D.J. Finney, Probit Analysis, 3rd ed., Cambridge University Press, London1979.
[20] VSN, GenStat for Windows Release 16.1, VSN International, Hemel Hempstead, Oxford, UK., (2013).
[21] J.L. Robertson, R.M. Russell, H.K. Preisler, N.E. Savin, Bioassays with Arthropods, 2nd ed., CRC Press, Boca Raton, FL2007.
[22] B.F. Stone, A formula for determining the degree of dominance in case of monofactorial inheritance of resistance to chemicals., Bulletin WHO 38 (1968) 325-326.
[23] M. Tsukamoto, The log-dose mortality curve in genetic researches of insect resistance to insecticides, Botyu Kagaku, 28 (1963) 91-98.
[24] R.R. Sokal, F.J. Rohlf, Biometry, 3rd ed., WH Freeman, New York, 1995.
[25] G.P. Georghiou, Genetics of resistance to insecticides in house flies and mosquitoes, Experimental Parasitology 26 (1969) 224-255.
[26] H. Preisler, K. Hoy, M. A. , J.L. Robertson, Statistical analysis of modes of inheritance for pesticide resistance, Journal of Econonomic Entomology 83 (1990) 1649-1655.
[27] R. Lande, The minimum number of genes contributing to quantititative variation between and within populations, Genetics, 99 (1981) 541-553.
[28] H. Nakakita, The inhibitory site of phosphine, Journal of Pesticide Science, 1 (1976) 235-238.
[29] D.I. Schlipalius, N. Valmas, A.G. Tuck, R. Jagadeesan, L. Ma, R. Kaur, A. Goldinger, C. Anderson, J. Kuang, S. Zuryn, Y.S. Mau, Q. Cheng, P.J. Collins, M.K. Nayak, H.J. Schirra, M.A. Hilliard, P.R. Ebert, A core metabolic enzyme mediates resistance to phosphine gas, Science, 338 (2012) 807-810.
[30] S. Zuryn, J. Kuang, P. Ebert, Mitochondrial modulation of phosphine toxicity and resistance in Caenorhabditis elegans, Toxicological Sciences, 102 (2008) 179-186.
[31] G.T. Payne, R.G. Blenk, T.M. Brown, Inheritance of permethrin resistance in the tobocco budworm (Lepidoptera: Noctuidae), Journal of Economic Entomology, 81 (1988) 65-73.
[32] K. Itokawa, O. Komagata, S. Kasai, H. Kawada, C. Mwatele, G. Dida, N. SM, C. Mwandawiro, T. Tomita, Global spread and genetic variants of the two CYP9M10 haplotype forms associated with insecticide resistance in Culex quinquefasciatus Say, Heredity, 111 (2013) 213-226.

ACC
EPTE
D M
ANU
SCR
IPT
ACCEPTED MANUSCRIPT
[33] M.S. Williamson, Martinexz-Torres, C.A. Hick, A.L. Devonshire, Identification of mutations in housefly para type sodium channel gene associated with knockdown resistance (kdr) to pyrethroid insecticides, Molecular and General Genetics, 252 (1996) 51-60.
[34] I. Eleftherianos, S.P. Foster, M.S. Williamson, I. Denholm, Inheritance of L1014F and M918T sodium channel mutations associated with pyrethroid resistance in Myzus persicae, Biology Letters, 4 (2008) 545-548.
[35] N.M. Endersby, K. Viduka, S.W. Baxter, J. Saw, D.G. Heckel, McKechnie, Widespread pyrethroid resistance in Australian diamondback moth, Plutella xylostella (L.), is related to multiple mutations in the para sodium channel gene, Bulletin of Entomological Research, 101 (2011) 393-405.
[36] F.R. Groeters, B.E. Tabashnik, Roles of selection intensity, major genes and minor genes in evolution of insecticide resistance, Journal of Economic Entomology, 93 (2000) 1580-1587.
[37] R. Jagadeesan, A. Fotheringham, P.R. Ebert, D.I. Schlipalius, Rapid genome wide mapping of phosphine resistance loci by a simple regional averaging analysis in the red flour beetle, Tribolium castaneum, BMC Genomics, 14 (2013) 1471-2164.
[38] G.P. Opit, P.J. Collins, G.J. Daglish, Resistance Management, in: W.D. Hagstrum, T.W. Philips, G.W. Cuperus (Eds.) Stored Product Protection, Kansas State University, Manhattan, Kansas, 2012, pp. 352p.
[39] R. Kaur, K.M. Nayak, Developing effective fumigation protocols to manage strongly phosphine-resistant Cryptolestes ferrugineus (Stephens) (Coleoptera: Laemophloeidae). Pest Management Science, 71 (2015) 1297-1302.
[40] R. Jagadeesan, Susceptibility to sulfuryl fluoride and lack of cross-resistance to phosphine in developmental stages of the red flour beetle, Tribolium castaneum (Coleoptera: Tenebrionidae), Pest Management Science, 71 (2015) 1379-1386.
[41] R. Kaur, E. Daniels, K.M. Nayak, P. Ebert, D.I. Schlipalius, Determining changes in the distribution and abundance of a Rhyzopertha dominica phosphine resistance allele in farm grain storages using a DNA marker., Pest Management Science, 69 (2013) 685-688.

ACC
EPTE
D M
ANU
SCR
IPT
ACCEPTED MANUSCRIPT
Figure captions
Figure 1: Probit mortality response of S, Weak-R, F1, F2 (A) and F1-BC progeny (B ) of the cross S-
strain x Weak-R (Cryptolestes ferrugineus) to phosphine over 72 hour exposure period at 25°C and
55% RH
Figure 2 Probit mortality response of S-strain, Strong-R and F1, F2 (A) and F1-BC progeny (B) of the
cross S-strain x Strong-R (Cryptolestes ferrugineus) to phosphine over 72 hour exposure period at
25°C and 55% RH
Figure 3 Probit mortality response of Weak-R, Strong-R and F1, F2 (A) and F1-BC progeny (B) of the
cross Weak-R x Strong-R (Cryptolestes ferrugineus) to phosphine over 72 hour exposure period at
25°C and 55% RH
Figure 4 The graph illustrating parallel type relationship between phosphine concentrations and
exposure periods on the mortality of susceptible and phosphine-resistant strains and their F1 hybrids
of Cryptolestes ferrugienus obtained from three multiply mated inter crosses

ACC
EPTE
D M
ANU
SCR
IPT
ACCEPTED MANUSCRIPT
Fig. 1A
ACC
EPTE
D M
ANU
SCR
IPT
ACCEPTED MANUSCRIPT
Fig. 1B

ACC
EPTE
D M
ANU
SCR
IPT
ACCEPTED MANUSCRIPT
Fig. 2A

ACC
EPTE
D M
ANU
SCR
IPT
ACCEPTED MANUSCRIPT
Fig. 2B

ACC
EPTE
D M
ANU
SCR
IPT
ACCEPTED MANUSCRIPT
Fig. 3A

ACC
EPTE
D M
ANU
SCR
IPT
ACCEPTED MANUSCRIPT
Fig. 3B
ACC
EPTE
D M
ANU
SCR
IPT
ACCEPTED MANUSCRIPT
Fig. 4
ACC
EPTE
D M
ANU
SCR
IPT
ACCEPTED MANUSCRIPT
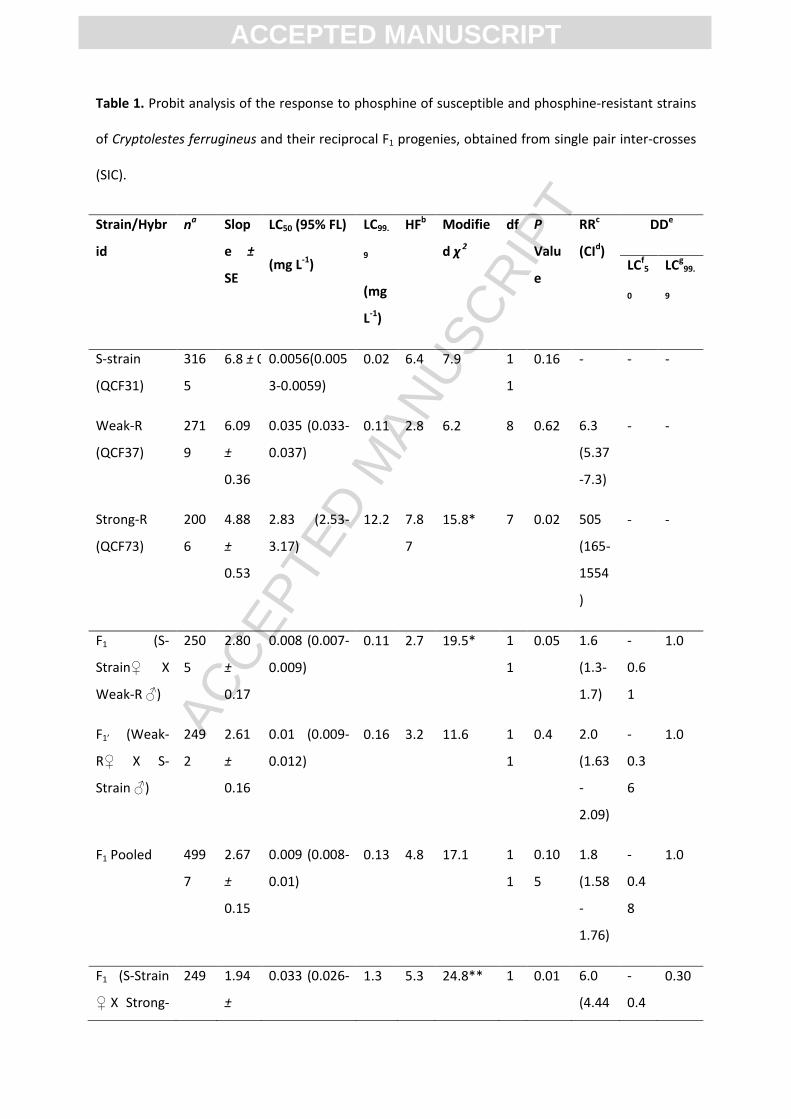
Table 1. Probit analysis of the response to phosphine of susceptible and phosphine-resistant strains
of Cryptolestes ferrugineus and their reciprocal F1 progenies, obtained from single pair inter-crosses
(SIC).
Strain/Hybr
id
na Slop
e ±
SE
LC50 (95% FL)
(mg L-1)
LC99.
9
(mg
L-1)
HFb Modifie
d χ 2
df P
Valu
e
RRc
(CId)
DDe
LCf5
0
LCg99.
9
S-strain
(QCF31)
316
5
6.8 ± 0.57 0.0056(0.005
3-0.0059)
0.02 6.4 7.9 1
1
0.16 - - -
Weak-R
(QCF37)
271
9
6.09
±
0.36
0.035 (0.033-
0.037)
0.11 2.8 6.2 8 0.62 6.3
(5.37
-7.3)
- -
Strong-R
(QCF73)
200
6
4.88
±
0.53
2.83 (2.53-
3.17)
12.2 7.8
7
15.8* 7 0.02 505
(165-
1554
)
- -
F1 (S-
Strain♀ X
Weak-R ♂)
250
5
2.80
±
0.17
0.008 (0.007-
0.009)
0.11 2.7 19.5* 1
1
0.05 1.6
(1.3-
1.7)
-
0.6
1
1.0
F1’ (Weak-
R♀ X S-
Strain ♂)
249
2
2.61
±
0.16
0.01 (0.009-
0.012)
0.16 3.2 11.6 1
1
0.4 2.0
(1.63
-
2.09)
-
0.3
6
1.0
F1 Pooled 499
7
2.67
±
0.15
0.009 (0.008-
0.01)
0.13 4.8 17.1 1
1
0.10
5
1.8
(1.58
-
1.76)
-
0.4
8
1.0
F1 (S-Strain
♀ X Strong-
249 1.94
±
0.033 (0.026- 1.3 5.3 24.8** 1 0.01 6.0
(4.44
-
0.4
0.30

ACC
EPTE
D M
ANU
SCR
IPT
ACCEPTED MANUSCRIPT
R ♂ ) 8 0.17 0.041) 1 -
7.83)
3
F1’ (Strong-R
♀ X S-Strain
♂)
252
4
1.71
±
0.17
0.033 (0.024-
0.042)
2.1 7.4 33.4*** 1
1
0.00
0
6.0
(4.35
-
7.89)
-
0.4
3
0.15
F1 Pooled 502
2
1.81
±
0.16
0.033 (0.025-
0.041)
1.7 11.
0
31.4** 1
1
0.00
1
6.0
(3.3-
7.5)
-
0.4
3
0.39
F1 (Weak-R
♀ X Strong-
R ♂)
250
1
2.14
±
0.14
0.20 (0.17-
0.24)
5.6 3.8 16.2 1
1
0.14 6.0
(3.48
-
9.49)
-
0.0
6
0.67
F1’ (Strong-R
♀ X Weak-
R ♂)
250
5
2.05
±
0.22
0.27 (0.2-
0.36)
8.6 11.
5
18.9 1
1
0.06 8.0
(2.85
-
20.58
)
-
0.2
0
0.85
F1 Pooled 500
6
2.07
±
0.17
0.23 (0.19-
0.29)
7.3 12.
3
27.9* 1
1
0.00
3
7.0
(3.39
-
13.0)
-
0.1
4
0.78
a Number of insects subjected to phosphine bioassay, excluding control
bHeterogeneity factor
(HF) = Regression mean deviance / Total mean deviance (in responding to series of
concentrations of phosphine)
c Resistance Ratio (RR) = Resistance Ratio (LC50
of resistant or F1 Hybrid / LC50 of susceptible/ Weakly resistant
strain)
dConfidence Interval (CI) of the resistance ratio,
e Degree of Dominance (DD) = (2log LCRS- Log LCR- Log LCS) /
(Log LCR-Log LCS), where f and
g represent estimated dominance levels for mortality reference points at LC50
and LC99.9
* Significant (P<0.05); ** Significant (P<0.01); *** Significant (P<0.001)
ACC
EPTE
D M
ANU
SCR
IPT
ACCEPTED MANUSCRIPT
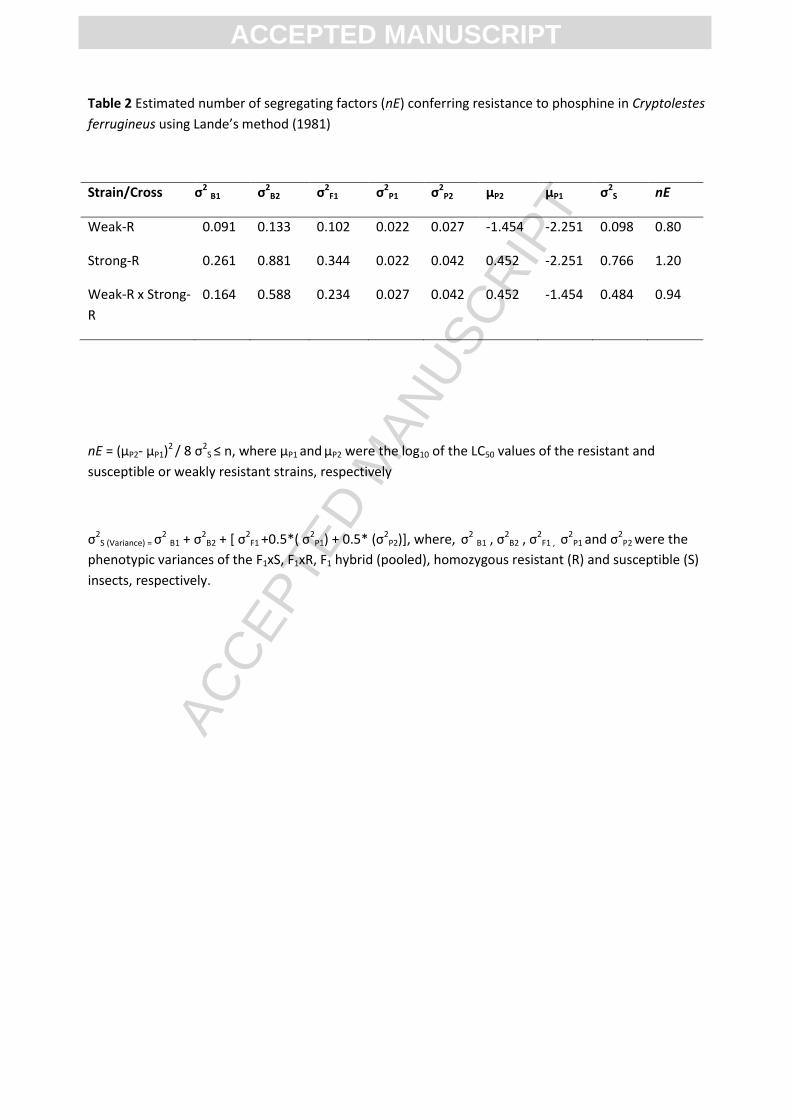
Table 2 Estimated number of segregating factors (nE) conferring resistance to phosphine in Cryptolestes
ferrugineus using Lande’s method (1981)
Strain/Cross σ2 B1 σ2B2 σ2
F1 σ2P1 σ2
P2 µP2 µP1 σ2S nE
Weak-R 0.091 0.133 0.102 0.022 0.027 -1.454 -2.251 0.098 0.80
Strong-R 0.261 0.881 0.344 0.022 0.042 0.452 -2.251 0.766 1.20
Weak-R x Strong-
R
0.164 0.588 0.234 0.027 0.042 0.452 -1.454 0.484 0.94
nE = (µP2- µP1)2 / 8 σ2
S ≤ n, where µP1 and µP2 were the log10 of the LC50 values of the resistant and
susceptible or weakly resistant strains, respectively
σ2S (Variance) = σ
2 B1 + σ2B2 + * σ2
F1 +0.5*( σ2P1) + 0.5* (σ2
P2)], where, σ2 B1 , σ
2B2 , σ
2F1 , σ
2P1 and σ2
P2 were the
phenotypic variances of the F1xS, F1xR, F1 hybrid (pooled), homozygous resistant (R) and susceptible (S)
insects, respectively.

ACC
EPTE
D M
ANU
SCR
IPT
ACCEPTED MANUSCRIPT
Table 3 Response of susceptible (S) and phosphine-resistant (Weak-R and Strong-R) strains of
Cryptolestes ferrugineus to phosphine at three different exposure periods
Strain Exposure
(h)
Slope
± SE
LC50 (95% FL)
(mg l-1)
LC99.9
(mg
l-1)
HFa Modified
χ 2
df P
Value
RRb (CIc)
S-strain
(QCF31)
48 5.7 ± 0.56 0.007 (0.0062-
0.0075)
0.02 2.9 4.28 6 0.64 -
72 6.8 ± 0.57 0.0056(0.0053-
0.0059)
0.02 6.4 7.9 11 0.16 -
144 5.53 ±
1.58
0.003 (0.0015-
0.0041)
0.01 17.3 13.4 7 0.06 -
Weak-R
(QCF37)
48 4.50 ±
0.234
0.063 (0.06-
0.066)
0.31 1 2.61 6 0.85 9 (2.57-
32.76)
72 6.09 ±
0.36
0.035 (0.033-
0.037)
0.11 2.8 6.2 8 0.62 6.3 (5.37-
7.3)
144 7.33 ±
0.75
0.037 (0.033-
0.042)
0.06 1.01 7.24 6 0.29 7 (3.83-
13.67 )
Strong-R
(QCF73)
48 5.04 ±
0.85
4.81 (3.71-
6.16)
19.8 6.7 5.53 6 0.59 705 (2.54-
6.50)
72 4.88 ±
0.53
2.83 (2.53-
3.17)
12.2 7.87 6.3 6 0.39 505 (165-
1554)
144 8.38 ±
0.83
1.63 (1.5-1.8) 3.81 2.35 5.81 7 0.562 539
(37.89-
7660)
aHeterogeneity factor (HF) = Regression mean deviance / Total mean deviance (in responding to
series of concentrations of phosphine)
b Resistance Ratio (RR) = Resistance Ratio (LC50 of resistant / LC50 of susceptible)

ACC
EPTE
D M
ANU
SCR
IPT
ACCEPTED MANUSCRIPT
cConfidence Interval (CI) of the resistance ratio
* Significant (P<0.05); ** Significant (P<0.01); *** Significant (P<0.001)

ACC
EPTE
D M
ANU
SCR
IPT
ACCEPTED MANUSCRIPT
Table 4 Probit mortality response of F1 progeny (pooled), obtained from multiply mated inter crosses
(MIC) between strains of Cryptolestes ferrugineus to phosphine at three different exposure periods
Cross Exposure
(h)
Slope
± SE
LC50
(95%
FL)
(mg l-1)
LC99.9
(mg
l-1)
HFa DDb Modified
χ 2
df P
LCc50 LCd
99.9
F1 Pooled (S-
Strain X Weak-
R )
48 6.53 ± 1.63 0.0066
(0.005-
0.008)
0.02 11.8 -
1.00
-1.00 84.8*** 6 <0.001
72 3.13
±
0.35
0.0083
(0.006-
0.01)
0.08 13.6 -
0.61
0.62 10.3 8 0.24
144 3.17
±
0.29
0.006
(0.0053-
0.007)
0.06 4.2 -
0.45
1.00 24.9** 10 0.005
F1 Pooled (S-
Strain X
Strong-R )
48 2.04
±
0.39
0.036
(0.02-
0.054)
1.18 4.5 -
0.49
0.16 5.09 6 0.532
72 1.7 ±
0.26
0.028
(0.016-
0.042)
1.80 23.2 -
0.48
0.40 6.9 8 0.54
144 1.66
±
0.17
0.022
(0.017-
0.029)
1.60 6.7 -
0.37
0.70 25.9* 9 0.002
F1 Pooled
(Weak-R X
Strong-R)
48 1.70
±
0.33
0.42
(0.27-
0.74)
27.8 5.4 -
0.12
1.00 4.97 6 0.547
72 1.42
±
0.23
(0.15-
34.6 13.4 -
0.14
1.00 7.4 9 0.60

ACC
EPTE
D M
ANU
SCR
IPT
ACCEPTED MANUSCRIPT
0.16 0.33)
144 1.82
±
0.13
0.12
(0.095-
0.14)
5.8 4.1 -
0.38
0.41 9.1 10 0.52
aHeterogeneity factor (HF) = Regression mean deviance / Total mean deviance (in responding to
series of concentrations of phosphine)
b Degree of Dominance (DD) = (2log LCRS- Log LCR- Log LCS) / (Log LCR-Log LCS), ), where c and d
represent estimated dominance levels for mortality reference points at LC50 and LC99.9
* Significant (P<0.05); ** Significant (P<0.01); *** Significant (P<0.001)

ACC
EPTE
D M
ANU
SCR
IPT
ACCEPTED MANUSCRIPT
36
Table 5 Relationship between phosphine concentration (C) exposure period (T) on mortality of
strains of Cryptolestes ferrugineus and their F1 hybrids at LC50
Parentals/Hybrids C XT relationship Toxicity index (n) †
S-strain LC50 = 0.0965t-0.681 or C1.468t =0.032 1.468
Weak-R LC50 = 0.854t-0.681 or C1.468t =0.793
Strong-R LC50 = 55.335t-0.681 or C1.468t =362.013
F1 (S X Weak-R) LC50 = 0.1368t-0.681 or C1.468t =0.0539
F1 (SX Strong-R) LC50 = 0.568t-0.681 or C1.468t =0.4358
F1 (Weak-R X Strong-R) LC50 = 4.456t-0.681 or C1.468t =8.967
R2 =0.993, F(6,17) = P <0.001
† the value of n estimated by inversing the time factor (=-0.681) and indicates the relative
contribution of concentration and exposure period to toxicity, where n <1, refers that exposure
period is an important variable than concentration.

ACC
EPTE
D M
ANU
SCR
IPT
ACCEPTED MANUSCRIPT
37
Graphical Abstract

ACC
EPTE
D M
ANU
SCR
IPT
ACCEPTED MANUSCRIPT
38
Research Highlights
Inheritance of weak (Weak-R) and strong (Strong-R) resistance phenotypes was investigated
A single major, incompletely recessive, autosomal gene confers weak resistance
Two major incompletely recessive, autosomal genes, one allelic with Weak-R gene, confer
Strong-R
Expression of F1 hybrids suggested presence of additional dominant factor at low frequency
Expression of Strong-R requires interaction of both weak and strong resistance genes