Genetic analyses of diverse populations improves discovery ...
14
LETTER https://doi.org/10.1038/s41586-019-1310-4 Genetic analyses of diverse populations improves discovery for complex traits Genevieve L. Wojcik 1,35 , Mariaelisa Graff 2,35 , Katherine K. Nishimura 3,35 , Ran Tao 4,5,35 , Jeffrey Haessler 3,35 , Christopher R. Gignoux 1,6,35 , Heather M. Highland 2,35 , Yesha M. Patel 7,35 , Elena P. Sorokin 1 , Christy L. Avery 2 , Gillian M. Belbin 8,9 , Stephanie A. Bien 3 , Iona Cheng 10 , Sinead Cullina 8,9 , Chani J. Hodonsky 2 , Yao Hu 3 , Laura M. Huckins 11 , Janina Jeff 8,9 , Anne E. Justice 2 , Jonathan M. Kocarnik 3 , Unhee Lim 12 , Bridget M. Lin 2 , Yingchang Lu 9 , Sarah C. Nelson 13 , Sung-Shim L. Park 7 , Hannah Poisner 8,9 , Michael H. Preuss 9 , Melissa A. Richard 14 , Claudia Schurmann 9,15,16 , Veronica W. Setiawan 7 , Alexandra Sockell 1 , Karan Vahi 17 , Marie Verbanck 9 , Abhishek Vishnu 9 , Ryan W. Walker 9 , Kristin L. Young 2 , Niha Zubair 3 , Victor Acuña-Alonso 18 , Jose Luis Ambite 17 , Kathleen C. Barnes 6 , Eric Boerwinkle 19 , Erwin P. Bottinger 9,15,16 , Carlos D. Bustamante 1 , Christian Caberto 12 , Samuel Canizales-Quinteros 20 , Matthew P. Conomos 13 , Ewa Deelman 17 , Ron Do 9,11 , Kimberly Doheny 21 , Lindsay Fernández-Rhodes 2,22 , Myriam Fornage 14 , Benyam Hailu 23 , Gerardo Heiss 2 , Brenna M. Henn 24 , Lucia A. Hindorff 25 , Rebecca D. Jackson 26 , Cecelia A. Laurie 13 , Cathy C. Laurie 13 , Yuqing Li 10,27 , Dan-Yu Lin 2 , Andres Moreno-Estrada 28 , Girish Nadkarni 9 , Paul J. Norman 6 , Loreall C. Pooler 7 , Alexander P. Reiner 13 , Jane Romm 21 , Chiara Sabatti 1 , Karla Sandoval 28 , Xin Sheng 7 , Eli A. Stahl 11 , Daniel O. Stram 7 , Timothy A. Thornton 13 , Christina L. Wassel 29 , Lynne R. Wilkens 12 , Cheryl A. Winkler 30 , Sachi Yoneyama 2 , Steven Buyske 31,36 , Christopher A. Haiman 32,36 , Charles Kooperberg 3,36 , Loic Le Marchand 12,36 , Ruth J. F. Loos 9,11,36 , Tara C. Matise 33,36 , Kari E. North 2,36 , Ulrike Peters 3,36 , Eimear E. Kenny 8,9,11,34,36 * & Christopher S. Carlson 3,36 * Genome-wide association studies (GWAS) have laid the foundation for investigations into the biology of complex traits, drug development and clinical guidelines. However, the majority of discovery efforts are based on data from populations of European ancestry 1–3 . In light of the differential genetic architecture that is known to exist between populations, bias in representation can exacerbate existing disease and healthcare disparities. Critical variants may be missed if they have a low frequency or are completely absent in European populations, especially as the field shifts its attention towards rare variants, which are more likely to be population-specific 4–10 . Additionally, effect sizes and their derived risk prediction scores derived in one population may not accurately extrapolate to other populations 11,12 . Here we demonstrate the value of diverse, multi-ethnic participants in large-scale genomic studies. The Population Architecture using Genomics and Epidemiology (PAGE) study conducted a GWAS of 26 clinical and behavioural phenotypes in 49,839 non-European individuals. Using strategies tailored for analysis of multi-ethnic and admixed populations, we describe a framework for analysing diverse populations, identify 27 novel loci and 38 secondary signals at known loci, as well as replicate 1,444 GWAS catalogue associations across these traits. Our data show evidence of effect-size heterogeneity across ancestries for published GWAS associations, substantial benefits for fine-mapping using diverse cohorts and insights into clinical implications. In the United States—where minority populations have a disproportionately higher burden of chronic conditions 13 — the lack of representation of diverse populations in genetic research will result in inequitable access to precision medicine for those with the highest burden of disease. We strongly advocate for continued, large genome-wide efforts in diverse populations to maximize genetic discovery and reduce health disparities. The PAGE study was developed by the National Human Genome Research Institute and the National Institute on Minority Health and Health Disparities to conduct genetic epidemiological research in ancestrally diverse populations within the United States. The study is drawn from three existing major population-based cohorts (Hispanic Community Health Study/Study of Latinos (HCHS/SOL), Women’s Health Initiative (WHI) and Multiethnic Cohort (MEC)) and the Icahn School of Medicine at Mount Sinai BioMe biobank in New York City (BioMe). Genotyped individuals self-identified as Hispanic/Latino (n = 22,216), African American (n = 17,299), Asian (n = 4,680), Native Hawaiian (n = 3,940), Native American (n = 652) or Other (n = 1,052) (Supplementary Table 1 and Supplementary Information 1). These 49,839 individuals were genotyped on the Multi-Ethnic Genotyping Array (MEGA), which we developed to equitably capture global genetic variation 14 (Supplementary Fig. 1 and Supplementary Information 3). Given that PAGE participants reside on a continuum of genetic ancestry, rather than discrete population 1 Department of Biomedical Data Science, Stanford University, Stanford, CA, USA. 2 Department of Epidemiology, University of North Carolina at Chapel Hill, Chapel Hill, NC, USA. 3 Division of Public Health Science, Fred Hutchinson Cancer Research Center, Seattle, WA, USA. 4 Department of Biostatistics, Vanderbilt University Medical Center, Nashville, TN, USA. 5 Vanderbilt Genetics Institute, Vanderbilt University Medical Center, Nashville, TN, USA. 6 Colorado Center for Personalized Medicine, University of Colorado Anschutz Medical Campus, Aurora, CO, USA. 7 Department of Preventive Medicine, Keck School of Medicine, University of Southern California, Los Angeles, CA, USA. 8 The Center for Genomic Health, Icahn School of Medicine at Mount Sinai, New York, NY, USA. 9 The Charles Bronfman Institute of Personalized Medicine, Icahn School of Medicine at Mount Sinai, New York, NY, USA. 10 Department of Epidemiology and Biostatistics, University of California San Francisco, San Francisco, CA, USA. 11 Pamela Sklar Division of Psychiatric Genomics, Icahn School of Medicine at Mount Sinai, New York, NY, USA. 12 Epidemiology Program, University of Hawaii Cancer Center, Honolulu, HI, USA. 13 Department of Biostatistics, University of Washington, Seattle, WA, USA. 14 Brown Foundation Institute for Molecular Medicine, The University of Texas Health Science Center, Houston, TX, USA. 15 Hasso-Plattner-Institute for Digital Engineering, Digital Health Center, Potsdam, Germany. 16 Hasso-Plattner-Institute for Digital Health at Mount Sinai, Icahn School of Medicine at Mount Sinai, New York, NY, USA. 17 Information Sciences Institute, University of Southern California, Marina del Rey, CA, USA. 18 Escuela Nacional de Antropologia e Historia, Mexico City, Mexico. 19 Human Genetics Center, School of Public Health, The University of Texas Health Science Center, Houston, TX, USA. 20 Instituto Nacional de Medicina Genómica, Mexico City, Mexico. 21 Center for Inherited Disease Research, Johns Hopkins University, Baltimore, MD, USA. 22 Department of Biobehavioral Health, The Pennsylvania State University, University Park, PA, USA. 23 NIH National Institute on Minority Health and Health Disparities, Bethesda, MD, USA. 24 Department of Anthropology, University of California Davis, Davis, CA, USA. 25 NIH National Human Genome Research Institute, Bethesda, MD, USA. 26 Center for Clinical and Translational Science, Ohio State Medical Center, Columbus, OH, USA. 27 Cancer Prevention Institute of California, Fremont, CA, USA. 28 National Laboratory of Genomics for Biodiversity (UGA-LANGEBIO), Irapuato, Mexico. 29 College of Medicine, University of Vermont, Burlington, VT, USA. 30 Basic Science Program, Frederick National Laboratory, Frederick, MD, USA. 31 Department of Statistics, Rutgers University, New Brunswick, NJ, USA. 32 Center for Genetic Epidemiology, Keck School of Medicine, University of Southern California, Los Angeles, CA, USA. 33 Department of Genetics, Rutgers University, New Brunswick, NJ, USA. 34 Department of Medicine, Icahn School of Medicine at Mount Sinai, New York, NY, USA. 35 These authors contributed equally: Genevieve L. Wojcik, Mariaelisa Graff, Katherine K. Nishimura, Ran Tao, Jeffrey Haessler, Christopher R. Gignoux, Heather M. Highland, Yesha M. Patel. 36 These authors jointly supervised this work: Steven Buyske, Christopher A. Haiman, Charles Kooperberg, Loic Le Marchand, Ruth J. F. Loos, Tara C. Matise, Kari E. North, Ulrike Peters, Eimear E. Kenny, Christopher S. Carlson. *e-mail: [email protected]; [email protected] N AT U R E | www.nature.com/nature
Transcript of Genetic analyses of diverse populations improves discovery ...

Letterhttps://doi.org/10.1038/s41586-019-1310-4
Genetic analyses of diverse populations improves discovery for complex traitsGenevieve L. Wojcik1,35, Mariaelisa Graff2,35, Katherine K. Nishimura3,35, ran tao4,5,35, Jeffrey Haessler3,35, Christopher r. Gignoux1,6,35, Heather M. Highland2,35, Yesha M. Patel7,35, elena P. Sorokin1, Christy L. Avery2, Gillian M. Belbin8,9, Stephanie A. Bien3, Iona Cheng10, Sinead Cullina8,9, Chani J. Hodonsky2, Yao Hu3, Laura M. Huckins11, Janina Jeff8,9, Anne e. Justice2, Jonathan M. Kocarnik3, Unhee Lim12, Bridget M. Lin2, Yingchang Lu9, Sarah C. Nelson13, Sung-Shim L. Park7, Hannah Poisner8,9, Michael H. Preuss9, Melissa A. richard14, Claudia Schurmann9,15,16, Veronica W. Setiawan7, Alexandra Sockell1, Karan Vahi17, Marie Verbanck9, Abhishek Vishnu9, ryan W. Walker9, Kristin L. Young2, Niha Zubair3, Victor Acuña-Alonso18, Jose Luis Ambite17, Kathleen C. Barnes6, eric Boerwinkle19, erwin P. Bottinger9,15,16, Carlos D. Bustamante1, Christian Caberto12, Samuel Canizales-Quinteros20, Matthew P. Conomos13, ewa Deelman17, ron Do9,11, Kimberly Doheny21, Lindsay Fernández-rhodes2,22, Myriam Fornage14, Benyam Hailu23, Gerardo Heiss2, Brenna M. Henn24, Lucia A. Hindorff25, rebecca D. Jackson26, Cecelia A. Laurie13, Cathy C. Laurie13, Yuqing Li10,27, Dan-Yu Lin2, Andres Moreno-estrada28, Girish Nadkarni9, Paul J. Norman6, Loreall C. Pooler7, Alexander P. reiner13, Jane romm21, Chiara Sabatti1, Karla Sandoval28, Xin Sheng7, eli A. Stahl11, Daniel O. Stram7, timothy A. thornton13, Christina L. Wassel29, Lynne r. Wilkens12, Cheryl A. Winkler30, Sachi Yoneyama2, Steven Buyske31,36, Christopher A. Haiman32,36, Charles Kooperberg3,36, Loic Le Marchand12,36, ruth J. F. Loos9,11,36, tara C. Matise33,36, Kari e. North2,36, Ulrike Peters3,36, eimear e. Kenny8,9,11,34,36* & Christopher S. Carlson3,36*
Genome-wide association studies (GWAS) have laid the foundation for investigations into the biology of complex traits, drug development and clinical guidelines. However, the majority of discovery efforts are based on data from populations of European ancestry1–3. In light of the differential genetic architecture that is known to exist between populations, bias in representation can exacerbate existing disease and healthcare disparities. Critical variants may be missed if they have a low frequency or are completely absent in European populations, especially as the field shifts its attention towards rare variants, which are more likely to be population-specific4–10. Additionally, effect sizes and their derived risk prediction scores derived in one population may not accurately extrapolate to other populations11,12. Here we demonstrate the value of diverse, multi-ethnic participants in large-scale genomic studies. The Population Architecture using Genomics and Epidemiology (PAGE) study conducted a GWAS of 26 clinical and behavioural phenotypes in 49,839 non-European individuals. Using strategies tailored for analysis of multi-ethnic and admixed populations, we describe a framework for analysing diverse populations, identify 27 novel loci and 38 secondary signals at known loci, as well as replicate 1,444 GWAS catalogue associations across these traits. Our data show evidence of effect-size heterogeneity across ancestries for published GWAS associations, substantial benefits for fine-mapping using diverse cohorts and insights into clinical
implications. In the United States—where minority populations have a disproportionately higher burden of chronic conditions13—the lack of representation of diverse populations in genetic research will result in inequitable access to precision medicine for those with the highest burden of disease. We strongly advocate for continued, large genome-wide efforts in diverse populations to maximize genetic discovery and reduce health disparities.
The PAGE study was developed by the National Human Genome Research Institute and the National Institute on Minority Health and Health Disparities to conduct genetic epidemiological research in ancestrally diverse populations within the United States. The study is drawn from three existing major population-based cohorts (Hispanic Community Health Study/Study of Latinos (HCHS/SOL), Women’s Health Initiative (WHI) and Multiethnic Cohort (MEC)) and the Icahn School of Medicine at Mount Sinai BioMe biobank in New York City (BioMe). Genotyped individuals self-identified as Hispanic/Latino (n = 22,216), African American (n = 17,299), Asian (n = 4,680), Native Hawaiian (n = 3,940), Native American (n = 652) or Other (n = 1,052) (Supplementary Table 1 and Supplementary Information 1). These 49,839 individuals were genotyped on the Multi-Ethnic Genotyping Array (MEGA), which we developed to equitably capture global genetic variation14 (Supplementary Fig. 1 and Supplementary Information 3). Given that PAGE participants reside on a continuum of genetic ancestry, rather than discrete population
1Department of Biomedical Data Science, Stanford University, Stanford, CA, USA. 2Department of Epidemiology, University of North Carolina at Chapel Hill, Chapel Hill, NC, USA. 3Division of Public Health Science, Fred Hutchinson Cancer Research Center, Seattle, WA, USA. 4Department of Biostatistics, Vanderbilt University Medical Center, Nashville, TN, USA. 5Vanderbilt Genetics Institute, Vanderbilt University Medical Center, Nashville, TN, USA. 6Colorado Center for Personalized Medicine, University of Colorado Anschutz Medical Campus, Aurora, CO, USA. 7Department of Preventive Medicine, Keck School of Medicine, University of Southern California, Los Angeles, CA, USA. 8The Center for Genomic Health, Icahn School of Medicine at Mount Sinai, New York, NY, USA. 9The Charles Bronfman Institute of Personalized Medicine, Icahn School of Medicine at Mount Sinai, New York, NY, USA. 10Department of Epidemiology and Biostatistics, University of California San Francisco, San Francisco, CA, USA. 11Pamela Sklar Division of Psychiatric Genomics, Icahn School of Medicine at Mount Sinai, New York, NY, USA. 12Epidemiology Program, University of Hawaii Cancer Center, Honolulu, HI, USA. 13Department of Biostatistics, University of Washington, Seattle, WA, USA. 14Brown Foundation Institute for Molecular Medicine, The University of Texas Health Science Center, Houston, TX, USA. 15Hasso-Plattner-Institute for Digital Engineering, Digital Health Center, Potsdam, Germany. 16Hasso-Plattner-Institute for Digital Health at Mount Sinai, Icahn School of Medicine at Mount Sinai, New York, NY, USA. 17Information Sciences Institute, University of Southern California, Marina del Rey, CA, USA. 18Escuela Nacional de Antropologia e Historia, Mexico City, Mexico. 19Human Genetics Center, School of Public Health, The University of Texas Health Science Center, Houston, TX, USA. 20Instituto Nacional de Medicina Genómica, Mexico City, Mexico. 21Center for Inherited Disease Research, Johns Hopkins University, Baltimore, MD, USA. 22Department of Biobehavioral Health, The Pennsylvania State University, University Park, PA, USA. 23NIH National Institute on Minority Health and Health Disparities, Bethesda, MD, USA. 24Department of Anthropology, University of California Davis, Davis, CA, USA. 25NIH National Human Genome Research Institute, Bethesda, MD, USA. 26Center for Clinical and Translational Science, Ohio State Medical Center, Columbus, OH, USA. 27Cancer Prevention Institute of California, Fremont, CA, USA. 28National Laboratory of Genomics for Biodiversity (UGA-LANGEBIO), Irapuato, Mexico. 29College of Medicine, University of Vermont, Burlington, VT, USA. 30Basic Science Program, Frederick National Laboratory, Frederick, MD, USA. 31Department of Statistics, Rutgers University, New Brunswick, NJ, USA. 32Center for Genetic Epidemiology, Keck School of Medicine, University of Southern California, Los Angeles, CA, USA. 33Department of Genetics, Rutgers University, New Brunswick, NJ, USA. 34Department of Medicine, Icahn School of Medicine at Mount Sinai, New York, NY, USA. 35These authors contributed equally: Genevieve L. Wojcik, Mariaelisa Graff, Katherine K. Nishimura, Ran Tao, Jeffrey Haessler, Christopher R. Gignoux, Heather M. Highland, Yesha M. Patel. 36These authors jointly supervised this work: Steven Buyske, Christopher A. Haiman, Charles Kooperberg, Loic Le Marchand, Ruth J. F. Loos, Tara C. Matise, Kari E. North, Ulrike Peters, Eimear E. Kenny, Christopher S. Carlson. *e-mail: [email protected]; [email protected]
N A t U r e | www.nature.com/nature
LetterreSeArCH
groups15 (Fig. 1a and Supplementary Fig. 2), a joint analysis was optimally powered and the most parsimonious way to allow for heterogeneous variance across populations16. We then performed genome-wide association analyses on 26 traits harmonized across the four studies, adjusted for the top 10 principal components (PCs), indicators for study and self-identified race/ethnicity, as well as trait- specific covariates. We used extensions of previously developed analyt-ical tools (SUGEN and GENESIS), which explicitly model population structure, relatedness between individuals and population-specific genetic heterogeneity16–20. For comparison against standard multi- ethnic approaches and to assess heterogeneity by ancestry, we also conducted analyses stratified by self-identified race/ethnicity and
combined these analyses in a meta-analysis (Supplementary Table 3). We demonstrate that the joint analysis increased power for discovery compared to the meta-analysis approach, but that it did not increase the incidence of type-1 error (Supplementary Information 5; the pipeline for the analysis of diverse populations in genomic research is outlined in the Methods).
Given that genetic architecture and/or causal variants may differ between populations, we hypothesized that the examination of under-represented populations would reveal novel ancestry-specific associa-tions. Using minor allele frequency (MAF)-specific P-value thresholds21 (P < 5 × 10⁻⁸ for MAF > 5%; P < 3 × 10⁻⁹ for MAF < 5%), we identified 16 novel genome-wide significant trait–variant associations and
0
0.25
0.50
0.75
1.00
0 0.25 0.50 0.75 1.00
a bAfrican American
Hispanic/Latino
AsianNative HawaiianNative American
1 2 3 4 5 6 7 8 9 10 11 12 13 14 15 16 17 18 19 20 21 22 X
Category
Known
Replicated
Secondary
Novel
BMIHeight
WHRWHR (female)
WHR (male)Diastolic blood pressureSystolic blood pressure
HypertensionPR interval
QRS intervalQT interval
Fasting glucoseFasting insulin
HbA1cType 2 diabetes
C-reactive proteinMCHC
Platelet countWhite blood cell count
Chronic kidney diseaseEnd-stage renal disease
eGFRCigarettes per day
Coffee consumptionHDLLDL
TriglyceridesTotal cholesterol
Chromosome
0
0.25
0.50
0.75
1.00
0 0.25 0.50 0.75 1.00
PC
2
PC1
0
0.25
0.50
0.75
1.00
0 0.25 0.50 0.75 1.00
0
0.25
0.50
0.75
1.00
0 0.25 0.50 0.75 1.000 0.25 0.50 0.75 1.00
0
0.25
0.50
0.75
1.00
0
0.25
0.50
0.75
1.00
0 0.25 0.50 0.75 1.00
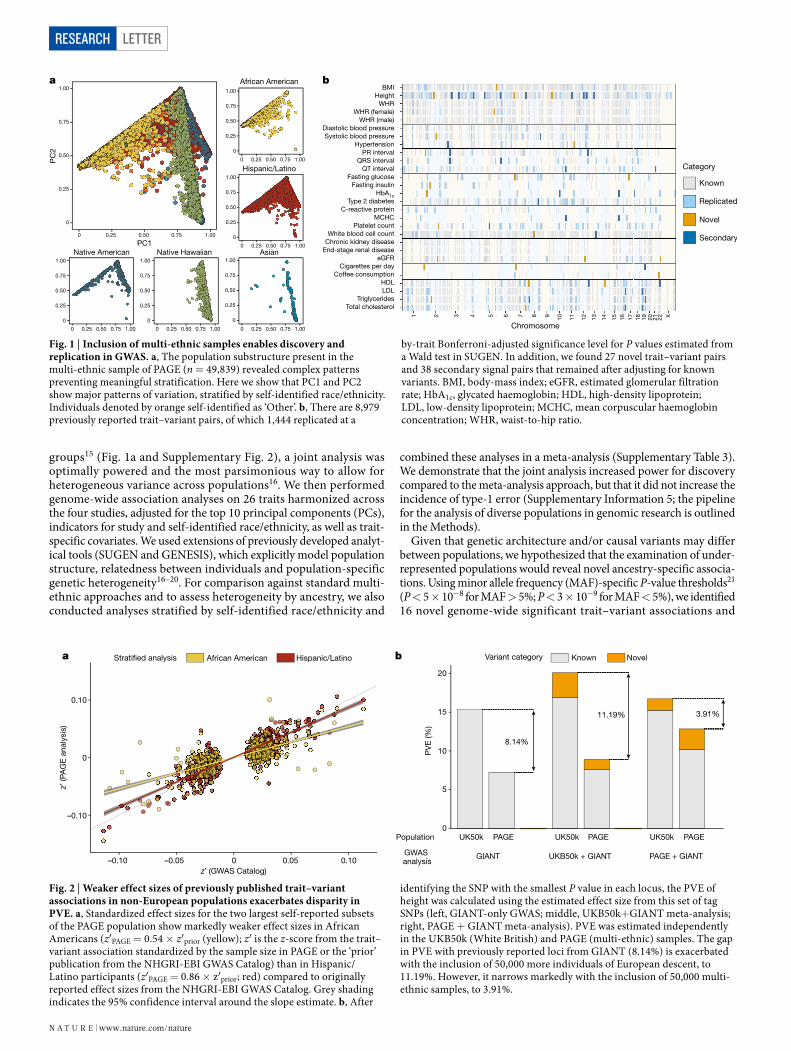
Fig. 1 | Inclusion of multi-ethnic samples enables discovery and replication in GWAS. a, The population substructure present in the multi-ethnic sample of PAGE (n = 49,839) revealed complex patterns preventing meaningful stratification. Here we show that PC1 and PC2 show major patterns of variation, stratified by self-identified race/ethnicity. Individuals denoted by orange self-identified as ‘Other’. b, There are 8,979 previously reported trait–variant pairs, of which 1,444 replicated at a
by-trait Bonferroni-adjusted significance level for P values estimated from a Wald test in SUGEN. In addition, we found 27 novel trait–variant pairs and 38 secondary signal pairs that remained after adjusting for known variants. BMI, body-mass index; eGFR, estimated glomerular filtration rate; HbA1c, glycated haemoglobin; HDL, high-density lipoprotein; LDL, low-density lipoprotein; MCHC, mean corpuscular haemoglobin concentration; WHR, waist-to-hip ratio.
PV
E (%
)
0
5
10
15
20
8.14%
11.19% 3.91%
Population
GWAS analysis
UK50k PAGE UK50k UK50kPAGE PAGE
GIANT UKB50k + GIANT PAGE + GIANT
Known NovelVariant categoryAfrican American Hispanic/LatinoStrati�ed analysis
z′ (GWAS Catalog)
z′ (P
AG
E a
naly
sis)
0 0.05 0.10–0.05–0.10
0
0.10
a b
–0.10
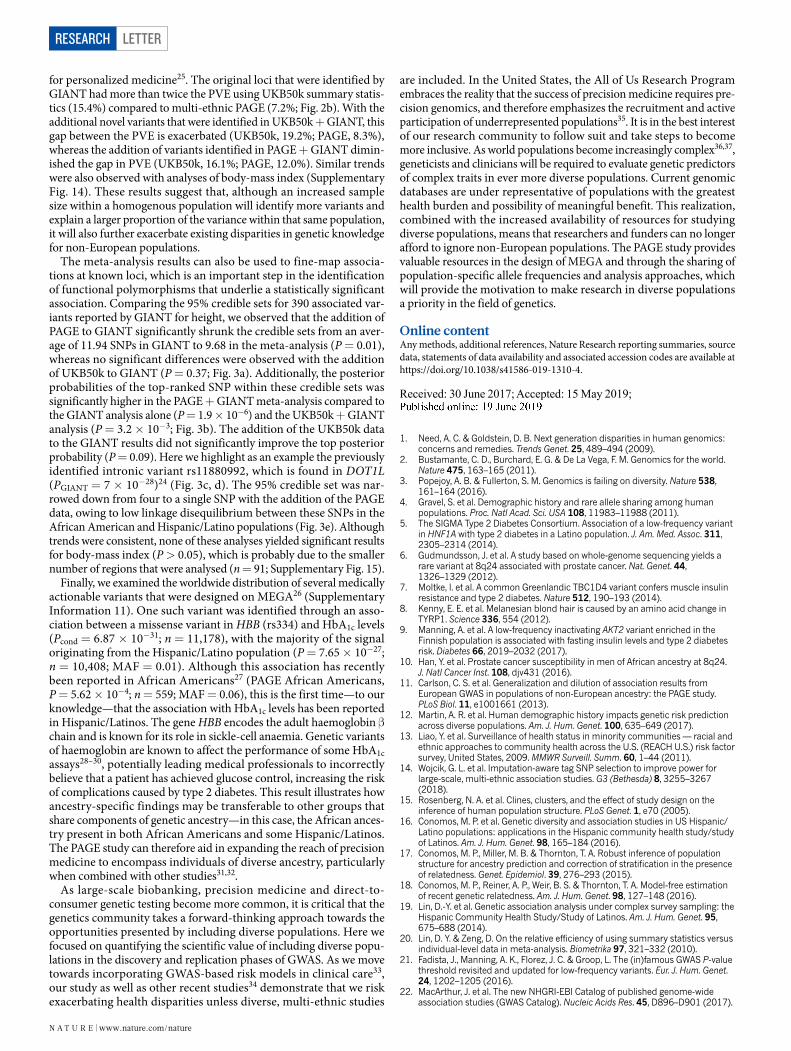
Fig. 2 | Weaker effect sizes of previously published trait–variant associations in non-European populations exacerbates disparity in PVE. a, Standardized effect sizes for the two largest self-reported subsets of the PAGE population show markedly weaker effect sizes in African Americans (z′PAGE = 0.54 × z′prior (yellow); z′ is the z-score from the trait–variant association standardized by the sample size in PAGE or the ‘prior’ publication from the NHGRI-EBI GWAS Catalog) than in Hispanic/Latino participants (z′PAGE = 0.86 × z′prior; red) compared to originally reported effect sizes from the NHGRI-EBI GWAS Catalog. Grey shading indicates the 95% confidence interval around the slope estimate. b, After
identifying the SNP with the smallest P value in each locus, the PVE of height was calculated using the estimated effect size from this set of tag SNPs (left, GIANT-only GWAS; middle, UKB50k+GIANT meta-analysis; right, PAGE + GIANT meta-analysis). PVE was estimated independently in the UKB50k (White British) and PAGE (multi-ethnic) samples. The gap in PVE with previously reported loci from GIANT (8.14%) is exacerbated with the inclusion of 50,000 more individuals of European descent, to 11.19%. However, it narrows markedly with the inclusion of 50,000 multi-ethnic samples, to 3.91%.
N A t U r e | www.nature.com/nature

Letter reSeArCH
11 low-frequency loci with suggestive associations (P < 5 × 10⁻⁸; Fig. 1b, Extended Data Table 1, Supplementary Tables 2, 3 and Supplementary Information 8). In regions that have been previously identified in the NHGRI-EBI GWAS Catalog22, we identified 32 signif-icant trait–variant associations after conditioning on all trait-specific known variants in an ‘adjusted’ model, as well as 6 suggestive associ-ations that had a low frequency or were rare variants (Pcond between 3 × 10⁻⁹ and 5 × 10⁻⁸), further enriching our understanding of the genetic architecture of traits (Supplementary Table 3).
To tease apart the influence of specific ancestral components on the 27 novel and 38 secondary loci, we calculated the correlation between the risk allele genotype and each of the first 10 PCs (Extended Data Fig. 2). These correlations reveal a population structure that underlies many of our identified trait–variant associations, in which there are population differences in the frequencies of risk alleles. Notably, a novel single-nucleotide polymorphism (SNP) (rs182996728) was identified to be associated with the number of cigarettes smoked per day among smokers (P = 3.1 × 10⁻⁸) as well as with PC4, which represents the gradient of Native Hawaiian/Pacific Islander ancestry. Although the risk variant is absent or rare in most populations, it was found at a fre-quency of 17.2% in Native Hawaiian participants, in whom the signal was the strongest (Pstratified = 2.28 × 10⁻⁶). Our findings show that some trait-associated variants exhibit differential frequencies across populations, further illustrating a need for the inclusion of diverse groups.
In addition to identifying novel and secondary trait–variant asso-ciations, we also replicate a portion of the published GWAS literature (which is predominantly based on populations of European ancestry; Extended Data Fig. 1) for our 26 phenotypes from the GWAS Catalog22. Of 8,979 known variant–trait combinations, 1,444 replicated at the P < 0.05 significance threshold, after Bonferroni correction by trait. Of those meeting the genome-wide significance threshold (P < 5 × 10⁻⁸),
we replicate 574 variant–trait associations in 261 distinct regions, of which 132 had significant evidence of effect heterogeneity by genetic ancestry (SNP × PC, P < 8.71 × 10⁻⁵), which is likely to be a conservative estimate given the limitations of statistical power. We fur-ther tested for effect heterogeneity by genetic ancestry by comparing the standardized effect sizes of PAGE analyses (joint and stratified) to available effect sizes from the GWAS Catalog. We observed effect sizes of the PAGE joint analyses to be significantly weaker than previous reports with a slope of 0.77 (95% confidence interval = 0.75–0.81). When stratified by self-identified race/ethnicity, the effect sizes for the Hispanic/Latino population remained significantly attenuated com-pared to the previously reported effect sizes (β = 0.86; 95% confidence interval = 0.83–0.90; Fig. 2a). Effect sizes for the African American population were even further diminished at nearly half the strength (β = 0.54; 95% confidence interval = 0.50–0.58; Fig. 2a). This is sug-gestive of truly differential effect sizes between ancestries at previously reported variants, rather than these effect sizes being upwardly biased in general (that is, exhibiting ‘winner’s curse’), which should affect all groups equally.
To quantify the added value of including multi-ethnic populations in GWAS, we used published data from GIANT (a study of more than 250,000 individuals of European descent for anthropometric traits23,24), for a meta-analysis with either PAGE (around 50,000 multi-ethnic indi-viduals) or 50,000 randomly sampled White British participants from the UK Biobank (UKB50k). Stratified GWAS of height in PAGE and UKB50k were each combined in separate meta-analyses with GIANT using a fixed-effect model. When comparing these meta-analyses to the original GIANT analysis; both meta-analyses resulted in novel findings (PAGE + GIANT, 82 loci; UKB50k + GIANT, 107 loci; Extended Data Table 2). Although the number of novel loci is indicative of new insights into trait biology, understanding the proportion of phenotypic variance explained (PVE) by each locus has potentially important consequences
1.00
2.10 2.15 2.20 2.25Position (Mb)
Pos
terio
r p
rob
abili
ty
1
5
10
25
50
100
200
Cre
dib
le s
et s
ize
0
0.25
0.50
0.75
1.00
0 0.25 0.50 0.75 1.00
Top posterior probability (GIANT)
Top
pos
terio
r p
rob
abili
ty (m
eta-
anal
ysis
)
European African American Hispanic/Latino
0 0.25 0.50 0.75 1.00 r2
UKB50k + GIANT GIANT PAGE + GIANT
a
b
c
d
e
UKB50k + GIANT PAGE + GIANT
rs12976923
rs11880992
rs12982744
rs12980348
rs12976923
rs11880992
rs12982744
rs12980348
rs12976923
rs11880992
rs12982744
rs12980348
PAGE + GIANT UKB50k + GIANT
NS P = 0.01
2.10 2.15 2.20 2.25Position (Mb)
0
10
20
30
40
2.10 2.15 2.20 2.25Position (Mb)
–log
10(P
)
0
10
20
30
40
–log
10(P
)
AP3D1 DOT1L AP3D1 DOT1L
0
0.25
0.50
0.75
0
0.25
0.50
0.75
1.00
2.10 2.15 2.20 2.25Position (Mb)
Pos
terio
r p
rob
abili
ty
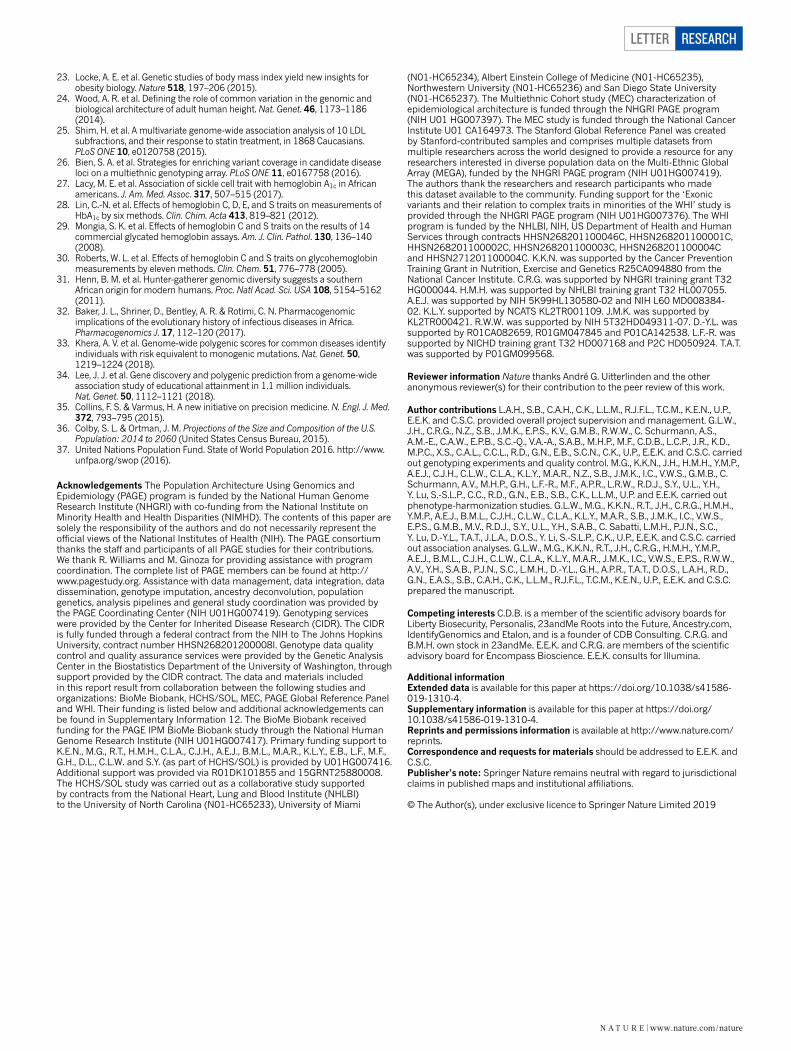
Fig. 3 | Fine-mapping with multi-ethnic PAGE versus homogeneous UK Biobank samples for height. a, Comparison of 95% credible sets for height, comparing GIANT alone (n = 253,288) to UKB50k + GIANT (n = 303,288; paired-sample t-test P = 0.37) and PAGE + GIANT (n = 303,069; paired-sample t-test P = 0.01). Box plots show the median as the line in the notch, with the top and bottom of the box indicating the interquartile range. Whiskers extend to either the minimum value or 1.5× the interquartile range. Notches indicate the 95% confidence interval of the medians. b, Top posterior probability from each 95% credible
set for height, comparing GIANT (n = 253,288) to UKB50k + GIANT (n = 303,288) and PAGE + GIANT (n = 303,069). c, Example of results for a height locus from GWAS (rs11880992) in UKB50k + GIANT (n = 303,288) and PAGE + GIANT (n = 303,069), with linkage disequilibrium from weighted matrix from meta-analysis. d, Posterior probabilities for this signal with credible set in indicated by the diamond shapes. e, Linkage disequilibrium (r2) for the original 95% credible set from GIANT results stratified by populations. The index association SNP (rs11880992) with the highest posterior probability is denoted in bold.
N A t U r e | www.nature.com/nature
LetterreSeArCH
for personalized medicine25. The original loci that were identified by GIANT had more than twice the PVE using UKB50k summary statis-tics (15.4%) compared to multi-ethnic PAGE (7.2%; Fig. 2b). With the additional novel variants that were identified in UKB50k + GIANT, this gap between the PVE is exacerbated (UKB50k, 19.2%; PAGE, 8.3%), whereas the addition of variants identified in PAGE + GIANT dimin-ished the gap in PVE (UKB50k, 16.1%; PAGE, 12.0%). Similar trends were also observed with analyses of body-mass index (Supplementary Fig. 14). These results suggest that, although an increased sample size within a homogenous population will identify more variants and explain a larger proportion of the variance within that same population, it will also further exacerbate existing disparities in genetic knowledge for non-European populations.
The meta-analysis results can also be used to fine-map associa-tions at known loci, which is an important step in the identification of functional polymorphisms that underlie a statistically significant association. Comparing the 95% credible sets for 390 associated var-iants reported by GIANT for height, we observed that the addition of PAGE to GIANT significantly shrunk the credible sets from an aver-age of 11.94 SNPs in GIANT to 9.68 in the meta-analysis (P = 0.01), whereas no significant differences were observed with the addition of UKB50k to GIANT (P = 0.37; Fig. 3a). Additionally, the posterior probabilities of the top-ranked SNP within these credible sets was significantly higher in the PAGE + GIANT meta-analysis compared to the GIANT analysis alone (P = 1.9 × 10⁻⁶) and the UKB50k + GIANT analysis (P = 3.2 × 10⁻³; Fig. 3b). The addition of the UKB50k data to the GIANT results did not significantly improve the top posterior probability (P = 0.09). Here we highlight as an example the previously identified intronic variant rs11880992, which is found in DOT1L (PGIANT = 7 × 10⁻²⁸)24 (Fig. 3c, d). The 95% credible set was nar-rowed down from four to a single SNP with the addition of the PAGE data, owing to low linkage disequilibrium between these SNPs in the African American and Hispanic/Latino populations (Fig. 3e). Although trends were consistent, none of these analyses yielded significant results for body-mass index (P > 0.05), which is probably due to the smaller number of regions that were analysed (n = 91; Supplementary Fig. 15).
Finally, we examined the worldwide distribution of several medically actionable variants that were designed on MEGA26 (Supplementary Information 11). One such variant was identified through an asso-ciation between a missense variant in HBB (rs334) and HbA1c levels (Pcond = 6.87 × 10⁻³¹; n = 11,178), with the majority of the signal originating from the Hispanic/Latino population (P = 7.65 × 10⁻²⁷; n = 10,408; MAF = 0.01). Although this association has recently been reported in African Americans27 (PAGE African Americans, P = 5.62 × 10⁻⁴; n = 559; MAF = 0.06), this is the first time—to our knowledge—that the association with HbA1c levels has been reported in Hispanic/Latinos. The gene HBB encodes the adult haemoglobin β chain and is known for its role in sickle-cell anaemia. Genetic variants of haemoglobin are known to affect the performance of some HbA1c assays28–30, potentially leading medical professionals to incorrectly believe that a patient has achieved glucose control, increasing the risk of complications caused by type 2 diabetes. This result illustrates how ancestry-specific findings may be transferable to other groups that share components of genetic ancestry—in this case, the African ances-try present in both African Americans and some Hispanic/Latinos. The PAGE study can therefore aid in expanding the reach of precision medicine to encompass individuals of diverse ancestry, particularly when combined with other studies31,32.
As large-scale biobanking, precision medicine and direct-to- consumer genetic testing become more common, it is critical that the genetics community takes a forward-thinking approach towards the opportunities presented by including diverse populations. Here we focused on quantifying the scientific value of including diverse popu-lations in the discovery and replication phases of GWAS. As we move towards incorporating GWAS-based risk models in clinical care33, our study as well as other recent studies34 demonstrate that we risk exacerbating health disparities unless diverse, multi-ethnic studies
are included. In the United States, the All of Us Research Program embraces the reality that the success of precision medicine requires pre-cision genomics, and therefore emphasizes the recruitment and active participation of underrepresented populations35. It is in the best interest of our research community to follow suit and take steps to become more inclusive. As world populations become increasingly complex36,37, geneticists and clinicians will be required to evaluate genetic predictors of complex traits in ever more diverse populations. Current genomic databases are under representative of populations with the greatest health burden and possibility of meaningful benefit. This realization, combined with the increased availability of resources for studying diverse populations, means that researchers and funders can no longer afford to ignore non-European populations. The PAGE study provides valuable resources in the design of MEGA and through the sharing of population-specific allele frequencies and analysis approaches, which will provide the motivation to make research in diverse populations a priority in the field of genetics.
Online contentAny methods, additional references, Nature Research reporting summaries, source data, statements of data availability and associated accession codes are available at https://doi.org/10.1038/s41586-019-1310-4.
Received: 30 June 2017; Accepted: 15 May 2019; Published online xx xx xxxx.
1. Need, A. C. & Goldstein, D. B. Next generation disparities in human genomics: concerns and remedies. Trends Genet. 25, 489–494 (2009).
2. Bustamante, C. D., Burchard, E. G. & De La Vega, F. M. Genomics for the world. Nature 475, 163–165 (2011).
3. Popejoy, A. B. & Fullerton, S. M. Genomics is failing on diversity. Nature 538, 161–164 (2016).
4. Gravel, S. et al. Demographic history and rare allele sharing among human populations. Proc. Natl Acad. Sci. USA 108, 11983–11988 (2011).
5. The SIGMA Type 2 Diabetes Consortium. Association of a low-frequency variant in HNF1A with type 2 diabetes in a Latino population. J. Am. Med. Assoc. 311, 2305–2314 (2014).
6. Gudmundsson, J. et al. A study based on whole-genome sequencing yields a rare variant at 8q24 associated with prostate cancer. Nat. Genet. 44, 1326–1329 (2012).
7. Moltke, I. et al. A common Greenlandic TBC1D4 variant confers muscle insulin resistance and type 2 diabetes. Nature 512, 190–193 (2014).
8. Kenny, E. E. et al. Melanesian blond hair is caused by an amino acid change in TYRP1. Science 336, 554 (2012).
9. Manning, A. et al. A low-frequency inactivating AKT2 variant enriched in the Finnish population is associated with fasting insulin levels and type 2 diabetes risk. Diabetes 66, 2019–2032 (2017).
10. Han, Y. et al. Prostate cancer susceptibility in men of African ancestry at 8q24. J. Natl Cancer Inst. 108, djv431 (2016).
11. Carlson, C. S. et al. Generalization and dilution of association results from European GWAS in populations of non-European ancestry: the PAGE study. PLoS Biol. 11, e1001661 (2013).
12. Martin, A. R. et al. Human demographic history impacts genetic risk prediction across diverse populations. Am. J. Hum. Genet. 100, 635–649 (2017).
13. Liao, Y. et al. Surveillance of health status in minority communities — racial and ethnic approaches to community health across the U.S. (REACH U.S.) risk factor survey, United States, 2009. MMWR Surveill. Summ. 60, 1–44 (2011).
14. Wojcik, G. L. et al. Imputation-aware tag SNP selection to improve power for large-scale, multi-ethnic association studies. G3 (Bethesda) 8, 3255–3267 (2018).
15. Rosenberg, N. A. et al. Clines, clusters, and the effect of study design on the inference of human population structure. PLoS Genet. 1, e70 (2005).
16. Conomos, M. P. et al. Genetic diversity and association studies in US Hispanic/Latino populations: applications in the Hispanic community health study/study of Latinos. Am. J. Hum. Genet. 98, 165–184 (2016).
17. Conomos, M. P., Miller, M. B. & Thornton, T. A. Robust inference of population structure for ancestry prediction and correction of stratification in the presence of relatedness. Genet. Epidemiol. 39, 276–293 (2015).
18. Conomos, M. P., Reiner, A. P., Weir, B. S. & Thornton, T. A. Model-free estimation of recent genetic relatedness. Am. J. Hum. Genet. 98, 127–148 (2016).
19. Lin, D.-Y. et al. Genetic association analysis under complex survey sampling: the Hispanic Community Health Study/Study of Latinos. Am. J. Hum. Genet. 95, 675–688 (2014).
20. Lin, D. Y. & Zeng, D. On the relative efficiency of using summary statistics versus individual-level data in meta-analysis. Biometrika 97, 321–332 (2010).
21. Fadista, J., Manning, A. K., Florez, J. C. & Groop, L. The (in)famous GWAS P-value threshold revisited and updated for low-frequency variants. Eur. J. Hum. Genet. 24, 1202–1205 (2016).
22. MacArthur, J. et al. The new NHGRI-EBI Catalog of published genome-wide association studies (GWAS Catalog). Nucleic Acids Res. 45, D896–D901 (2017).
N A t U r e | www.nature.com/nature
Letter reSeArCH
23. Locke, A. E. et al. Genetic studies of body mass index yield new insights for obesity biology. Nature 518, 197–206 (2015).
24. Wood, A. R. et al. Defining the role of common variation in the genomic and biological architecture of adult human height. Nat. Genet. 46, 1173–1186 (2014).
25. Shim, H. et al. A multivariate genome-wide association analysis of 10 LDL subfractions, and their response to statin treatment, in 1868 Caucasians. PLoS ONE 10, e0120758 (2015).
26. Bien, S. A. et al. Strategies for enriching variant coverage in candidate disease loci on a multiethnic genotyping array. PLoS ONE 11, e0167758 (2016).
27. Lacy, M. E. et al. Association of sickle cell trait with hemoglobin A1c in African americans. J. Am. Med. Assoc. 317, 507–515 (2017).
28. Lin, C.-N. et al. Effects of hemoglobin C, D, E, and S traits on measurements of HbA1c by six methods. Clin. Chim. Acta 413, 819–821 (2012).
29. Mongia, S. K. et al. Effects of hemoglobin C and S traits on the results of 14 commercial glycated hemoglobin assays. Am. J. Clin. Pathol. 130, 136–140 (2008).
30. Roberts, W. L. et al. Effects of hemoglobin C and S traits on glycohemoglobin measurements by eleven methods. Clin. Chem. 51, 776–778 (2005).
31. Henn, B. M. et al. Hunter-gatherer genomic diversity suggests a southern African origin for modern humans. Proc. Natl Acad. Sci. USA 108, 5154–5162 (2011).
32. Baker, J. L., Shriner, D., Bentley, A. R. & Rotimi, C. N. Pharmacogenomic implications of the evolutionary history of infectious diseases in Africa. Pharmacogenomics J. 17, 112–120 (2017).
33. Khera, A. V. et al. Genome-wide polygenic scores for common diseases identify individuals with risk equivalent to monogenic mutations. Nat. Genet. 50, 1219–1224 (2018).
34. Lee, J. J. et al. Gene discovery and polygenic prediction from a genome-wide association study of educational attainment in 1.1 million individuals. Nat. Genet. 50, 1112–1121 (2018).
35. Collins, F. S. & Varmus, H. A new initiative on precision medicine. N. Engl. J. Med. 372, 793–795 (2015).
36. Colby, S. L. & Ortman, J. M. Projections of the Size and Composition of the U.S. Population: 2014 to 2060 (United States Census Bureau, 2015).
37. United Nations Population Fund. State of World Population 2016. http://www.unfpa.org/swop (2016).
Acknowledgements The Population Architecture Using Genomics and Epidemiology (PAGE) program is funded by the National Human Genome Research Institute (NHGRI) with co-funding from the National Institute on Minority Health and Health Disparities (NIMHD). The contents of this paper are solely the responsibility of the authors and do not necessarily represent the official views of the National Institutes of Health (NIH). The PAGE consortium thanks the staff and participants of all PAGE studies for their contributions. We thank R. Williams and M. Ginoza for providing assistance with program coordination. The complete list of PAGE members can be found at http://www.pagestudy.org. Assistance with data management, data integration, data dissemination, genotype imputation, ancestry deconvolution, population genetics, analysis pipelines and general study coordination was provided by the PAGE Coordinating Center (NIH U01HG007419). Genotyping services were provided by the Center for Inherited Disease Research (CIDR). The CIDR is fully funded through a federal contract from the NIH to The Johns Hopkins University, contract number HHSN268201200008I. Genotype data quality control and quality assurance services were provided by the Genetic Analysis Center in the Biostatistics Department of the University of Washington, through support provided by the CIDR contract. The data and materials included in this report result from collaboration between the following studies and organizations: BioMe Biobank, HCHS/SOL, MEC, PAGE Global Reference Panel and WHI. Their funding is listed below and additional acknowledgements can be found in Supplementary Information 12. The BioMe Biobank received funding for the PAGE IPM BioMe Biobank study through the National Human Genome Research Institute (NIH U01HG007417). Primary funding support to K.E.N., M.G., R.T., H.M.H., C.L.A., C.J.H., A.E.J., B.M.L., M.A.R., K.L.Y., E.B., L.F., M.F., G.H., D.L., C.L.W. and S.Y. (as part of HCHS/SOL) is provided by U01HG007416. Additional support was provided via R01DK101855 and 15GRNT25880008. The HCHS/SOL study was carried out as a collaborative study supported by contracts from the National Heart, Lung and Blood Institute (NHLBI) to the University of North Carolina (N01-HC65233), University of Miami
(N01-HC65234), Albert Einstein College of Medicine (N01-HC65235), Northwestern University (N01-HC65236) and San Diego State University (N01-HC65237). The Multiethnic Cohort study (MEC) characterization of epidemiological architecture is funded through the NHGRI PAGE program (NIH U01 HG007397). The MEC study is funded through the National Cancer Institute U01 CA164973. The Stanford Global Reference Panel was created by Stanford-contributed samples and comprises multiple datasets from multiple researchers across the world designed to provide a resource for any researchers interested in diverse population data on the Multi-Ethnic Global Array (MEGA), funded by the NHGRI PAGE program (NIH U01HG007419). The authors thank the researchers and research participants who made this dataset available to the community. Funding support for the ‘Exonic variants and their relation to complex traits in minorities of the WHI’ study is provided through the NHGRI PAGE program (NIH U01HG007376). The WHI program is funded by the NHLBI, NIH, US Department of Health and Human Services through contracts HHSN268201100046C, HHSN268201100001C, HHSN268201100002C, HHSN268201100003C, HHSN268201100004C and HHSN271201100004C. K.K.N. was supported by the Cancer Prevention Training Grant in Nutrition, Exercise and Genetics R25CA094880 from the National Cancer Institute. C.R.G. was supported by NHGRI training grant T32 HG000044. H.M.H. was supported by NHLBI training grant T32 HL007055. A.E.J. was supported by NIH 5K99HL130580-02 and NIH L60 MD008384-02. K.L.Y. supported by NCATS KL2TR001109. J.M.K. was supported by KL2TR000421. R.W.W. was supported by NIH 5T32HD049311-07. D.-Y.L. was supported by R01CA082659, R01GM047845 and P01CA142538. L.F.-R. was supported by NICHD training grant T32 HD007168 and P2C HD050924. T.A.T. was supported by P01GM099568.
Reviewer information Nature thanks André G. Uitterlinden and the other anonymous reviewer(s) for their contribution to the peer review of this work.
Author contributions L.A.H., S.B., C.A.H., C.K., L.L.M., R.J.F.L., T.C.M., K.E.N., U.P., E.E.K. and C.S.C. provided overall project supervision and management. G.L.W., J.H., C.R.G., N.Z., S.B., J.M.K., E.P.S., K.V., G.M.B., R.W.W., C. Schurmann, A.S., A.M.-E., C.A.W., E.P.B., S.C.-Q., V.A.-A., S.A.B., M.H.P., M.F., C.D.B., L.C.P., J.R., K.D., M.P.C., X.S., C.A.L., C.C.L., R.D., G.N., E.B., S.C.N., C.K., U.P., E.E.K. and C.S.C. carried out genotyping experiments and quality control. M.G., K.K.N., J.H., H.M.H., Y.M.P., A.E.J., C.J.H., C.L.W., C.L.A., K.L.Y., M.A.R., N.Z., S.B., J.M.K., I.C., V.W.S., G.M.B., C. Schurmann, A.V., M.H.P., G.H., L.F.-R., M.F., A.P.R., L.R.W., R.D.J., S.Y., U.L., Y.H., Y. Lu, S.-S.L.P., C.C., R.D., G.N., E.B., S.B., C.K., L.L.M., U.P. and E.E.K. carried out phenotype-harmonization studies. G.L.W., M.G., K.K.N., R.T., J.H., C.R.G., H.M.H., Y.M.P., A.E.J., B.M.L., C.J.H., C.L.W., C.L.A., K.L.Y., M.A.R., S.B., J.M.K., I.C., V.W.S., E.P.S., G.M.B., M.V., R.D.J., S.Y., U.L., Y.H., S.A.B., C. Sabatti, L.M.H., P.J.N., S.C., Y. Lu, D.-Y.L., T.A.T., J.L.A., D.O.S., Y. Li, S.-S.L.P., C.K., U.P., E.E.K. and C.S.C. carried out association analyses. G.L.W., M.G., K.K.N., R.T., J.H., C.R.G., H.M.H., Y.M.P., A.E.J., B.M.L., C.J.H., C.L.W., C.L.A., K.L.Y., M.A.R., J.M.K., I.C., V.W.S., E.P.S., R.W.W., A.V., Y.H., S.A.B., P.J.N., S.C., L.M.H., D.-Y.L., G.H., A.P.R., T.A.T., D.O.S., L.A.H., R.D., G.N., E.A.S., S.B., C.A.H., C.K., L.L.M., R.J.F.L., T.C.M., K.E.N., U.P., E.E.K. and C.S.C. prepared the manuscript.
Competing interests C.D.B. is a member of the scientific advisory boards for Liberty Biosecurity, Personalis, 23andMe Roots into the Future, Ancestry.com, IdentifyGenomics and Etalon, and is a founder of CDB Consulting. C.R.G. and B.M.H. own stock in 23andMe. E.E.K. and C.R.G. are members of the scientific advisory board for Encompass Bioscience. E.E.K. consults for Illumina.
Additional informationExtended data is available for this paper at https://doi.org/10.1038/s41586-019-1310-4.Supplementary information is available for this paper at https://doi.org/ 10.1038/s41586-019-1310-4.Reprints and permissions information is available at http://www.nature.com/reprints.Correspondence and requests for materials should be addressed to E.E.K. and C.S.C.Publisher’s note: Springer Nature remains neutral with regard to jurisdictional claims in published maps and institutional affiliations.
© The Author(s), under exclusive licence to Springer Nature Limited 2019
N A t U r e | www.nature.com/nature
LetterreSeArCH
MEthodSStudies. The PAGE study includes eligible participants with a minority ancestry from four studies. Written informed consent was obtained for all participants in this study at the relevant recruitment sites. The WHI is a long-term, prospective, multi-centre cohort study investigating the health of post-menopausal women in the United States that recruited women from 1993 to 1998 at 40 centres across the United States. WHI participants reporting European descent were excluded from this analysis. The HCHS/SOL is a multi-centre study including participants of Hispanic/Latino descent with the goal of determining the role of acculturation in the prevalence and development of diseases relevant to Hispanic/Latino health. Starting in 2006, household sampling was used to recruit self-identified Hispanic/Latinos from four sites in San Diego, Chicago, the Bronx and Miami. All SOL Hispanic/Latinos were eligible for this study. The MEC is a population-based prospective cohort study recruiting men and women from Hawaii and California, beginning in 1993, and examines lifestyle risk factors and genetic susceptibility to cancer. Only the African American, Japanese American and Native Hawaiian participants of MEC were included in this study. The BioMe BioBank is managed by the Charles Bronfman Institute for Personalized Medicine at Mount Sinai Medical Center. Recruitment began in 2007 and continues at 30 clinical care sites throughout New York City. BioMe participants were African American (25%), Hispanic/Latino, primarily of Caribbean origin (36%), Caucasian (30%) and Others who did not identify with any of the available options (9%). Biobank participants who self-identified as Caucasian were excluded from this analysis. The Global Reference Panel (GRP) was created from Stanford-contributed samples to serve as a population reference dataset for global populations. GRP individuals do not have phenotype data and were only used to aid in the evaluation of genetic ancestry in the PAGE samples. Study protocols were approved for all studies by the appropriate boards at their respective institutions: Fred Hutchinson Cancer Research Center Institutional Review Board (WHI), University of North Carolina Office of Human Research Ethics/IRB (OHRE/IRB; HCHS/SOL), University of Southern California IRB (MEC), University of Hawaii IRB (MEC), Icahn School of Medicine at Mount Sinai IRB (BioMe) and the Stanford University IRB (GRP). Additional information about each participating study can be found in the Supplementary Information.Phenotypes. The 26 phenotypes included in this study were previously harmo-nized across the PAGE studies and white blood cell count, C-reactive protein, mean corpuscular haemoglobin concentration, platelet count, high-density lipo-protein, low-density lipoprotein, total cholesterol, triglycerides, glycated haemo-globin (HbA1c), fasting insulin, fasting glucose, type 2 diabetes, cigarettes per day, coffee consumption, QT interval, QRS interval, PR interval, systolic blood pressure, diastolic blood pressure, hypertension, body mass index (BMI), waist-to-hip ratio (WHR), height, chronic kidney disease (CKD), end-stage renal disease, and estimated glomerular filtration rate assessed using the CKD-Epidemiology Collaboration (CKD-Epi) equation. Single-variant association testing was com-pleted for all phenotypes using phenotype-specific models, adjusting by indicators for study, self-identified race/ethnicity as a proxy for cultural background, phenotype-specific standard covariates and the first 10 PCs. Additional information about phenotype-specific cleaning, exclusion criteria and the model covariates are included in the Supplementary Information.Genotyping. A total of 53,338 PAGE and GRP samples were genotyped on the MEGA array at the CIDR, of which 52,878 samples successfully passed the quality control process of the CIDR. Genotyping data that passed initial quality control at CIDR were released to the quality assurance and quality control analysis team at the University of Washington Genetic Analysis Center, after which the data were further cleaned according to previously described methods38 and genotypes for 51,520 subjects were returned. A total of 1,705,969 SNPs were genotyped on the MEGA. Quality control of genotyped variants was completed by filtering through various criteria, including the exclusion of (1) CIDR technical filters; (2) variants with missing call rate ≥ 2%; (3) variants with more than 6 discordant calls in 988 study duplicates; (4) variants with more than 1 Mendelian error in 282 trios and 1,439 duos; (5) variants with a Hardy–Weinberg P < 1 × 10⁻⁴; (6) SNPs with sex difference in allele frequency ≥ 0.2 for autosomes or XY; (7) SNPs with sex dif-ference in heterozygosity > 0.3 for autosomes or XY; and (8) positional duplicates. Sites were further restricted to chromosomes 1–22, X or XY, and only variants with available strand information were included. After SNP quality control, a total of 1,402,653 MEGA variants remained for further analyses (for further details see Supplementary Information 3).Imputation. To increase coverage, and thus improve power for fine-mapping loci, all PAGE individuals who were successfully genotyped on MEGA were subse-quently imputed into the 1000 Genomes phase 3 data release39. Imputation was conducted at the University of Washington Genetic Analysis Center. Genotype data that passed the above quality control filters were phased with SHAPEIT240 and imputed into 1000 Genomes phase 3 reference data using IMPUTE version 2.3.241. Segments of the genome that are known to contain gross chromosomal anomalies were filtered out of the final files of the genotype probabilities. Imputed
sites were excluded if the IMPUTE information score was less than 0.4. A total of 39,723,562 imputed SNPs passed quality control measures (for further details see Supplementary Information 3).Principal component analysis. The SNPRelate42 package in R was used for prin-cipal components analysis (PCA) (see Supplementary Information for further details). The relevant PCs were selected using scatter plots. Scatter plots, with various PCs on the x and y axes, helped to assess the spread of genetic ancestry in the data for self-identified racial/ethnic clusters. A parallel coordinate plots for the first 10 PCs was generated, in which each PAGE individual is represented by a set of line segments connecting his or her PC values. The amount of variance explained diminished with each subsequent PC, and we estimated that the top 10 PCs provided sufficient information to explain the majority of genetic variation in the PAGE study population.Genome-wide association testing. All imputed autosomal variants with IMPUTE information score > 0.4 (M = 39,723,562) were eligible for association testing in phenotype-specific models. An effective sample size (Neff) was calculated for each SNP in a given phenotype-specific model, where Neff = 2 × MAF ×(1 − MAF) × N × info where MAF is the minor allele frequency among the set of individuals included in a phenotype-specific model, N is the total sample size for a given phenotype and info is the IMPUTE information score of the SNP. Variants with Neff < 30 (continuous phenotypes) or Neff < 50 (binary phenotypes), were excluded from the final set of phenotype-specific results. The number of variants analysed per trait ranged from 21,894,105 to 34,656,550 for continuous phenotypes and 11,665,604 to 28,263,875 for binary phenotypes (Supplementary Table 1). Quantile–quantile plots and λGC (GC = genomic control) were used to assess genomic inflation in all phenotypes, for which λGC ranged from 0.98 to 1.15. Single-variant association testing for each phenotype used an additive model that was adjusted by indicators for study, self-identified race/ethnicity, the first 10 PCs and phenotype-specific covariates. Additional information about the phenotype-specific model covariates and transformations are included in the Supplementary Information. Association testing was completed in both SUGEN and GENESIS programs.
The GENESIS17,18 program is a Bioconductor package made available in R that was developed for large-scale genetic analyses in samples with complex structure including relatedness, population structure and ancestry admixture. The current version of GENESIS implements both linear and logistic mixed model regression for genome-wide association testing. The software can accommodate continuous and binary phenotypes. The GENESIS package includes the program PC-Relate, which uses a PCA-based method to infer genetic relatedness in samples with unspecified and unknown population structure. By using individual-specific allele frequencies estimated from the sample with PC eigenvectors, it provides robust estimates of kinship coefficients and identity-by-descent sharing probabilities in samples with population structure, admixture and Hardy–Weinberg equilibrium departures. It does not require additional reference population panels or prior specification of the number of ancestral subpopulations.
The SUGEN program19 is a command-line software program developed for genetic association analysis under complex survey sampling and relatedness pat-terns. It implements the generalized estimating equation method, which does not require modelling of the correlation structures of complex pedigrees. It adopts a modified version of the ‘sandwich’ variance estimator, which is accurate for low- frequency SNPs. Association testing in SUGEN requires the formation of ‘extended’ families by connecting the households who share first-degree relatives or either first- or second-degree relatives. Trait values are assumed to be correlated within families but independent between families. In our experience in analysing this dataset, it is sufficient to account for first-degree relatedness. The current version of SUGEN can accommodate continuous, binary and age-at-onset traits. A com-parison of P values produced by SUGEN and GENESIS for all previously identified known loci are included in Supplementary Fig. 12 and Supplementary Table 4.Conditional analyses. Phenotype-specific lists of previously identified loci were hand-curated for each phenotype and included SNPs indexed in the GWAS Catalog or identified through non-GWAS high-throughput methods (for example, metab-ochip, exomechip or immunochip). The full lists of known loci for each phenotype are available in Supplementary Table 5. Conditional analyses were conducted for all phenotypes by conditioning on all previously identified loci on a given chro-mosome. P values estimated in conditional analyses are denoted by ‘Pcond in the main text; the SUGEN conditional results for all novel and secondary findings are shown in Supplementary Table 3.SNP × PC effect heterogeneity by genetic ancestry and self-identified race/ethnicity. We used two approaches to assess effect heterogeneity within PAGE participants. First, we used interaction analyses with models that included vari-ant by PC (SNP × PC) interaction terms for all 10 PCs. The fit of nested models was compared using the F-statistic, for which the associated interaction P value indicated whether the inclusion of the 10 SNP × PC interaction terms improved the model fit compared to a model that lacked the interaction terms. The overall
Letter reSeArCH
SNP × PC interaction P values evaluated whether the additional variance explained by variant × genetic ancestry interactions was statistically significant and repre-sented effect modification driven by genetic ancestry. Interaction P values for all novel and secondary findings are included in Supplementary Table 3.
For comparison against more standard (stratified) analysis strategies, all analyses were also run stratified by self-identified race/ethnicity. A minor allele count of at least five was required for a stratified model to be run within an ethnic group. The stratified analyses were then meta-analysed using a fixed-effect model implemented in METAL43. I2 and χ2 heterogeneity P values were estimated for all meta-analysed results and represent effect size heterogeneity driven by self- identified race/ethnicity. The race/ethnicity-specific results, I2 and χ2 heterogeneity P values for all novel and secondary findings are included in Supplementary Table 3.Standardized effect size analysis. The standardized effect size (z′) analysis for Fig. 2a was performed as follows. To avoid double-counting of SNPs/loci, we con-strained analysis for each trait to (1) the single previous report that (2) did not combine genome-wide genotypes with focused platforms such as the metabochip, (3) reported the direction of effect with the allele in the GWAS Catalog and (3) included the maximum total number of individuals after applying criteria (1) and (2). (1) We selected a single manuscript, because many traits already have serial meta-analyses published, where earlier publications represent a subset of individuals reported in later publications, so reported effect sizes in the GWAS Catalog are not necessarily independent. (2) We excluded meta-analyses using mixtures of agnostic GWAS data (consistent map density across the genome) with focused platforms (for example, metabochip, oncochip or exomechip), because the actual sample size varies markedly across the genome, with overlapping agnostic/focused regions having substantially greater numbers of individuals in the analysis. Most of these reports fail to specify the sample size on a per-SNP basis, making it impossible to confidently calculate z′. (3) Starting from the 22 quantitative traits, we found reference studies that explicitly reported the allele associated with direction of effect for 18. Furthermore, to be confident that the direction of effect was con-sistent between PAGE and previous reports, we restricted analysis to asymmetric SNPs (A/C, A/G, C/T and G/T). These criteria yielded 589 previously reported genome-wide significant variants, distributed across the 18 traits (Supplementary Table 7). Only 110 of these variants were traditionally genome-wide significant (P < 5 × 10⁻⁸) and therefore overlap with the SNP × PC heterogeneity analysis. We compared the PAGE z′ (both pooled and stratified) to the GWAS Catalog z′ in a linear regression.Assessing single-variant results. SUGEN association results were used for the identification of novel and secondary findings for all phenotypes. The variant with the smallest P value in a 1-Mb region was considered the ‘lead SNP’. A lead SNP was considered to be a novel locus if it met the following criteria: (1) the lead SNP was located greater than ±500 kb away from a previously known locus (per the phenotype-specific list of known loci); (2) had a SUGEN P < 5 × 10⁻⁸; (3) had a SUGEN conditional P < 5 × 10⁻⁸ after adjustment for all previously known loci on the same chromosome; and (4) had two or more neighbouring SNPs (within ±500 kb) with a P < 1 × 10⁻⁵. A lead SNP was considered to be a secondary signal in a previously known loci if it met the following criteria: (1) the lead SNP was located within ±500 kb of a previously known loci; (2) had a SUGEN P < 5 × 10⁻⁸; and (3) had a SUGEN conditional P < 5 × 10⁻⁸ after adjustment for all previously known loci on the same chromosome. Full results for all novel and secondary findings are included in Supplementary Tables 2, 3.Effect size heterogeneity in the GWAS Catalog. The full GWAS Catalog22 data-base was downloaded on 31 December 2016. The data were filtered to identify results relevant to any of the 26 PAGE phenotypes, producing a subset of 8,979 unique trait–SNP associations (3,322 unique variants) that were genome-wide significant (P < 5 × 10⁻⁸) in the GWAS Catalog. The PAGE results for each of the GWAS Catalog trait–SNP associations was examined to first identify the subset of pairs that replicated (P < 5 × 10⁻⁸) in PAGE unconditioned models. Pairs of replicated tag SNPs within 500,000 base pairs of each other were then merged into loci, to count ‘unique’ associated loci. Of the GWAS Catalog tag SNPs that were replicated in PAGE, SNPs that had a Bonferroni-corrected SNP × PC interaction heterogeneity P value (P < 8.71 × 10⁻⁵, 0.05/574) were considered to show evidence of significant effect size heterogeneity between ancestries. Effect heter-ogeneity was also assessed using the multi-ethnic study population of PAGE by first identifying the lead SNP in each locus with the smallest P value in PAGE, totalling 333 SNPs (302 known loci from the GWAS Catalog, plus 31 novel loci discovered in the present analysis). Among the 333 lead SNPs, 24 (7.2%) had a significant Bonferroni-corrected SNP × PC interaction heterogeneity P value (P < 1.5 × 10⁻⁴, 0.05/333).Meta-analysis and fine-mapping with GIANT and UKB50k. Meta-analysis. We meta-analysed results for BMI and height in our PAGE multiethnic sample (around 50,000 individuals) with the published data from GIANT consortium23,24, which included approximately 250,000 individuals of European descent for each trait.
We also conducted a meta-analysis with 50,000 randomly sampled ‘White British’ individuals from the UK Biobank (UKB50k) for comparison. GWAS for both PAGE and UKB50k were estimated with analogous models for BMI and height traits. Within PAGE and UKB50k, we used the inverse normally transformed residuals for each trait by sex and race/ethnicity, and adjusted for population sub-structure, age, centre and racial/ethnic groups (if applicable). These methods were similar those used by GIANT, using inverse-normal-adjusted residuals for each trait outcome. We then separately meta-analysed results using a fixed-effects model for either PAGE or UKB50k combined with GIANT using the METAL software43. We retained only variants available across both the combined meta-analyses (for PAGE + GIANT or UKB50k + GIANT), which led to the inclusion of approx-imately 2.5 million variants. Significance was defined as P < 5 × 10⁻⁸. Novelty of a locus was defined as ±500 kb from any known loci for the respective trait based on the previously published GIANT data23,24. We also required the at least two SNPs within a 1-Mb results had P < 1 × 10⁻⁵ to be retained as a significant known or novel locus.Fine-mapping. We used FINEMAP44 for all fine-mapping analyses. For each previ-ously reported locus for height24 and BMI23 in GIANT, a 1-Mb region was subset, using the summary statistics from GIANT, the PAGE + GIANT meta-analysis and the UKB50k + GIANT meta-analysis. The linkage disequilibrium for the fine-mapping analyses was calculated using each individual ancestry from the PAGE sample and using the 9,700 individuals of European descent from the ARIC study. For weighted linkage disequilibrium that included all ancestries, we weighted each ancestry in PAGE by the actual sample size and added in the ARIC sample but used the sample size from the GIANT consortium by trait. All analyses were run assuming one causal variant. The cumulative 95% credible set was calculated from the estimated posterior probabilities.PVE analysis. Each PVE analysis considered a single combination of (1) trait, (2) the analysis from which P values were derived (GIANT, GIANT + PAGE or GIANT + UKB50k) and (3) the target population in which PVE was calculated (either PAGE or UKB50k). To avoid overweighting any single region owing to linkage disequilibrium between multiple associated SNPs, we first defined a ‘locus’ as a contiguous series of genome-wide significant tag SNPs with genome-wide significance, for which each tag SNP was less than 500 kb from the next. Then we selected the single SNP within each locus with the smallest P value in the given analysis (the best tag SNP) and calculated the PVE for that SNP in the target population. The meta-analysis was effectively limited to allele frequencies greater than 5%, so we used the standard P < 5 × 10⁻⁸ threshold for significance to define loci.
PVE was calculated for a given SNP using a previously published equation25:
β
β β∝
−
− + . . −
∗
∗ ∗ ∗
p p
p p N p pPVE
ˆ 2 (1 )ˆ 2 (1 ) (s e ( ˆ)) 2 (1 )
2
2 2
Input for this equation requires only the estimated effect size β( ˆ) , the stand-ard error of the estimate β. .(s e ( ˆ)), the allele frequency (p) and the number of samples (N). PVE was then summed across all of the best tag SNPs in a given analysis.Population allele frequencies of HCP rs2395029[G]. These 99 labels were compiled from self-identified ancestry information from the PAGE sample man-ifest, as well as self-reported country of origin from the Mount Sinai BioMe biobank. Per-population allele frequencies for rs2395029[G] were calculated in PLINK v.1.90 (http://www.cog-genomics.org/plink/1.9/)38 and results were visualized in R.Reporting summary. Further information on research design is available in the Nature Research Reporting Summary linked to this paper.
Data availabilityIndividual-level phenotype and genotype data are available through dbGaP (https://www.ncbi.nlm.nih.gov/projects/gap/cgi-bin/study.cgi?study_id=phs000356). Allele frequency data will be available for all genotyped sites on dbSNP (https://www.ncbi.nlm.nih.gov/projects/SNP/) and the University of Chicago Geography of Genetic Variants Browser (http://popgen.uchicago.edu/ggv/). Clinically relevant variant frequency data are available through ClinGen (https://curation.clinicalge-nome.org/). Summary statistics for the genome-wide association study results are available through the NHGRI-EBI GWAS Catalog (https://www.ebi.ac.uk/gwas/downloads/summary-statistics). 38. Chang, C. C. et al. Second-generation PLINK: rising to the challenge of larger
and richer datasets. Gigascience 4, 7 (2015). 39. The 1000 Genomes Project Consortium. A global reference for human genetic
variation. Nature 526, 68–74 (2015). 40. Delaneau, O., Marchini, J. & Zagury, J.-F. A linear complexity phasing method for
thousands of genomes. Nat. Methods 9, 179–181 (2012).

LetterreSeArCH
41. Howie, B. N., Donnelly, P. & Marchini, J. A flexible and accurate genotype imputation method for the next generation of genome-wide association studies. PLoS Genet. 5, e1000529 (2009).
42. Zheng, X. et al. A high-performance computing toolset for relatedness and principal component analysis of SNP data. Bioinformatics 28, 3326–3328 (2012).
43. Willer, C. J., Li, Y. & Abecasis, G. R. METAL: fast and efficient meta- analysis of genomewide association scans. Bioinformatics 26, 2190–2191 (2010).
44. Benner, C. et al. FINEMAP: efficient variable selection using summary data from genome-wide association studies. Bioinformatics 32, 1493–1501 (2016).
Letter reSeArCH
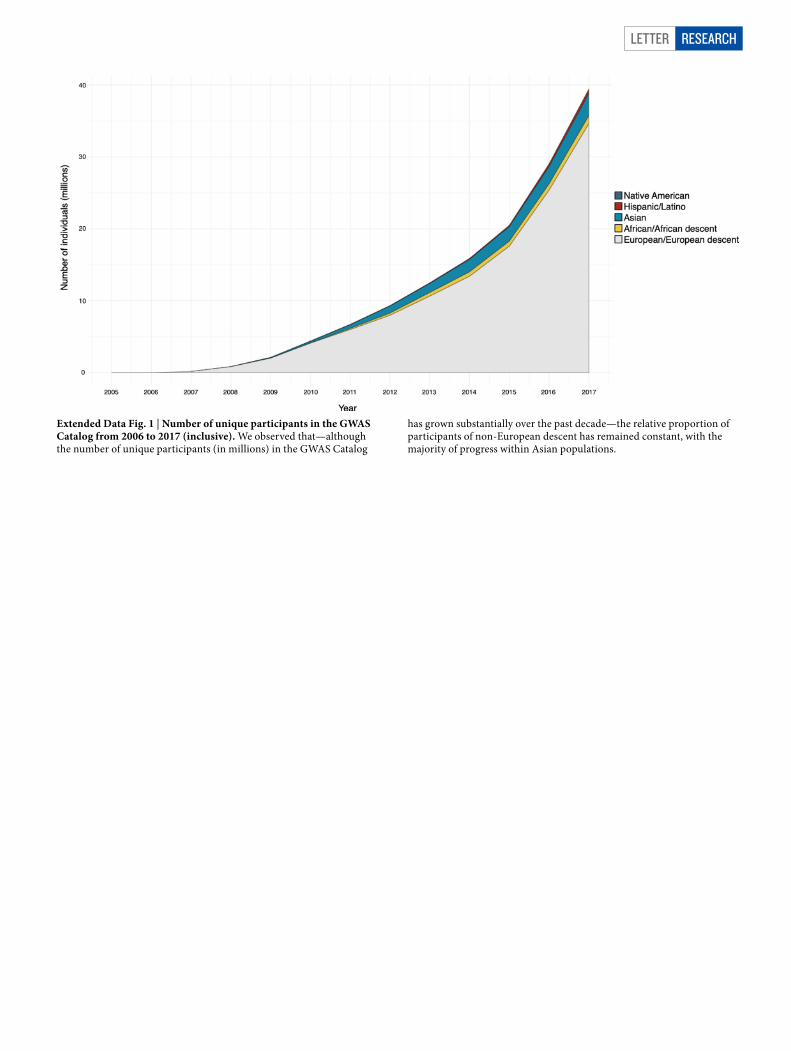
Extended Data Fig. 1 | Number of unique participants in the GWAS Catalog from 2006 to 2017 (inclusive). We observed that—although the number of unique participants (in millions) in the GWAS Catalog
has grown substantially over the past decade—the relative proportion of participants of non-European descent has remained constant, with the majority of progress within Asian populations.
LetterreSeArCH
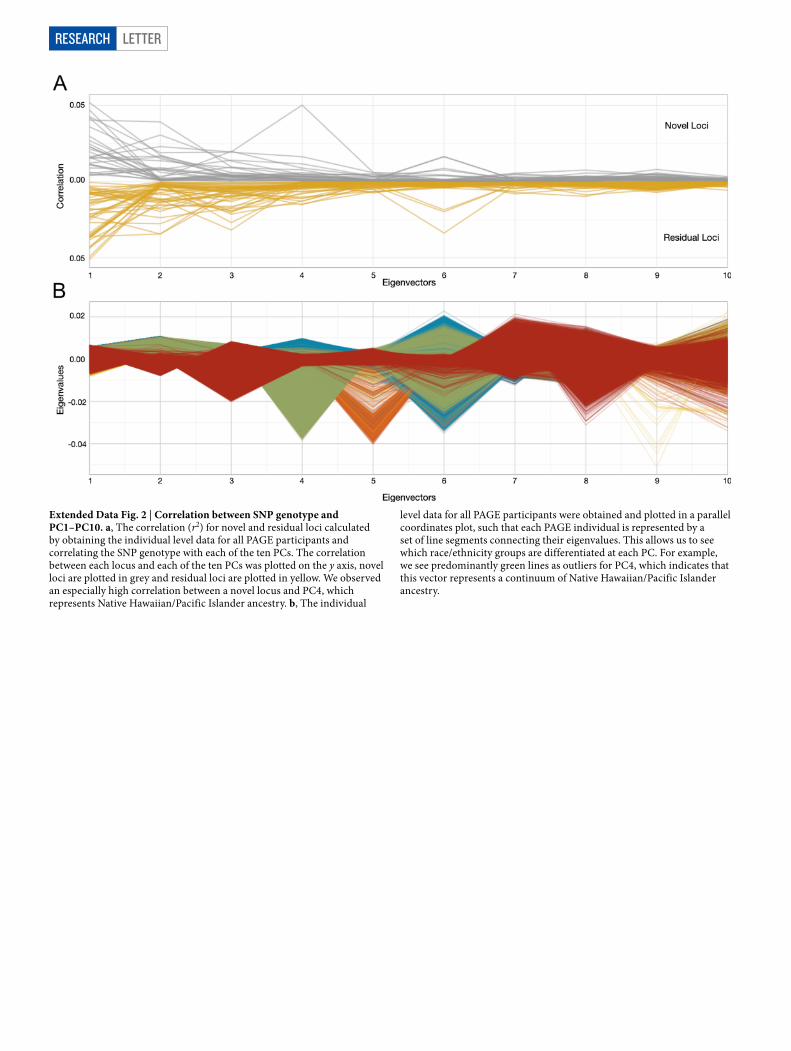
Extended Data Fig. 2 | Correlation between SNP genotype and PC1–PC10. a, The correlation (r2) for novel and residual loci calculated by obtaining the individual level data for all PAGE participants and correlating the SNP genotype with each of the ten PCs. The correlation between each locus and each of the ten PCs was plotted on the y axis, novel loci are plotted in grey and residual loci are plotted in yellow. We observed an especially high correlation between a novel locus and PC4, which represents Native Hawaiian/Pacific Islander ancestry. b, The individual
level data for all PAGE participants were obtained and plotted in a parallel coordinates plot, such that each PAGE individual is represented by a set of line segments connecting their eigenvalues. This allows us to see which race/ethnicity groups are differentiated at each PC. For example, we see predominantly green lines as outliers for PC4, which indicates that this vector represents a continuum of Native Hawaiian/Pacific Islander ancestry.

Letter reSeArCH
Extended data table 1 | GWAS Catalog heterogeneity by trait, including number of novel and secondary findings
For more information, see Supplementary Table 6.1Data only include studies indexed in the GWAS Catalog on 31 December 2016.2Data are shown as cases/controls.3Data include pooled and sex-stratified studies and/or results.4P < 8.71 × 10⁻⁵ for genotype:PC interactions in PAGE, adjusting for multiple tests (0.05/574).5P < 1.50 × 10⁻⁴ for genotype:PC interactions in PAGE, adjusting for multiple tests (0.05/333).6Significant loci have P < 5 × 10⁻⁸ after conditioning on all known loci from the literature.

LetterreSeArCH
Extended data table 2 | Results of the meta-analysis
1Meta-analysis with previously reported height data24.2Meta-analysis with previously reported BMI data23.3Known loci include only the 425 height loci and 74 BMI loci from GIANT.4Novel loci were identified as P > 5 × 10⁻⁸ in the GIANT-only dataset and P > 5 × 10⁻⁸ in the specified analyses.5Novel, shared loci were identified as P > 5 × 10⁻⁹ in both GIANT+PAGE and GIANT+UKB50k datasets.6Novel, unshared loci were identified as P > 5 × 10⁻⁹ in either GIANT+PAGE or GIANT+UKB50k, but not in both datasets.7A modest number of known loci were significant in the GIANT-only GWAS, but not in the meta-analyses. These known loci were still included in PVE calculations.

1
nature research | reporting summ
aryO
ctober 2018
Corresponding author(s): Eimear Kenny and Chris Carlson
Last updated by author(s): 04-15-2019
Reporting SummaryNature Research wishes to improve the reproducibility of the work that we publish. This form provides structure for consistency and transparency in reporting. For further information on Nature Research policies, see Authors & Referees and the Editorial Policy Checklist.
StatisticsFor all statistical analyses, confirm that the following items are present in the figure legend, table legend, main text, or Methods section.
n/a Confirmed
The exact sample size (n) for each experimental group/condition, given as a discrete number and unit of measurement
A statement on whether measurements were taken from distinct samples or whether the same sample was measured repeatedly
The statistical test(s) used AND whether they are one- or two-sided Only common tests should be described solely by name; describe more complex techniques in the Methods section.
A description of all covariates tested
A description of any assumptions or corrections, such as tests of normality and adjustment for multiple comparisons
A full description of the statistical parameters including central tendency (e.g. means) or other basic estimates (e.g. regression coefficient) AND variation (e.g. standard deviation) or associated estimates of uncertainty (e.g. confidence intervals)
For null hypothesis testing, the test statistic (e.g. F, t, r) with confidence intervals, effect sizes, degrees of freedom and P value noted Give P values as exact values whenever suitable.
For Bayesian analysis, information on the choice of priors and Markov chain Monte Carlo settings
For hierarchical and complex designs, identification of the appropriate level for tests and full reporting of outcomes
Estimates of effect sizes (e.g. Cohen's d, Pearson's r), indicating how they were calculated
Our web collection on statistics for biologists contains articles on many of the points above.
Software and codePolicy information about availability of computer code
Data collection No software was used for data collection.
Data analysis Software used for data analysis in this manuscript includes: Plink (v1.90), R, Illumina's GenomeStudio, SNPRelate, PC-Relate, METAL, GENESIS, SUGEN, and FINEMAP (v1.3). All software used in this analysis is described in detail within the Methods section (Pg 14) and Supplemental Information.
For manuscripts utilizing custom algorithms or software that are central to the research but not yet described in published literature, software must be made available to editors/reviewers. We strongly encourage code deposition in a community repository (e.g. GitHub). See the Nature Research guidelines for submitting code & software for further information.
DataPolicy information about availability of data
All manuscripts must include a data availability statement. This statement should provide the following information, where applicable: - Accession codes, unique identifiers, or web links for publicly available datasets - A list of figures that have associated raw data - A description of any restrictions on data availability
Data Availability: Individual-level phenotype and genotype data are available through dbGaP at https://www.ncbi.nlm.nih.gov/projects/gap/cgi-bin/study.cgi?study_id=phs000356. Allele frequency data will be available for all genotyped sites on dbSNP (https://www.ncbi.nlm.nih.gov/projects/SNP/) and the University of Chicago Geography of Genetic Variants Browser (http://popgen.uchicago.edu/ggv/). Clinically relevant variant frequency data is also available through ClinGen.
2
nature research | reporting summ
aryO
ctober 2018
Field-specific reportingPlease select the one below that is the best fit for your research. If you are not sure, read the appropriate sections before making your selection.
Life sciences Behavioural & social sciences Ecological, evolutionary & environmental sciences
For a reference copy of the document with all sections, see nature.com/documents/nr-reporting-summary-flat.pdf
Life sciences study designAll studies must disclose on these points even when the disclosure is negative.
Sample size We conducted genome-wide association (GWAS) of 49,839 non-European individuals for 26 clinical and behavioral phenotypes. As far as we are aware, this is the largest study of multi-ethnic, non-European participants genotyped on a single array for GWAS. See Methods (Page 14) and Supplemental Information (Pages 2-3) for more information about the samples.
Data exclusions Several rationale for data exclusions were deployed in this study. Participants were excluded from the analysis if they had missing or outlier phenotype values, confounding co-morbidities, medications, or otherwise non-standard measures of phenotype as described in the Supplementary Information. Genotyped or imputed variants were excluded if they failed quality control or technical filters described in the Methods section.
Replication Over 95% of the findings of this study reproduced known, published genotype-phenotype associations in the GWAS catalog. In addition, 5% variants in this study (26 loci) reach the threshold of statistical significance, indicating novel findings. However, in the absence of independent large-scale studies for those in the same populations, these could not be independently reproduced.
Randomization Models for variant association testing for each phenotype included covariates for gender and study center, to adjust for population group including self-identified race/ethnicity and the first 10 principal components of genetic ancestry, and phenotype-specific covariates (including, age of diagnosis/trait measurement, medications, smoking, and co-morbidities).
Blinding All participating studies had population-base recruitment strategies, regardless of outcomes, therefore blinding was not necessary during data collection or analysis in this study.
Reporting for specific materials, systems and methodsWe require information from authors about some types of materials, experimental systems and methods used in many studies. Here, indicate whether each material, system or method listed is relevant to your study. If you are not sure if a list item applies to your research, read the appropriate section before selecting a response.
Materials & experimental systemsn/a Involved in the study
Antibodies
Eukaryotic cell lines
Palaeontology
Animals and other organisms
Human research participants
Clinical data
Methodsn/a Involved in the study
ChIP-seq
Flow cytometry
MRI-based neuroimaging
Human research participantsPolicy information about studies involving human research participants
Population characteristics A total of 49,839 individuals of non-European ancestry were included in this study, comprising of 15,381 men and 34,458 women. Genotyped individuals self-identified as Hispanic/Latino (N=22,216), African American (N=17,299), Asian (N=4,680), Native Hawaiian (N=3,940), 112Native American (N=652), or Other (N=1,052). Detailed population characteristics by study and phenotype harmonization information can be found in Supplemental Information Sections 1 and 2, as well as Supplementary Table 1.
Recruitment All participating studies had population-based recruitment strategies, regardless of outcomes. Details can be found in Supplemental Materials (Section 1).
Ethics oversight Study protocols were approved for all studies by the appropriate boards at their respective institutions: Fred Hutchinson Cancer Research Center Institutional Review Board (WHI), University of North Carolina Office of Human Research Ethics/IRB (OHRE/IRB; HCHS/SOL), University of Southern California IRB (MEC), University of Hawaii IRB (MEC), Icahn School of Medicine at Mount Sinai IRB (BioMe), and the Stanford University IRB (GRP).
Note that full information on the approval of the study protocol must also be provided in the manuscript.