GENESIS: The General Earth Science Investigation Suite · The General Earth Science Investigation...
10
GENESIS: The General Earth Science Investigation Suite Thomas Yunck, Brian Wilson, Amy Braverman, Elaine Dobinson and Eric Fetzer Jet Propulsion Laboratory, California Institute of Technology 4800 Oak Grove Drive Pasadena, CA 91109 Abstract – GENESIS is a NASA-sponsored partnership be- tween the Jet Propulsion Laboratory, academia, and three NASA data centers to develop a new suite of web services tools to facilitate multi-sensor investigations in Earth System Science. Residing within a framework known as SciFlo, these tools will offer versatile operators for data access, subsetting, registra- tion, fusion, compression, and advanced statistical analysis. They will first be deployed in a model server at JPL, and later released as an open-source toolkit to encourage enhancement by independent developers. While the initial work will focus on four premier atmospheric sensors – AIRS, MODIS, MISR, and GPS – the modular design offers ready extension and reuse on many Earth science data sets. The SciFlo design grew out of the pressing needs of scientists active in studies with these new sen- sors. The tools themselves will be co-developed by atmospheric scientists and information technologists from several institu- tions. At each step the tools will be tested under fire within ac- tive investigations, including cross-comparison of spaceborne climate sensors; cloud spectral analysis; upper troposphere- stratosphere water transport; and global climate model testing. The tools will then be evaluated by our partner data centers and later infused into their operations. INTRODUCTION The General Earth Science Investigation Suite (GENESIS) was selected in 2003 under NASA’s REASoN (Research, Edu- cation, and Applications Solution Network) program. The GENESIS team includes scientists and information technolo- gists at JPL, UCLA, the University of Maine, Scripps Institution of Oceanography, and three NASA data centers (DAACs). The principal objectives of GENESIS are to alleviate critical data bottlenecks and provide new fusion and analysis tools for multi- sensor Earth System Science. While the tools are designed for reuse across many science disciplines, GENESIS will focus on the needs of NASA’s premier atmospheric sensors, including AIRS, MODIS, and MISR, on NASA’s Terra and Aqua space- craft, and the GPS occultation sensors on CHAMP, SAC-C, and GRACE. The Langley, Goddard, and JPL (Physical Oceanography) DAACs join this effort to provide the data products, evaluate key technologies, serve as test-beds, and eventually integrate proven functions into their operations. Table I presents key GENESIS objectives over the next four years. To approach this we’ve assembled a team of scientists active in investigations with the target instruments, together with IT specialists. We began by formulating a set of multi- sensor science investigations and calibration/validation scenar- ios central to NASA’s Earth science priorities. We then worked through these scenarios and performed selected tests in data manipulation with current NASA archives to identify critical obstacles. These proved plentiful – data access, subsetting, fusion – and illustrate why so little multi-sensor Earth “system” science is done today. TABLE I GENESIS OBJECTIVES • Provide easy web-based access to science products from AIRS, MODIS, MISR, and GPS • Co-register products on a common global grid • Enable swift, versatile subsetting of all products • Provide advanced fusion tools and statistical summarization and data mining operators • Create a model server to stage and operate upon the collected products • Provide tools to create and deliver on-demand, user-specified, custom products and operators • Test, refine, and apply these tools in a diversity of real science applications • Release the system publicly in an open-source modular toolkit designed for easy reuse • Deploy in the JPL, GSFC, and Langley DAACs We then sketched the elements of an efficient, distributed atmospheric data information system. Finally, we distilled the major IT problems cutting across user scenarios with a view to evolving today’s infrastructure towards the ideal. We sought out strategies that: (1) make thorough use of existing DAAC services; (2) can be readily infused to enhance those services; and (3) bring together disparate science products within a common framework. The result is the novel SciFlo web serv- ices architecture. Where possible we have taken proven solu- tions – the “web services” paradigm – rather than inventing new ones, and tailored them in novel ways to the demands of NASA’s Earth science data systems. RELEVANCE TO NASA’S EARTH SCIENCE OBJECTIVES Current NASA Earth science priorities strongly emphasize weather and climate. Of six research focus areas cited in the most recent NASA Earth Science Strategic Plan [1], five directly concern weather and climate: • Weather prediction • Water and energy cycle • Carbon cycle and ecosystems • Atmospheric composition • Climate variability and change AIRS, MODIS, MISR, and GPS are central to these efforts and to NASA’s larger ambition to characterize, understand, and predict Earth’s behavior. The Earth Observing System, con- ceived nearly 20 years ago, introduced to the world the notion of Earth System Science (ESS) – the study of Earth as a cou-
Transcript of GENESIS: The General Earth Science Investigation Suite · The General Earth Science Investigation...

GENESIS: The General Earth Science Investigation Suite
Thomas Yunck, Brian Wilson, Amy Braverman, Elaine Dobinson and Eric FetzerJet Propulsion Laboratory, California Institute of Technology
4800 Oak Grove DrivePasadena, CA 91109
Abstract – GENESIS is a NASA-sponsored partnership be-tween the Jet Propulsion Laboratory, academia, and threeNASA data centers to develop a new suite of web services toolsto facilitate multi-sensor investigations in Earth System Science.Residing within a framework known as SciFlo, these tools willoffer versatile operators for data access, subsetting, registra-tion, fusion, compression, and advanced statistical analysis.They will first be deployed in a model server at JPL, and laterreleased as an open-source toolkit to encourage enhancement byindependent developers. While the initial work will focus onfour premier atmospheric sensors – AIRS, MODIS, MISR, andGPS – the modular design offers ready extension and reuse onmany Earth science data sets. The SciFlo design grew out of thepressing needs of scientists active in studies with these new sen-sors. The tools themselves will be co-developed by atmosphericscientists and information technologists from several institu-tions. At each step the tools will be tested under fire within ac-tive investigations, including cross-comparison of spaceborneclimate sensors; cloud spectral analysis; upper troposphere-stratosphere water transport; and global climate model testing.The tools will then be evaluated by our partner data centers andlater infused into their operations.
INTRODUCTION
The General Earth Science Investigation Suite (GENESIS)was selected in 2003 under NASA’s REASoN (Research, Edu-cation, and Applications Solution Network) program. TheGENESIS team includes scientists and information technolo-gists at JPL, UCLA, the University of Maine, Scripps Institutionof Oceanography, and three NASA data centers (DAACs). Theprincipal objectives of GENESIS are to alleviate critical databottlenecks and provide new fusion and analysis tools for multi-sensor Earth System Science. While the tools are designed forreuse across many science disciplines, GENESIS will focus onthe needs of NASA’s premier atmospheric sensors, includingAIRS, MODIS, and MISR, on NASA’s Terra and Aqua space-craft, and the GPS occultation sensors on CHAMP, SAC-C,and GRACE. The Langley, Goddard, and JPL (PhysicalOceanography) DAACs join this effort to provide the dataproducts, evaluate key technologies, serve as test-beds, andeventually integrate proven functions into their operations.
Table I presents key GENESIS objectives over the next fouryears. To approach this we’ve assembled a team of scientistsactive in investigations with the target instruments, togetherwith IT specialists. We began by formulating a set of multi-sensor science investigations and calibration/validation scenar-ios central to NASA’s Earth science priorities. We then workedthrough these scenarios and performed selected tests in datamanipulation with current NASA archives to identify criticalobstacles. These proved plentiful – data access, subsetting,
fusion – and illustrate why so little multi-sensor Earth “system”science is done today.
TABLE IGENESIS OBJECTIVES
• Provide easy web-based access to science products from AIRS, MODIS,MISR, and GPS
• Co-register products on a common global grid
• Enable swift, versatile subsetting of all products
• Provide advanced fusion tools and statistical summarization and data miningoperators
• Create a model server to stage and operate upon the collected products
• Provide tools to create and deliver on-demand, user-specified, customproducts and operators
• Test, refine, and apply these tools in a diversity of real science applications
• Release the system publicly in an open-source modular toolkit designed foreasy reuse
• Deploy in the JPL, GSFC, and Langley DAACs
We then sketched the elements of an efficient, distributedatmospheric data information system. Finally, we distilled themajor IT problems cutting across user scenarios with a view toevolving today’s infrastructure towards the ideal. We soughtout strategies that: (1) make thorough use of existing DAACservices; (2) can be readily infused to enhance those services;and (3) bring together disparate science products within acommon framework. The result is the novel SciFlo web serv-ices architecture. Where possible we have taken proven solu-tions – the “web services” paradigm – rather than inventingnew ones, and tailored them in novel ways to the demands ofNASA’s Earth science data systems.
RELEVANCE TO NASA’S EARTH SCIENCE OBJECTIVES
Current NASA Earth science priorities strongly emphasizeweather and climate. Of six research focus areas cited in themost recent NASA Earth Science Strategic Plan [1], five directlyconcern weather and climate:
• Weather prediction• Water and energy cycle• Carbon cycle and ecosystems• Atmospheric composition• Climate variability and change
AIRS, MODIS, MISR, and GPS are central to these effortsand to NASA’s larger ambition to characterize, understand, andpredict Earth’s behavior. The Earth Observing System, con-ceived nearly 20 years ago, introduced to the world the notionof Earth System Science (ESS) – the study of Earth as a cou-

pled web of physical processes and feedbacks. Today EOS isreturning a flood of new data – a volume approaching threeTerabytes every day. Yet the promise of ESS is still pending.Owing in part to serious obstacles in obtaining and subduingthese diverse products, little multi-sensor “system” science isyet being done. The GENESIS tools will help to inaugurateEarth System Science and will advance a modern data systemarchitecture for realizing the broader vision of NASA’s EarthScience Enterprise.
INSTRUMENT SUMMARIES
Summaries of the four instruments – AIRS, MODIS, MISR,and GPS – that are the focus of GENESIS are given below.
AIRS – The Atmospheric Infrared Sounder (Fig. 1) flying onNASA’s Aqua spacecraft performs multi- and hyper-spectralsounding of the atmosphere and the surface, resolving 2380channels within the 3.7–15.4 µm infrared band. The sensorscans ±49° cross-track through nadir, with a scan period ofabout 2.7 sec. With this wide swath width, AIRS can covernearly the entire earth every day. The “AIRS suite” (includingan Advanced Microwave Sounding Unit and a HumiditySounder for Brazil) generates profiles of atmospheric temper-ature and moisture and measurements of precipitable water,surface temperature, cloud fraction, cloud top height, and totalatmospheric ozone. The temperature profiles are accurate toabout 1 K and have a vertical resolution of about 1 km. Hori-zontal resolution at the surface is 15 km. In all, AIRS acquiresacquires eight gigabytes of raw data each day.
MISR – The Multi-angle Imaging Spectro-Radiometer (Fig. 2)flying on NASA’s Terra spacecraft operates largely at visiblewavelengths, measuring reflected sunlight in four color bands(blue, green, red, and near-IR) and at nine distinct viewing an-gles at once. With a considerably narrower swath width thanAIRS, MISR takes about ten days to cover the entire earth. TheMISR data can be used to distinguish different types of atmos-pheric aerosols, cloud forms and cloud cover, and land surfacecovers. These help to illuminate the division of energy andcarbon between the land and the atmosphere, and to explorethe effects of aerosols and clouds on climate. With the aid ofstereoscopic techniques, MISR enables construction of 3-Dmodels and estimation of the total sunlight reflected from dif-ferent environments. MISR achieves a surface resolution of275 m and returns about 30 GB of data each day.
MODIS – The Moderate Resolution Imaging Spectrometerflying on both Terra and Aqua (Fig. 3) operates over a broaderfrequency band than AIRS, measuring radiances over 0.4-14.4µm, but resolves that band more coarsely, into just 36 channels.It achieves horizontal resolutions of 250-1000 m, depending onthe band. Products include the boundaries and various proper-ties of clouds, aerosols, and land; ocean color; atmosphericmoisture and temperature profiles; surface and cloud tempera-tures; cloud top altitude; and total column ozone. MODIS re-turns about 60 GB of raw data each day.
Fig. 1. AIRS instrument and mission overview.
Fig. 2. MISR observing from nine simultaneous look angles.
Fig. 3. The MODIS Instrument flying on TERRA and AQUA.

Fig. 4. Sketch of GPS occultation.
GPS – In contrast to spectrometers, which passively observeemissions from the atmosphere and surface and measure radi-ance in different frequency bands, GPS occultation observesactive radio signals and measures the changing path delay of thesignal passing through the atmosphere (Fig. 4). Each profile isvirtually self-calibrating, beginning or ending with a zero meas-ure in free space. Products include atmospheric refractivity,pressure, temperature, and moisture (below ~5 km). Becausethe raypath is precisely known, GPS (uniquely) recovers truegeopotential heights to <10 m, which yield global pressurecontours and geostrophic wind fields. Recent results indicatethat single profiles are accurate to about 0.5 K, and multipleprofiles average to better than 0.1 K between 5 and 30 km – tentimes better than other techniques [2]. Vertical resolution isabout 100 m near the surface, falling to about 1 km in thestratosphere. A single receiver can obtain about 600 pro-files/day globally, returning about 40 MB of data each day.
SCIENCE FOUNDATIONS
The GENESIS team has defined six foundation science sce-narios upon which to design, refine, and demonstrate our datatechnologies. These form a representative set of the limitlesspossibilities and fall into three categories:
1. Sensor cross-validation and calibration:– Calibration of spectrometers with GPS– AIRS/MODIS cross-instrument validation
2. Focused climate process studies:– AIRS/MODIS cloud spectral analysis– Troposphere-stratosphere water transport– Exploring the aerosol “indirect cloud effect”
3. Climate model validation/improvement:– Global testing of cloud models
The original REASoN solicitation observed that “Perhapsthe greatest roadblock to fundamental advances in our under-standing of climate variability and climate change is the lack ofrobust and unbiased long-term global observations.” Becauseclimate signals are subtle (~0.1-0.3 K change per decade), cur-rent sensors require meticulous calibration of drifting biases.The REASoN solicitation noted that for climate monitoring“the focus is on…construction of consistent datasets frommulti-instrument, multi-platform, and…multi-year observations
with careful attention to calibration and validation over the life-time of the measurement.” The first two scenarios address is-sues of multi-instrument/platform/year calibration and valida-tion. These three categories immediately suggest a fourth:
4. Climate monitoring and signal detection
Detecting climate signals demands exceptionally precise andstable data. GPS calibration will improve long-term tempera-ture stability of EOS sensors to about 0.05 K from the currentlyspecified 1 K, transforming AIRS/MODIS/MISR into power-ful climate sensors. From the first year we will begin to laydown an absolute data record that can expose climate signalswithin a matter of years rather than decades.
TECHNOLOGY OBSTACLES
With present data systems such studies are burdensome andin many cases impractical. Each requires swift access to, selec-tion from, fusion of, and operation upon large volumes of in-commensurate products from multiple sensors and archives.This invariably requires custom code and deep expertise to ac-complish properly.
GENESIS will create new tools to facilitate multi-sensor sci-ence; exercise them in real scientific investigations; deliver themin an open source toolkit that automates many steps in theprocess; adopt uniform and flexible standards; and provide amodel archive of multi-sensor data, co-registered and cross-validated. Here we describe several of today’s persistent ITbottlenecks and briefly outline our vision to address them.
Data Volume and Access. A single-instrument dataset maycontain thousands of granules and terabytes of data. A typicalAIRS, MODIS, or MISR swath is broken into many granules,each containing tens or hundreds of parameters. Assembling aregional dataset for a specified interval involves subsetting thegranules for time and location, retrieving the parameters, andaggregating the results. Scientists often simply retrieve a fullglobal dataset, taxing network bandwidth, then subset and ag-gregate them locally with custom code – a demanding chore forwhich many investigators must employ specialists. Within Sci-Flo, the request/response cycle will be fully automated and cus-tom functionality migrated to the DAACs.
Time/Location and Parameter Subsetting. Snags in findingand retrieving data through the EOS Data Gateway and else-where have prompted the DAACs to begin supporting time/location and parameter subsetting. The GSFC DAAC will soonsupport both synchronous (online) and asynchronous accesswith versatile subsetting. SciFlo will exploit two of these toolsthat employ wu-ftp and Web Coverage Service (WCS) protocolsand serve the large stores of on-line data in the Data Pools.Current GSFC tools emphasize grid data. SciFlo will provideswath subsetting operators and a framework in which user-designed subsetting can be tested locally, then transparentlydeployed at a DAAC. Any program that reads an HDF file andwrites a new one can be transparently used as a data cutter.

Variety of data formats. The variety of data formats in Earthscience is enormous: HDF, CDF, netCDF, GRIB, GeoTiff,XML, etc. Since HDF-EOS is the only widely used format thathandles both swath and grid data, SciFlo will adopt it as a stan-dard container to structure and transport data, though it willalso handle HDF and netCDF files and other containers forregular grid data. Many scientists have learned to apply theseformats with higher-level API’s such as those in the InteractiveData Language (IDL). SciFlo will offer some operators in For-tran or C/C++ for high performance but IDL is sufficient formany. We will also employ Earth Science Markup Language(ESML) readers; operators created with ESML can transpar-ently handle multiple formats. SciFlo services will be offeredvia a Web Coverage Server that converts to netCDF, GeoTIFF,and other formats, a function already hosted in the JPL DAACOcean ESIP Tool [http://podaac-esip. jpl.nasa.gov/poet/].
Coincidence searching. Finding overlaps between MODISswaths from Terra and AIRS swaths from Aqua, or betweenAIRS and GPS, is nontrivial. To our knowledge there are noservices today that solve this random access lookup-and-intersect problem in a robust way for large EOS datasets.GENESIS is developing a coincidence searching service forEOS swath and point data. SciFlo will tap that effort to findswath overlaps for sensors on multiple platforms.
GENESIS previously developed a server, middleware, andweb interface to provide flexible access to GPS products. Theinterface consists of web forms and a Java application to subsetand visualize profiles and grids [http://infolab.usc.edu/GENESIS/index.html]. The middleware is a Java server thatprovides web interfaces, talks to the Java application, and con-nects to an Informix object-relational database. ESRI and Geo-detic Spatial Datablades facilitate queries based on <lat, long,altitude, time>. A spatial index structure, R-tree, expedites que-ries. The same method will be used for on-demand coincidencesearching for GPS, radiosonde, and AIRS data. We have in-stalled a SOAP service that allows one to submit an arbitrarySQL query to any of our Informix databases; coincidencesearching services will be layered on top of that capability.
Data Fusion. With overlaps in hand co-registration and datafusion can proceed at various levels of complexity: We cansimply overlay one set on another for visual inspection; or wecan interpolate or re-project data to a common grid or projec-tion – facilities common in GIS packages (e.g., ARC INFO,GRASS). More advanced techniques exploit spatio-temporalrelationships in the data to optimally interpolate to commonlocations [3], [4]. SciFlo will feature reusable operators imple-menting a range of methods including advanced statistical fu-sion of data from multiple sensors. We will exploit existing re-projection software such as HDF-EOS to GeoTIFF (HEG)and the MODIS Swath-to-Grid Toolkit (MS2GT).
Multivariate Statistics. To estimate quantities reliably frommultivariate data one must represent their full joint distribution.Consider a set of 10 parameters accumulated over time onto a1°x1° global grid. The vastness of the 10-dimensional multi-
variate distribution presents a nearly paralyzing obstacle. Onetherefore usually saves only a small slice of the available infor-mation, such as individual means and variances or covariancesof selected parameter pairs. This precludes analysis of the fulljoint distribution, inhibiting discovery of unexpected connec-tions. SciFlo will offer new tools based on clustering and Prin-cipal Components Analysis to summarize multivariate distribu-tions to a far greater level of detail and to compute arbitraryquantities from them.
Software Reuse. While progress has been made in this arena(e.g., reusable API’s and classes in object-oriented languages),the methods tie one to a few coding languages. The advent ofloosely-coupled distributed computing based on SOAP (SimpleObject Access Protocol) remote procedure calls (RPC) has trig-gered a new paradigm in which remote programs conversethrough XML. Each operation in a processing stream can be-come a SOAP-callable web service regardless of the implemen-tation language. The process flow can be specified in an XMLdocument (declarative programming) defining how to assemblethe building blocks (reusable operators). SciFlo will provide alightweight, open source toolkit allowing any executable pro-gram with documented command-line inputs to be exposed as aSOAP web service and reused as an operator in processingflows. By combining distributed computing with simple de-clarative programming, SciFlo will raise the bar on softwarereuse, and will easily support such widely recognized standardssuch as ESML, WCS, WMS, DODS, and the Open Data Ac-cess Protocol (OpenDAP).
Automated Processing of Structured Data. The first genera-tion of web software was tied to presentation of unstructureddata in HTML, and to a stateless http protocol that returns un-structured results in HTML. While these have been adapted tolarge binary datasets (e.g., DODS; WMS/WCS), they are notadequate for large-scale automated data processing. The secondgeneration is moving toward the automated manipulation ofsemi-structured and structured data represented in XML, and toa paradigm in which automated programs communicate withone another asynchronously in XML. SOAP and XML havenow become flexible enough, powerful enough, and fastenough to form the “glue” for an entire data processing system.The challenge is to adapt the emerging web service standards tothe needs of scientific data processing: vast datasets, binaryformats, and complexity of metadata.
Adoption. Every new technology must vie for acceptance.SciFlo confronts this with a lightweight, language-independentframework; loosely-coupled distributed computing; simple de-clarative programming; end-to-end processing flows expressedin XML; an execution engine exploiting parallelism at manylevels; flexible subsetting, co-registration, and statistics opera-tors; standard operator and data types specified by XML sche-mas; reuse of DODS, WMS/WCS, and ESML standards; opensource software; and one-step installation on Linux clusters.Use of SciFlo will not require programming in the usual sense;the only “API” consists of writing XML documents with anoutline-based XML editor.

TECHNICAL APPROACH
A major challenge facing NASA data centers is the genera-tion of subsets and custom products delivered over the web.Since the centers cannot anticipate all requests, they have a needfor smart subsetting and custom summarization. Ideally, userswould specify a remote data subset from within an application(browser, IDL, Matlab) and receive the results immediately,directly in the application. DODS and WCS are used widelybecause they can be called inside IDL and Matlab (DODS) or abrowser (WCS). Many users, however, would like to customizecomplex operators to suit particular needs.
Two developments in network computing are of particularinterest: (1) tightly-coupled Grid Computing in which softwaretoolkits link distributed clusters or supercomputers, and (2)loosely-coupled distributed computing, or “web services,” inwhich protocols like SOAP call procedures remotely over thenet and return results.
SOAP web services were originally created for business (“e-commerce”) use; the SOAP Web Service Definition Language(WSDL) and Universal Description, Discovery, and Integration(UDDI) standards are driven by business needs. SOAP offers astandard for providing and consuming web services; WSDLprovides a way to precisely describe each service; and UDDIprovides a means to publish and discover services in a search-able catalog. Web services that communicate in XML can becoded in a mix of languages (perl, python, Java, C, C++, C#).A structured web service can be thought of as an XML docu-ment in WSDL, and many software toolkits automatically gen-erate code from the WSDL description.
Web services are now being applied in science. The Globustoolkit for Grid Computing will migrate toward the Open GridServices Architecture (OGSA) [5] in which most functions (e.g.,discovery, authentication, security, submission, monitoring, andsteering) will be recast as web services. Only tightly coupledservices involving execution of numerical algorithms on a gridwill remain in the old paradigm.
A. Enabling Technologies for SciFlo
SciFlo combines four core ideas to promote software reuseand create a marketplace for science analysis services: loosely-coupled distributed computing using SOAP; exposing scientificanalysis operators as SOAP web services; specifying a dataprocessing stream as an XML document; and a dataflow execu-tion engine for a parallel execution plan and load balancing.
Loosely-coupled distributed computing. In the SOAP andXML-RPC protocols, remote procedures are invoked throughXML messages, without reference to implementation details.Other distributed computing standards (CORBA, DCOM, JavaRMI) can be problematic as they are more tightly coupled andhave a fairly steep learning curve. Java RMI simplifies mattersbut ties one to Java, which is ill-suited to intensive computing.In contrast, SOAP is lightweight, language-independent, andideal for loosely-coupled distributed computing.
Analysis operators as SOAP web services. Scientific opera-tors are often intricate, with many configuration parameters,and may involve vast and complex inputs and outputs. Forexample, Conquest (Concurrent Queries over Space and Time),developed at UCLA [6], decomposes queries consisting of fine-grained operators, optimizes, and then executes them in parallel.The focus of SciFlo is coupling medium-grained operators, andcomponents that can be local or remote, in a simple, declarativemanner; a SciFlo operator accepts one or more complex inputs,performs tasks tailored with configuration parameters, andyields one or more complex outputs. Inputs and outputs canbe local HDF files and metadata, pointers to remote HDF filesor array slices, or the actual numbers.
Power of declarative programming. A key goal of SciFlo isto provide XML standards that describe analysis operators(verbs) and groups of operations (processing flows) to serve asbuilding blocks in an arbitrary processing flow. By encapsulat-ing code within well-defined operator interfaces described inXML, new programs can be assembled with a simple XMLdocument. The user “declares” the new processing flow andthe execution engine does the rest. SciFlo will provide the“glue” allowing any user to expose analysis operations asSOAP-callable web services and to invoke remote operations aspart of a data processing flow without writing new code.
There is much activity in the commercial sector to coordinateand assemble web services for business. IBM offered a WebServices Flow Language, superseded by the Business ProcessExecution Language for Web Services (BPEL4WS), to describebusiness processes. Two auxiliary specifications, WS-Coordina-tion and WS-Transaction, have appeared, and a new Web Serv-ice Choreography Interface. We have chosen not to use thesespecifications because the designs are evolving, tailored forbusiness, and require proprietary editing tools. SciFlo will adoptWSDL to describe operators and UDDI to catalog and discoverthem, but specialized for science: compatible with WCS andDODS, employing simple XML flows, and offering a substratewith hooks for semantic web activities in the science realm.
Dataflow Execution Engine. At the core of systems likeConquest and Sciflo are dataflow execution engines. SciFlocarries the idea further by engaging open, interoperable webservices with on-demand integration of operators. It contains adataflow engine that parses the XML description of the processflow, creates an optimized execution plan, distributes and loadbalances the computation, parallelizes if possible, and coordi-nates the execution of each operator. Operators can be localexecutables or scripts, or remote entities that require the engineto invoke a remote SOAP service, make a WMS/WCS call,submit an http POST request, or submit a one-line http GETrequest (e.g. a DODS URL or a GrADS-DODS server call).The engine creates the code to move data inputs and outputsbetween nodes, sequence operations, execute operators in par-allel, update a status log, and deliver results.
SciFlo and Conquest represent somewhat different comput-ing paradigms. Conquest balances flexibility and performance,

automatically parallelizes, migrates operators, and requires op-erators in C++. SciFlo emphasizes flexibility and ease; auto-matically parallelizes; supports discovery, migration, and auto-mated installation of executables; and is language-independent.Though each operator can be a native executable for high per-formance, one would not generally elect to do intensive com-puting as a complex SciFlo operation.
B. Features of SciFlo
Here we sketch the SciFlo design and its key technologies.We plan to build two versions: an operational prototype with asubset of features, to be exercised in several science investiga-tions, followed by a full-function, operational system.
Hardware Paradigm. A SciFlo server will be deployed on alocal cluster – Unix stations, Linux PC’s, rack-mounted serverblades – at the host site, and link with remote SciFlo serversacross the web, presenting a broad mix of latencies.
Streaming Data Between Operators. The data transfermethod determines the granularity of operators that can beexecuted efficiently. In a tightly-coupled cluster, in-memorytransfer can be used. For loosely-coupled computing, smallobjects can be sent in binary or XML formats and larger objectsin files by ftp. SciFlo occupies the loosely-coupled domainsupporting large and small objects with three modes of transfer:
• Large – via ftp and DODS URL’s, or (locally) via shared diskspace;• Medium – via extended DODS URL’s and the OpenDAPprotocol;• Small – in XML text within a flow document.
Data and Operator Types. SciFlo will name objects hierarchi-cally and use XML schemas to describe types. The Earth ScienceMarkup Language (ESML) is an XML specification for syntacticmetadata (structure, type, format) indicating what each variablerepresents, and other “content” metadata for discovery. Sci-Flow will adopt existing ESML descriptions and create newones. We will also provide a placeholder for “kind” data toallow for later semantic web advances. Each data object andoperator will be labeled with both a type and a kind. Type andkind elements can be formally represented in a semantic ontol-ogy using the Resource Description Framework (RDF).
Names will be assigned with root ‘sfl’ (SciFlo). An AIRSgranule containing all Level 2 products, for example, would betype ‘sfl.data.airs.l2.granule’ while a MODIS temperature gran-ule would be type ‘sfl.data.modis.l2.temperatureGranule’. Anoperator to co-register data from two swaths would be type‘sfl.op.coreg.swath2swath’. The HDF file type will be deter-mined both by the name and an XML schema describing vari-ables and attributes.
Parallel Computing. The SciFlo server will apply parallelismat many levels:
• Within a single operator
• With multiple processes on a single node• With multiple threads within a forked process to execute,
monitor, and respond to queries• With multiple processes created by launching operators or
sub-flows on local nodes• By invoking a remote operator via a SOAP or WCS call and
waiting for the results• By redirecting a flow or sub-flow to a server that can access a
data source locally or that can efficiently execute a CPU-intensive operator
• By partially evaluating a flow and then redirecting• By invoking a flow multiple times if the source operator(s)
yield multiple object/files that need to be processed (implicitfile parallelism)
Flow Execution. Based on the expected execution time andcomputing resources described in the flow specification, flowswill be executed in either immediate or queued mode. If theimmediate mode is specified and the run time exceeds a thresh-hold in the server configuration file, the flow may be aborted.The execution process consists of:
• arrival – flow execution request arrives at server• syntax check – see if document is well-formed• queue – push the flow onto an execution queue• dequeue – move the flow to the execution phase• parse – validate document against XML schema• type check – verify that operator input/output data will be of
the correct types• embellish – insert implicit unit or format conversions to fill in
missing steps• plan – determine the execution plan and annotate the flow
document accordingly• execute – execute parallel flow according to plan• deliver – deliver results to the requester
At first, ‘embellish’ will supply minor missing steps using unitand format conversion operators. Later, it will be possible toleave out more substantial steps and have them automaticallyfilled with the “best” operator that can be discovered in thecatalog. The flow author can also specify conversion operatorsthat should be used to fill gaps. The user will receive the em-bellished flow document. Delivery consists in returning resultsin XML to the SciFlo client or in HTML to a browser. Resultswill include intermediate and final data objects/files, the embel-lished flow document, and an execution log.
Server Operation. The execution engine comprises separateprocesses, executing on one node or many, that talk via SOAP;an XML file will specify the node configuration to employ. Theserver is a SOAP service and can register itself in a UDDIcatalog; one could then use UDDI discovery to find SciFlonodes to combine. Thus, SciFlo will function as an adaptiveparallel server that can be reconfigured by editing XML files.
Fig. 5 depicts the SciFlo master server and its links to otherservers. Front-end nodes field requests, check them, and pushthem to a queue. A master node retrieves the flow and executes

it through the planning phase. If the plan calls for flow redi-rection, the annotated flow document will be sent to the properserver. If the flow starts locally, parallel execution will begin ona master server and may tap multiple CPU’s. The figure showsseveral remote operators executing, starting at the JPL DAAC.
Front-endReceives Requests
Queue ofPending Flows
SOAP
Master ServerPlans
Execution
Local SciFlow Server at JPL DAAC
Parallel ExecutionEngine
SOAP
SOAP
SciFlow ServerAt DAAC or ESIP
RedirectFlow
GENESIS ESIP
Co-registrationSOAP Call
Goddard DAACSubsetting
SciFlow ServerAt Langley DAAC
WCSCall
Execute
EOSClearinghouse
Metadata
SOAPQuery
SubFlow
Fig. 5. Flowchart of SciFlo distributed computing.
USAGE SCENARIOS
We envisage SciFlo being used in at least three kinds of sce-narios: large-scale automated data processing; as a toolkit tocreate custom services; and for scientific discovery. The firsthas been amply illustrated; here we discuss the other two.
Software Toolkit. To illustrate the power of combining op-erators, consider constructing a service for swath granules thatprovides time, location, and parameter subsetting, and aggre-gates the product over time. This can be realized in four steps:(1) find granules within the time range, (2) intersect each gran-ule with the lat/lon/alt region, (3) subset the surviving granules,and (4) aggregate them over time. Each step can be captured ina reusable operator; new subsetters can then be built by assem-bling the blocks in a variety of flows. A scientist could con-struct a custom subset and aggregation operation and call itfrom a browser with a WCS-like URL. This way SciFlo canbuild hundreds of custom services with a similar interface.
Scientific Discovery. Example: Dolores creates a SciFlo bycompleting a web form, uses a web page to install it as a SOAPservice and gets back a link to call it with. She receives the out-put file, then switches to IDL to use the DODS URL to re-trieve results of interest. (Or, she can use a flow with an in-lineIDL program.) She tells Waldo about this service and he surfsin, changing parameters at will for variant studies. One missingelement is an ability to invoke the analysis within IDL. As theSOAP revolution grows, IDL, Matlab, and their ilk will addSOAP calls. When that hole is plugged, the informed scientistwill be able to do it all from IDL or Matlab.
DATA MINING BY SUMMARIZATION
Two challenges posed by EOS data are their volume andmultivariate complexity – i.e., the intricate relationships amongparameters as they evolve in time and space. Beyond the prac-
tical problems of managing such data, there are analytical issues:How can we combine data from different sources? How canone uncover unexpected relationships? For mixed datasets akey question is, What are the hidden connections and how dothey evolve? A challenge for the scientist is to frame suchquestions as testable hypotheses about features of multivariatedistributions. This requires tractable representations that pre-serve the features. To that end GENESIS will:
• Create a summarization tool that preserves approximate mul-tivariate distributions. A “quantization” method used in sig-nal processing yields summarized data that can be analyzed asif they were the original products, with little loss of fidelity.
• Generate summarized data products organized by source,including MISR cloud properties, MISR aerosol properties,and AIRS moisture and temperature profiles and cloud frac-tion. Each product is an estimate of the joint data distribu-tion for each 1°x1° spatial cell, over a specified interval.
• Create SciFlo operators to build dynamic, user-defined sum-mary datasets from static, precomputed base summary prod-ucts. For example, a user wanting to test whether some non-linear function of AIRS moisture at several altitudes can helppredict cloud fraction could execute a non-linear regressionoperator and obtain only that result. To rerun variations, theuser may prefer simply to order the base product.
• Create SciFlo operators for combining summary productsfrom different sources. For this we will examine severalparadigms: traditional methods of matching or interpolatingnearby observations; geo-statistical methods, as in [3]; andnew methods for inferring joint distributions given only therelevant marginal distributions, as in [7] and [8].
A. Summarization Applications
Summarized data allow scientists to estimate arbitrary multi-variate functions and attach realistic uncertainties to them.Traditional Level 3 products provide only the mean and vari-ance of individual parameters at coarse spatio-temporal reso-lution, limiting potential investigations. Some analysts also pro-vide covariances, correlations, or regressions between selectedparameters pairs – useful but still incomplete. Where linear re-gressions are given, information on relationships that are non-linear, or among three or more quantities, or between unse-lected pairs is lost. Moreover, realistic information about thedata distribution is required for accurate uncertainty measures.
Suppose we wish to estimate the fraction of cloudy pixels ofa given type in one grid cell. Assignment of pixels to cloud typeis generally made from cloud-top pressure and optical thicknessdata. With just the means and variances, one would have toassign all pixels in a cell to a single class represented by themean. One needs the distribution to describe within-grid varia-tion. In [9] we compared the fraction of deep convectionclouds estimated from the original data (160 MB) to that fromsummarized data reduced by more than x1000 (145 KB), ob-taining nearly very similar results (Fig. 6).
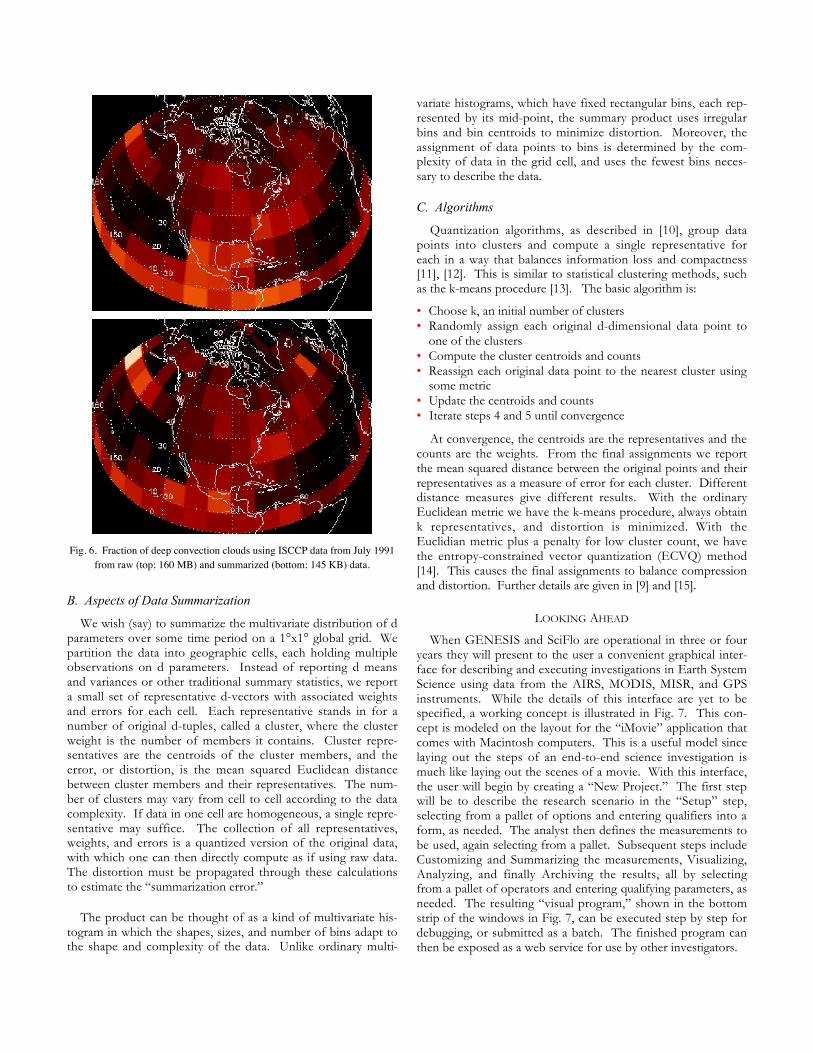
Fig. 6. Fraction of deep convection clouds using ISCCP data from July 1991from raw (top; 160 MB) and summarized (bottom; 145 KB) data.
B. Aspects of Data Summarization
We wish (say) to summarize the multivariate distribution of dparameters over some time period on a 1°x1° global grid. Wepartition the data into geographic cells, each holding multipleobservations on d parameters. Instead of reporting d meansand variances or other traditional summary statistics, we reporta small set of representative d-vectors with associated weightsand errors for each cell. Each representative stands in for anumber of original d-tuples, called a cluster, where the clusterweight is the number of members it contains. Cluster repre-sentatives are the centroids of the cluster members, and theerror, or distortion, is the mean squared Euclidean distancebetween cluster members and their representatives. The num-ber of clusters may vary from cell to cell according to the datacomplexity. If data in one cell are homogeneous, a single repre-sentative may suffice. The collection of all representatives,weights, and errors is a quantized version of the original data,with which one can then directly compute as if using raw data.The distortion must be propagated through these calculationsto estimate the “summarization error.”
The product can be thought of as a kind of multivariate his-togram in which the shapes, sizes, and number of bins adapt tothe shape and complexity of the data. Unlike ordinary multi-
variate histograms, which have fixed rectangular bins, each rep-resented by its mid-point, the summary product uses irregularbins and bin centroids to minimize distortion. Moreover, theassignment of data points to bins is determined by the com-plexity of data in the grid cell, and uses the fewest bins neces-sary to describe the data.
C. Algorithms
Quantization algorithms, as described in [10], group datapoints into clusters and compute a single representative foreach in a way that balances information loss and compactness[11], [12]. This is similar to statistical clustering methods, suchas the k-means procedure [13]. The basic algorithm is:
• Choose k, an initial number of clusters• Randomly assign each original d-dimensional data point to
one of the clusters• Compute the cluster centroids and counts• Reassign each original data point to the nearest cluster using
some metric• Update the centroids and counts• Iterate steps 4 and 5 until convergence
At convergence, the centroids are the representatives and thecounts are the weights. From the final assignments we reportthe mean squared distance between the original points and theirrepresentatives as a measure of error for each cluster. Differentdistance measures give different results. With the ordinaryEuclidean metric we have the k-means procedure, always obtaink representatives, and distortion is minimized. With theEuclidian metric plus a penalty for low cluster count, we havethe entropy-constrained vector quantization (ECVQ) method[14]. This causes the final assignments to balance compressionand distortion. Further details are given in [9] and [15].
LOOKING AHEAD
When GENESIS and SciFlo are operational in three or fouryears they will present to the user a convenient graphical inter-face for describing and executing investigations in Earth SystemScience using data from the AIRS, MODIS, MISR, and GPSinstruments. While the details of this interface are yet to bespecified, a working concept is illustrated in Fig. 7. This con-cept is modeled on the layout for the “iMovie” application thatcomes with Macintosh computers. This is a useful model sincelaying out the steps of an end-to-end science investigation ismuch like laying out the scenes of a movie. With this interface,the user will begin by creating a “New Project.” The first stepwill be to describe the research scenario in the “Setup” step,selecting from a pallet of options and entering qualifiers into aform, as needed. The analyst then defines the measurements tobe used, again selecting from a pallet. Subsequent steps includeCustomizing and Summarizing the measurements, Visualizing,Analyzing, and finally Archiving the results, all by selectingfrom a pallet of operators and entering qualifying parameters, asneeded. The resulting “visual program,” shown in the bottomstrip of the windows in Fig. 7, can be executed step by step fordebugging, or submitted as a batch. The finished program canthen be exposed as a web service for use by other investigators.

ACKNOWLEDGMENT
The work described in this paper was carried out by the JetPropulsion Laboratory, California Institute of Technology, un-der contract with the National Aeronautics and Space Admini-stration.
REFERENCES
[1] National Aeronautics and Space Administration, “Earth Science EnterpriseStrategy,” NP-2003-10-318-HQ, Oct 2003, 86 pp. (http://www.nasa.gov).
[2] Hajj, G.A., C.O. Ao, B.A. Iijima, D. Kuang, E.R. Kursinski, A.M. Manucci,T.K. Meehan, L.J. Romans, M. de la Torre Juarez and T.P. Yunck,
CHAMP and SAC-C atmospheric occultation results and intercompari-sons, J. Geophys. Res., 109, D06109, doi:10.1029/2003JD003909, 2004.
[3] Cressie, N.A.C. “Statistics for spatial data”, Wiley-Interscience, New York,1993, 900pp.
[4] Kamberova, G., R. Mandelbaum, M. Mintz and R. Bajcsy, Decision-theoretic approach to robust fusion of location data, J. Franklin Institute,336B, 2, 1997.
[5] Foster et al., The physiology of the Grid: An Open Grid Services architec-ture for distributed systems integration; also, Open Grid Service Infra-structure WG, Global Grid Forum, 22 Jun 2002. (http://www.globus.org/research/papers/ogsa.pdf).
[6] Shek, E.C., R.R. Muntz, E. Mesrobian and K. Ng, Scalable exploratory datamining of distributed geoscientific data, Second Intl. Conference on KnowledgeDiscovery and Data Mining, Portland, OR, Aug 1996.
Fig. 7. Mockup of a graphical interface for describing and executing end-to-end investigations in Earth system science with data from diverse re-mote sensing instruments. Steps include setup to describe the problem parameters (top), defining the measurements (left), and performing various
customizing, summarizing, visualizing, and analysis tasks (right). The result is a visual program (bottom strip) defining the full investigation.

[7] Dall’Aglio, G., S. Kotz and G. Salinetti, “Advances in probability distribu-tions with given marginals,” Kluwer AP, Boston, 1991, 236 pp.
[8] Han, T.S., Hypothesis testing with multiterminal data compression, IEEETrans. Information Theory, IT-33(6), 759-772, 1987.
[9] Braverman, A., Compressing massive geophysical datasets using vectorquantization, J. Computational and Graphical Statistics, 11(1), 44-62, 2002.
[10] Gersho, A. and R. Gray, “Vector quantization and signal compression,”Kluwer AP, Boston, 1991, 760 pp.
[11] Ash, R., “Information Theory”, Dover, New York, 1965, 339 pp.[12] Gray, R., “Source coding theory,” Kluwer AP, Boston, 1989, 209 pp.
[13] MacQueen, J.B., Some methods for classification and analysis of multivari-ate observations, Proc. Fifth Berkeley Symp on Mathematical Statistics and Prob-ability, 1, 281-296, 1967.
[14] Chou, P.A., T. Lookabaugh and R. Gray, Entropy-constrained vectorquantization, IEEE Transactions on Acoustics, Speech, and Signal Processing, 37,31-42, 1989.
[15] Braverman, A. and L. DiGirolamo, MISR global data products: a newapproach, IEEE Transactions on Geoscience and Remote Sensing, 40(7), 1626-1639, 2002.


![Genesis 1 2 [ ] Genesis 2-3 3 [ ] J AN UAR Y...J A N U A R Y 1 [_] Genesis 1 2 [_] Genesis 2-3 3 [_] Genesis 4-5 4 [_] Genesis 6-7 5 [_] Genesis 8-9 6 [_] Genesis 10-11 7 [_] Genesis](https://static.fdocuments.us/doc/165x107/60739b02ef6edb568a6ea6ad/genesis-1-2-genesis-2-3-3-j-an-uar-y-j-a-n-u-a-r-y-1-genesis-1-2.jpg)