Generic Linux Debugging - OVS Orbit · strace - userspace to kernel space API function tracer...
28
Generic Linux Debugging By Ansis Atteka Open vSwitch Team May 17th, 2018
Transcript of Generic Linux Debugging - OVS Orbit · strace - userspace to kernel space API function tracer...

Generic Linux DebuggingBy Ansis Atteka
Open vSwitch Team
May 17th, 2018

Network debugging, which is:
● about using networking Interfaces (NSX Controller REST API, ip-route,
OVSDB, tcpdump e.t.c.);
● very useful at isolating issues to a specific subsystem (or feature).
Execution debugging, which is:
● about using tracers, debuggers and profilers (trace-cmd, strace, gdb e.t.c.);
● very useful at root causing bugs in product. The talk will be about this topic.
In NSBU we do...

Must Read #1
“The Linux Programming Interface” by Michael
Kerrisk
1. Otherwise, you may not know what system
calls are out there in Linux; AND
2. What are common practices to implement
subprograms around those system calls (e.g.
signal handlers, non-blocking server).
Must Read #2
“Reversing: Secrets of Reverse Engineering”
by Eldad Eilam
1. Windows centric;
2. However, has good information about how to
analyze stacktraces from hex dumps and
interpret assembly patterns (function
prologue, epilogue) emitted from compiler.

Must Read #3
And most importantly:
● man 2 <syscall>
● man strace
● man trace-cmd

Ideal tracer that, unfortunately, does not exist
● Can trace user-space functions
● Can log arguments passed to functions
● Can log return values from functions
● Can trace kernel-space functions
● Can automatically attach to child processes
● Can trace memory references
● Can trace callees
● Can automatically trace the process on the other side of the socket that read()
data
As you can see tracers are fragmented and you better learn all of them.
strace
trace-cmd

Practical tracers, that I use
The ones that come with Ubuntu or RHEL and are easily yum’able and apt-
get’able:
● strace - userspace to kernel space API function tracer
● trace-cmd - kernel function and function graph tracer
There are other tools with tracing capabilities like uprobes and kprobes with BPF
programs - only on latest Linux distros. Or GDB asynchronous mode - somewhat
hard to use.

strace
Traces the Linux API calls between user-space process and Linux kernel.
1. Can get error codes from kernel
2. Can get arguments
3. Can provide latencies
4. Can attach to child processes
5. Can get userspace stacktrace that lead to system call
6. Hack use-case: Can inject error codes to see if user space can recover
7. Hack use-case: Can slow down user-space process to trigger race conditions
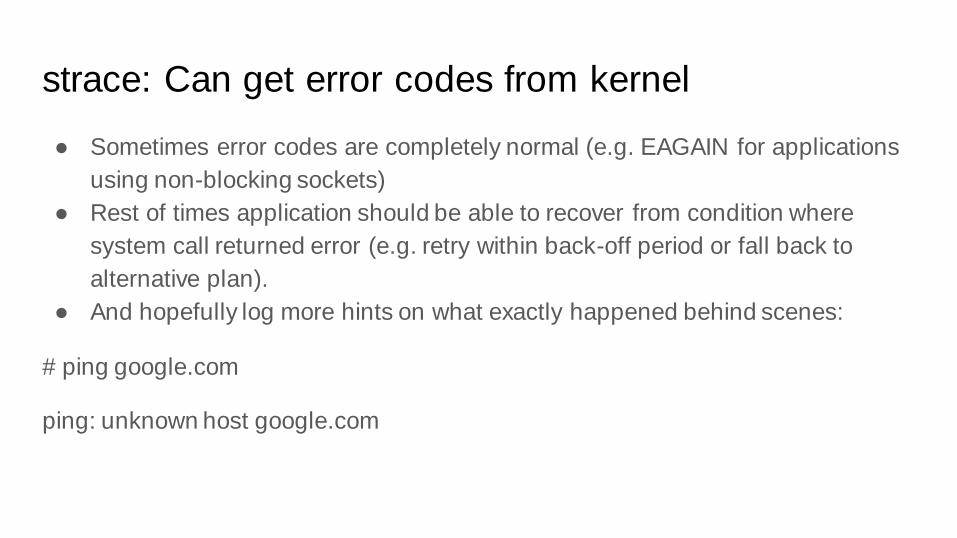
● Sometimes error codes are completely normal (e.g. EAGAIN for applications
using non-blocking sockets)
● Rest of times application should be able to recover from condition where
system call returned error (e.g. retry within back-off period or fall back to
alternative plan).
● And hopefully log more hints on what exactly happened behind scenes:
# ping google.com
ping: unknown host google.com
strace: Can get error codes from kernel

strace: Can get error codes from kernel (example)
# strace ping google.com
....
open("/etc/resolv.conf", O_RDONLY|O_CLOEXEC) = -1 EACCES (Permission
denied)
...
write(2, "ping: unknown host google.com\n", 30) = 30

strace: Can get arguments
● Sniff write(), read(), send(), sendto(), recv() calls with sockets, files, pipes.
Ultimate proof that process received packet. Use -s <len> flag to limit how
many bytes to print;
● Know the file descriptor that came back from open() or socket() call. Use -y or
-yy flags to avoid unnecessary ̀ lsof -p <pid>` usage;
● Works best to with clear text communications (Not so much TLS).
● Can dump data/arrays in hex. Use -x flag.
How to prove that process actually received a packet?

strace: Can get arguments (example)
# strace -x -yy -f /sbin/dhclient -1 -v …
28807 socket(PF_INET, SOCK_DGRAM, IPPROTO_UDP) = 6<UDP:[152372]>
28807 bind(6<UDP:[152372]>, {sa_family=AF_INET, sin_port=htons(68), sin_addr=inet_addr("0.0.0.0")},
16) = 0
...
28824 recvfrom(6<UDP:[0.0.0.0:68]>,
"\x02\x01\x06\x00\x75\x4b\xd5\x5f\x00\x00\x00\x00\x0a\x00\x02\x0f\x0a\x00\x02\x0f\x0a\x00\x02\x04\
x00\x00\x00\x00\x08\x00\x27\x44"..., 1540, 0, {sa_family=AF_INET, sin_port=htons(67),
sin_addr=inet_addr("10.0.2.2")}, [16]) = 548

strace: Can provide latencies
Allows to easy find out:
● How exactly user-space process spent a lot of time in kernel?
● Between which two system calls user space process spent a lot of time
“computing” something?
● Use strace’s -T, -r, -t[tt] flags
Why process becomes slow/unresponsive at times?
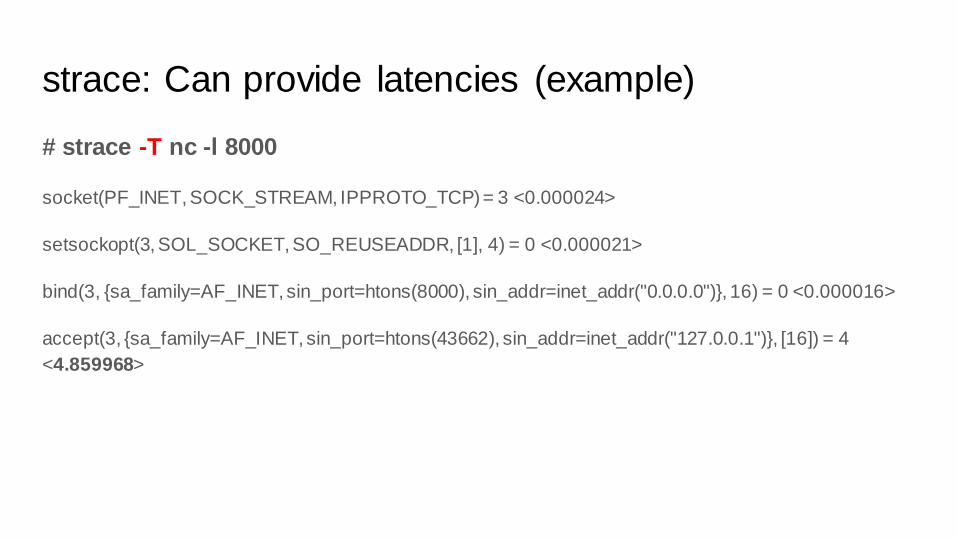
strace: Can provide latencies (example)
# strace -T nc -l 8000
socket(PF_INET, SOCK_STREAM, IPPROTO_TCP) = 3 <0.000024>
setsockopt(3, SOL_SOCKET, SO_REUSEADDR, [1], 4) = 0 <0.000021>
bind(3, {sa_family=AF_INET, sin_port=htons(8000), sin_addr=inet_addr("0.0.0.0")}, 16) = 0 <0.000016>
accept(3, {sa_family=AF_INET, sin_port=htons(43662), sin_addr=inet_addr("127.0.0.1")}, [16]) = 4
<4.859968>

strace: Can attach to child process
● Strace by default does not attach to child process
● Use strace’s -f flag to trace child processes
● Useful to fully trace `/etc/init.d/openvswitch-switch restart` command where○ init.d script process starts ovs-ctl process
○ ovs-ctl process starts ovs-vswitchd, modprobe
● As an example let’s troubleshoot issue:
# /etc/init.d/openvswitch restart
...
could not insert 'openvswitch': Protocol wrong type for socket”
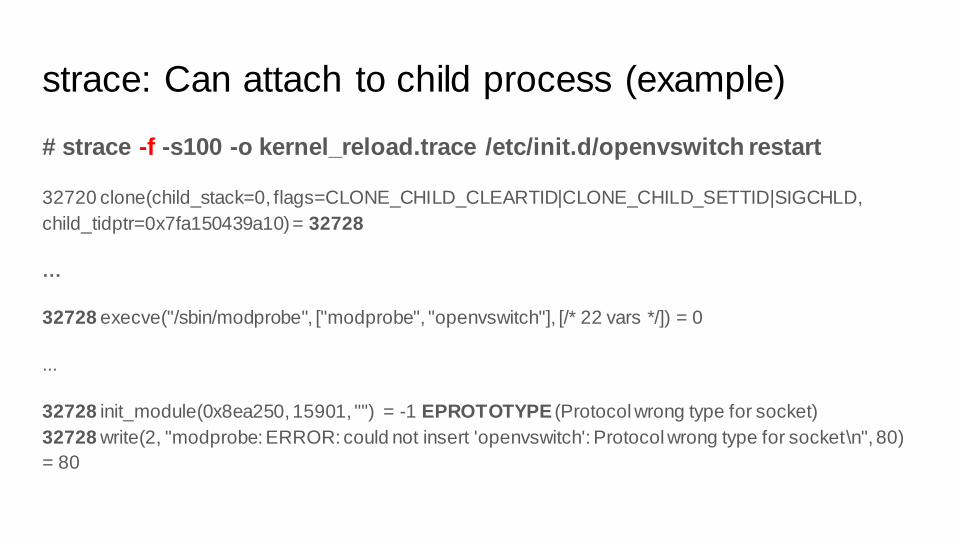
strace: Can attach to child process (example)
# strace -f -s100 -o kernel_reload.trace /etc/init.d/openvswitch restart
32720 clone(child_stack=0, flags=CLONE_CHILD_CLEARTID|CLONE_CHILD_SETTID|SIGCHLD,
child_tidptr=0x7fa150439a10) = 32728
…
32728 execve("/sbin/modprobe", ["modprobe", "openvswitch"], [/* 22 vars */]) = 0
...
32728 init_module(0x8ea250, 15901, "") = -1 EPROTOTYPE (Protocol wrong type for socket)
32728 write(2, "modprobe: ERROR: could not insert 'openvswitch': Protocol wrong type for socket\n", 80)
= 80

strace: Can get userspace stacktrace
● Use strace’s -k flag to get user space process stacktrace
● Does not work with strace that is not linked against libunwind. On such
systems resort to the inferior -i flag that logs immediate caller via RIP register.
● Mostly helpful for C/C++ and not for interpreters like Python
● Useful to pinpoint one of the many user-space functions calling the actual
system call
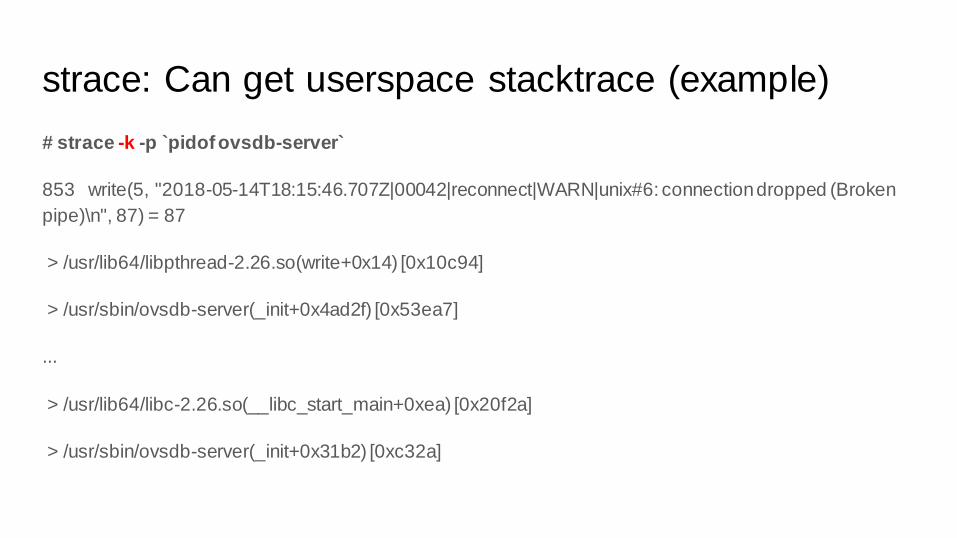
strace: Can get userspace stacktrace (example)
# strace -k -p `pidof ovsdb-server`
853 write(5, "2018-05-14T18:15:46.707Z|00042|reconnect|WARN|unix#6: connection dropped (Broken
pipe)\n", 87) = 87
> /usr/lib64/libpthread-2.26.so(write+0x14) [0x10c94]
> /usr/sbin/ovsdb-server(_init+0x4ad2f) [0x53ea7]
...
> /usr/lib64/libc-2.26.so(__libc_start_main+0xea) [0x20f2a]
> /usr/sbin/ovsdb-server(_init+0x31b2) [0xc32a]
strace: slow down process
● strace is quite safe most of the time;
● However, if product has race condition bugs, then strace can mess up timings
and expose race conditions. Tell customer before attaching.
● Use -o <file> flag to write to file instead of STDERR

strace: inject errors
● Enables easy fuzz testing
● User space process should be able to recover from○ Either retry the same system call later; OR
○ Fall back to backup mechanism; OR
○ Gracefully abort process by logging reason on what happened
● Use strace’s -e fault=set[:error=errno][:when=expr] flag

strace: inject errors (example)
# strace -e fault=sendto:error=EPERM:when=3+ ping 8.8.8.8
PING 8.8.8.8 (8.8.8.8) 56(84) bytes of data.
64 bytes from 8.8.8.8: icmp_seq=1 ttl=63 time=4.82 ms
64 bytes from 8.8.8.8: icmp_seq=2 ttl=63 time=4.88 ms
ping: sendmsg: Operation not permitted
trace-cmd
Traces functions in kernel space executed by process or kernel thread. Can also
trace callees. However:
● Can’t get error codes from functions (except in some cases)
● Can’t get arguments
● Can get latencies
● Can’t trace user-space functions
But you can speculate about function return codes and function arguments by
looking at kernel source code and callees (assuming no spaghetti code).

trace-cmd: function graph
# trace-cmd record -p function_graph -F ping 1.1.1.1
Or
# trace-cmd record -p function_graph -p <pidof qemu>
Or
# trace-cmd record -p function_graph -p <pidof ksoftirqd/XXX>
Or
# trace-cmd record -p function_graph -p <pidof ovs-vswitchd>
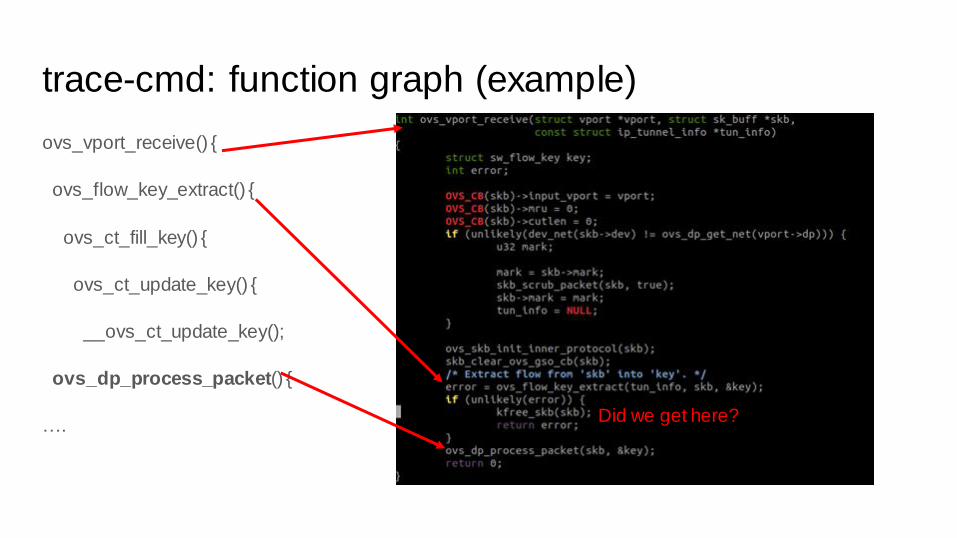
trace-cmd: function graph (example)
ovs_vport_receive() {
ovs_flow_key_extract() {
ovs_ct_fill_key() {
ovs_ct_update_key() {
__ovs_ct_update_key();
ovs_dp_process_packet() {
….Did we get here?
trace-cmd: events
● Use -e flag to get information about kernel events
● Sometimes can help to extract arguments from system calls
● And get error codes from system calls

trace-cmd: events (example)
sys_enter: NR 165 (44a4c4, 444a5a, 445c55, 104000, 0, 13)
sys_enter_mount: dev_name: 0x0044a4c4, dir_name: 0x00444a5a, type:
0x00445c55, flags: 0x00104000, data: 0x00000000
...
sys_exit: NR 165 = 0
sys_exit_mount: 0x0

Q&A


![Everything You Wanted to Know about the Kernel Trick · A Kernel Function is a function [notation] that obeys certain mathematical properties. I won't go into these properties right](https://static.fdocuments.us/doc/165x107/5f406e5481f8712e795f8cbd/everything-you-wanted-to-know-about-the-kernel-a-kernel-function-is-a-function-notation.jpg)