
Generation Z and Money Survey 2013s1.q4cdn.com/959385532/files/doc_downloads/research/Gen...Gen Z:...
50
Generation Z and Money Survey 2013 Understanding Tomorrow’s Investors May, 2013
Transcript of Generation Z and Money Survey 2013s1.q4cdn.com/959385532/files/doc_downloads/research/Gen...Gen Z:...

Generation Z and Money Survey 2013
Understanding Tomorrow’s Investors May, 2013
Table of Contents Research Method 3
Meet Gen Z 4
Financial Holdings and Attitudes 12
Gen Z as Consumers 19
Attitudes, Planning and Saving for Education 25
Moving Out of Home 30
Attitudes About and Expectations of Working Life 37
Attitudes About, Planning for and Saving for Retirement 45
Appendix: Study Sample Characteristics 49
TD Ameritrade is a trademark jointly owned by TD Ameritrade IP Company, Inc. and The Toronto-Dominion Bank. © 2013 TD Ameritrade IP Company, Inc. All rights reserved. Used with permission TD Ameritrade Holding Corp (NYSE:AMTD). TD Ameritrade is a trademark jointly owned by TD Ameritrade IP Company, Inc. and the Toronto-Dominion Bank. © 2013 TD Ameritrade IP Company, Inc. All rights reserved. Used with permission.
2
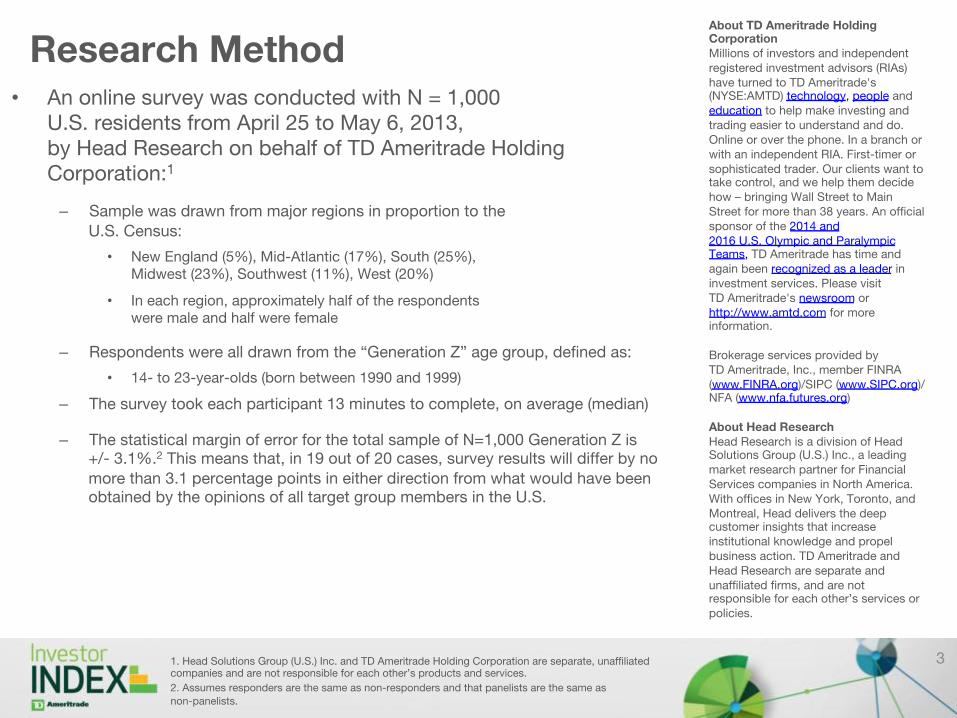
Research Method • An online survey was conducted with N = 1,000
U.S. residents from April 25 to May 6, 2013, by Head Research on behalf of TD Ameritrade Holding Corporation:1
– Sample was drawn from major regions in proportion to the U.S. Census:
• New England (5%), Mid-Atlantic (17%), South (25%), Midwest (23%), Southwest (11%), West (20%)
• In each region, approximately half of the respondents were male and half were female
– Respondents were all drawn from the “Generation Z” age group, defined as:
• 14- to 23-year-olds (born between 1990 and 1999)
– The survey took each participant 13 minutes to complete, on average (median)
– The statistical margin of error for the total sample of N=1,000 Generation Z is +/- 3.1%.2 This means that, in 19 out of 20 cases, survey results will differ by no more than 3.1 percentage points in either direction from what would have been obtained by the opinions of all target group members in the U.S.
1. Head Solutions Group (U.S.) Inc. and TD Ameritrade Holding Corporation are separate, unaffiliated companies and are not responsible for each other’s products and services.
2. Assumes responders are the same as non-responders and that panelists are the same as non-panelists.
About TD Ameritrade Holding Corporation Millions of investors and independent registered investment advisors (RIAs) have turned to TD Ameritrade's (NYSE:AMTD) technology, people and education to help make investing and trading easier to understand and do. Online or over the phone. In a branch or with an independent RIA. First-timer or sophisticated trader. Our clients want to take control, and we help them decide how – bringing Wall Street to Main Street for more than 38 years. An official sponsor of the 2014 and 2016 U.S. Olympic and Paralympic Teams, TD Ameritrade has time and again been recognized as a leader in investment services. Please visit TD Ameritrade's newsroom or http://www.amtd.com for more information. Brokerage services provided by TD Ameritrade, Inc., member FINRA (www.FINRA.org)/SIPC (www.SIPC.org)/NFA (www.nfa.futures.org) About Head Research Head Research is a division of Head Solutions Group (U.S.) Inc., a leading market research partner for Financial Services companies in North America. With offices in New York, Toronto, and Montreal, Head delivers the deep customer insights that increase institutional knowledge and propel business action. TD Ameritrade and Head Research are separate and unaffiliated firms, and are not responsible for each other’s services or policies.
3

Meet Gen Z
4
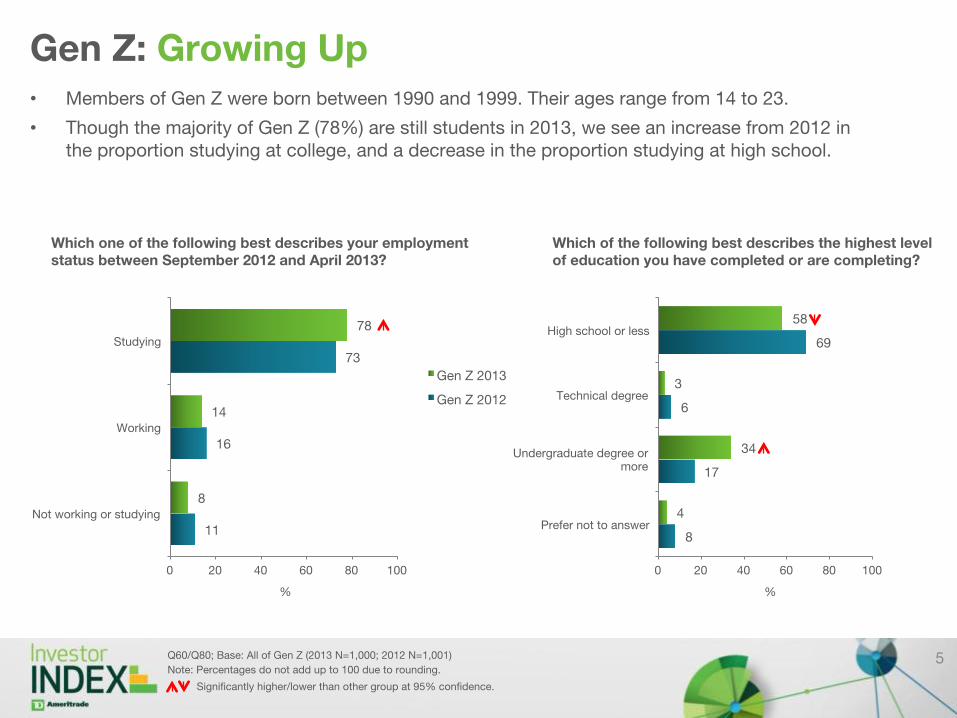
Gen Z: Growing Up • Members of Gen Z were born between 1990 and 1999. Their ages range from 14 to 23.
• Though the majority of Gen Z (78%) are still students in 2013, we see an increase from 2012 in the proportion studying at college, and a decrease in the proportion studying at high school.
5 Q60/Q80; Base: All of Gen Z (2013 N=1,000; 2012 N=1,001)
Note: Percentages do not add up to 100 due to rounding.
11
16
73
8
14
78
0 20 40 60 80 100
Not working or studying
Working
Studying
%
Which one of the following best describes your employment status between September 2012 and April 2013?
Gen Z 2013
Gen Z 2012
8
17
6
69
4
34
3
58
0 20 40 60 80 100
Prefer not to answer
Undergraduate degree or more
Technical degree
High school or less
%
Which of the following best describes the highest level of education you have completed or are completing?
Significantly higher/lower than other group at 95% confidence.
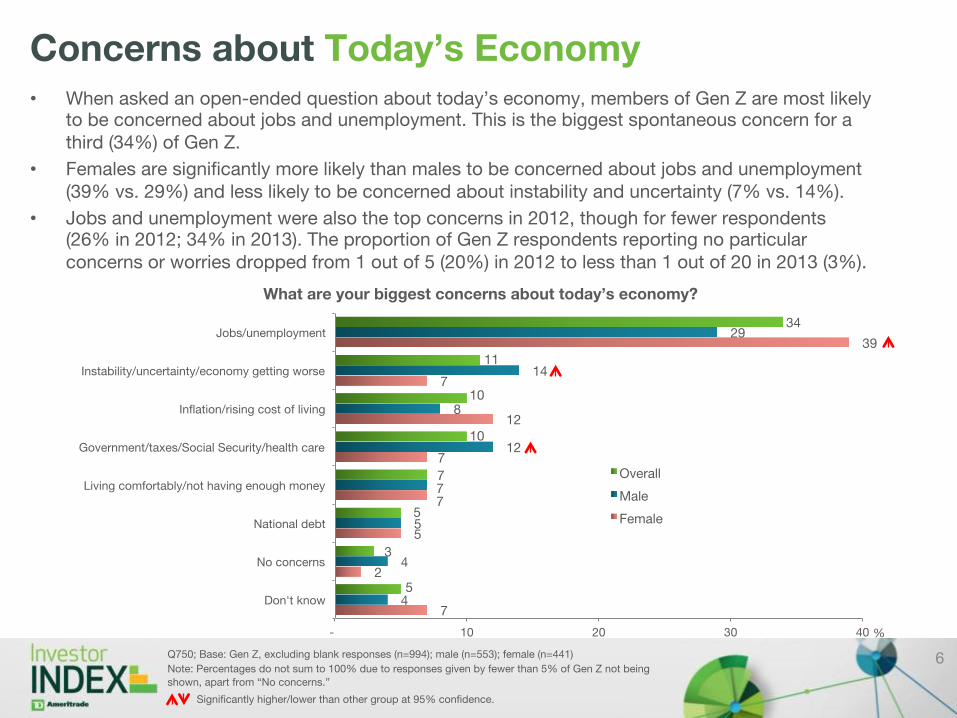
Concerns about Today’s Economy • When asked an open-ended question about today’s economy, members of Gen Z are most likely
to be concerned about jobs and unemployment. This is the biggest spontaneous concern for a third (34%) of Gen Z.
• Females are significantly more likely than males to be concerned about jobs and unemployment (39% vs. 29%) and less likely to be concerned about instability and uncertainty (7% vs. 14%).
• Jobs and unemployment were also the top concerns in 2012, though for fewer respondents (26% in 2012; 34% in 2013). The proportion of Gen Z respondents reporting no particular concerns or worries dropped from 1 out of 5 (20%) in 2012 to less than 1 out of 20 in 2013 (3%).
6
7
2
5
7
7
12
7
39
4
4
5
7
12
8
14
29
5
3
5
7
10
10
11
34
- 10 20 30 40
Don't know
No concerns
National debt
Living comfortably/not having enough money
Government/taxes/Social Security/health care
Inflation/rising cost of living
Instability/uncertainty/economy getting worse
Jobs/unemployment
%
What are your biggest concerns about today’s economy?
Overall
Male
Female
Significantly higher/lower than other group at 95% confidence.
Q750; Base: Gen Z, excluding blank responses (n=994); male (n=553); female (n=441)
Note: Percentages do not sum to 100% due to responses given by fewer than 5% of Gen Z not being
shown, apart from “No concerns.”
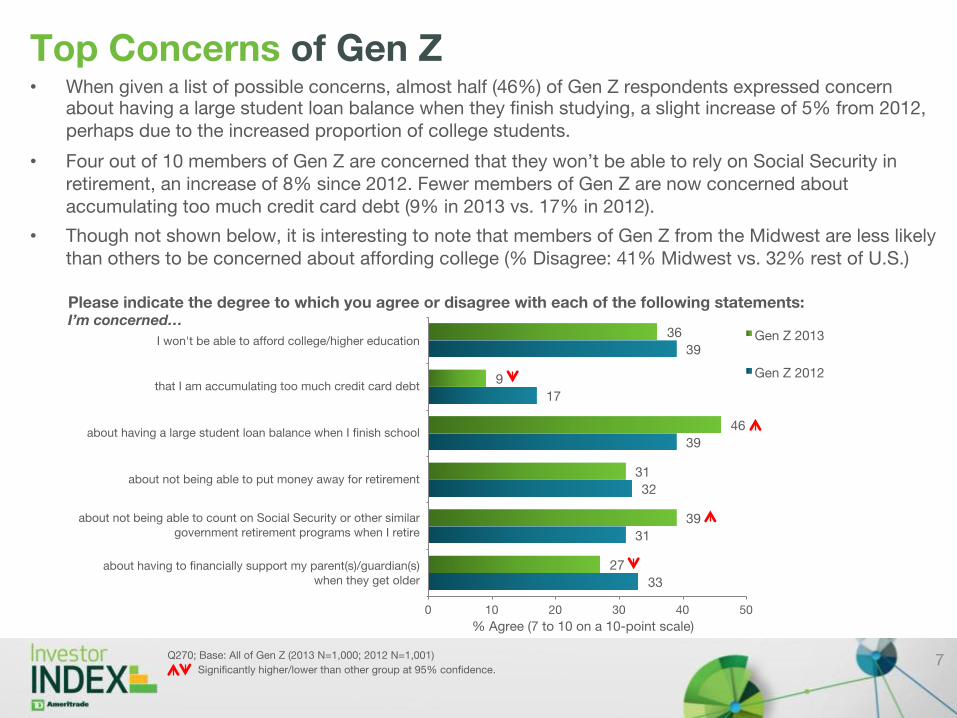
Please indicate the degree to which you agree or disagree with each of the following statements: I’m concerned…
Top Concerns of Gen Z • When given a list of possible concerns, almost half (46%) of Gen Z respondents expressed concern
about having a large student loan balance when they finish studying, a slight increase of 5% from 2012, perhaps due to the increased proportion of college students.
• Four out of 10 members of Gen Z are concerned that they won’t be able to rely on Social Security in retirement, an increase of 8% since 2012. Fewer members of Gen Z are now concerned about accumulating too much credit card debt (9% in 2013 vs. 17% in 2012).
• Though not shown below, it is interesting to note that members of Gen Z from the Midwest are less likely than others to be concerned about affording college (% Disagree: 41% Midwest vs. 32% rest of U.S.)
7 Q270; Base: All of Gen Z (2013 N=1,000; 2012 N=1,001)
33
31
32
39
17
39
27
39
31
46
9
36
0 10 20 30 40 50
Gen Z 2013
Gen Z 2012
% Agree (7 to 10 on a 10-point scale)
Significantly higher/lower than other group at 95% confidence.
I won't be able to afford college/higher education
that I am accumulating too much credit card debt
about having a large student loan balance when I finish school
about not being able to put money away for retirement
about not being able to count on Social Security or other similar government retirement programs when I retire
about having to financially support my parent(s)/guardian(s) when they get older
Please indicate the degree to which you agree or disagree with each of the following statements:
I’m concerned…
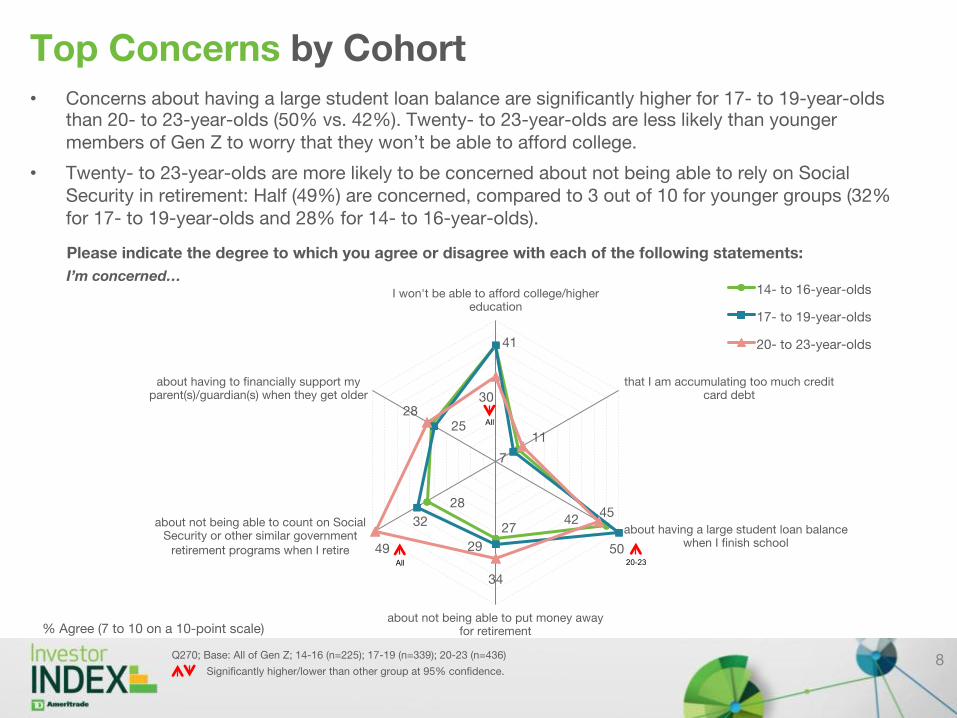
Top Concerns by Cohort • Concerns about having a large student loan balance are significantly higher for 17- to 19-year-olds
than 20- to 23-year-olds (50% vs. 42%). Twenty- to 23-year-olds are less likely than younger members of Gen Z to worry that they won’t be able to afford college.
• Twenty- to 23-year-olds are more likely to be concerned about not being able to rely on Social Security in retirement: Half (49%) are concerned, compared to 3 out of 10 for younger groups (32% for 17- to 19-year-olds and 28% for 14- to 16-year-olds).
8 Q270; Base: All of Gen Z; 14-16 (n=225); 17-19 (n=339); 20-23 (n=436)
41
45 27
28
7
50 29
32
25
30
11
42
34
49
28
0
5
10
15
20
25
30
35
40
45
50
I won't be able to afford college/higher education
that I am accumulating too much credit card debt
about having a large student loan balance when I finish school
about not being able to put money away for retirement
about not being able to count on Social Security or other similar government
retirement programs when I retire
about having to financially support my parent(s)/guardian(s) when they get older
14- to 16-year-olds
17- to 19-year-olds
20- to 23-year-olds
% Agree (7 to 10 on a 10-point scale)
Significantly higher/lower than other group at 95% confidence.
All 20-23
All
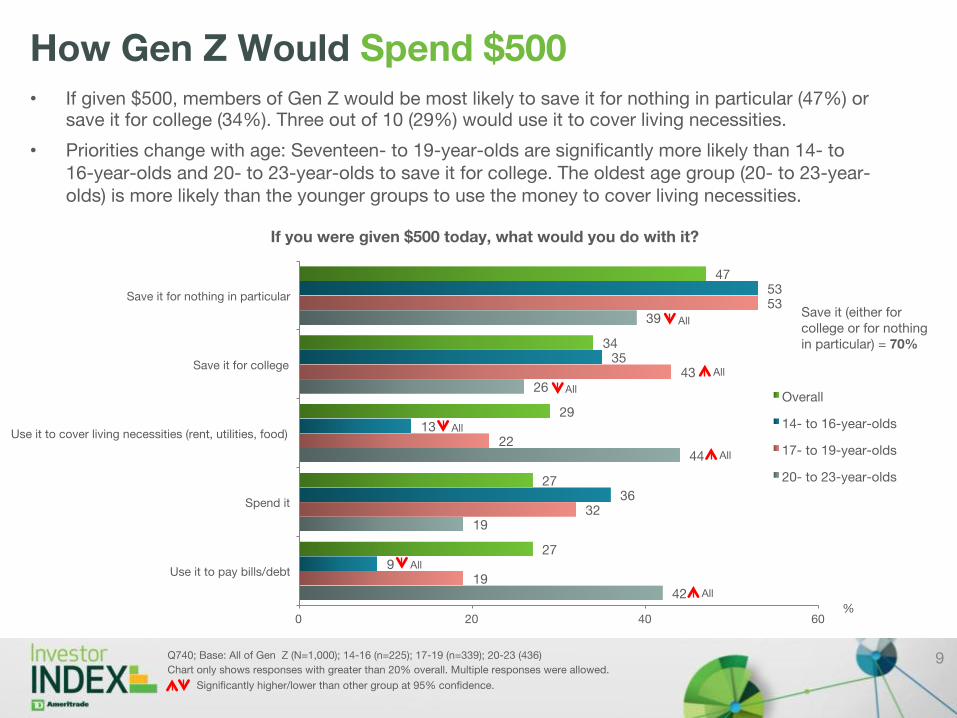
How Gen Z Would Spend $500 • If given $500, members of Gen Z would be most likely to save it for nothing in particular (47%) or
save it for college (34%). Three out of 10 (29%) would use it to cover living necessities.
• Priorities change with age: Seventeen- to 19-year-olds are significantly more likely than 14- to 16-year-olds and 20- to 23-year-olds to save it for college. The oldest age group (20- to 23-year-olds) is more likely than the younger groups to use the money to cover living necessities.
9 Q740; Base: All of Gen Z (N=1,000); 14-16 (n=225); 17-19 (n=339); 20-23 (436)
Chart only shows responses with greater than 20% overall. Multiple responses were allowed.
42
19
44
26
39
19
32
22
43
53
9
36
13
35
53
27
27
29
34
47
0 20 40 60
Use it to pay bills/debt
Spend it
Use it to cover living necessities (rent, utilities, food)
Save it for college
Save it for nothing in particular
%
If you were given $500 today, what would you do with it?
Overall
14- to 16-year-olds
17- to 19-year-olds
20- to 23-year-olds
All
Significantly higher/lower than other group at 95% confidence.
All
All
All
All All
All Save it (either for college or for nothing in particular) = 70%
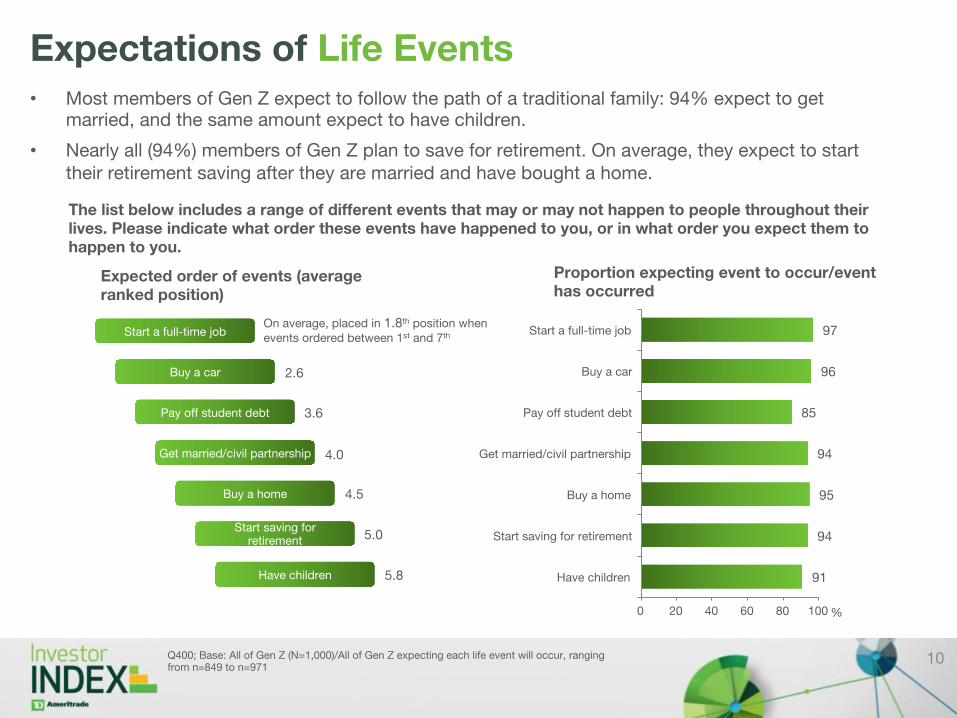
Expectations of Life Events
91
94
95
94
85
96
97
0 20 40 60 80 100
Have children
Start saving for retirement
Buy a home
Get married/civil partnership
Pay off student debt
Buy a car
Start a full-time job
%
Proportion expecting event to occur/event has occurred
10 Q400; Base: All of Gen Z (N=1,000)/All of Gen Z expecting each life event will occur, ranging from n=849 to n=971
The list below includes a range of different events that may or may not happen to people throughout their lives. Please indicate what order these events have happened to you, or in what order you expect them to happen to you.
Expected order of events (average ranked position)
Start a full-time job On average, placed in 1.8th position when events ordered between 1st and 7th
Buy a car 2.6
Pay off student debt 3.6
Get married/civil partnership 4.0
Buy a home 4.5
Start saving for retirement 5.0
Have children 5.8
• Most members of Gen Z expect to follow the path of a traditional family: 94% expect to get married, and the same amount expect to have children.
• Nearly all (94%) members of Gen Z plan to save for retirement. On average, they expect to start their retirement saving after they are married and have bought a home.
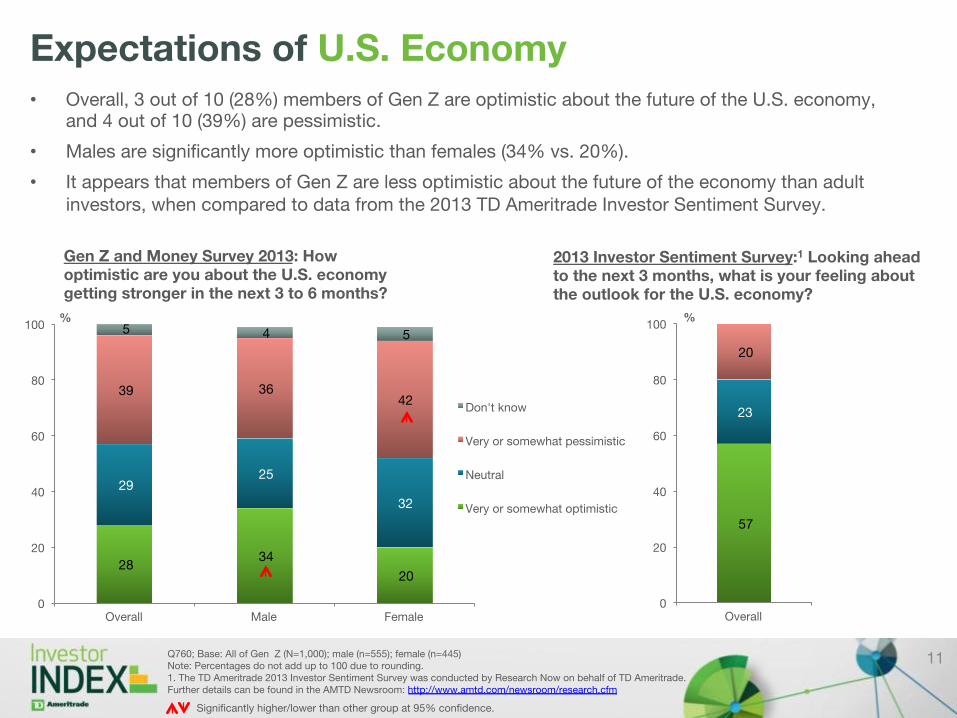
Expectations of U.S. Economy • Overall, 3 out of 10 (28%) members of Gen Z are optimistic about the future of the U.S. economy,
and 4 out of 10 (39%) are pessimistic.
• Males are significantly more optimistic than females (34% vs. 20%).
• It appears that members of Gen Z are less optimistic about the future of the economy than adult investors, when compared to data from the 2013 TD Ameritrade Investor Sentiment Survey.
11 Q760; Base: All of Gen Z (N=1,000); male (n=555); female (n=445) Note: Percentages do not add up to 100 due to rounding. 1. The TD Ameritrade 2013 Investor Sentiment Survey was conducted by Research Now on behalf of TD Ameritrade. Further details can be found in the AMTD Newsroom: http://www.amtd.com/newsroom/research.cfm
28 34
20
29 25
32
39 36 42
5 4 5
0
20
40
60
80
100
Overall Male Female
%
Don't know
Very or somewhat pessimistic
Neutral
Very or somewhat optimistic
Gen Z and Money Survey 2013: How optimistic are you about the U.S. economy getting stronger in the next 3 to 6 months?
Significantly higher/lower than other group at 95% confidence.
57
23
20
0
20
40
60
80
100
Overall
%
2013 Investor Sentiment Survey:1 Looking ahead to the next 3 months, what is your feeling about the outlook for the U.S. economy?

Financial Holdings and Attitudes
12

Financial Product Usage: Current Usage • More than two-thirds of Gen Z (69%) have a
savings account, and 6 out of 10 (60%) have a checking account.
• Three out of 10 (29%) members of Gen Z have a credit card and 1 out of 5 (21%) have a student loan.
• Gen Z respondents have significantly increased their holdings of savings accounts, checking accounts and student loans since 2012.
• Fewer than 1 out of 5 (17%) have none of the financial products listed - a decrease from almost 3 out of 10 (27%) in 2012.
• Though not shown here, the oldest Gen Z age group (20- to 23-year-olds) are significantly more likely than those who are under 20 to hold savings accounts, checking accounts, credit cards, student loans and 401(k)/403(b)s.
13 Q110; Base: All of Gen Z (2013 N=1,000; 2012 N=1,001)
Which of the following financial products, if any, do you have?
27
0
3
3
3
3
4
6
16
26
40
56
17
0
1
2
2
4
5
4
21
29
60
69
0 10 20 30 40 50 60 70 80
None of the above
I don't know
Other
IRA (traditional or ROTH)
Custodial IRA (for a minor)
Other vehicles like money market, etc.
401(k) or 403(b)
529 College Savings Plan
Student loan(s)
Credit card
Checking account
Savings account
Gen Z 2013
Gen Z 2012
Significantly higher/lower than other group at 95% confidence.
%

Budgeting Habits • More than half of Gen Z respondents follow a budget: A quarter (27%) follow one carefully and
another quarter (26%) follow one, but not very closely.
• The proportion following a budget carefully has dropped by more than 10% since 2012. A quarter (25%) of Gen Z respondents claim that they don’t earn enough to have a budget, which has doubled since 2012.
• The changes from 2012 are not driven by a particular age group: All age groups are less likely this year to say that they have a budget and follow it closely, and more likely to say they don’t earn enough money to have a budget.
14 Q190; Base: All of Gen Z (2013 N=1,000; 2012 N=1,001); 14-16 (n=225); 17-19 (n=339); 20-23 (n=436) Note: Percentages do not add up to 100 due to rounding.
Which of the following best describes you?
6
17
13
24
41
4
18
25
26
27
0 10 20 30 40 50 %
Gen Z 2013 Gen Z 2012
Significantly higher/lower than other group at 95% confidence.
I have a budget and follow it carefully
I have a budget but don't really follow it that closely
I don’t earn enough money to have a budget
I am too young to have a budget
I don't know how to budget
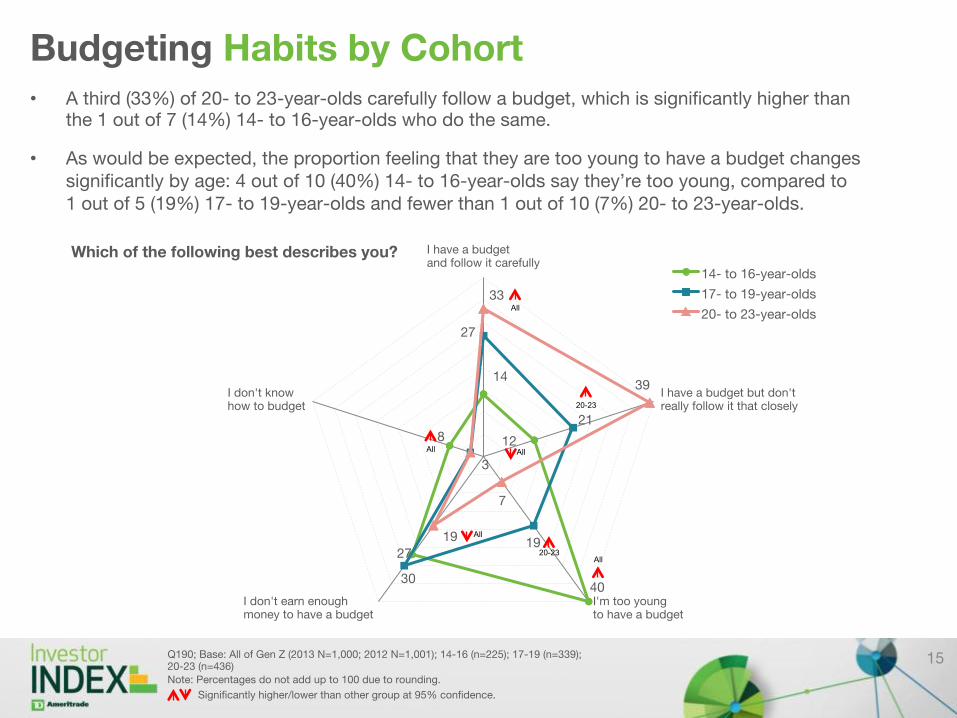
Budgeting Habits by Cohort • A third (33%) of 20- to 23-year-olds carefully follow a budget, which is significantly higher than
the 1 out of 7 (14%) 14- to 16-year-olds who do the same.
• As would be expected, the proportion feeling that they are too young to have a budget changes significantly by age: 4 out of 10 (40%) 14- to 16-year-olds say they’re too young, compared to 1 out of 5 (19%) 17- to 19-year-olds and fewer than 1 out of 10 (7%) 20- to 23-year-olds.
Q190; Base: All of Gen Z (2013 N=1,000; 2012 N=1,001); 14-16 (n=225); 17-19 (n=339); 20-23 (n=436) Note: Percentages do not add up to 100 due to rounding.
Which of the following best describes you?
14
12
40
27
8
27
21
19
30
3
33
39
7
19
0
5
10
15
20
25
30
35
40
I have a budget and follow it carefully
I have a budget but don't really follow it that closely
I'm too young to have a budget
I don't earn enough money to have a budget
I don't know how to budget
14- to 16-year-olds
17- to 19-year-olds
20- to 23-year-olds
Significantly higher/lower than other group at 95% confidence.
All 20-23
All
20-23
All
All All
15
31
56
10
21 59
23
-
20
40
60
80
100
Gen Z holding Credit Cards - 2013
Gen Z holding Credit Cards - 2012
%
12 months
7 to 11 months
6 months or fewer
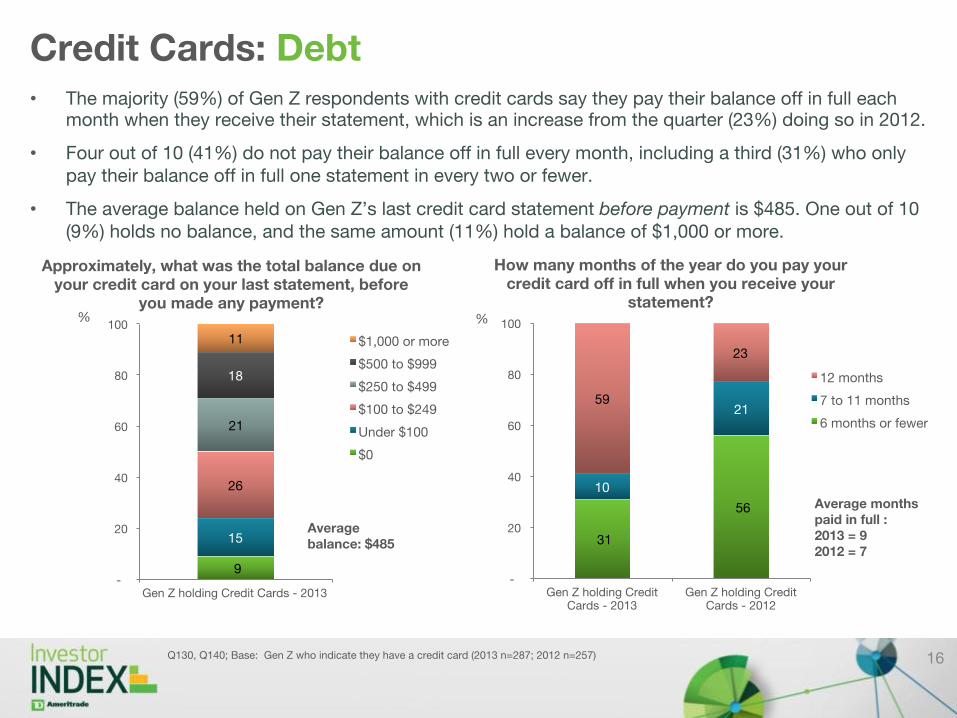
Credit Cards: Debt • The majority (59%) of Gen Z respondents with credit cards say they pay their balance off in full each
month when they receive their statement, which is an increase from the quarter (23%) doing so in 2012.
• Four out of 10 (41%) do not pay their balance off in full every month, including a third (31%) who only pay their balance off in full one statement in every two or fewer.
• The average balance held on Gen Z’s last credit card statement before payment is $485. One out of 10 (9%) holds no balance, and the same amount (11%) hold a balance of $1,000 or more.
16 Q130, Q140; Base: Gen Z who indicate they have a credit card (2013 n=287; 2012 n=257)
How many months of the year do you pay your credit card off in full when you receive your
statement?
9
15
26
21
18
11
-
20
40
60
80
100
Gen Z holding Credit Cards - 2013
%
$1,000 or more
$500 to $999
$250 to $499
$100 to $249
Under $100
$0
Approximately, what was the total balance due on your credit card on your last statement, before
you made any payment?
Average balance: $485
Average months paid in full : 2013 = 9 2012 = 7
83
4
13
76
6
18
79
4
16
87
4 9
0
20
40
60
80
100
Important Neutral Unimportant
%
Gen Z 2013 Gen Z 2012
Male 2013 Female 2013
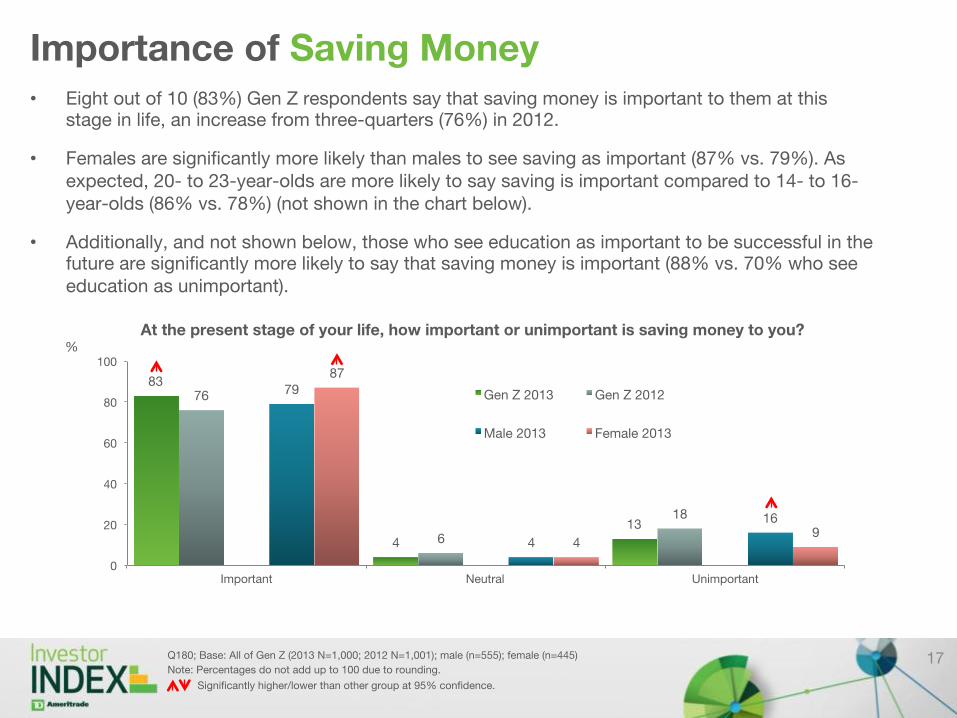
Importance of Saving Money • Eight out of 10 (83%) Gen Z respondents say that saving money is important to them at this
stage in life, an increase from three-quarters (76%) in 2012.
• Females are significantly more likely than males to see saving as important (87% vs. 79%). As expected, 20- to 23-year-olds are more likely to say saving is important compared to 14- to 16-year-olds (86% vs. 78%) (not shown in the chart below).
• Additionally, and not shown below, those who see education as important to be successful in the future are significantly more likely to say that saving money is important (88% vs. 70% who see education as unimportant).
17 Q180; Base: All of Gen Z (2013 N=1,000; 2012 N=1,001); male (n=555); female (n=445)
Note: Percentages do not add up to 100 due to rounding.
At the present stage of your life, how important or unimportant is saving money to you?
Significantly higher/lower than other group at 95% confidence.
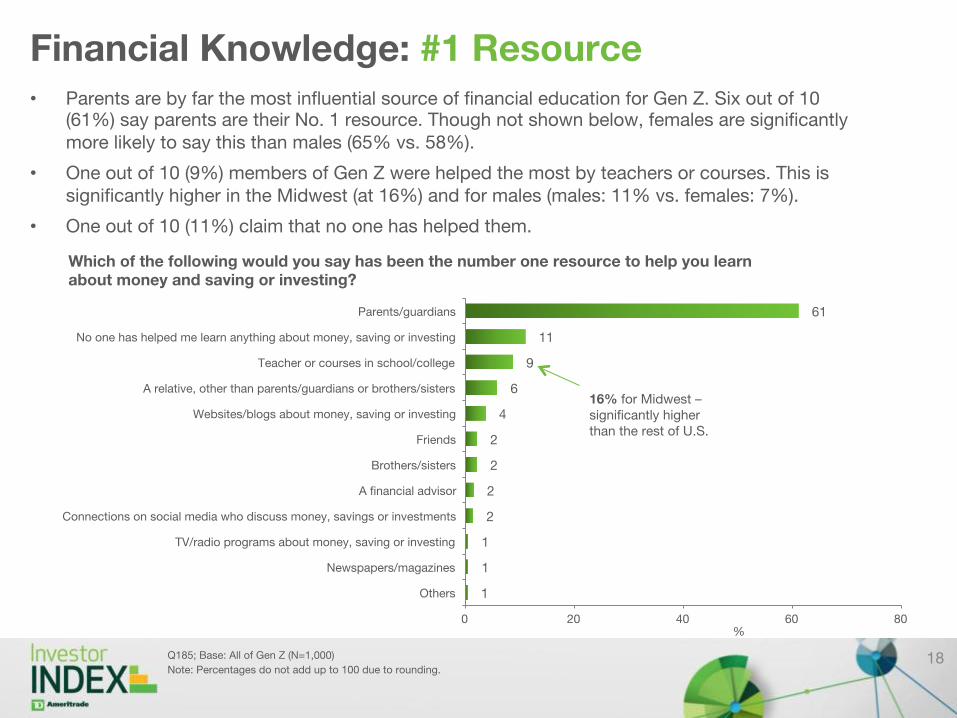
Financial Knowledge: #1 Resource • Parents are by far the most influential source of financial education for Gen Z. Six out of 10
(61%) say parents are their No. 1 resource. Though not shown below, females are significantly more likely to say this than males (65% vs. 58%).
• One out of 10 (9%) members of Gen Z were helped the most by teachers or courses. This is significantly higher in the Midwest (at 16%) and for males (males: 11% vs. females: 7%).
• One out of 10 (11%) claim that no one has helped them.
18 Q185; Base: All of Gen Z (N=1,000)
Note: Percentages do not add up to 100 due to rounding.
1
1
1
2
2
2
2
4
6
9
11
61
0 20 40 60 80
Others
Newspapers/magazines
TV/radio programs about money, saving or investing
Connections on social media who discuss money, savings or investments
A financial advisor
Brothers/sisters
Friends
Websites/blogs about money, saving or investing
A relative, other than parents/guardians or brothers/sisters
Teacher or courses in school/college
No one has helped me learn anything about money, saving or investing
Parents/guardians
%
Which of the following would you say has been the number one resource to help you learn about money and saving or investing?
16% for Midwest – significantly higher than the rest of U.S.
Gen Z as Consumers
19
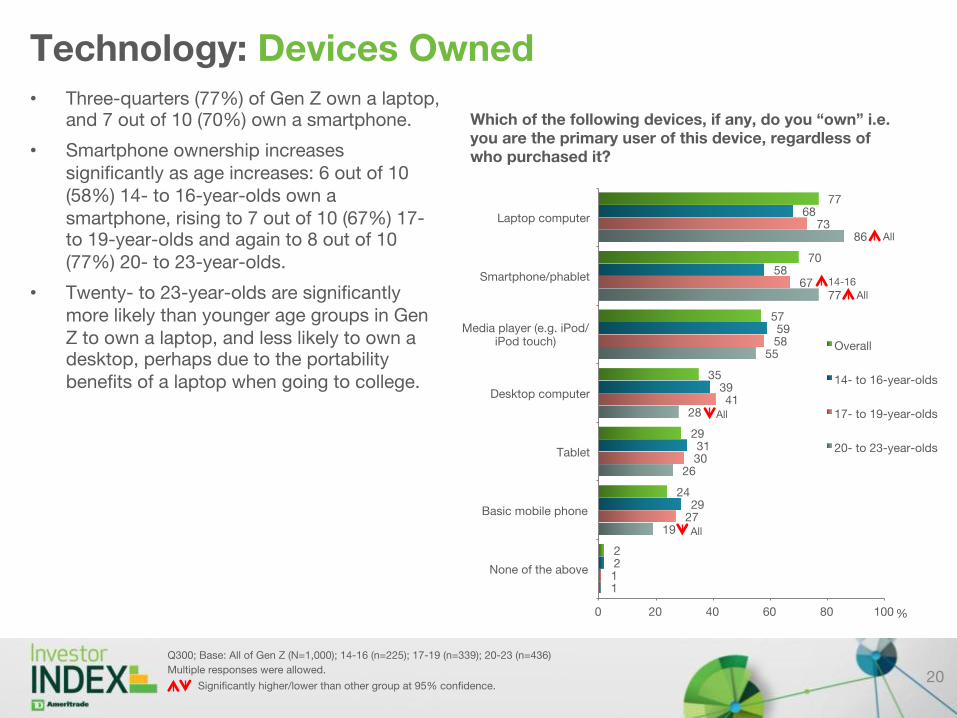
Technology: Devices Owned • Three-quarters (77%) of Gen Z own a laptop,
and 7 out of 10 (70%) own a smartphone.
• Smartphone ownership increases significantly as age increases: 6 out of 10 (58%) 14- to 16-year-olds own a smartphone, rising to 7 out of 10 (67%) 17- to 19-year-olds and again to 8 out of 10 (77%) 20- to 23-year-olds.
• Twenty- to 23-year-olds are significantly more likely than younger age groups in Gen Z to own a laptop, and less likely to own a desktop, perhaps due to the portability benefits of a laptop when going to college.
20
Q300; Base: All of Gen Z (N=1,000); 14-16 (n=225); 17-19 (n=339); 20-23 (n=436)
Multiple responses were allowed.
1
19
26
28
55
77
86
1
27
30
41
58
67
73
2
29
31
39
59
58
68
2
24
29
35
57
70
77
0 20 40 60 80 100
None of the above
Basic mobile phone
Tablet
Desktop computer
Media player (e.g. iPod/iPod touch)
Smartphone/phablet
Laptop computer
%
Overall
14- to 16-year-olds
17- to 19-year-olds
20- to 23-year-olds
Which of the following devices, if any, do you “own” i.e. you are the primary user of this device, regardless of who purchased it?
Significantly higher/lower than other group at 95% confidence.
All
All 14-16
All
All
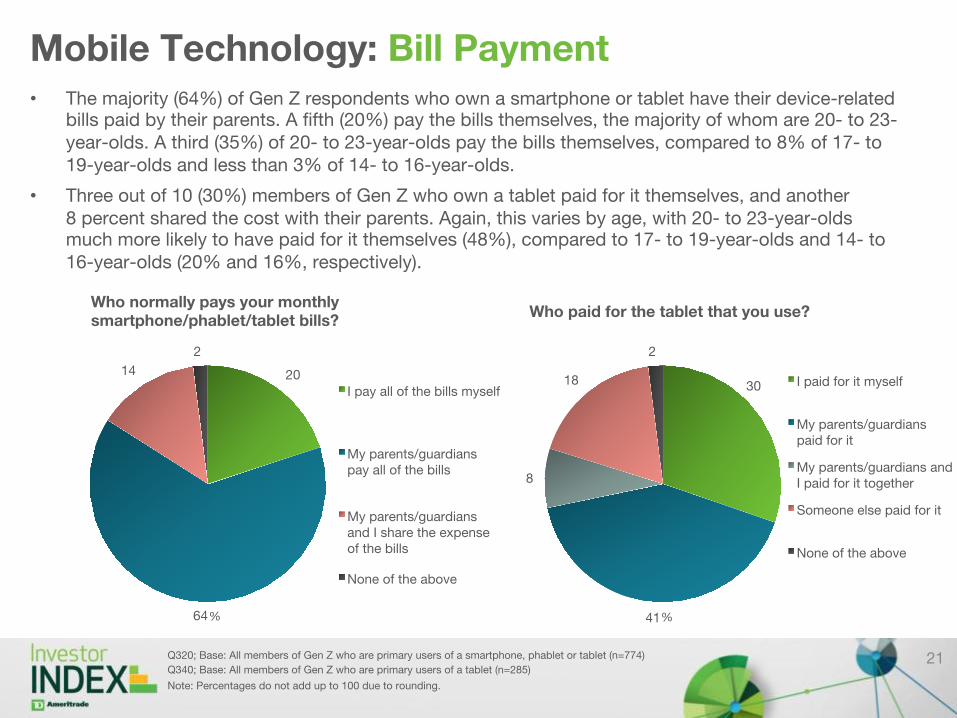
Mobile Technology: Bill Payment • The majority (64%) of Gen Z respondents who own a smartphone or tablet have their device-related
bills paid by their parents. A fifth (20%) pay the bills themselves, the majority of whom are 20- to 23-year-olds. A third (35%) of 20- to 23-year-olds pay the bills themselves, compared to 8% of 17- to 19-year-olds and less than 3% of 14- to 16-year-olds.
• Three out of 10 (30%) members of Gen Z who own a tablet paid for it themselves, and another 8 percent shared the cost with their parents. Again, this varies by age, with 20- to 23-year-olds much more likely to have paid for it themselves (48%), compared to 17- to 19-year-olds and 14- to 16-year-olds (20% and 16%, respectively).
21 Q320; Base: All members of Gen Z who are primary users of a smartphone, phablet or tablet (n=774)
Q340; Base: All members of Gen Z who are primary users of a tablet (n=285)
Note: Percentages do not add up to 100 due to rounding.
20
64
14
2
I pay all of the bills myself
My parents/guardians pay all of the bills
My parents/guardians and I share the expense of the bills
None of the above
Who normally pays your monthly smartphone/phablet/tablet bills?
30
41
8
18
2
I paid for it myself
My parents/guardians paid for it
My parents/guardians and I paid for it together
Someone else paid for it
None of the above
Who paid for the tablet that you use?
% %
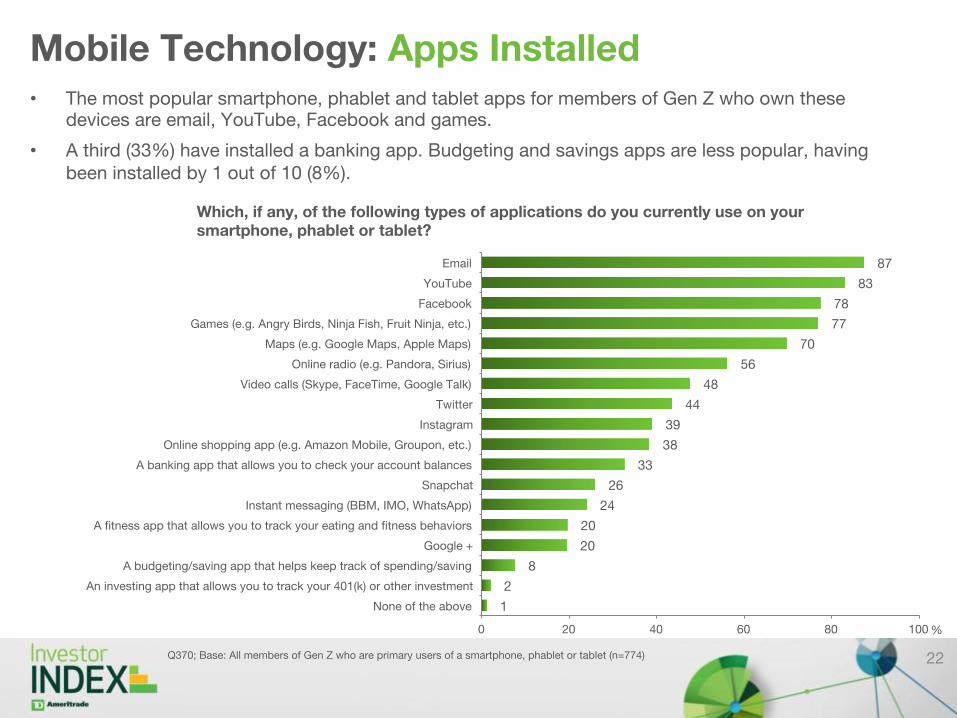
Mobile Technology: Apps Installed • The most popular smartphone, phablet and tablet apps for members of Gen Z who own these
devices are email, YouTube, Facebook and games.
• A third (33%) have installed a banking app. Budgeting and savings apps are less popular, having been installed by 1 out of 10 (8%).
22 Q370; Base: All members of Gen Z who are primary users of a smartphone, phablet or tablet (n=774)
1
2
8
20
20
24
26
33
38
39
44
48
56
70
77
78
83
87
0 20 40 60 80 100
None of the above
An investing app that allows you to track your 401(k) or other investment
A budgeting/saving app that helps keep track of spending/saving
Google +
A fitness app that allows you to track your eating and fitness behaviors
Instant messaging (BBM, IMO, WhatsApp)
Snapchat
A banking app that allows you to check your account balances
Online shopping app (e.g. Amazon Mobile, Groupon, etc.)
Video calls (Skype, FaceTime, Google Talk)
Online radio (e.g. Pandora, Sirius)
Maps (e.g. Google Maps, Apple Maps)
Games (e.g. Angry Birds, Ninja Fish, Fruit Ninja, etc.)
YouTube
Which, if any, of the following types of applications do you currently use on your smartphone, phablet or tablet?
%
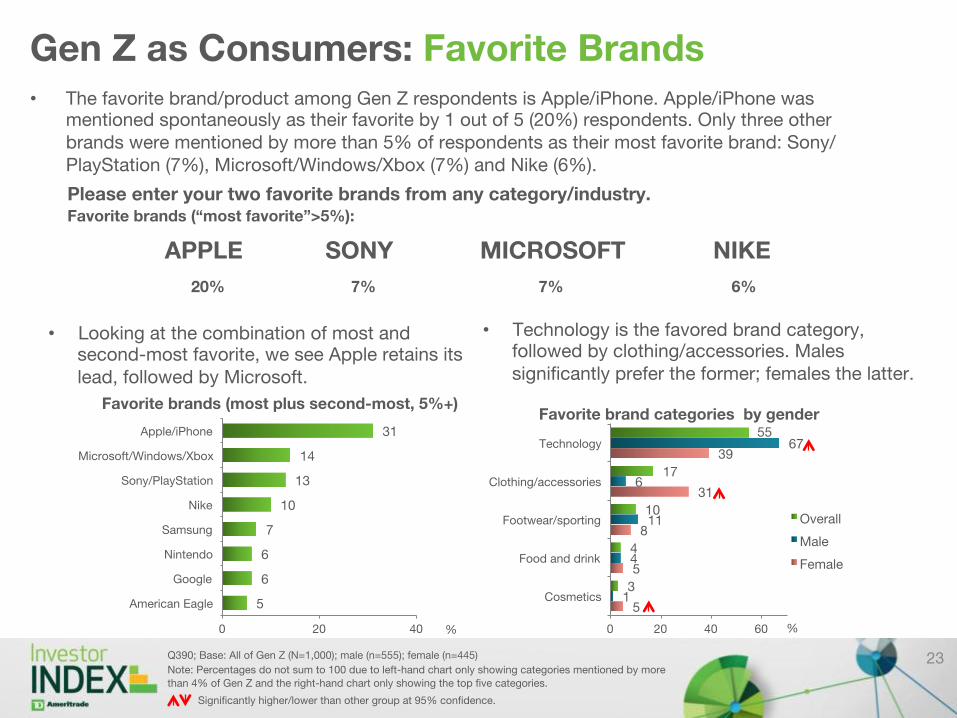
Gen Z as Consumers: Favorite Brands • The favorite brand/product among Gen Z respondents is Apple/iPhone. Apple/iPhone was
mentioned spontaneously as their favorite by 1 out of 5 (20%) respondents. Only three other brands were mentioned by more than 5% of respondents as their most favorite brand: Sony/PlayStation (7%), Microsoft/Windows/Xbox (7%) and Nike (6%).
23 Q390; Base: All of Gen Z (N=1,000); male (n=555); female (n=445)
Note: Percentages do not sum to 100 due to left-hand chart only showing categories mentioned by more
than 4% of Gen Z and the right-hand chart only showing the top five categories.
20%
Favorite brands (“most favorite”>5%):
7% 7% 6%
• Looking at the combination of most and second-most favorite, we see Apple retains its lead, followed by Microsoft.
• Technology is the favored brand category, followed by clothing/accessories. Males significantly prefer the former; females the latter.
5
6
6
7
10
13
14
31
0 20 40
American Eagle
Nintendo
Samsung
Nike
Sony/PlayStation
Microsoft/Windows/Xbox
Apple/iPhone
%
Favorite brands (most plus second-most, 5%+)
Please enter your two favorite brands from any category/industry.
5
5
8
31
39
1
4
11
6
67
3
4
10
17
55
0 20 40 60
Cosmetics
Food and drink
Footwear/sporting
Clothing/accessories
Technology
%
Favorite brand categories by gender
Overall
Male
Female
Significantly higher/lower than other group at 95% confidence.
APPLE SONY MICROSOFT NIKE
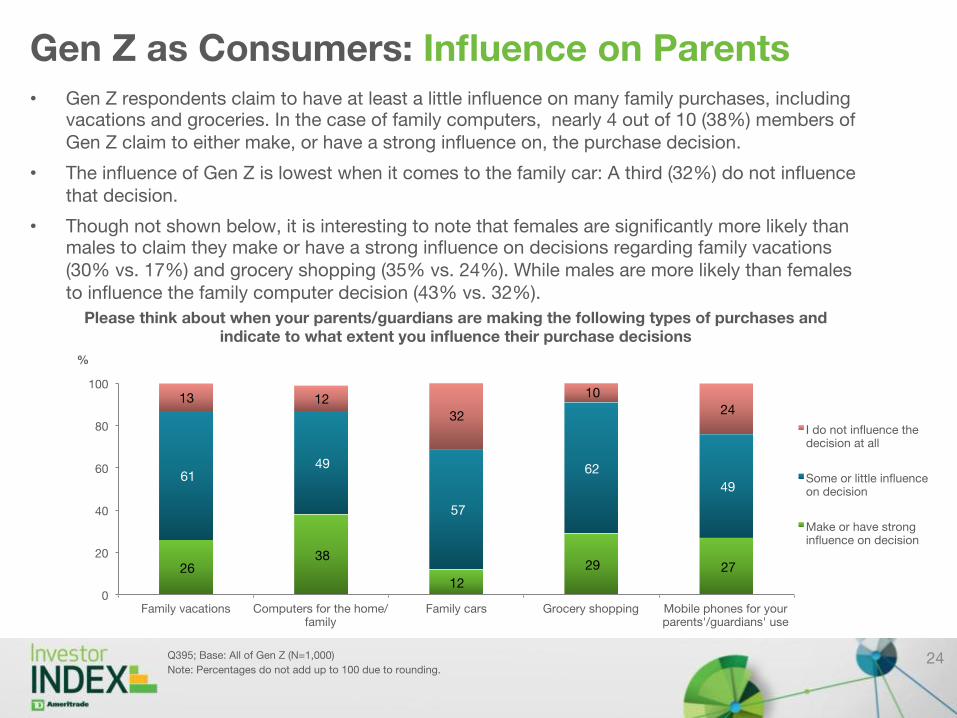
Gen Z as Consumers: Influence on Parents • Gen Z respondents claim to have at least a little influence on many family purchases, including
vacations and groceries. In the case of family computers, nearly 4 out of 10 (38%) members of Gen Z claim to either make, or have a strong influence on, the purchase decision.
• The influence of Gen Z is lowest when it comes to the family car: A third (32%) do not influence that decision.
• Though not shown below, it is interesting to note that females are significantly more likely than males to claim they make or have a strong influence on decisions regarding family vacations (30% vs. 17%) and grocery shopping (35% vs. 24%). While males are more likely than females to influence the family computer decision (43% vs. 32%).
24 Q395; Base: All of Gen Z (N=1,000)
Note: Percentages do not add up to 100 due to rounding.
26 38
12
29 27
61 49
57
62
49
13 12
32
10
24
0
20
40
60
80
100
Family vacations Computers for the home/family
Family cars Grocery shopping Mobile phones for your parents'/guardians' use
%
I do not influence the decision at all
Some or little influence on decision
Make or have strong influence on decision
Please think about when your parents/guardians are making the following types of purchases and indicate to what extent you influence their purchase decisions

Attitudes About, Planning for and Saving for Education
25

20
6 7
14
54
11
6 7
15
61
0
10
20
30
40
50
60
70
Very unimportant Somewhat unimportant Neither unimportant nor important
Somewhat important Very important
%
Gen Z 2013
Gen Z 2012
Importance of a Higher Education • More than half (54%) of Gen Z respondents believe obtaining a higher education is very important
in order for them to be successful in the future, a decrease from 6 out of 10 (61%) in 2012.
• Though not shown in the chart below, it is interesting to note that males are less likely than their female counterparts to believe higher education is very important (48% and 60%, respectively).
26 Q500; Base: All of Gen Z (2013 N=1,000; 2012 N=1,001)
Note: Percentages do not add up to 100 due to rounding.
How important or unimportant do you feel it is to obtain a higher education in order to be successful in the future?
Significantly higher/lower than other group at 95% confidence.

Likelihood of Going to College
• A majority of Gen Z respondents plan to attend, are already in or have completed undergraduate college (72%) or an advanced college degree (61%).
• Slightly more than one out of 10 (12%) Gen Z respondents are unlikely to or won’t attend undergraduate college, rising to 1 out of 5 (18%) with regard to graduate studies.
• Though not shown below, 1 out of 5 (18%) 14- to 16-year-olds say they are unlikely to pursue an undergraduate degree, significantly higher than 17- to 19-year-olds (13%) and 20- to 23-year-olds (8%).
27 Q510/Q520; Base: All of Gen Z (2013 N=1,000; 2012 N=1,001)
Note: Percentages do not add up to 100 due to rounding.
How unlikely or likely are you to pursue an undergraduate college degree (i.e. B.A. or B.S.)?
12 17
72
18 20
63
0
10
20
30
40
50
60
70
80
Unlikely/won't (NET) Neutral Likely/will, in or have (NET)
%
Gen Z 2013
Gen Z 2012
Significantly higher/lower than other group at 95% confidence.
How unlikely or likely are you to pursue an advanced college degree (i.e. Master’s, Ph.D., Doctor, Lawyer, Chartered Accountant, Engineer, etc.)?
18 22
61
16 18
66
0
10
20
30
40
50
60
70
80
Unlikely/won't (NET) Neutral Likely/will, in or have (NET)
%
Gen Z 2013
Gen Z 2012
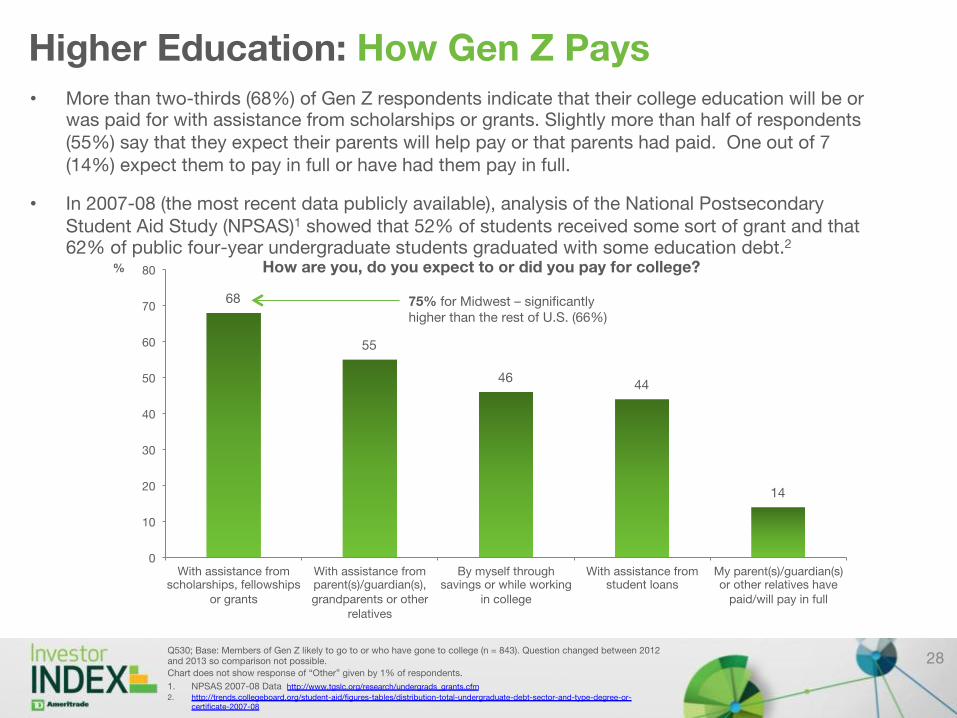
Higher Education: How Gen Z Pays • More than two-thirds (68%) of Gen Z respondents indicate that their college education will be or
was paid for with assistance from scholarships or grants. Slightly more than half of respondents (55%) say that they expect their parents will help pay or that parents had paid. One out of 7 (14%) expect them to pay in full or have had them pay in full.
• In 2007-08 (the most recent data publicly available), analysis of the National Postsecondary Student Aid Study (NPSAS)1 showed that 52% of students received some sort of grant and that 62% of public four-year undergraduate students graduated with some education debt.2
28 Q530; Base: Members of Gen Z likely to go to or who have gone to college (n = 843). Question changed between 2012 and 2013 so comparison not possible.
Chart does not show response of “Other” given by 1% of respondents.
1. NPSAS 2007-08 Data http://www.tgslc.org/research/undergrads_grants.cfm
2. http://trends.collegeboard.org/student-aid/figures-tables/distribution-total-undergraduate-debt-sector-and-type-degree-or-certificate-2007-08
How are you, do you expect to or did you pay for college?
68
55
46 44
14
0
10
20
30
40
50
60
70
80
With assistance from scholarships, fellowships
or grants
With assistance from parent(s)/guardian(s), grandparents or other
relatives
By myself through savings or while working
in college
With assistance from student loans
My parent(s)/guardian(s) or other relatives have
paid/will pay in full
%
75% for Midwest – significantly higher than the rest of U.S. (66%)
23
50
19
64
0 10 20 30 40 50 60 70
% Agree (7 to 10 on a 0- to 10-point scale)
Gen Z 2013 Gen Z 2012
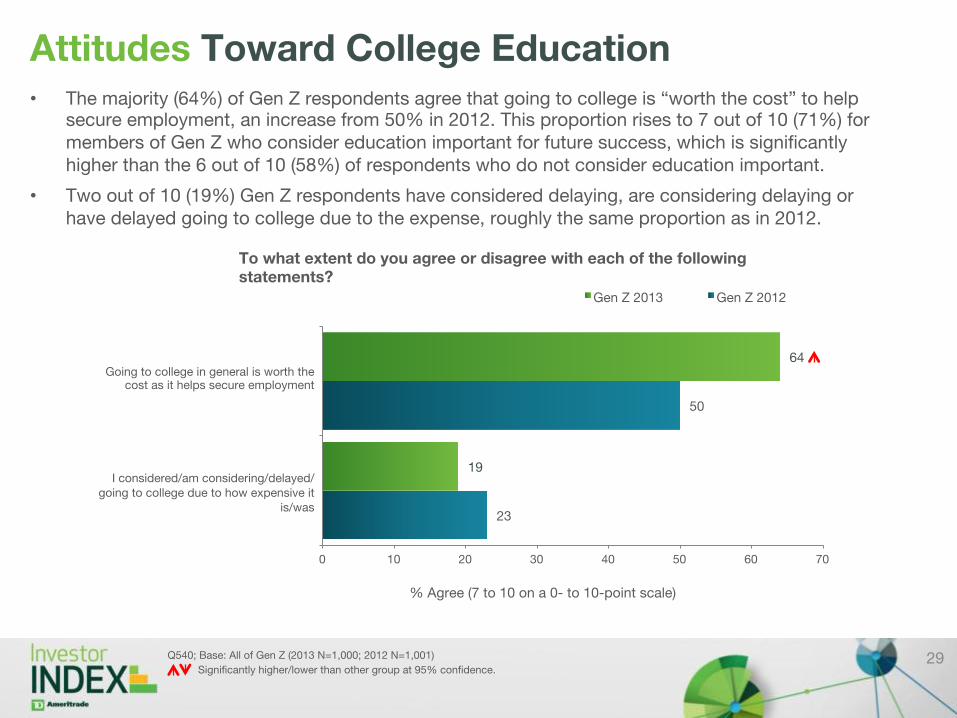
Attitudes Toward College Education • The majority (64%) of Gen Z respondents agree that going to college is “worth the cost” to help
secure employment, an increase from 50% in 2012. This proportion rises to 7 out of 10 (71%) for members of Gen Z who consider education important for future success, which is significantly higher than the 6 out of 10 (58%) of respondents who do not consider education important.
• Two out of 10 (19%) Gen Z respondents have considered delaying, are considering delaying or have delayed going to college due to the expense, roughly the same proportion as in 2012.
29 Q540; Base: All of Gen Z (2013 N=1,000; 2012 N=1,001)
To what extent do you agree or disagree with each of the following statements?
Going to college in general is worth the cost as it helps secure employment
I considered/am considering/delayed/going to college due to how expensive it
is/was
Significantly higher/lower than other group at 95% confidence.

Moving Out of Home
30
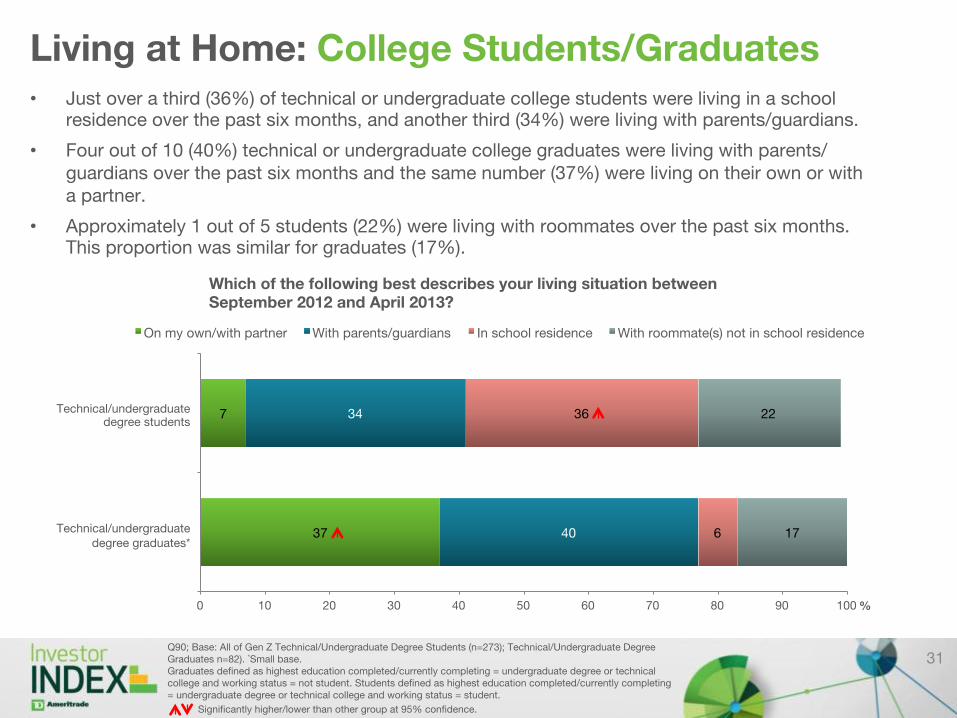
Living at Home: College Students/Graduates • Just over a third (36%) of technical or undergraduate college students were living in a school
residence over the past six months, and another third (34%) were living with parents/guardians.
• Four out of 10 (40%) technical or undergraduate college graduates were living with parents/guardians over the past six months and the same number (37%) were living on their own or with a partner.
• Approximately 1 out of 5 students (22%) were living with roommates over the past six months. This proportion was similar for graduates (17%).
31 Q90; Base: All of Gen Z Technical/Undergraduate Degree Students (n=273); Technical/Undergraduate Degree Graduates n=82). *Small base. Graduates defined as highest education completed/currently completing = undergraduate degree or technical college and working status = not student. Students defined as highest education completed/currently completing = undergraduate degree or technical college and working status = student.
37
7
40
34
6
36
17
22
0 10 20 30 40 50 60 70 80 90 100 %
On my own/with partner With parents/guardians In school residence With roommate(s) not in school residence
Which of the following best describes your living situation between September 2012 and April 2013?
Significantly higher/lower than other group at 95% confidence.
Technical/undergraduate degree students
Technical/undergraduate degree graduates*
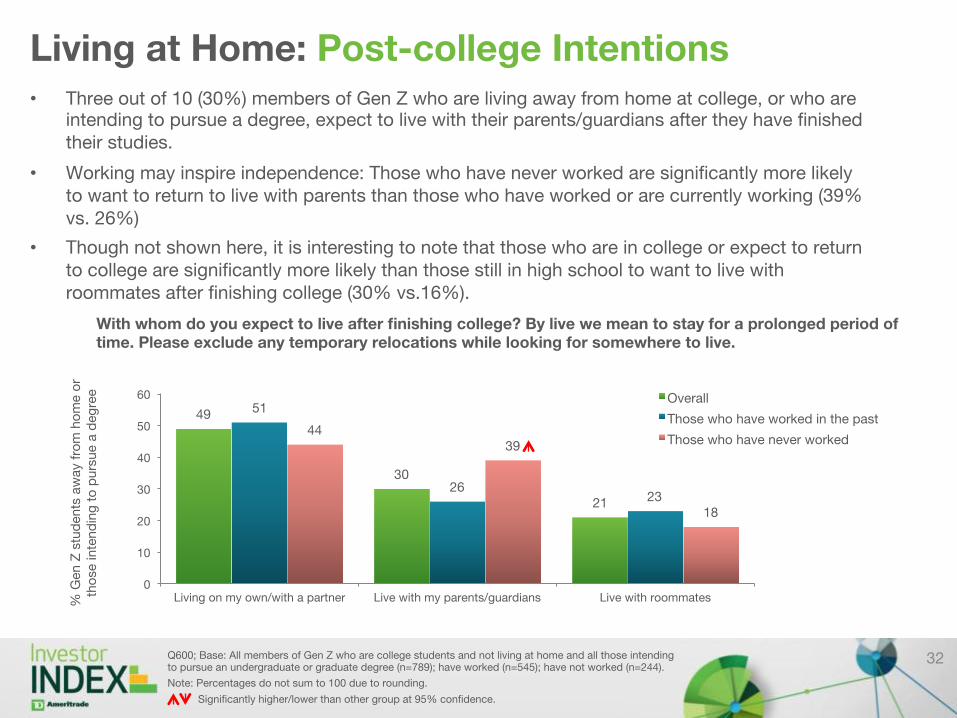
Living at Home: Post-college Intentions • Three out of 10 (30%) members of Gen Z who are living away from home at college, or who are
intending to pursue a degree, expect to live with their parents/guardians after they have finished their studies.
• Working may inspire independence: Those who have never worked are significantly more likely to want to return to live with parents than those who have worked or are currently working (39% vs. 26%)
• Though not shown here, it is interesting to note that those who are in college or expect to return to college are significantly more likely than those still in high school to want to live with roommates after finishing college (30% vs.16%).
32 Q600; Base: All members of Gen Z who are college students and not living at home and all those intending to pursue an undergraduate or graduate degree (n=789); have worked (n=545); have not worked (n=244).
Note: Percentages do not sum to 100 due to rounding.
49
30
21
51
26 23
44 39
18
0
10
20
30
40
50
60
Living on my own/with a partner Live with my parents/guardians Live with roommates % G
en
Z s
tud
ents
aw
ay
fro
m h
om
e o
r th
ose
inte
nd
ing
to
purs
ue a
deg
ree
Overall
Those who have worked in the past
Those who have never worked
With whom do you expect to live after finishing college? By live we mean to stay for a prolonged period of time. Please exclude any temporary relocations while looking for somewhere to live.
Significantly higher/lower than other group at 95% confidence.

Living at Home: Moving Back Home • More than 6 out of 10 Gen Z respondents (63%) feel that they can move back with their parents
or guardians should the need arise. Only 1 out of 10 (10%) feel that this would not be possible.
• Though not shown on this chart, it is interesting that those who feel that an education is important to future success are significantly more likely to agree that they can move home than those who don’t see education as important (67% vs. 58%).
• The majority of respondents (59%) are confident that they won’t need to move back with parents or guardians. Fewer than 1 out of 10 (7%) are not confident that they will be able to continue living away from their childhood home.
33 Q90; Base: All members of Gen Z who have completed or are completing a technical or university degree (n=355) Significantly higher/lower than other group at 95% confidence.
59
63
34
27
7
10
0 10 20 30 40 50 60 70 80 90 100
%
Agree (7 to 10) Neutral (4 to 6) Disagree (0 to 3)
In the future, I know that I can always move back with my parents/guardians if I
can't afford to live on my own
I am confident that in the future, I won't need to move back with my parents/
guardians due to my financial situation
To what extent do you agree or disagree with the following statements?
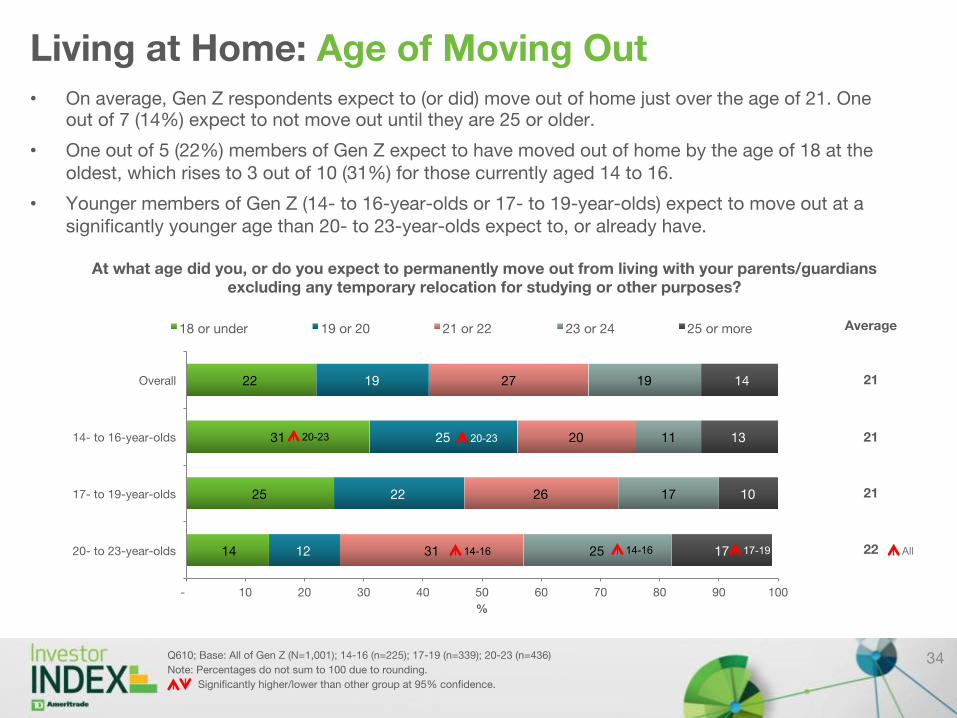
Living at Home: Age of Moving Out • On average, Gen Z respondents expect to (or did) move out of home just over the age of 21. One
out of 7 (14%) expect to not move out until they are 25 or older.
• One out of 5 (22%) members of Gen Z expect to have moved out of home by the age of 18 at the oldest, which rises to 3 out of 10 (31%) for those currently aged 14 to 16.
• Younger members of Gen Z (14- to 16-year-olds or 17- to 19-year-olds) expect to move out at a significantly younger age than 20- to 23-year-olds expect to, or already have.
34 Q610; Base: All of Gen Z (N=1,001); 14-16 (n=225); 17-19 (n=339); 20-23 (n=436)
Note: Percentages do not sum to 100 due to rounding.
14
25
31
22
12
22
25
19
31
26
20
27
25
17
11
19
17
10
13
14
- 10 20 30 40 50 60 70 80 90 100
20- to 23-year-olds
17- to 19-year-olds
14- to 16-year-olds
Overall
%
18 or under 19 or 20 21 or 22 23 or 24 25 or more
At what age did you, or do you expect to permanently move out from living with your parents/guardians excluding any temporary relocation for studying or other purposes?
Average
21
21
21
22
Significantly higher/lower than other group at 95% confidence.
All
20-23 20-23
14-16 14-16 17-19
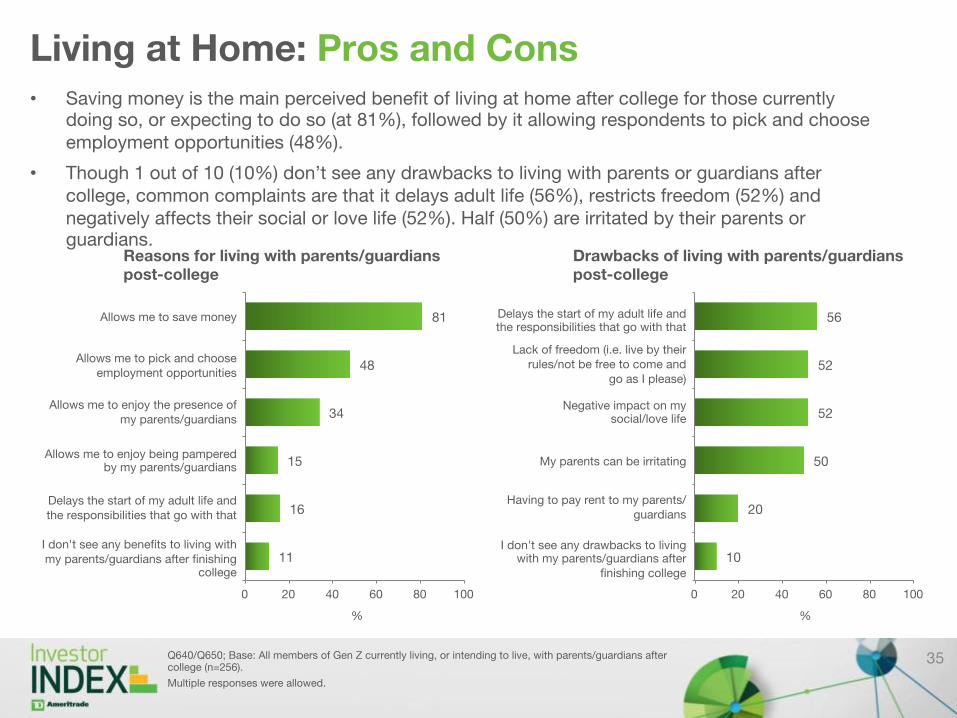
• Saving money is the main perceived benefit of living at home after college for those currently doing so, or expecting to do so (at 81%), followed by it allowing respondents to pick and choose employment opportunities (48%).
• Though 1 out of 10 (10%) don’t see any drawbacks to living with parents or guardians after college, common complaints are that it delays adult life (56%), restricts freedom (52%) and negatively affects their social or love life (52%). Half (50%) are irritated by their parents or guardians.
Living at Home: Pros and Cons
35 Q640/Q650; Base: All members of Gen Z currently living, or intending to live, with parents/guardians after college (n=256).
Multiple responses were allowed.
11
16
15
34
48
81
0 20 40 60 80 100
%
Reasons for living with parents/guardians post-college
Allows me to save money
Allows me to pick and choose employment opportunities
Allows me to enjoy the presence of my parents/guardians
Allows me to enjoy being pampered by my parents/guardians
Delays the start of my adult life and the responsibilities that go with that
I don't see any benefits to living with my parents/guardians after finishing
college 10
20
50
52
52
56
0 20 40 60 80 100
%
Drawbacks of living with parents/guardians post-college
Delays the start of my adult life and the responsibilities that go with that
Lack of freedom (i.e. live by their rules/not be free to come and
go as I please)
Negative impact on my social/love life
My parents can be irritating
Having to pay rent to my parents/guardians
I don't see any drawbacks to living with my parents/guardians after
finishing college
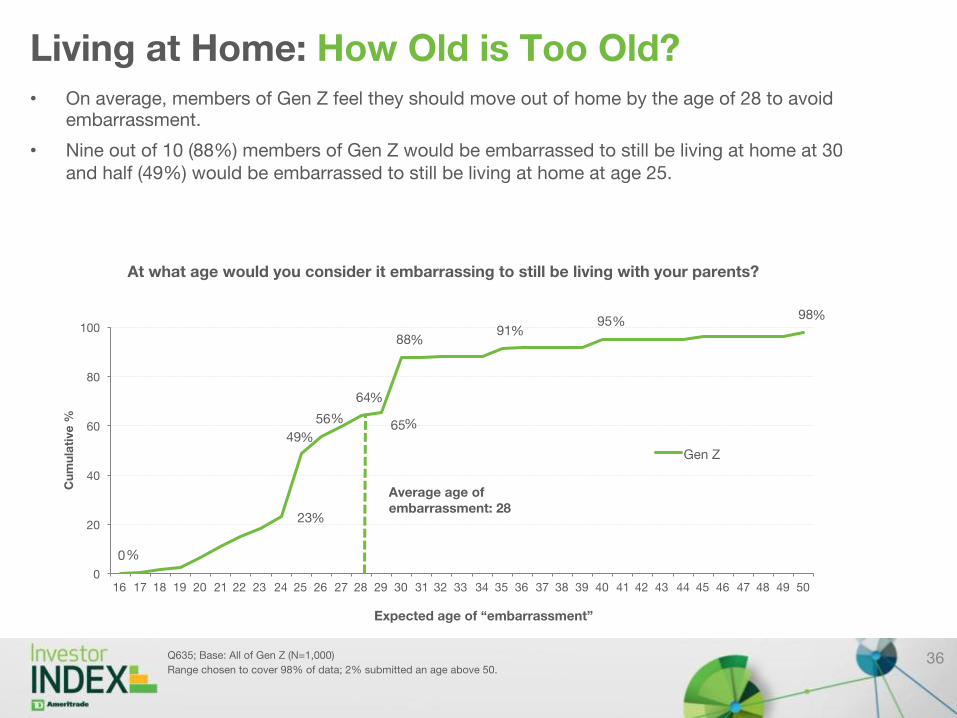
Living at Home: How Old is Too Old? • On average, members of Gen Z feel they should move out of home by the age of 28 to avoid
embarrassment.
• Nine out of 10 (88%) members of Gen Z would be embarrassed to still be living at home at 30 and half (49%) would be embarrassed to still be living at home at age 25.
36 Q635; Base: All of Gen Z (N=1,000)
Range chosen to cover 98% of data; 2% submitted an age above 50.
0
23
49
56
64
65
88 91
95 98
0
20
40
60
80
100
16 17 18 19 20 21 22 23 24 25 26 27 28 29 30 31 32 33 34 35 36 37 38 39 40 41 42 43 44 45 46 47 48 49 50
Cu
mu
lati
ve
%
Expected age of “embarrassment”
At what age would you consider it embarrassing to still be living with your parents?
Gen Z
Average age of embarrassment: 28
% % %
%
%
% %
%
%
%
Attitudes About and Expectations of Working Life
37
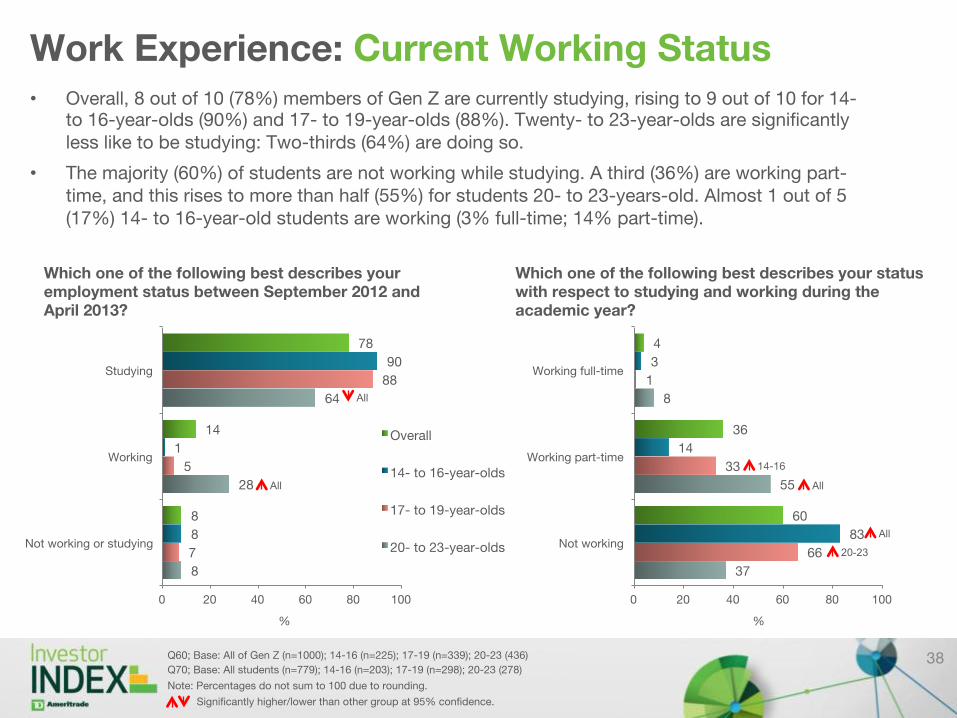
Work Experience: Current Working Status • Overall, 8 out of 10 (78%) members of Gen Z are currently studying, rising to 9 out of 10 for 14-
to 16-year-olds (90%) and 17- to 19-year-olds (88%). Twenty- to 23-year-olds are significantly less like to be studying: Two-thirds (64%) are doing so.
• The majority (60%) of students are not working while studying. A third (36%) are working part-time, and this rises to more than half (55%) for students 20- to 23-years-old. Almost 1 out of 5 (17%) 14- to 16-year-old students are working (3% full-time; 14% part-time).
38 Q60; Base: All of Gen Z (n=1000); 14-16 (n=225); 17-19 (n=339); 20-23 (436)
Q70; Base: All students (n=779); 14-16 (n=203); 17-19 (n=298); 20-23 (278)
Note: Percentages do not sum to 100 due to rounding.
8
28
64
7
5
88
8
1
90
8
14
78
0 20 40 60 80 100
Not working or studying
Working
Studying
%
Which one of the following best describes your employment status between September 2012 and April 2013?
Overall
14- to 16-year-olds
17- to 19-year-olds
20- to 23-year-olds
37
55
8
66
33
1
83
14
3
60
36
4
0 20 40 60 80 100
Not working
Working part-time
Working full-time
%
Which one of the following best describes your status with respect to studying and working during the academic year?
All
Significantly higher/lower than other group at 95% confidence.
All
20-23
All
14-16
All

Work Experience: First Employment • Almost 7 out of 10 (68%) members of Gen Z are currently working or have worked in the past.
• Though not shown below, the proportion working or who have worked differs significantly by age: 4 out of 10 (37%) 14- to 16-year-olds are working/have worked, which is significantly lower than the 6 out of 10 (59%) of 17- to 19-year-olds, and 9 out of 10 (91%) of 20- to 23-year-olds.
• One out of 5 (19%) of those working or who have worked began paid employment at 14 or under, rising to 1 out of 4 (24%) for members of Gen Z in the Midwest, which is significantly higher than elsewhere (18%). The average age for beginning paid employment is 16. The legal age for beginning employment is generally 14.1
39 Combination of Q60/Q70/Q75; Base: All of Gen Z (N=1,000). Q660; Base: All members of Gen Z currently working or who have worked in the past and who gave an age of first employment (n=678) 1. United States Dept. of Labor, Youth & Labor Age Requirements http://www.dol.gov/dol/topic/youthlabor/agerequirements.htm Note: Percentages do not sum to 100 due to rounding.
68
32 Are working or have worked in the past
Have never worked
Proportion of Gen Z who are working or have worked in the past
19
44
33
5
0
20
40
60
80
100
Age of first employment
% o
f G
en
Z w
ork
ing
or
wh
o h
ave
wo
rke
d
20 or older
17 to 19
15 or 16
14 or under
At what age did you get your first paying job either full-time or part-time? Please exclude doing paid chores for a family member
%
Average age: 16
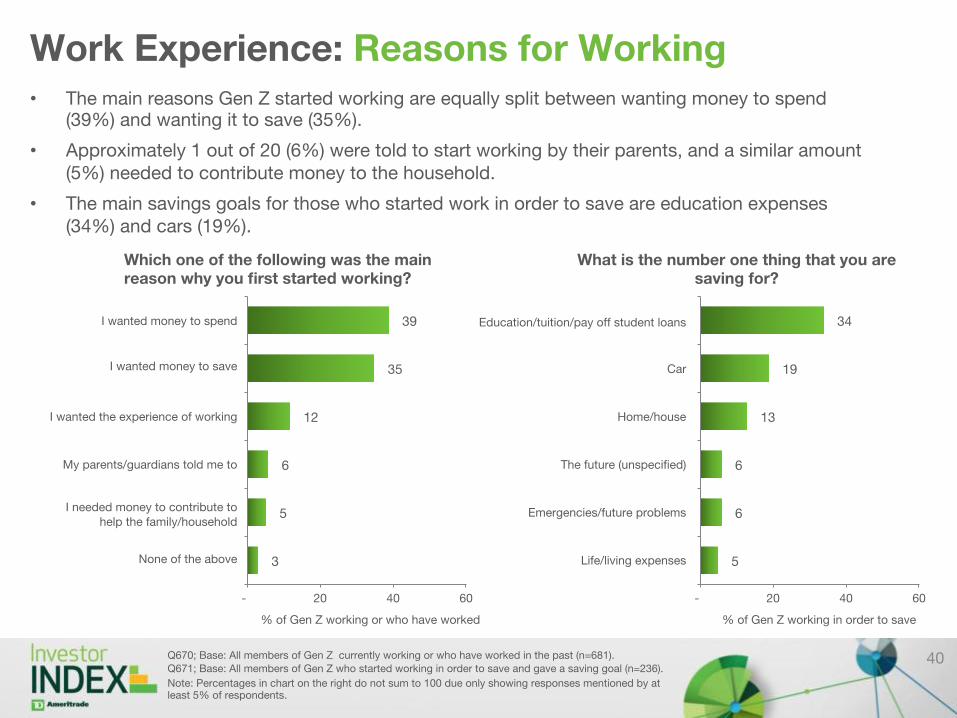
Work Experience: Reasons for Working • The main reasons Gen Z started working are equally split between wanting money to spend
(39%) and wanting it to save (35%).
• Approximately 1 out of 20 (6%) were told to start working by their parents, and a similar amount (5%) needed to contribute money to the household.
• The main savings goals for those who started work in order to save are education expenses (34%) and cars (19%).
40 Q670; Base: All members of Gen Z currently working or who have worked in the past (n=681). Q671; Base: All members of Gen Z who started working in order to save and gave a saving goal (n=236).
Note: Percentages in chart on the right do not sum to 100 due only showing responses mentioned by at least 5% of respondents.
3
5
6
12
35
39
- 20 40 60
% of Gen Z working or who have worked
Which one of the following was the main reason why you first started working?
I wanted money to spend
I wanted money to save
I wanted the experience of working
My parents/guardians told me to
I needed money to contribute to help the family/household
None of the above 5
6
6
13
19
34
- 20 40 60
% of Gen Z working in order to save
What is the number one thing that you are saving for?
Education/tuition/pay off student loans
Car
Home/house
The future (unspecified)
Emergencies/future problems
Life/living expenses

Work Expectations: Salary vs. Satisfaction • A third (34%) of Gen Z feel that job satisfaction in their career is more important than salary, and
4 out of 10 (43%) feel that they are equally important.
• Twenty- to 23-year-olds are significantly more likely than 17- to 19-year-olds and 14- to 16-year-olds to feel that job satisfaction is more important than salary.
• Members of Gen Z in the Midwest have a significantly stronger preference than members of Gen Z elsewhere for job satisfaction (41% vs. 31% respectively).
41 Q675; Base: All of Gen Z (N=1,000); 14- to 16-year-olds (n=225);17- to 19-year-olds (n=339); 20- to 23-year-olds (n=436).
Note: Percentages do not sum to 100% due to rounding.
40
32
24
34
38
45
48
43
18
18
20
18
4
4
9
5
- 10 20 30 40 50 60 70 80 90 100
20- to 23-year-olds
17- to 19-year-olds
14- to 16-year olds
Overall
%
Job satisfaction much/somewhat more important Job satisfaction and salary of equal importance
Job satisfaction much/somewhat less important Don't know
Thinking about when you start, or did start, your career, which will be, or was, more important to you: job satisfaction or salary?
All All
Significantly higher/lower than other group at 95% confidence.
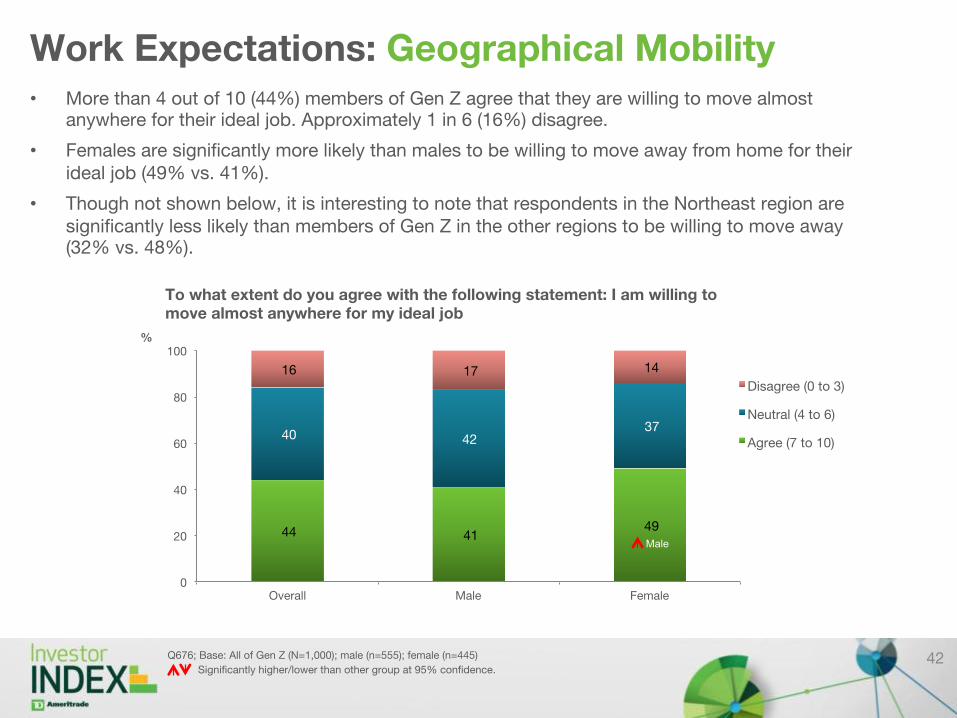
Work Expectations: Geographical Mobility • More than 4 out of 10 (44%) members of Gen Z agree that they are willing to move almost
anywhere for their ideal job. Approximately 1 in 6 (16%) disagree.
• Females are significantly more likely than males to be willing to move away from home for their ideal job (49% vs. 41%).
• Though not shown below, it is interesting to note that respondents in the Northeast region are significantly less likely than members of Gen Z in the other regions to be willing to move away (32% vs. 48%).
42 Q676; Base: All of Gen Z (N=1,000); male (n=555); female (n=445)
44 41 49
40 42 37
16 17 14
0
20
40
60
80
100
Overall Male Female
%
Disagree (0 to 3)
Neutral (4 to 6)
Agree (7 to 10)
To what extent do you agree with the following statement: I am willing to move almost anywhere for my ideal job
Significantly higher/lower than other group at 95% confidence.
Male
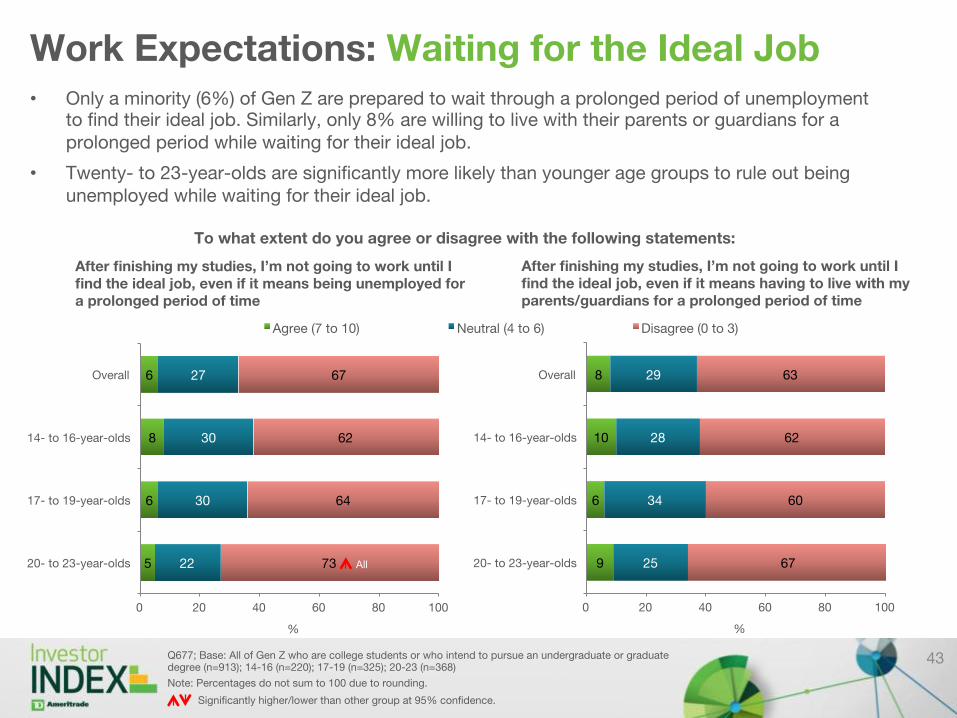
Work Expectations: Waiting for the Ideal Job • Only a minority (6%) of Gen Z are prepared to wait through a prolonged period of unemployment
to find their ideal job. Similarly, only 8% are willing to live with their parents or guardians for a prolonged period while waiting for their ideal job.
• Twenty- to 23-year-olds are significantly more likely than younger age groups to rule out being unemployed while waiting for their ideal job.
43 Q677; Base: All of Gen Z who are college students or who intend to pursue an undergraduate or graduate degree (n=913); 14-16 (n=220); 17-19 (n=325); 20-23 (n=368)
Note: Percentages do not sum to 100 due to rounding.
5
6
8
6
22
30
30
27
73
64
62
67
0 20 40 60 80 100
20- to 23-year-olds
17- to 19-year-olds
14- to 16-year-olds
Overall
%
After finishing my studies, I’m not going to work until I find the ideal job, even if it means being unemployed for a prolonged period of time
To what extent do you agree or disagree with the following statements:
9
6
10
8
25
34
28
29
67
60
62
63
0 20 40 60 80 100
20- to 23-year-olds
17- to 19-year-olds
14- to 16-year-olds
Overall
%
After finishing my studies, I’m not going to work until I find the ideal job, even if it means having to live with my parents/guardians for a prolonged period of time
Significantly higher/lower than other group at 95% confidence.
All
Agree (7 to 10) Neutral (4 to 6) Disagree (0 to 3)
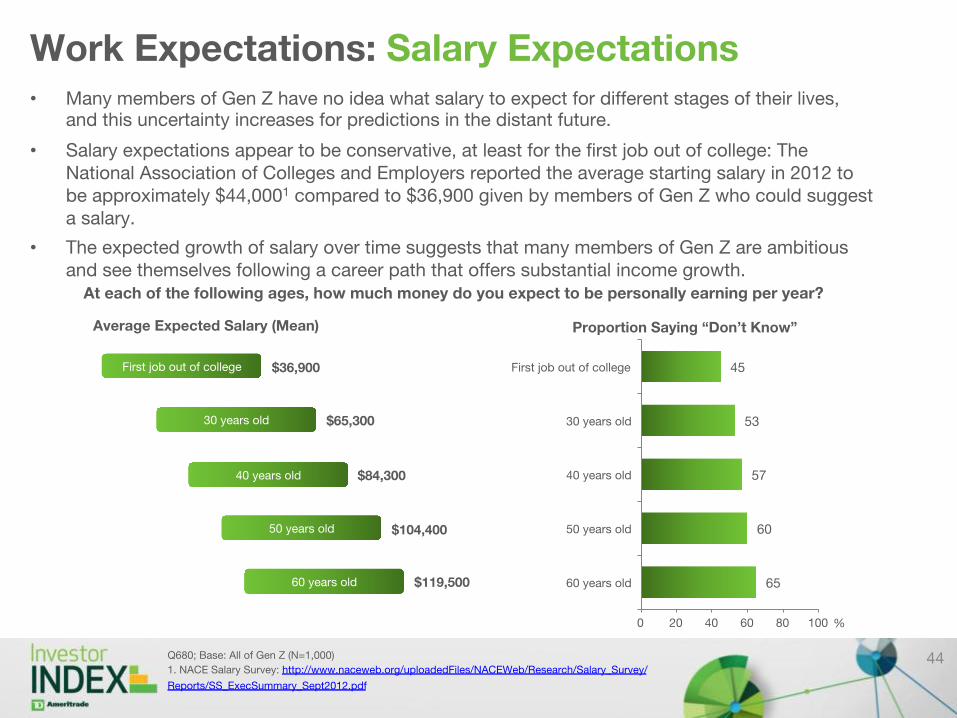
Work Expectations: Salary Expectations • Many members of Gen Z have no idea what salary to expect for different stages of their lives,
and this uncertainty increases for predictions in the distant future.
• Salary expectations appear to be conservative, at least for the first job out of college: The National Association of Colleges and Employers reported the average starting salary in 2012 to be approximately $44,0001 compared to $36,900 given by members of Gen Z who could suggest a salary.
• The expected growth of salary over time suggests that many members of Gen Z are ambitious and see themselves following a career path that offers substantial income growth.
44 Q680; Base: All of Gen Z (N=1,000)
1. NACE Salary Survey: http://www.naceweb.org/uploadedFiles/NACEWeb/Research/Salary_Survey/
Reports/SS_ExecSummary_Sept2012.pdf
65
60
57
53
45
0 20 40 60 80 100
60 years old
50 years old
40 years old
30 years old
First job out of college
%
Proportion Saying “Don’t Know”
At each of the following ages, how much money do you expect to be personally earning per year?
Average Expected Salary (Mean)
First job out of college $36,900
30 years old $65,300
40 years old $84,300
50 years old $104,400
60 years old $119,500
Attitudes About, Planning for and Saving for Retirement
45
28 27
0
5
10
15
20
25
30
35
Gen Z 2013 Gen Z 2012
Ave
rag
e (M
ean) A
ge
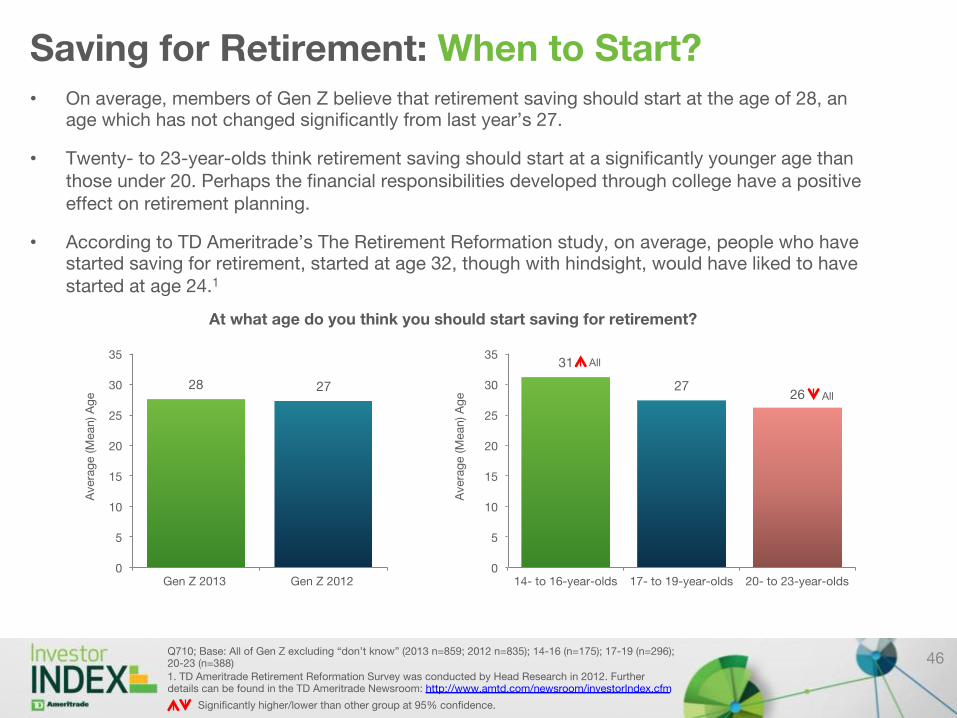
Saving for Retirement: When to Start? • On average, members of Gen Z believe that retirement saving should start at the age of 28, an
age which has not changed significantly from last year’s 27.
• Twenty- to 23-year-olds think retirement saving should start at a significantly younger age than those under 20. Perhaps the financial responsibilities developed through college have a positive effect on retirement planning.
• According to TD Ameritrade’s The Retirement Reformation study, on average, people who have started saving for retirement, started at age 32, though with hindsight, would have liked to have started at age 24.1
Q710; Base: All of Gen Z excluding “don’t know” (2013 n=859; 2012 n=835); 14-16 (n=175); 17-19 (n=296); 20-23 (n=388) 1. TD Ameritrade Retirement Reformation Survey was conducted by Head Research in 2012. Further details can be found in the TD Ameritrade Newsroom: http://www.amtd.com/newsroom/investorIndex.cfm
At what age do you think you should start saving for retirement?
Significantly higher/lower than other group at 95% confidence.
All
All
31
27 26
0
5
10
15
20
25
30
35
14- to 16-year-olds 17- to 19-year-olds 20- to 23-year-olds
Ave
rag
e (M
ean) A
ge
46

Retirement Expectations: Age of Retirement • On average, members of Gen Z expect that they will retire at 65, in line with the average current
retirement ages reported by the Center for Retirement Research.1
• Two-thirds (65%) of respondents expect to have retired by 65, and 9 out of 10 (90%) expect to have retired by 70.
• Members of Gen Z in the Midwest expect to work for significantly longer: On average they expect to retire at 66 compared to 64 elsewhere. Additionally, those who see education as important for success expect a later retirement age: 66 compared to 63 for those who see education as unimportant for success.
47 Q715; Base: All giving an age at which they expect to retire, excluding “don't know” (n= 819)
Age range shown to cover 94% of ages given; 5% stated they expected to retire under 50 and 1% over
80.
1. “What is the Average Retirement Age?” by Alicia H. Munnell, Center for Retirement Research at Boston
College. August 2011. http://crr.bc.edu/wp-content/uploads/2011/08/IB_11-11-508.pdf
5 11
30
31
65
72
90 95
99
0
20
40
60
80
100
50 51 52 53 54 55 56 57 58 59 60 61 62 63 64 65 66 67 68 69 70 71 72 73 74 75 76 77 78 79 80
Cu
mu
lati
ve
%
Expected age of retirement
At what age do you expect to retire? By retire we mean receiving no income from either part-time or full-time employment and have no intention of working in the future.
Gen Z
Average expected retirement age: 65
% %
%
%
%
%
% %
%
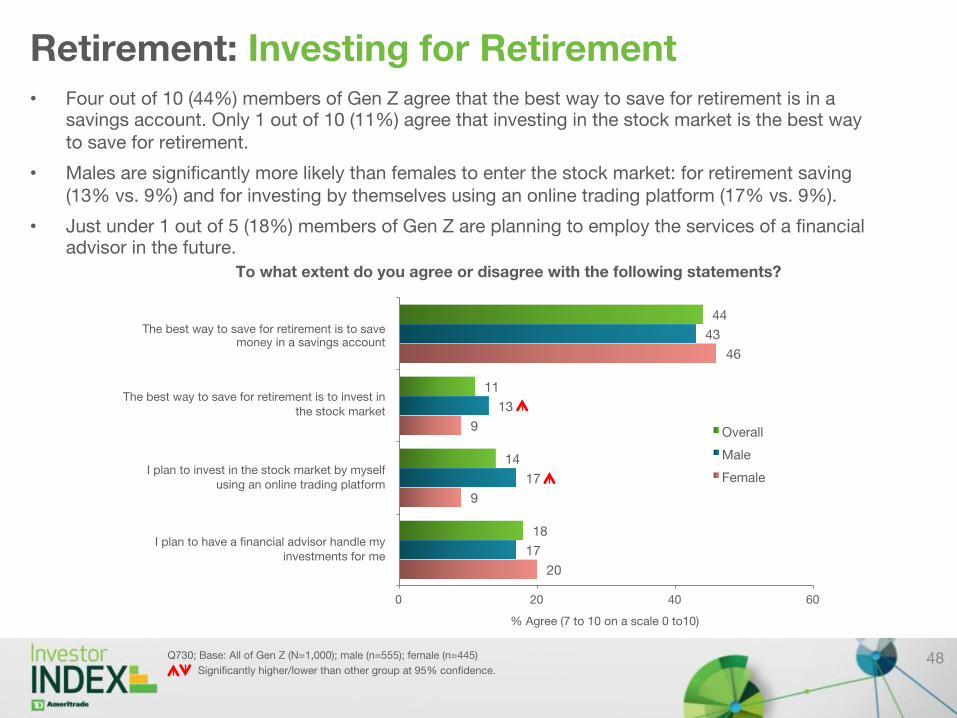
Retirement: Investing for Retirement • Four out of 10 (44%) members of Gen Z agree that the best way to save for retirement is in a
savings account. Only 1 out of 10 (11%) agree that investing in the stock market is the best way to save for retirement.
• Males are significantly more likely than females to enter the stock market: for retirement saving (13% vs. 9%) and for investing by themselves using an online trading platform (17% vs. 9%).
• Just under 1 out of 5 (18%) members of Gen Z are planning to employ the services of a financial advisor in the future.
48 Q730; Base: All of Gen Z (N=1,000); male (n=555); female (n=445)
20
9
9
46
17
17
13
43
18
14
11
44
0 20 40 60
% Agree (7 to 10 on a scale 0 to10)
To what extent do you agree or disagree with the following statements?
Overall
Male
Female
The best way to save for retirement is to save money in a savings account
The best way to save for retirement is to invest in the stock market
I plan to invest in the stock market by myself using an online trading platform
I plan to have a financial advisor handle my investments for me
Significantly higher/lower than other group at 95% confidence.

Appendix: Study Sample Characteristics
49
5
17
25 23
11
19
0
5
10
15
20
25
30
New England Mid-Atlantic South Midwest Southwest West
% o
f G
en Z
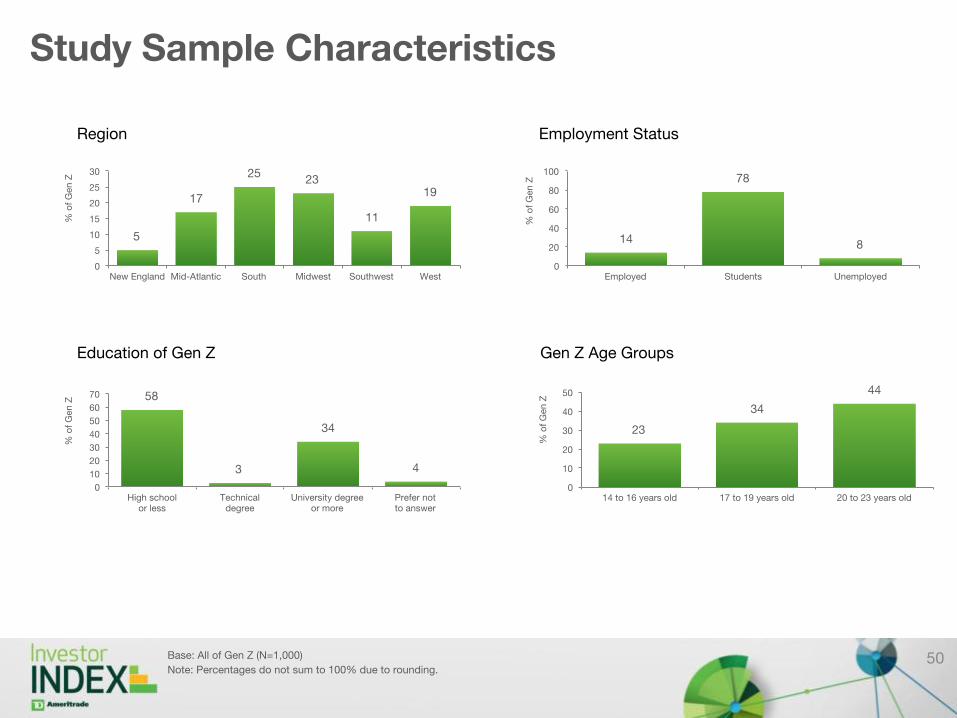
Study Sample Characteristics
50 Base: All of Gen Z (N=1,000)
Note: Percentages do not sum to 100% due to rounding.
Region
14
78
8
0
20
40
60
80
100
Employed Students Unemployed
% o
f G
en Z
Employment Status
23
34
44
0
10
20
30
40
50
14 to 16 years old 17 to 19 years old 20 to 23 years old
% o
f G
en Z
Gen Z Age Groups
58
3
34
4
0
10
20
30
40
50
60
70
High school or less
Technical degree
University degree or more
Prefer not to answer
% o
f G
en Z
Education of Gen Z