Generation of Hazardous Waste in the United Statesinfohouse.p2ric.org/ref/33/32347.pdf11 HAZARDOUS...
17
11 HAZARDOUS WASTE & HAZARDOUS MATERIALS volume 9, Number 1, 1992 llnry Ann Liebert, Inc., Publishers 32 3 47 Generation of Hazardous Waste in the United States RACHEL D. BAKER and JOHN L. WARREN Research Triangle Institute Research Triangle Park, NC 27709 ABSTRACT The Research Triangle Institute conducted comprehensive surveys of the generation and management of hazardous waste for the U. S. Environmental Protection Agency. The survey of waste generation found that 747.4 million tons of hazardous waste were generated by 12,478 large quantity generators during 1986; over 90 percent of the waste was wastewater managed on the site where it was generated and 92 percent of the waste was in the form of wastewaters. This paper will describe data collection methods used in the survey and will describe the sources, geographical distribution, and the characteristics of the hazardous wastes generated in 1986. ’A brief discussion of confidence limits and survey limitations is also included. INTRODUCTION To develop and implement effective pollution prevention policies, companies and government agencies need to know what wastes are actually being generated. This paper summarizes key data on hazardous waste generation from the latest comprehensive survey conducted by the U.S. Environmental Protection Agency (EPA). The survey was initiated in 1987 and includes data for the calendar year 1986. These data serve as a baseline from which to compare alternative regulatory and other policies for reducing the quantity of hazardous waste generated. This paper represents the opinions and expertise of the authors. Though the data were collected for EPA, this paper does not represent EPA policies or conclusions about the data. SURVEY APPROACH The Research Triangle Institute (RTI) conducted a large, multiyear, interdisciplinary project for EPA to collect information on the nation’s generation of hazardous waste and the capacity available to treat, store, dispose, and recycle that waste. EPA’s Office of Solid Waste (OSW) is using this information to assess the nation’s capacity to manage the types of hazardous waste that may be resmcted from land disposal by the regulations implemented under the Resource 19
Transcript of Generation of Hazardous Waste in the United Statesinfohouse.p2ric.org/ref/33/32347.pdf11 HAZARDOUS...

1 1
HAZARDOUS WASTE & HAZARDOUS MATERIALS volume 9, Number 1, 1992 llnry Ann Liebert, Inc., Publishers
32 3 47
Generation of Hazardous Waste in the United States
RACHEL D. BAKER and JOHN L. WARREN
Research Triangle Institute Research Triangle Park, NC 27709
ABSTRACT
The Research Triangle Institute conducted comprehensive surveys of the generation and management of hazardous waste for the U. S. Environmental Protection Agency. The survey of waste generation found that 747.4 million tons of hazardous waste were generated by 12,478 large quantity generators during 1986; over 90 percent of the waste was wastewater managed on the site where it was generated and 92 percent of the waste was in the form of wastewaters. This paper will describe data collection methods used in the survey and will describe the sources, geographical distribution, and the characteristics of the hazardous wastes generated in 1986. ’A brief discussion of confidence limits and survey limitations is also included.
INTRODUCTION
To develop and implement effective pollution prevention policies, companies and government agencies need to know what wastes are actually being generated. This paper summarizes key data on hazardous waste generation from the latest comprehensive survey conducted by the U.S. Environmental Protection Agency (EPA). The survey was initiated in 1987 and includes data for the calendar year 1986. These data serve as a baseline from which to compare alternative regulatory and other policies for reducing the quantity of hazardous waste generated.
This paper represents the opinions and expertise of the authors. Though the data were collected for EPA, this paper does not represent EPA policies or conclusions about the data.
SURVEY APPROACH
The Research Triangle Institute (RTI) conducted a large, multiyear, interdisciplinary project for EPA to collect information on the nation’s generation of hazardous waste and the capacity available to treat, store, dispose, and recycle that waste. EPA’s Office of Solid Waste (OSW) is using this information to assess the nation’s capacity to manage the types of hazardous waste that may be resmcted from land disposal by the regulations implemented under the Resource
19

Conservation and Recovery Act of 1976 (RCRA), as amended by the Hazardous and Solid Waste Amendments of 1984 (HSWA) (1). The results are being used to develop a database to support a wide variety of EPA rulemaking activities, including support for regulatory impact analyses (RIAs), revision of tank-permitting standards, analyses of state capabilities for managing hazardous waste (under Superfund), and related activities.
PHASE I: 1986 SCREENING SURVEY
The initial phase of data collection was the 1986 National Screening Survey (Screening Survey) conducted from January through November 1986. The Screening Survey identified and collected summary information from all hazardous waste treatment, storage, disposal, and recycling facilities (TSDRs) in the United States. The primary objective of this census of more than 5,600 facilities was to gather enough of the same type of information from each TSDR to enable EPA to determine the best method for surveying TSDRs for a more detailed follow-up study. The 1986 Screening Survey collected information on the following:
TSDR facility status,
volume of waste managed in units regulated under RCRA,
volume of waste managed in units exempt from regulation under RCRA but still being used to manage hazardous waste (e.g., exempt wastewater treatment or recycling facilities),
available technologies for managing hazardous waste, and current addresses and contacts.
PHASE II: TELEPHONE FOLLOW-UP
In January and February 1987, a computer-assisted telephone interview follow-up was conducted of the 3,000 active TSDR facilities identified in the 1986 Screening Survey. These facilities were asked to verify and update the data they had provided previously. With this information, RTI determined the approximate number of units of each technology onsite at each waste management facility. This information served as the basis for distributing detailed questionnaires for the subsequent 1987 TSDR S w e y .
PHASE III: 1987 TSDR SURVEY
All active TSDR facilities identified by the telephone follow-up as having treatment, disposal, or recycling technologies were censused for the 1987 National TSDR Survey. These facilities were to be the focus of future analyses. A small sample of the facilities with only storage technologies (usually tanks or containers) was also surveyed for complete population coverage. In total, 2,600 facilities received a detailed package consisting of an instruction booklet and some combination of 15 different questionnaires, depending on the technologies the facility had onsite:
* A * c * E * G * I * K = M - 0
General Facility Information B Incineration Reuse As Fuel D Fuel Blending Solidification F Solvent Recovery Metals Recovery H Wastewater Treatment Other Waste Treatment J Waste Piles Surface Impoundments L Landfills Land Treatment N Injection Wells Tank Systems
20

zardous and Solid Waste op a database to support [ulatory impact analyses labilities for managing
vey (Screening Survey) identified and collected isposal, and recycling sus of more than 5,600 TSDR to enable EPA
follow-up study. The
WRA but still being atment or recycling
dresses and contacts.
N-up was conducted rhese facilities were is information, RTI waste management tstionnaires for the
eatment, disposal, y. These facilities with only storage mlation coverage. booklet and some acility had onsite:
:nt
,,,lrstlonnaire A included requests for a detailed schematic of the facility’s hazardous waste ,Frrntions. The schematic was used to gain a better understanding of the relationships among ,he different technologies onsite at the facility. In addition to these questionnaires, supplemental ;,,5wer spaces and supplemental answer booklets were provided for those facilities that had many
of the same type. Facilities were encouraged to use a “notes” section for any explanatory .,l,,tend they wanted to provide.
c,e questionnaires, totalling 328 pages and 801 questions plus multiple answer options, were .loped over an 18-month period in small group meetings with government officials and
,,ill,try trade associations. Approximately 11,000 individual booklets were sent to the 2,600 .lcll~ties between July 1987 and December 1987. Each facility received only those
i,llrStl~nnaire~ appropriate for the processes that they operate based on the earlier telephone ,lltervlew. Each questionnaire asked for details on the following for the particular type of process:
specific types of technologies employed onsite,
volumes managed,
process design and operating parameters for each unit,
maximum volumes that could be managed,
residuals generated,
planned changes in capacity for existing equipment,
planned changes in capacity using new equipment and processes,
RCRA waste codes managed using the technology,
for commercial facilities, factors affecting the acceptance of waste for management and prices charged for waste management services,
detailed information on facility contacts, and
detailed information for each tank used to manage hazardous waste, placed on a Tank Description Form (TDF).
The initial TSDR survey was mailed in August 1987 with follow-ups for the next six months. As of May 1, 1989, approximately 99 percent of the questionnaires had been returned; these questionnaires have been edited and entered in a computer database (2).
PHASE IV: 1987 GENERATOR SURVEY (GENSUR)
The information collected in the TSDR Survey complements the results from the 1987 National qurvey of Hazardous Waste Generators (GENSUR). A survey population of approximately 41,000 hazardous waste generators was established based on information from the 1985 Biennial Reports (3), and a sample of 10,400 facilities was chosen for the GENSUR. The approximately 2,600 generators included in the TSDR survey were selected with certainty, as were the nation’s 1,000 largest generators. Stratified random sampling was employed to select the balance of the sample with the strata defined by state and the quantity of hazardous waste generated by a facility in 1985. Each selected generator received a survey package consisting of an instruction booklet and nine different questionnaires:
21

GA GB GC GD GE GF GG
* G H GI
General Facility Information Hazardous Waste Characterization Fuel Blending Reuse as Fuel Wastewater Treatment Metals Recovery Solvent Recovery Other Recovery Tank Systems
These questionnaires, including 234 pages and 527 questions with multiple answer options, were developed over an 8-month period in consultation with EPA officials and industry representatives.
PHASE V: DATA MANAGEMENT
After receiving the completed questionnaires, selected portions of each questionnaire were examined by reviewers with an engineering background. These portions were those most critical for determining the facility's capacity for managing hazardous waste. The reviewers used engineering judgment to attempt to identify data inconsistencies. If necessary, telephone follow- up calls to the facility were made. After editing, the data were entered into a dedicated, secure computer and received 100 percent key verification (Le., data were keyed twice). This method ensured that all data were entered into the database as submitted and edited.
Information collected in the surveys was organized into two databases. The TSDR Survey database contained 61 distinct files, and the Generator Survey database contained 41 distinct files. In addition, each database included notes files for each facility, which contained explanatory comments submitted by facilities in their survey questionnaires.
Because of the nature of some of the data collected in the Generator and TSDR Surveys, some responses were claimed as EPA Confidential Business Information (CBI) by respondents. A separate set of stringent security requirements was followed for managing CBI data. Because it was determined that the CBI data did not significantly affect any of the information presented in this paper, CBI data are not included in this paper.
STATISTICAL ISSUES
Adjustments to the Weights
In the TSDR and Generator Surveys, weights are used to make estimates about the entire population of generators and TSDR facilities based on responses by facilities included in the sample. A weight is a factor used to escalate a measurement from a sample to estimate that measurement for the total population. For example, if one facility was sampled from a population of ten similar facilities, multiplying (or weighting) the responses of the facility surveyed by ten gives an estimate of the quantity for the total population.
Initially, weights were defined based on the relative sizes of the total population and the sample of facilities that were surveyed. However, weights were statistically adjusted based on the results of the survey for two reasons: multiplicity and non-response.
First, weights had to be adjusted to correct for multiplicity in the sample frame, which is the list of facilities thought to be large quantity generators in 1986. Multiplicity occurs if a single
22

ple answer options, were industry representatives.
3ch questionnaire were were those most critical . The reviewers used Ssary, telephone follow- into a dedicated, secure d twice). This method ited.
j. The TSDR Survey itained 41 distinct files. contained explanatory
TSDR Surveys, some I) by respondents. A CBI data. Because it
information presented
iates about the entire ilities included in the mple to estimate that was sampled from a ionses of the facility
lation and the sample d based on the results
ime, which is the list :y occurs if a single
i,lcility is included more than once in the sample frame. In this case, a facility may have been ,r,cluded twice under two different EPA identification numbers if the owner or the name of the <,]cility changed and a new number was assigned. Facilities surveyed were asked to indicate any ,drntification numbers that had previously been assigned to that facility. This information was LIsrd to identify multiplicity in the sample frame, and weights were adjusted so that each facility , represented only once.
, i l z second adjustment to the weights was due to non-response, or facilities that received a ,tlrvey but did not return a completed survey. Ninety percent of facilities receiving a Generator Stlrvey questionnaire responded, and approximately 99 percent of facilities receiving a TSDR survey questionnaire responded. Weights for facilities that did respond to the Surveys were ,Idjusted so that the responding facilities represent the total population of facilities.
,411 data presented in this report use these adjusted weights to obtain estimates for the total population of TSDR facilities and large quantity generators during 1986.
~fidence Intervals
BY weighting the data from a sample survey, estimates can be made about the total population of facilities. Confidence intervals are used to measure the accuracy of these estimates. The confidence interval is the range of numbers within which the true value of an estimated number will fall with a certain known probability, based on the statistical design of the survey and the response rates obtained. A 95 percent confidence interval means that if a survey was conducted 100 times, 95 percent of the time the estimates would fall within the range.
r ' r the Generator Survey, the 95 percent confidence interval for the total number of large .,mtity generators nationwide in 1986 is plus-or-minus 575 generators, or plus-or-minus 5
percent of the estimate of 12,478. This means that there is a 95 percent certainty that the actual number of generators was between 11,903 and 13,053. The confidence interval for the total quantity of hazardous waste generated in 1986 is plus or minus 75 million tons. This means that there is a 95 percent certainty that the actual quantity of waste generated was between 672 and 822 million tons.
Generally, regional- and state-level estimates are less certain than the national estimates (Le., these estimates have larger confidence intervals, in percentage terms) because, all else being
iual, the confidence interval increases as the number of facilities surveyed decreases. The ixceptions to this are estimates for North Dakota and South Dakota. These states were censused rather than sampled (i.e., every facility in these states received a survey) and a 100 percent response rate was achieved. Therefore, no sampling error exists for these states, and the totals for these states are not estimates but actual numbers reported.
HAZARDOUS WASTE GENERATION
Data were collected on hazardous waste generation by large quantity generators (LQG) during 986. During 1986, 12,478 LQGs generated 747.4 million tons of hazardous waste. Of this
amount, 39 percent was managed in units subject to RCRA permitting requirements and 61 percent in units exempt from RCRA permitting requirements (e.g., tanks regulated under the Clean Water Act). This hazardous waste managed in exempt units had not been traditionally reported prior to these surveys. Consequently, earlier estimates of the quantity of hazardous waste generated such as those reported in EPA's "The Waste System" (4) did not usually include these wastes. Five percent of the generators accounted for 90 percent of the quantity generated while the largest 10 percent accounted for 96 percent of the hazardous waste generated.
23
25.000
20,000
15,000
10,000
5.000
0
21 ,700a
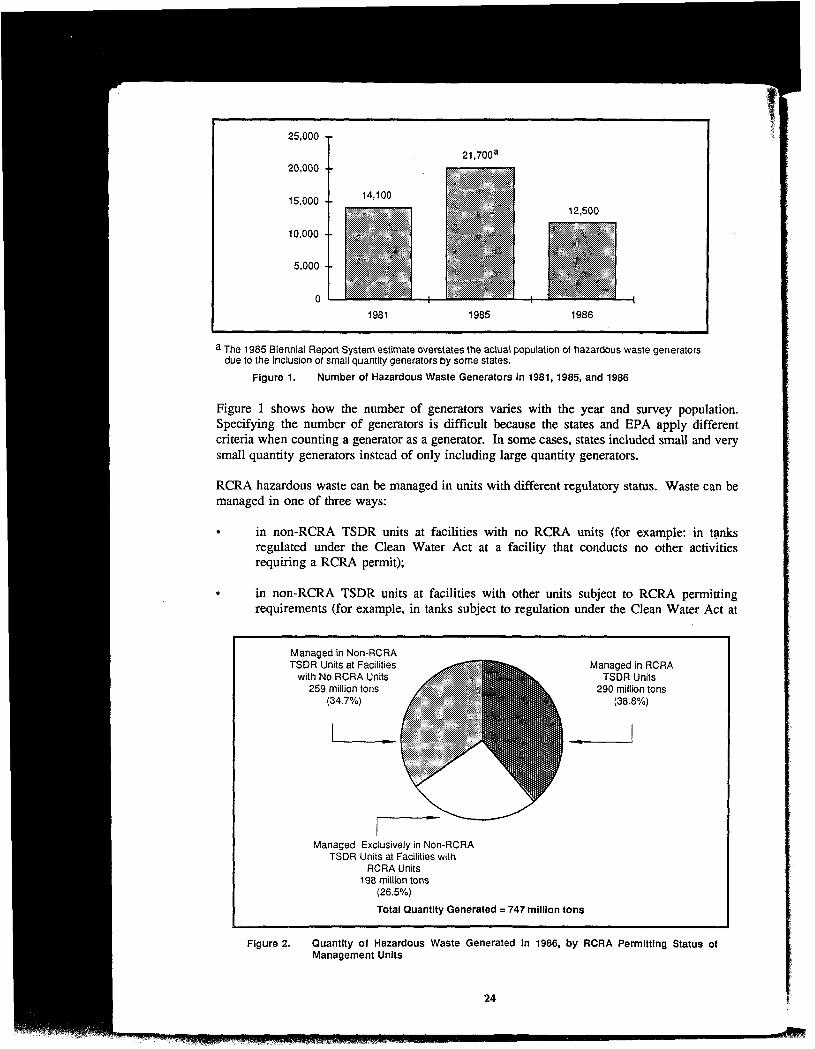
1981 1985 1986 I I a The 1985 Biennial Report System estimate overstates the actual population of hazardous waste generators
due to the inclusion of small quantity generators by some states.
Figure 1. Number of Hazardous Waste Generators in 1981, 1985, and 1986
Figure 1 shows how the number of generators varies with the year and survey population. Specifying the number of generators is difficult because the states and EPA apply different criteria when counting a generator as a generator. In some cases, states included small and very small quantity generators instead of only including large quantity generators.
RCRA hazardous waste can be managed in units with different regulatory status. Waste can be managed in one of three ways:
in non-RCRA TSDR units at facilities with no RCRA units (for example: in tanks regulated under the Clean Water Act at a facility that conducts no other activities requiring a RCRA permit);
in non-RCRA TSDR units at facilities with other units subject to RCRA permitting requirements (for example, in tanks subject to regulation under the Clean Water Act at
Managed in Non-RCRA TSDR Units at Facilities
with No RCRA Units 259 million tons
Managed in RCRA TSDR Units
290 million tons (34.7%) (38.8%)
I Managed Exclusively in Non-RCRA
TSDR Units at Facilities with RCRA Units
198 million tons (26.5%)
Total Quantity Generated = 747 million tons
Figure 2. Quantity of Hazardous Waste Generated in 1986, by RCRA Permitting Status of Management Units
24

N wl
ihat was generated in the region indicated. I Region VI
Figure 3. Quantity of Hazardous Waste Generated per EPA Region in 1986 (in million tons)
a facility that also has other units used to manage RCRA hazardous wastes and subject to permitting under RCRA); and
in RCRA TSDR units (for example, in a landfill at a facility subject to RCRA permining requirements).
Figure 2 shows the distribution of wastes generated among these three categories. When the survey was conducted in 1987, facilities had traditionally only reported those RCRA hazardous wastes that were managed in units subject to RCRA permitting requirements. These surveys provided a means of better understanding how wastes were managed in both RCRA and non- RCRA units.
In addition, waste distribution varies by state and region. Figure 3 shows the distribution by EPA region with the largest quantities generated in Regions V and VI.
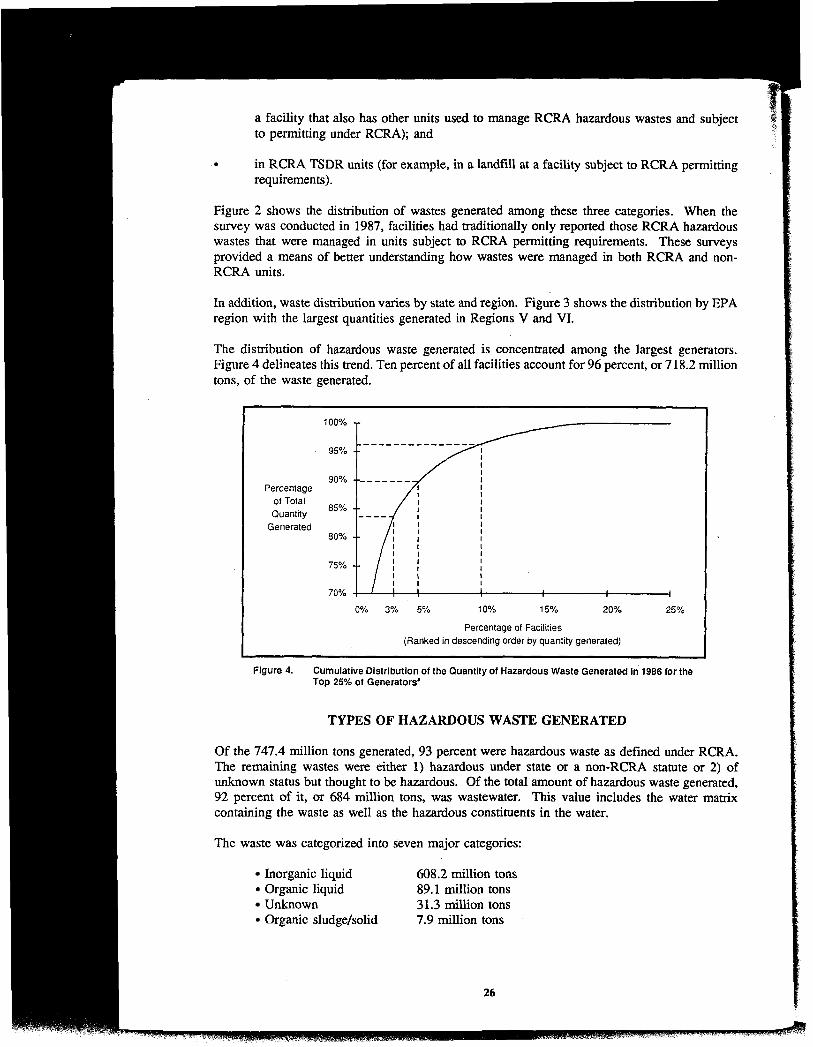
The distribution of hazardous waste generated is concentrated among the largest generators. Figure 4 delineates this trend. Ten percent of all facilities account for 96 percent, or 718.2 million tons, of the waste generated.
100% - 95% --
Percentage of Total Quantity
Generated
I
0% 3% 5% 10% 15% 20% 25%
Percentage of Facilities (Ranked in descending order by quantity generated)
Figure 4. Cumulative Distribution of the Quantity of Hazardous Waste Generated in 1986 for the Top 25% of Generators’
TYPES OF HAZARDOUS WASTE GENERATED
Of the 747.4 million tons generated, 93 percent were hazardous waste as defined under RCRA. The remaining wastes were either 1) hazardous under state or a non-RCRA statute or 2) of unknown status but thought to be hazardous. Of the total amount of hazardous waste generated, 92 percent of it, or 684 million tons, was wastewater. This value includes the water matrix containing the waste as well as the hazardous constituents in the water.
The waste was categorized into seven major categories:
Inorganic liquid Organic liquid Unknown Organic sludgeholid
608.2 million tons 89.1 million tons 3 1.3 million tons 7.9 million tons
26

)us wastes and subject
:t to RCRA permitting
:ategories. When the ose RCRA hazardous ients. These surveys loth RCRA and non-
: distribution by EPA
e largest generators. :ent, or 718.2 million
P
25%
~
11986 for the
ned under RCRA. 1 statute or 2) of s waste generated, the water matrix
DO01
(1.4%) Unknown 10.1 million tons
82.0 million tons
\ DO02 All other mixlures 47.7 million tons
(6.4%)
AII other single codes 40.8 million tons
(5.5%)
Mixtures with DO01 -0003 21 1 .O million tons
(28.2%)
216.1 million tons (28.9%)
DO03 5.2 million tons
DO07 29.9 million tons
(4.0%)
12.3 million tons (1.6%)
I \ F006 24.5 milllOn tons 14.8 million tons <0.1 million tons (1,7010)
KO62 KO24 12.8 million tons /
K048-KO52
(3.3%) (2.0%) (CO. 1 %)
Total z 747 million tons ~
Figure 5. Quantity of Hazardous Waste Generated in 1986 by RCRA Waste Code
Inorganic sludge Inorganic solid Other mixtures
6.9 million tons 3.7 million tons 0.2 million tons
Facilities also characterized the hazardous waste generated by several codes: the RCRA waste code, waste description code, a waste source code, and a SIC code. Figure 5 shows the distribution of wastes among RCRA waste code categories. Facilities were able to characterize wastes using more than one RCRA waste code; these “mixtures” are often wastes that are best described by several different waste codes. For example, the largest single waste stream is described by several different codes. The 25 largest volume wastes by RCRA code(s) are shown in Figure 6. Those wastes with more than one RCRA code are best described by the generators using multiple codes.
The survey focused on all hazardous waste, both RCRA and non-RCRA. However, the majority of the hazardous waste generated is hazardous under RCRA. Figure 7 shows this distribution of wastes. Wastes that were unknown had data provided but no RCRA or other codes to classify them as RCRA wastes.
We have known that most hazardous waste is wastewater. The results of the survey confirm this. Almost 92 percent of all hazardous waste generated is wastewater. Figure 8 shows the distribution between wastewater and non-wastewater.
Figure 9 shows the distribution of waste quantity by predominant physical and chemical characteristics. Over 80 percent of the hazardous waste generated, or 608.2 million tons, was inorganic liquids, including caustic or acidic solutions requiring pH adjustment.
27

140
120
Quantity of 100 waste
a0 generated
by RCRA code (million tons) 60
40
20
0 DO02 XWWLwO2 wO7 KO48 Do01 w 0 2 KO62 F024 XSCRDOOl FOO6 w07 wO8 DO02 XPBl XA34 w02 K104 Do04 DO03 K t l l 0002 F005 w07
F002 KO49 UO19 w07 d001 F003 w 0 7 K l l l DO05 K112 wO3 P106 DO08 FOO3 KO51 U l88 w02 DO08 K112 DO06 U080 F005 XWWLU220 w 0 3 K116 DO07 u112 FOO6 U239 F003 d008 U154
F005 d009 u220 d010 d001 K002 w02 K003 d003 K005 f002 K W F002 K007
RCRA code (number of wastes generated in parentheses)
:igure 6. Twenty-flve Largest Volume Wastes Generated During 1986

-L
W 0)
Gl U Y
RCRA code (number of wastes generated in parentheses)
6.
KWZ KO03 K005 K006 KO07
0
t
I I
I N ul

SOURCES OF HAZARDOUS WASTE GENERATED
Wastes were categorized by the source of the generation-industrial, ownership, and waste source category. Five industries accounted for 84 percent of the waste generated: Standard Industrial Classification (SIC) 28 (Chemical products), 51%; SIC 36 (electronics), 9.1%; SIC 29 (petroleum and coal products), 9.1%; SIC 33 (Primary metals), 7.6%; SIC 37 (transportation equipment), 6.8%; and all others, 16%. Facilities under federal ownership which were listed in the 1985 RCRA biennial survey generated 6.3 percent of all hazardous waste generated while privately owned facilities generated 92.8 percent.
Facilities were asked to characterize their wastes by whether it was routine or non-routine and whether the waste was primary or secondary. Figure 10 shows the distribution of waste among these categories. Routine wastes are associated with typical plant operations and are usually directly related to the level of production in a unit or process operation. Non-routine wastes come from spills, clean-ups, and similar non-periodic sources. Many surface impoundments were being closed during 1986 resulting in the generation of a non-routine waste; however, we do not know the extent to which these operations are still occumng. Figures 11 through 15 detail the
I Waste Source Total Non-Routine Unknown I Category Routine
Prlmary 528.8 11.1 0.0 539.9
Secondary 126.7 5.2 0.0 131.9
Unknown 0.0 4.1 71.5 75.6
1 Total I 655.5 20.4 71.5 1 747.4 -1 Note: Primary sources of hazardous waste are production-related activities. Secondary sources
are waste management activities. Routine sources are activities that occur regularly as part of business activity. Non-routine sources are accidental or one-time activities (e.g., spills, closure of a tank, etc.).
.
Figure 10. Quantity of Hazardous Waste Generated In 1986 by the Source of the Waste (million tons)
Olher Production Processes 106.1 million tons Electroplating
Hydrogenation
Distillation and Fractionation
Nitration
Pickling
Spray Rinsing
Other
0% 25% 50% 75% 100%
Note: Bars show the percentage ot the total quantity of hazardous waste from primary/routine sources that was generated by the type of source indicated.
aPrimary/routine sources of hazardous waste are production-related activities that occur regularly as part of
Figure 11.
business activity.
Most Common Sources of Primary/Routine' Hazardous Waste Generation by the Quantity Generated In 1986
30

D
tip, and waste source Standard Industrial
); SIC 29 (petroleum xtation equipment), : listed in the 1985 ated while privately
or non-routine and ion of waste among ms and are usually Non-routine wastes mpoundments were however, we do not irough 15 detail the
Total
539.9
131.9
747.4 1 sources rly as (e.@,
? Waste (million
___I
100%
ine sources that
iularly as part of
ratlon by the
78.5 million tons Wastewater Treatment
-I.
Incineration 19.1 I
Regenerating 8.1
4.
Other 17 IO 0% 25% 50% . 75% 100%
Note: Bars show Ihe percentage of the total quantity of hazardous waste from secondary/rouline sources that was generated by the type of source indicated.
aSecondary/routine sources of hazardous waste are waste management activities that occur routinely as part of business activity.
Figure 12. Most Common Sources of Secondary/Routine' Hazardous Waste Generation by the Quantity Generated In 1986
waste sources for pnmarylroutine, secondarylroutine, pnmarylnon-routine, secondarylnon-routine, and unknownlnon-routine hazardous waste generation.
1-igure 16 details the industries generating the largest quantities of hazardous waste by two-digit .C (standard industrial classification) code. The industries (four-digit SIC-level) generating the
most waste are listed in descending order in Figure 17. In some cases more than one SIC code was used to describe the industry generating the waste. Generally, SIC codes are good indicators of the overall type of business generating the wastes. However, we have found that at the very specific process level the SIC may not be as relevant for cross-industry analyses.
Over 93 percent of the generators of hazardous wastes were privately owned companies. These
T
Clean Out of Proouction 10.9
Discarding of Off-Spec Material 0.2 million tons i Discarding of Out-of-Date Material <0.1 I
0% 25% 50% 75% 100%
Note: Bars show the percentage of the total quantity of hazardous waste from primary/non-routine sources that was generated by the type of source indicated.
aPrimary/non-routine sources of hazardous waste are production-related activities that are accidental or one- time activities.
Figure 13. Most Common Sources of Primary/Non-Routine' Hazardous Waste Generation by the Quantlty Generated in 1986
31

Clean-up Spill Residues 2.6 million tons
t Other Remedial Action 2.1
t Closure of Surface Impoundments
I 0% 25% 50% 75% 100%
Note: Bars show the percentage of the total quantity of hazardous waste lrom secondary/non-routine sources that was generated by the type of source indicated.
aSecondary/non-routine sources of hazardous waste are waste management activities for wastes generated
Figure 14.
from accidental or one-time activities.
Most Common Sources Of Secondary/Non-Routine' Hazardous Waste Generation by the Quantity Generated In 1986
firms accounted for 93 percent of all hazardous waste generated. Over 300 federal facilities accounted for in this survey accounted for only 6.3 percent of the waste generated.
FUTURE TRENDS AFFECTING HAZARDOUS WASTE DATA
The Hazardous Waste Survey data cover the calendar year 1986 and can be used as a baseline by which to evaluate changes in hazardous waste generation since 1986. Several factors affect
Accidental Spills 2.1
Other Clean Out or Closure 1.7
I i
0% 25% 50% 75% 1 0 0%
Note: Bars show the percentage of the total quantity of hazardous waste from unknown/non-routine sources that was generated by the type of source indicated. The quantities of hazardous waste generated (in million tons) by each type of source are shown next to the bars.
aUnknown/non-routine sources of hazardous waste are accidental or one-time activities that cannot be
Figure 15.
categorized as primary (production-related) or secondary (waste management).
Most Common Unknown Sourcesof Non-Routine' Hazardous Waste Generation by the Quantity Generated in 1986
32
B f

I tons
$----.------I 5 % 100%
- -
try/non-rouline
'or wastes generated
ite Generation by
300 federal facilities znerated.
DATA
e used as a baseline :everal factors affect
100%
Ion-routine sources aste generated (in
at cannot be
neratlon by the
28 Chemical Products
36 Electronics
29 petroleum 8 Coal Products
33 Primary Metals
37 Transportation Equipment
All Other lndustrtes 121a
0% 25% 50% 75% 100%
Quantity of hazardous waste generated in million tons.
Figure 16. Largest General Industries by the Quantity of Hazardous Waste Generated
hazardous waste generation. One important set of factors is the level and type of production or other business activity that facilities generate. These economic factors vary from year to year and industry to industry, so their effects are difficult to assess.
\ jecond factor that affects hazardous waste generation is changes in the regulatory environment. . .ong the major regulatory changes affecting hazardous waste generation and management
~ctivities since 1986 are the implementation of
land disposal prohibitions authorized by the Hazardous and Solid Waste Amendments (HSWA),
minimum technical requirements for surface impoundments authorized by HSWA,
9 the toxicity characteristic leachate procedure (TCLP) test to determine if a waste is toxic and therefore hazardous under RCRA, and
EPA and state activities to encourage indusmal pollution prevention.
These changes, and their probable impact on the results of the survey, are discussed at length in reference 5.
Finally, the amount of hazardous waste generated may not change, but the amount reported or required to be reported may be changed by the states. This results in changes in the quantity of hazardous waste generated that is due to paper adjustments only. This particular factor makes
mparing data collected at different times difficult unless the user is aware of the precise conditions under which the data were collected.
With the well described baseline provided by these surveys, future data collection efforts may be able to address issues such as measuring waste reduction and toxicity reduction. Any survey that attempts to be comprehensive, however, will face the same serious challenges faced by this survey. Data collection is time consuming and expensive, data requirements differ for different
33

c w $12 N w N N N m m
! n m
P - W w w
If
'0 w
(OW " N N
P 0
m
3 s 0
.. ." m W I
0 0 - 0 0 0 * 0 N 0 0 W m
2 n
L

' D & Z m m m N N N
(ow 00 - - h 0
N O - -0 m % % % - H N w m m o w m % w % m m m m
m m m m
h w N N
w w N N
f! O 0
(0
N
- m
m
53 c ?
-el ulc U N o m
D- a i t
! > , B
' 0 0, ' 0 w I" t m w
! I
Lo W
N m
indusmal sectors and the nature of the data that need to be collected depends strongly on the of the data analysis.
REFERENCES
Resource Conservation and Recovery Act, Subtitle C, Sections 3001-3013,42 N.S.C., Sections 6921-6934 (1976) and Supplement N (1980).
"1986 National Survey of Hazardous Waste Treatment, Storage, Disposal and Recycling Facilities", United States Environmental Protection Agency, Office of Solid Waste, EPN530-SW-88-035, 1988.
" 1985 National Biennial Report of Hazardous Waste Generators and Treatment, Storage and Disposal Facilities Regulated under RCRA", United States Environmental Protection Agency, Office of Solid Waste and Emergency Response, EPAl530lsw-89l033, 1989.
"The Waste System", United States Environmental Protection Agency, Office of Solid Waste and Emergency Response, November 1988.
"National Survey of Hazardous Waste Generators and Treatment, Storage, Disposal and Recycling Facilities in 1986", United States Environmental Protection Agency, Office of Solid Waste and Emergency Response, EPN530-SW-91-060, 1991.
35