Generating vector data and statistics from the Stamp survey Dr Humphrey Southall & Dr Brian Baily...
40
Generating vector data and Generating vector data and statistics from the Stamp statistics from the Stamp survey survey Dr Humphrey Southall & Dr Brian Baily University of Portsmouth
-
Upload
franklin-holland -
Category
Documents
-
view
218 -
download
0
Transcript of Generating vector data and statistics from the Stamp survey Dr Humphrey Southall & Dr Brian Baily...

Generating vector data Generating vector data and statistics from the and statistics from the
Stamp surveyStamp survey
Dr Humphrey Southall &
Dr Brian Baily
University of Portsmouth
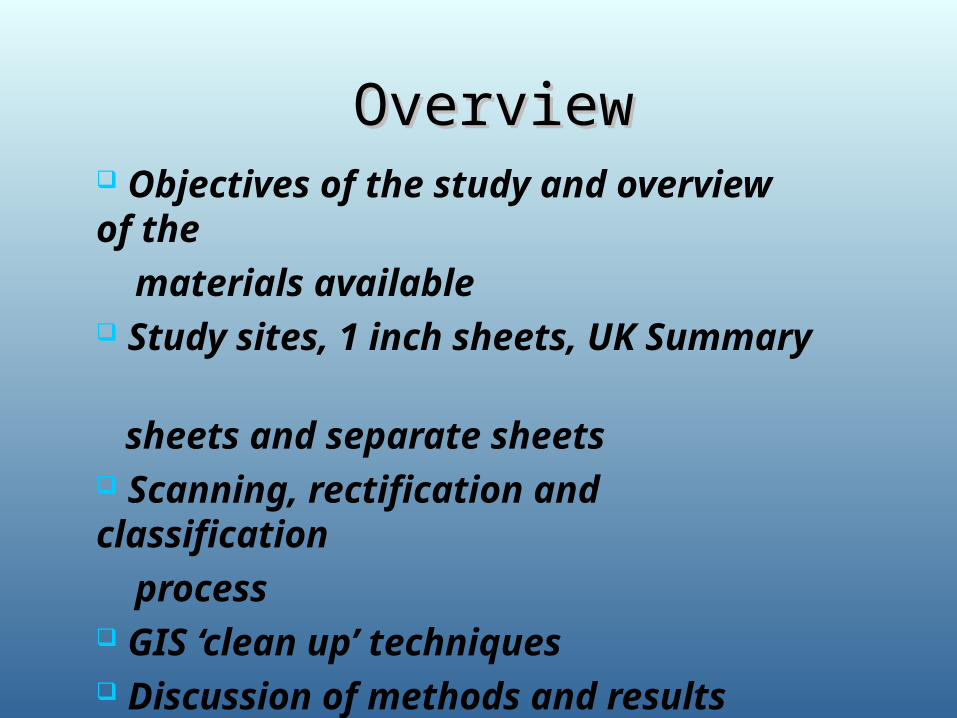
OverviewOverview Objectives of the study and overview of the
materials available Study sites, 1 inch sheets, UK Summary
sheets and separate sheets Scanning, rectification and classification
process GIS ‘clean up’ techniques Discussion of methods and results Areas for further research

During the 1930s, the Land-Utilisation Survey of Great Britain, directed by Professor L. Dudley Stamp, created a detailed record of the major land uses in England, Wales and southern Scotland.
This information was published on a set of 169 map sheets, using Ordnance Survey 1” maps as a base, and displaying land uses via a colour overlay

Surviving materialsSurviving materials
Published ‘One Inch’ maps: The principal output from the Stamp Survey was a set of 169 1” maps
Published ‘Ten miles to one inch’ maps: Summary sheets at ten miles to the inch or (very similar) 1:625,000
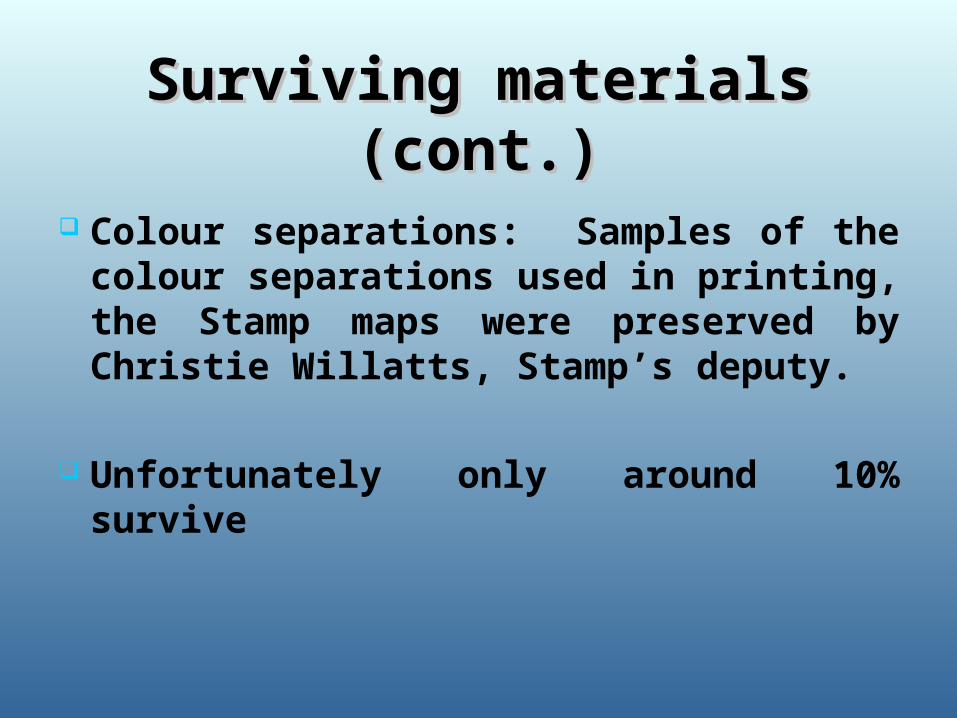
Surviving materials (cont.)Surviving materials (cont.)
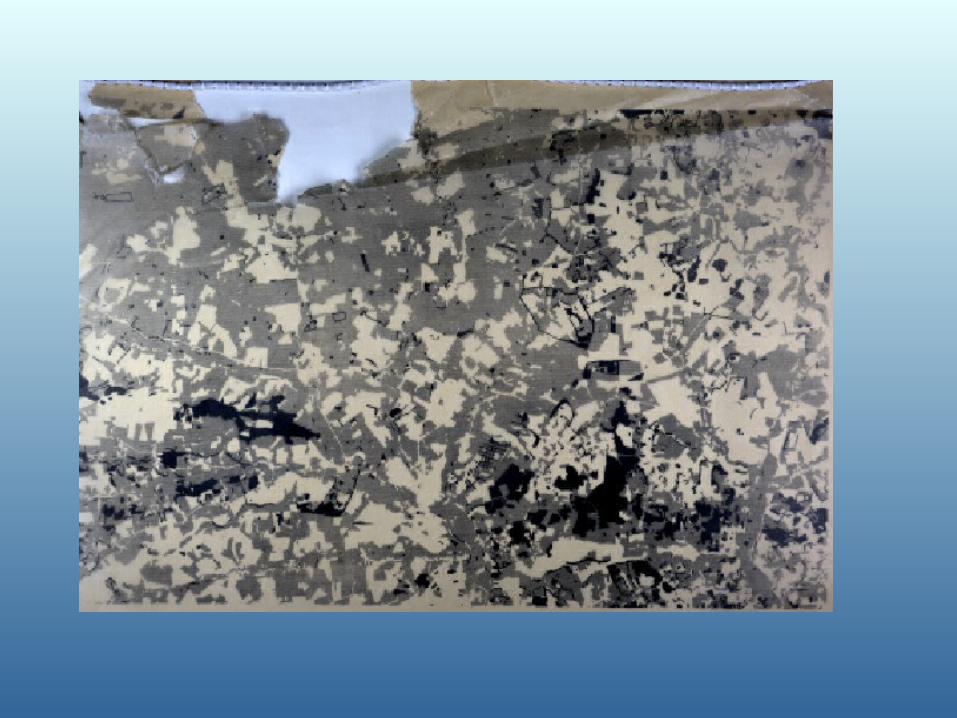
Colour separations: Samples of the colour separations used in printing, the Stamp maps were preserved by Christie Willatts, Stamp’s deputy.
Unfortunately only around 10% survive
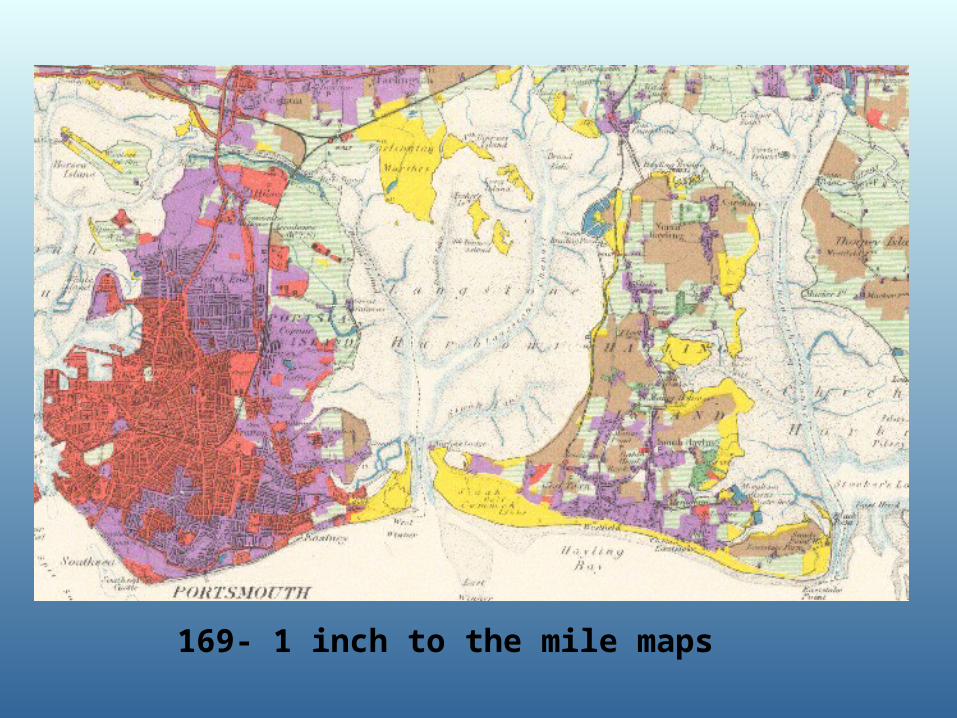
169- 1 inch to the mile maps
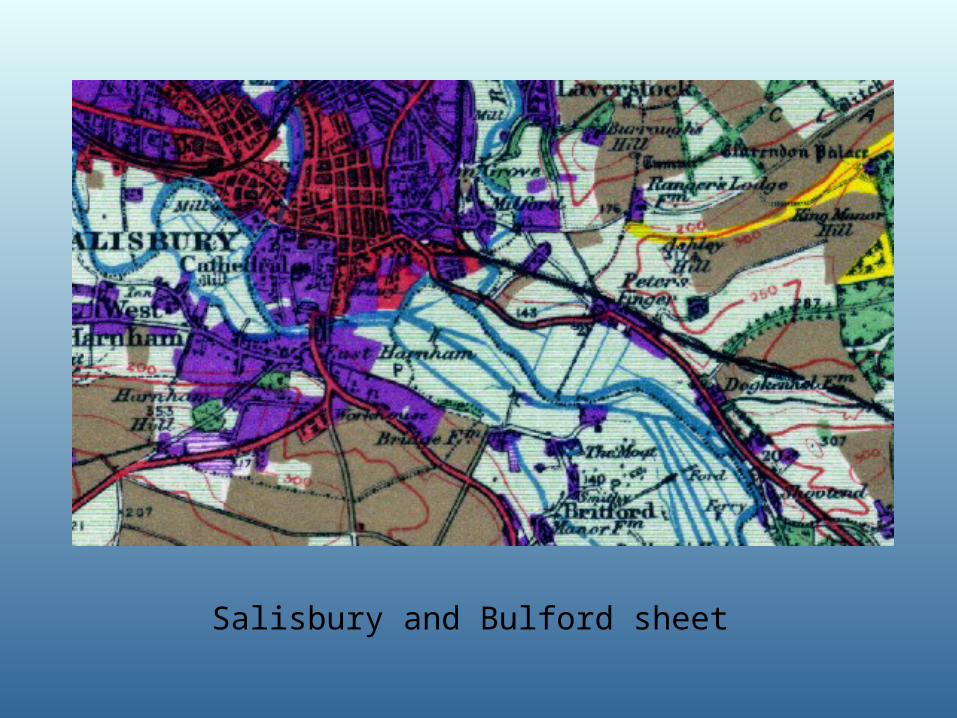
Salisbury and Bulford sheet
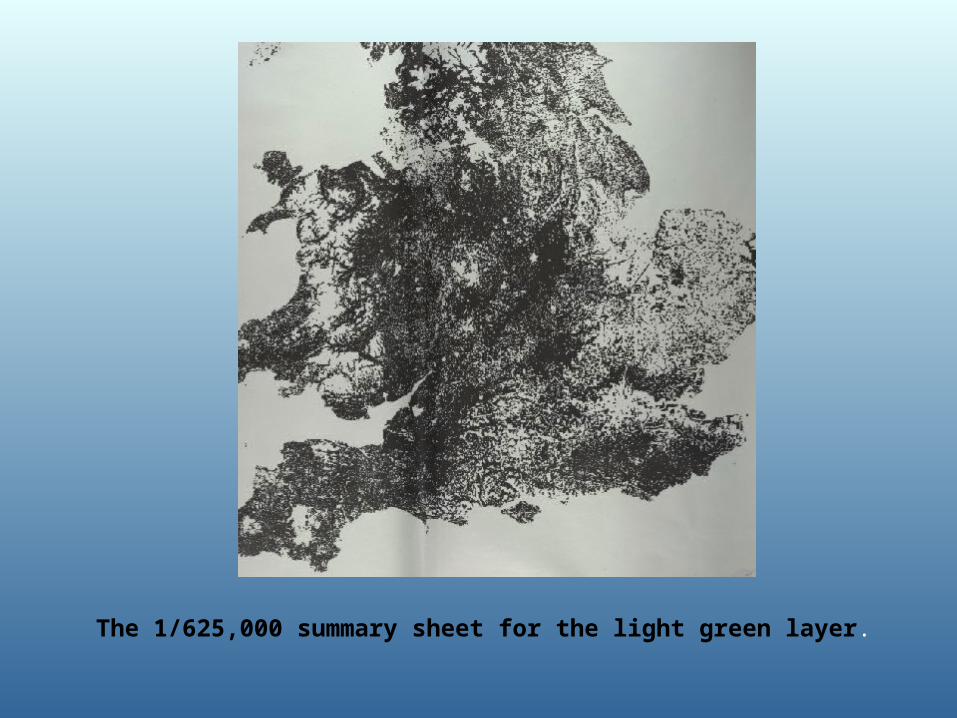
The 1/625,000 summary sheet for the light green layer.
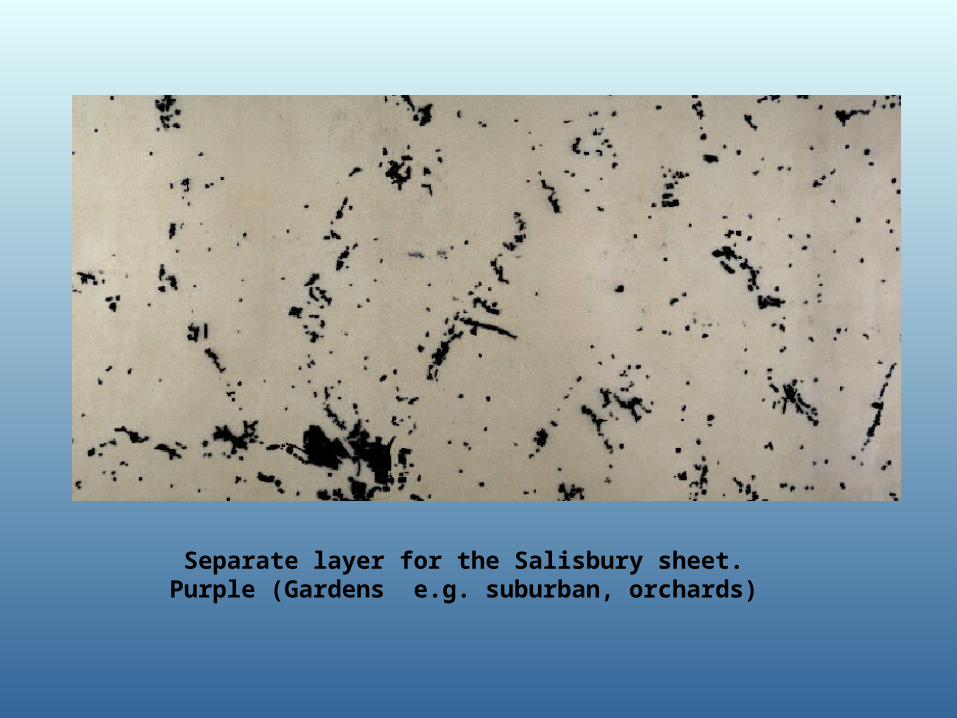
Separate layer for the Salisbury sheet. Purple (Gardens e.g. suburban, orchards)

The primary case study is based on the south-east quadrant of the Salisbury and Bulford sheet, covering the city of Salisbury and the water meadows of the River Avon, as well as parts of Salisbury Plain. An additional case study covers the Birmingham sheet.
Additional work was carried out on the 1/625,000 UK summary sheet separate layers
Most recent stage of the research
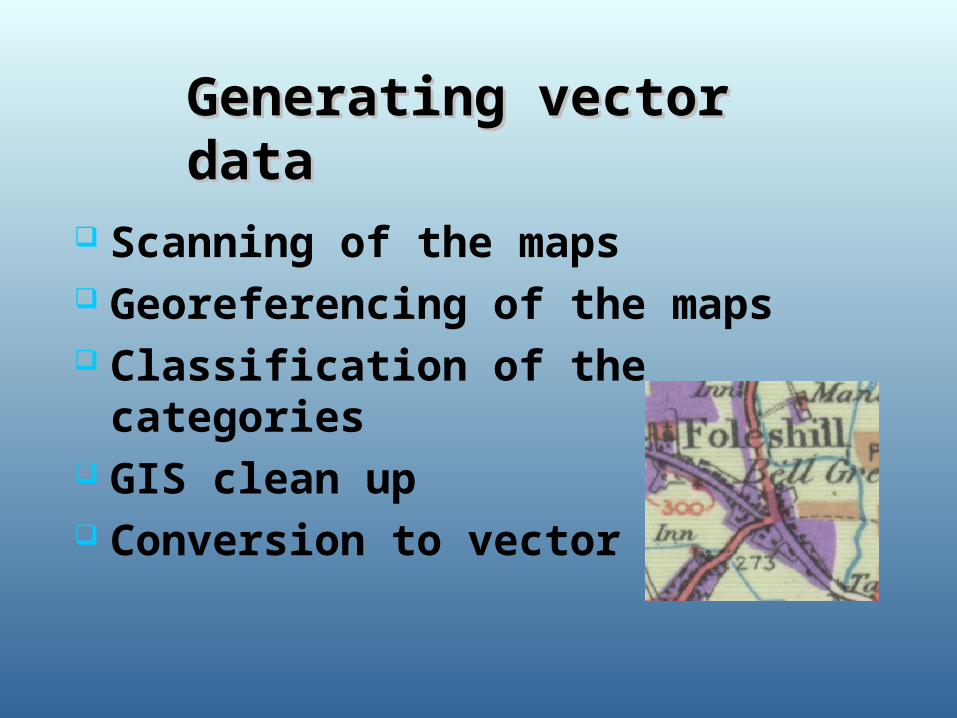
Scanning of the maps Georeferencing of the maps Classification of the categories GIS clean up Conversion to vector data
Generating vector dataGenerating vector data

Crisping the image

Georeferencing—the process of assigning map coordinates to image data and resampling the pixels of the image to conform to the map projection grid.

GCPs on the Salisbury sheet (blue separation)

Extraction of classesExtraction of classes
Automatic extraction made difficult by ‘clutter’

Multiple categories
Overlap
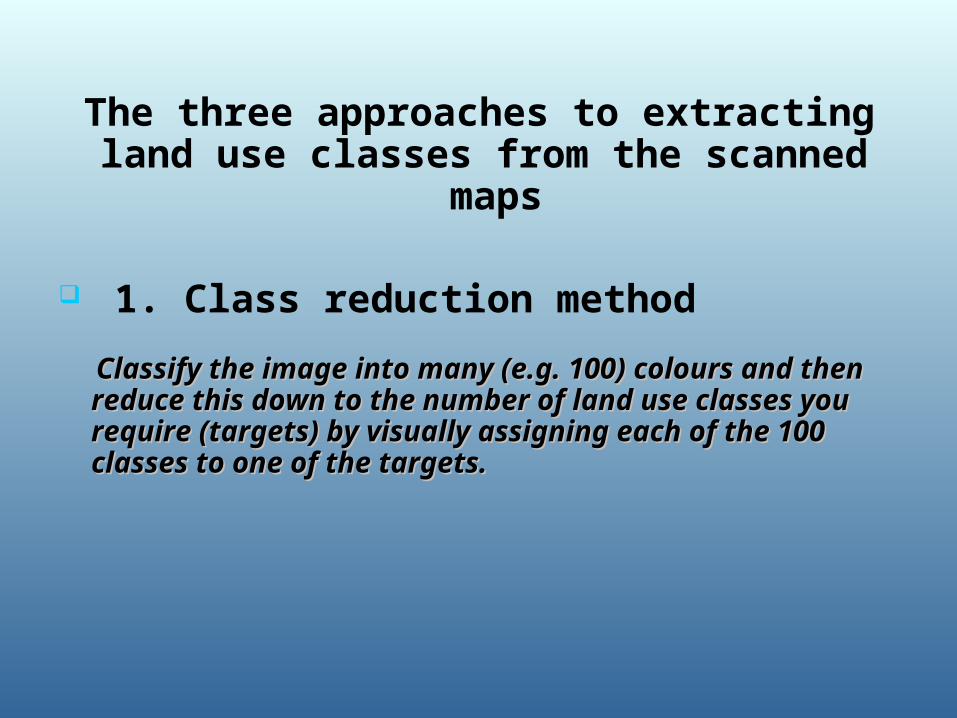
The three approaches to extracting land use classes from the scanned maps
1. Class reduction method
Classify the image into many (e.g. 100) colours and then Classify the image into many (e.g. 100) colours and then reduce this down to the number of land use classes you reduce this down to the number of land use classes you require (targets) by visually assigning each of the 100 classes require (targets) by visually assigning each of the 100 classes to one of the targets.to one of the targets.

2. Manual digitising Most accurate Little editing Allows separation of woodland types etc.


3. Semi automated classification
Import raster data
Sharpen image
Georeference image
Choose ‘training areas’ and run supervised classification
Remove initial unwanted information
Convert to vector map and do further ‘tidying up’, such as the removal of remaining unwanted detail
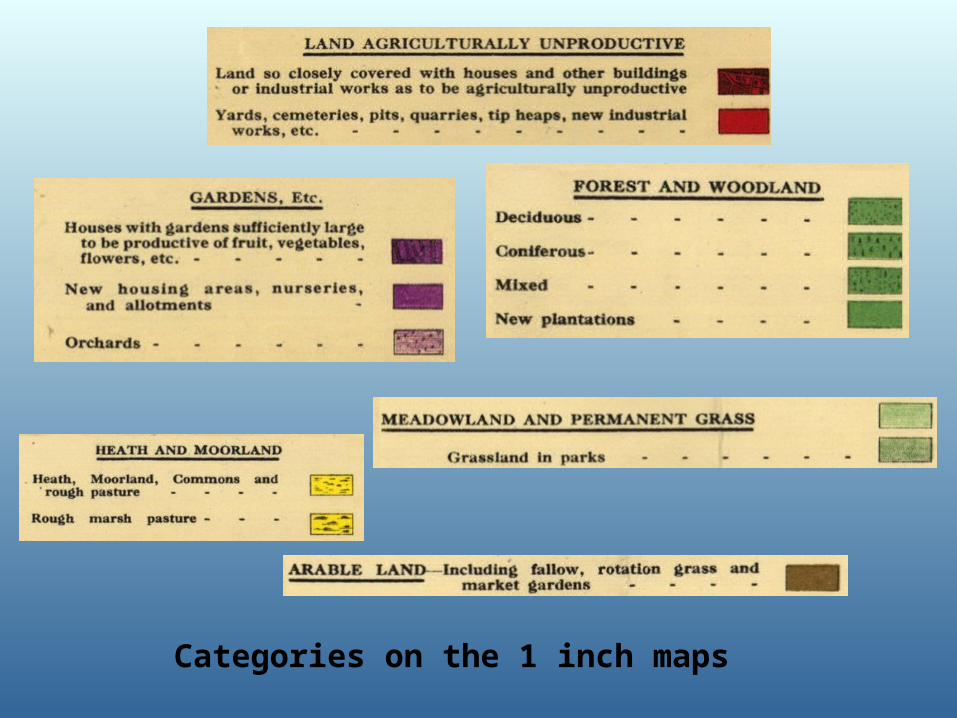
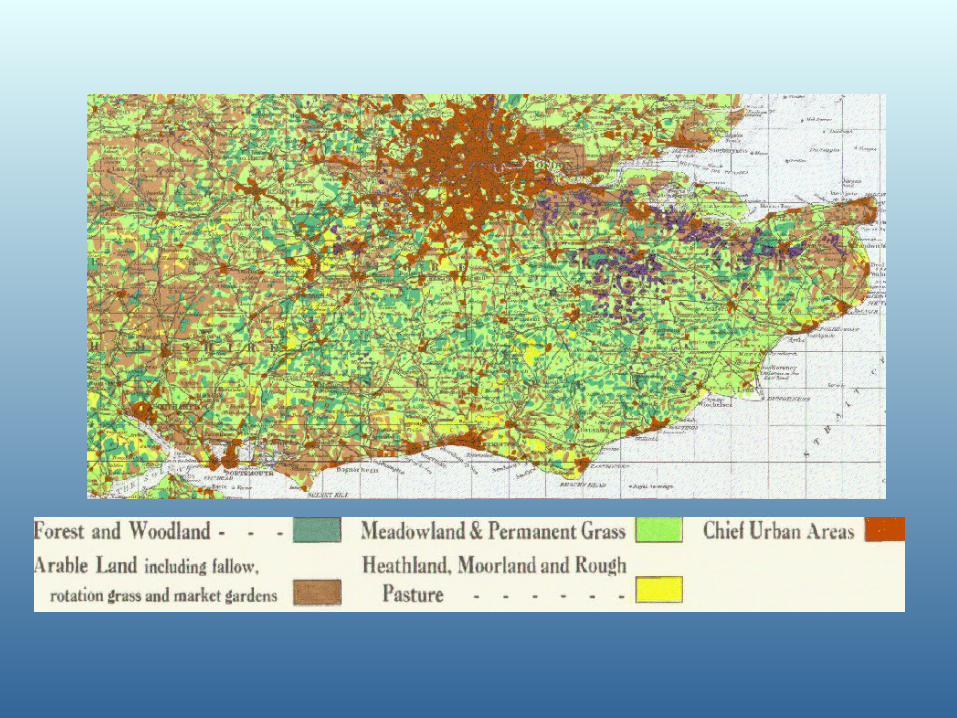
Categories on the 1 inch maps

Initial map class Colour / detail
Black topological detail and text
Black - To be removed
Forest and woodland Green with black symbols - combined from 3 subclasses
Meadowland and permanent grass
Light green (hatched line symbol)
Arable land Brown
Water Blue, sometimes with white lines
Heath and moorland Yellow
Land agriculturally unproductive (e.g.
Urban core)
Red
Gardens etc (e.g. suburban)
Purple
The various land use classes extracted from the whole LUS sheets.

Supervised training is closely controlled by the analyst.
In this process, you select pixels that represent patterns or land cover features that you recognize,
By identifying patterns, you can instruct the computer system to identify pixels with similar
characteristics.
Supervised classification

Showing an area of forest including clutter, extracted for training purposes.

A classified image (left) and the original red colour separation for the Salisbury and Bulford map.
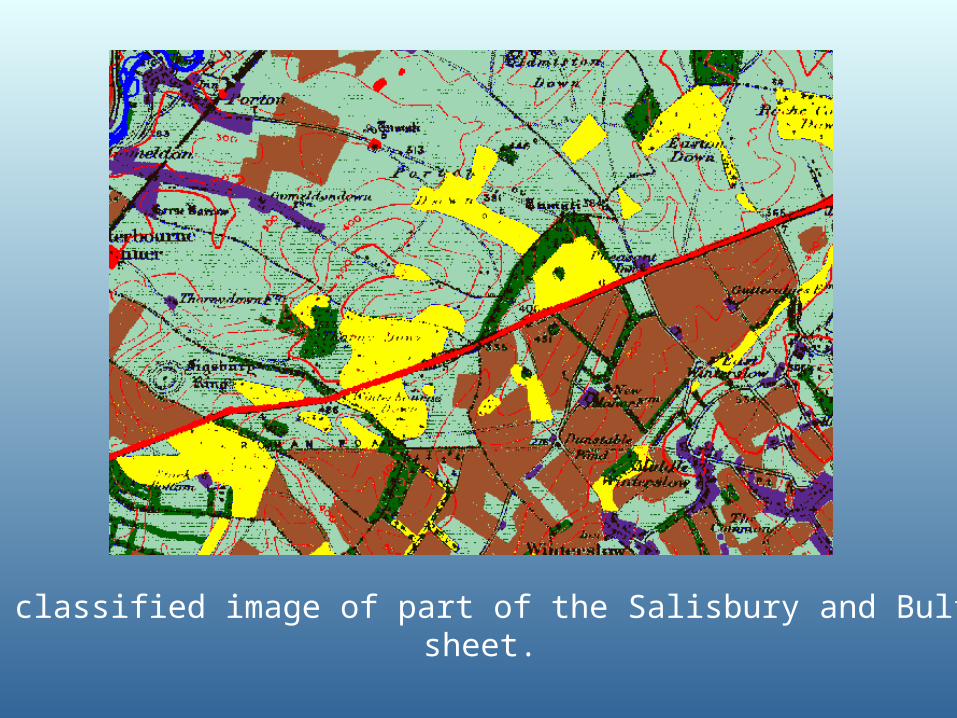
A classified image of part of the Salisbury and Bulford sheet.
GIS clean up
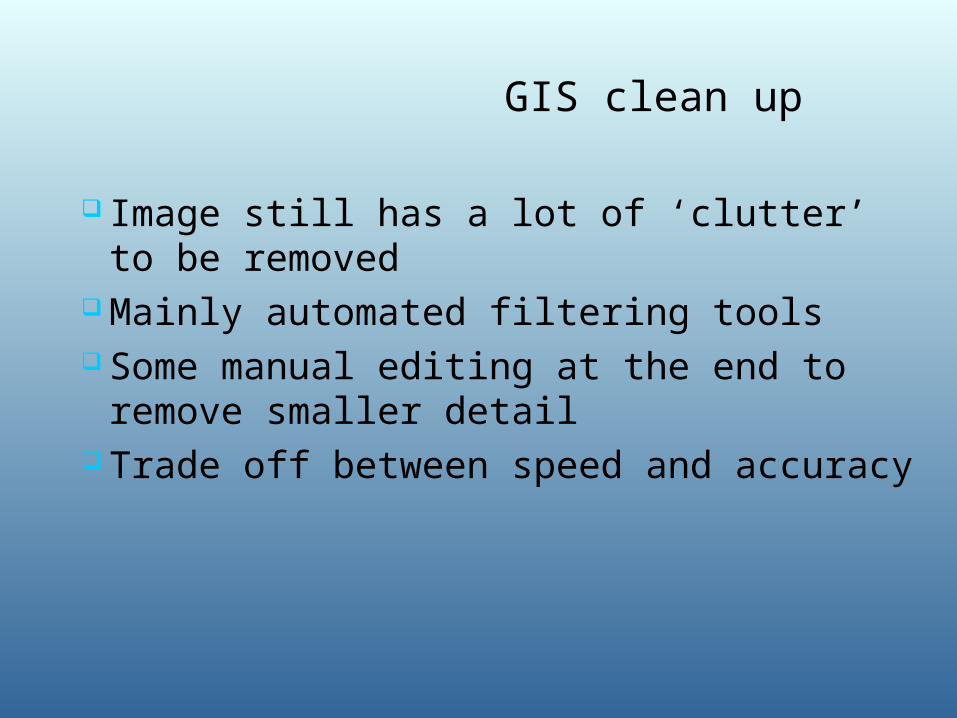
Image still has a lot of ‘clutter’ to be removed Mainly automated filtering tools Some manual editing at the end to remove
smaller detail Trade off between speed and accuracy

A classified image after the neighbourhood filter has been used.
Removal of black detail
Use Arc Grid ‘focalmajority’. This successfully removes most linear features, such as road casings, and narrow text
Use ArcGrid ‘nibble’ function. This allows all other classes to eat into the black’ nodata’ areas, completely removing them.
Eliminate smaller parcels

Discussion of the results
Methods all appear to work with advantages and disadvantages to each
Problems with unwanted detail
High amount time in the process required for editing
Problems can be overcome with the separate layers, however this is not without problems

Blue, brown and purple overlap on a whole sheet. There is also overlap from the striped green layer.

Area calculations for a small section of purple overlap
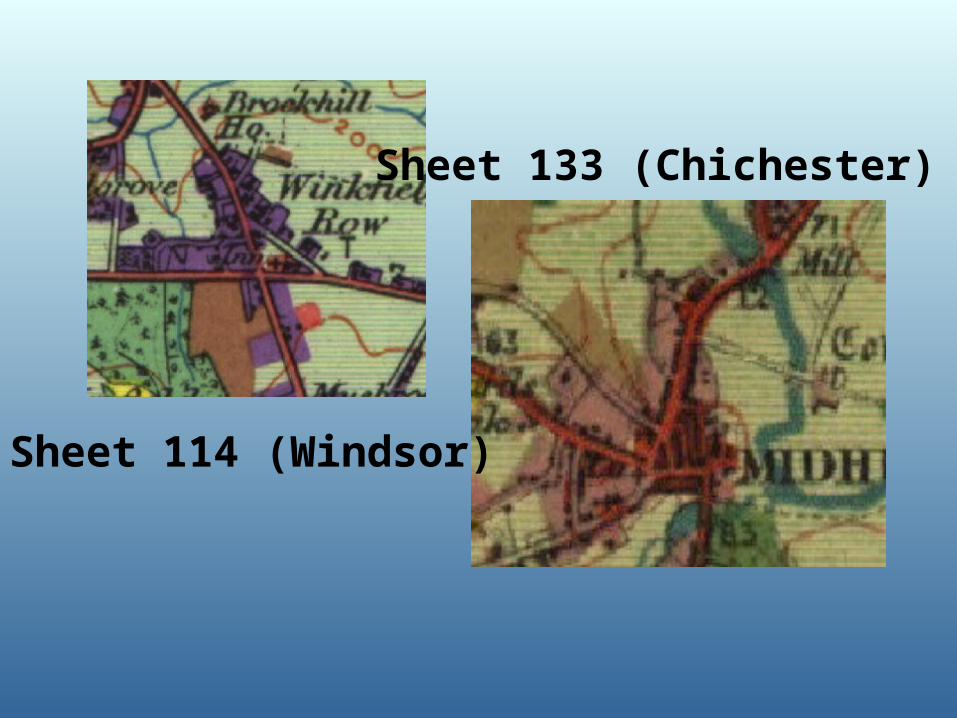
Sheet 114 (Windsor)
Sheet 133 (Chichester)

Supervised classification
Estimated 11.5 hours per map
Maps England - 118 maps X 11.5 hrs = 1357 hrs
Maps Wales - 17 maps X 11.5 hrs = 195.5 hrs
Maps Scotland - 37 maps X 11.5 hrs = 425.5 hrs

Manual digitising
93 hrs per sheet
1. England 118 maps - 10,974 hrs
2. Wales 17 maps - 1,581 hrs
3. Scotland 37 maps - 3,441 hrs
Estimated times for map vectorisation using manual digitising
Further potential researchFurther potential research
Manual digitising of larger area to compare areas at each stage of the classification and editing stages
Development of a model to automatically remove and replace black detail
Improve consistency of classification
Examine the transferability of the signature file to other areas

Graphical model constructed to remove black detail