Generalized concentration addition accurately predicts ...
10
Contents lists available at ScienceDirect Toxicology in Vitro journal homepage: www.elsevier.com/locate/toxinvit Generalized concentration addition accurately predicts estrogenic potentials of mixtures and environmental samples containing partial agonists Markus Brinkmann a,b,⁎ , Markus Hecker a , John P. Giesy c,d,e , Paul D. Jones a , Hans Toni Ratte b , Henner Hollert b,f,g,h,i , Thomas G. Preuss b,1 a School of Environment & Sustainability and Toxicology Centre, University of Saskatchewan, 44 Campus Drive, Saskatoon, SK, S7N 5B3, Canada b Institute for Environmental Research, RWTH Aachen University, Worringerweg 1, 52074 Aachen, Germany c Department of Veterinary Biomedical Sciences and Toxicology Centre, University of Saskatchewan, 44 Campus Drive, SK S7N 5B3 Saskatoon, Canada d Department of Zoology and Center for Integrative Toxicology, Michigan State University, East Lansing, MI, USA e School of Biological Sciences, University of Hong Kong, Kowloon, Hong Kong, SAR, China f College of Resources and Environmental Science, Chongqing University, 1 Tiansheng Road Beibei, Chongqing 400715, China g College of Environmental Science and Engineering, Tongji University, 1239 Siping Road, Shanghai, China h State Key Laboratory of Pollution Control and Resource Reuse, Tongji University, 1239 Siping Road, Shanghai, China i State Key Laboratory of Pollution Control and Resource Reuse, School of the Environment, Nanjing University, China ARTICLE INFO Keywords: EEF EEQ Estrogen receptor Independent action Concentration addition Competitive antagonism ABSTRACT Cell-based bioanalytical tools are considered one alternative to overcome limitations of sensitivities of instru- mental, analytical chemistry for monitoring estrogenic chemicals in the environment. Because these tools also reflect non-additive interactions of chemicals in mixtures, their outcomes often deviate from outcomes of che- mical analytical approaches that assume additivity, e.g. the concentration addition (CA) model. Often this is because CA is unable to adequately represent effects of partial agonists, i.e. estrogens with lesser efficacies compared to 17β-estradiol. A generalized concentration addition (GCA) model has been proposed to address this shortcoming. In the present study, we investigated effects of mixtures of isomers of nonylphenol as partial model agonists in a cell-based estrogenicity assay. Whether the GCA model was able to more accurately predict the outcomes of these and previously published mixture experiments was evaluated, as well as the potency of a set of comprehensively characterized sewage effluent samples, compared to CA. If samples contained partial agonists, the GCA model consistently predicted potencies of mixtures and extracts of environmental samples more ac- curately than did the CA model. These findings enable more accurate estimations of potencies of estrogenicity explained by concentrations of agonists and partial agonists, thus significantly improving the ability to identify causative chemicals. 1. Introduction An ever-increasing number of chemicals are released into aquatic environments through various sources. Some of these chemicals are monitored on a routine basis for their well-understood effects on aquatic organisms, and potentially even on humans. Some compounds, however, have only recently been detected due to development of more sensitive and unbiased non-target analytical screening methods (Petrović et al., 2003). These chemicals of emerging concern (CECs) can interfere with a plethora of biological functions in aquatic organisms and ultimately even humans (Bolong et al., 2009; Snyder et al., 2003; Triebskorn et al., 2013). Some CECs, referred to as endocrine-disrupting chemicals (EDCs), can potentially disrupt neuro-endocrine functions in exposed organisms. One particularly well-studied class of EDCs are natural and synthetic estrogens, which can bind to the estrogen re- ceptor (ER) and have been shown to interfere with the hypothalamus- pituitary-gonad(−liver) (HPG[L]) axis of aquatic vertebrates, particu- larly fish. Fish are sensitive to these compounds: Effects on http://dx.doi.org/10.1016/j.tiv.2017.10.022 Received 8 June 2017; Received in revised form 16 October 2017; Accepted 20 October 2017 ⁎ Corresponding author at: School of Environment & Sustainability and Toxicology Centre, University of Saskatchewan, 44 Campus Drive, Saskatoon, SK, S7N 5B3, Canada. 1 Present address: Bayer CropScience, Monheim, Germany. E-mail address: [email protected] (M. Brinkmann). Abbreviations: AhR, Aryl hydrocarbon receptor; CA, Concentration addition; CEC, Chemical of emerging concern; E2, 17β-Estradiol; EC 50 , Half-maximal effect concentration; EDC, Endocrine-disrupting chemicals; E1, Estrone; EE2, 17α-Ethinylestradiol; EEF, 17β-Estradiol equivalence factor; EEQ, 17β-Estradiol equivalent concentrations; EQS, Environmental quality standard; ER, Estrogen receptor; ERE, Estrogen response element; FBS, Fetal bovine serum; GCA, Generalized concentration addition; IA, Independent action; NP, Nonylphenol; TEQ, 2,3,7,8-Tetrachlorodibenzo-p-dioxin (TCDD) equivalent concentration Toxicology in Vitro 46 (2018) 294–303 Available online 21 October 2017 0887-2333/ © 2017 Elsevier Ltd. All rights reserved. T
Transcript of Generalized concentration addition accurately predicts ...
Contents lists available at ScienceDirect
Toxicology in Vitro
journal homepage: www.elsevier.com/locate/toxinvit
Generalized concentration addition accurately predicts estrogenic potentialsof mixtures and environmental samples containing partial agonists
Markus Brinkmanna,b,⁎, Markus Heckera, John P. Giesyc,d,e, Paul D. Jonesa, Hans Toni Ratteb,Henner Hollertb,f,g,h,i, Thomas G. Preussb,1
a School of Environment & Sustainability and Toxicology Centre, University of Saskatchewan, 44 Campus Drive, Saskatoon, SK, S7N 5B3, Canadab Institute for Environmental Research, RWTH Aachen University, Worringerweg 1, 52074 Aachen, Germanyc Department of Veterinary Biomedical Sciences and Toxicology Centre, University of Saskatchewan, 44 Campus Drive, SK S7N 5B3 Saskatoon, Canadad Department of Zoology and Center for Integrative Toxicology, Michigan State University, East Lansing, MI, USAe School of Biological Sciences, University of Hong Kong, Kowloon, Hong Kong, SAR, Chinaf College of Resources and Environmental Science, Chongqing University, 1 Tiansheng Road Beibei, Chongqing 400715, Chinag College of Environmental Science and Engineering, Tongji University, 1239 Siping Road, Shanghai, Chinah State Key Laboratory of Pollution Control and Resource Reuse, Tongji University, 1239 Siping Road, Shanghai, Chinai State Key Laboratory of Pollution Control and Resource Reuse, School of the Environment, Nanjing University, China
A R T I C L E I N F O
Keywords:EEFEEQEstrogen receptorIndependent actionConcentration additionCompetitive antagonism
A B S T R A C T
Cell-based bioanalytical tools are considered one alternative to overcome limitations of sensitivities of instru-mental, analytical chemistry for monitoring estrogenic chemicals in the environment. Because these tools alsoreflect non-additive interactions of chemicals in mixtures, their outcomes often deviate from outcomes of che-mical analytical approaches that assume additivity, e.g. the concentration addition (CA) model. Often this isbecause CA is unable to adequately represent effects of partial agonists, i.e. estrogens with lesser efficaciescompared to 17β-estradiol. A generalized concentration addition (GCA) model has been proposed to address thisshortcoming. In the present study, we investigated effects of mixtures of isomers of nonylphenol as partial modelagonists in a cell-based estrogenicity assay. Whether the GCA model was able to more accurately predict theoutcomes of these and previously published mixture experiments was evaluated, as well as the potency of a set ofcomprehensively characterized sewage effluent samples, compared to CA. If samples contained partial agonists,the GCA model consistently predicted potencies of mixtures and extracts of environmental samples more ac-curately than did the CA model. These findings enable more accurate estimations of potencies of estrogenicityexplained by concentrations of agonists and partial agonists, thus significantly improving the ability to identifycausative chemicals.
1. Introduction
An ever-increasing number of chemicals are released into aquaticenvironments through various sources. Some of these chemicals aremonitored on a routine basis for their well-understood effects onaquatic organisms, and potentially even on humans. Some compounds,however, have only recently been detected due to development of moresensitive and unbiased non-target analytical screening methods(Petrović et al., 2003). These chemicals of emerging concern (CECs) can
interfere with a plethora of biological functions in aquatic organismsand ultimately even humans (Bolong et al., 2009; Snyder et al., 2003;Triebskorn et al., 2013). Some CECs, referred to as endocrine-disruptingchemicals (EDCs), can potentially disrupt neuro-endocrine functions inexposed organisms. One particularly well-studied class of EDCs arenatural and synthetic estrogens, which can bind to the estrogen re-ceptor (ER) and have been shown to interfere with the hypothalamus-pituitary-gonad(− liver) (HPG[L]) axis of aquatic vertebrates, particu-larly fish. Fish are sensitive to these compounds: Effects on
http://dx.doi.org/10.1016/j.tiv.2017.10.022Received 8 June 2017; Received in revised form 16 October 2017; Accepted 20 October 2017
⁎ Corresponding author at: School of Environment & Sustainability and Toxicology Centre, University of Saskatchewan, 44 Campus Drive, Saskatoon, SK, S7N 5B3, Canada.
1 Present address: Bayer CropScience, Monheim, Germany.E-mail address: [email protected] (M. Brinkmann).
Abbreviations: AhR, Aryl hydrocarbon receptor; CA, Concentration addition; CEC, Chemical of emerging concern; E2, 17β-Estradiol; EC50, Half-maximal effect concentration; EDC,Endocrine-disrupting chemicals; E1, Estrone; EE2, 17α-Ethinylestradiol; EEF, 17β-Estradiol equivalence factor; EEQ, 17β-Estradiol equivalent concentrations; EQS, Environmental qualitystandard; ER, Estrogen receptor; ERE, Estrogen response element; FBS, Fetal bovine serum; GCA, Generalized concentration addition; IA, Independent action; NP, Nonylphenol; TEQ,2,3,7,8-Tetrachlorodibenzo-p-dioxin (TCDD) equivalent concentration
Toxicology in Vitro 46 (2018) 294–303
Available online 21 October 20170887-2333/ © 2017 Elsevier Ltd. All rights reserved.
T

reproduction occur at concentrations in the low ng L−1 range (Ankleyet al., 2001; Hecker et al., 2002; Jobling et al., 1996; Leino et al., 2005;Pawlowski et al., 2004). Previously unexposed populations of wildfishes in the Experimental Lakes Area of Ontario, Canada, collapsedafter exposure to environmentally relevant concentrations (5 ng L−1) ofthe synthetic estrogen 17α-ethinylestradiol (EE2) (Kidd et al., 2007;Kidd et al., 2014). Although analytical equipment capable of detectingEDCs at such small concentrations is becoming more and more avail-able, many xenoestrogens cannot be routinely monitored with the in-struments commonly available to monitoring authorities (Wernerssonet al., 2015).
To overcome limitations of instrumental analytical chemistry, cell-based bioanalytical tools have been developed as cost-effective andsensitive alternatives (Brack et al., 2017; Di Paolo et al., 2016; Kunzet al., 2017; Wernersson et al., 2015). These assays make use of specificand quantitative responses of wild-type or recombinant reporter genecell lines to exposure with specific classes of chemicals (Behnisch et al.,2002; Coors et al., 2004; Eichbaum et al., 2014). One advantage of suchbioanalytical tools is that they integrate effects of all chemicals in amixture, which exert their activity through the same mechanism ofaction (e.g. binding to the ER), and not only those for which instru-mental methods exist to allow their quantifications (Otte et al., 2013).Potencies of mixtures or extracts of environmental samples are thenexpressed relative to the response to a standard. For example, whencharacterizing exposures to estrogenic chemicals responses of bioassayswould be normalized to the potent, endogenous estrogen 17β-estradiol(E2), and expressed as E2 equivalent concentrations (EEQs) per unitvolume or weight (e.g., ng L−1 or ng kg−1). Potencies of natural andsynthetic estrogens are commonly expressed as E2 equivalency factors(EEFs), i.e. the ratio of half-maximal effect concentrations (EC50s) of theE2 standard and the chemical (Körner et al., 1999) or the point of de-parture of the concentration-response relationship, represented by theEC20. In mass-balance analyses of complex environmental mixtures,these EEFs are often used to calculate EEQs by means of a special formof the concentration addition (CA) model (Hadrup et al., 2013; Pojanaet al., 2007; Eq. (1)). This so-called EEF approach, however, is based ona central assumption: That all estrogenic compounds in the mixturediffer only in their potencies; or said another way, that their efficacies(i.e. the maximum achievable effect level) and slopes of the con-centration-response curves are equal. While these assumptions workreasonably well for mixtures that are dominated by full agonists, e.g.steroidal estrogens, they result in significant over-estimation of thepotency of mixtures that contain partial agonists (i.e. compounds withefficacies significantly less than that of E2), e.g. different nonylphenol(NP) isomers (Howard and Webster, 2009; Preuss et al., 2010).
∑==
EEQ c EEFi
n
i i1 (1)
where: EEQ is the E2 equivalent concentration of a mixture of n in-dividual chemicals with known E2 equivalency factors (EEFi) at con-centrations ci.
As a potential solution to this problem, an extended and generalizedconcentration addition (GCA) model has been proposed for a differentgroup of contaminants (Howard and Webster, 2009). This model ac-counts for differences in efficacy and has been effectively applied topredict mixture effects of partial and full agonists of the aryl hydro-carbon receptor (AhR) (Howard et al., 2010), and of chemicals affectingsteroid synthesis in the H295R assay (Hadrup et al., 2013). An eva-luation of the potential use of GCA to describe potencies of mixtures ofpartial and full agonists of the ER, and to predict the potency of extractsof environmental samples containing partial agonists, however, has notbeen reported to date. To address this limitation, this study generated adataset for effects of two tertiary and one quaternary mixture of isomersof nonyl-phenol (NP) in a cell-based estrogenicity assay. Furthermore,we evaluated whether GCA was able to more accurately predict theoutcomes of these and other previously published mixture experiments(Preuss et al., 2010), as well as the potency of a set of comprehensivelycharacterized sewage effluent samples that was available from the lit-erature (Körner et al., 2001; Spengler et al., 2001), compared to CA.
2. Materials and methods
2.1. Chemicals
Linear 4n–NP (99% purity) was commercially available fromAvocado, Germany. The six isomers 4-(3′,5′-dimethyl-3’heptyl)phenol(p353-NP), 4-(3′,6′-dimethyl-3’heptyl)phenol (p363-NP), 4-(2′,5′-di-methyl-2’heptyl)phenol (p252-NP), 4-(2′,6′-dimethyl-2’heptyl)phenol(p262-NP), 4-(3′-methyl-3’octyl)phenol (p33-NP), and 4-(2′-methyl-2’octyl)phenol (p22-NP) were synthesized as described previously (Rußet al., 2005; Vinken et al., 2002; Fig. 1). After synthesis, isomers werepurified by means of silica gel column chromatography with hex-ane:ethylacetate (1:13, v/v) as the elution solvent. Purities of the iso-mers were determined using gas chromatography–mass spectrometry(GC/MS) and in all cases exceeded 99.9%. Stock solutions were pre-pared in ethanol and stored at −20 °C. As determined by GC/MS,isomers were stable at least for 2 years under these storage conditions.
2.2. MVLN assay
The MVLN assay uses MCF-7 human breast carcinoma cells that
Fig. 1. p-NP isomers investigated in the present study (cf. Preuss et al., 2006).
M. Brinkmann et al. Toxicology in Vitro 46 (2018) 294–303
295

have been stably transfected with a luciferase reporter gene. Expressionof luciferase, which can be quantified through emission of light in thepresence of the substrate luciferin, is proportional to binding of ligandsto the ER. Detailed protocols for culture of MVLN cells and test pro-cedures have been published elsewhere (Preuss et al., 2006; Snyderet al., 2001). Briefly, MVLN cells were cultured in Dulbecco's ModifiedEagle Medium with Hams F-12 nutrient mixture (Sigma-Aldrich, Ger-many), containing 1 mM sodium pyruvate (Sigma-Aldrich), 1 mg L−1
insulin (Sigma-Aldrich) and 10% (v/v) dextran-charcoal stripped fetalbovine serum (FBS, Hyclone, Logan, UT). Cells were incubated at 37 °Cin an atmosphere enriched with 5% CO2 (v/v). For exposure experi-ments, 250 μL of a suspension of MVLN cells (7.5 104 cells mL−1) wereseeded into individual wells of a standard 96-well microplate.
Concentration-response curves for the six NP isomers and results ofco-exposures of graded concentrations of NP isomers with 100 and1000 pM E2, respectively, have been reported previously (Preuss et al.,2006; Preuss et al., 2010). Additional experiments were conducted inwhich graded concentrations of mixture (p353/p363/p262-NPs, p353/p33/p252-NPs and p353/p363/p33/p262-NPs, respectively) weretested at fixed equal concentration ratios of each chemical. An E2standard (4.1 to 1000 pM) and a protein standard curve (bovine serumalbumin, Sigma-Aldrich) were included during each test. The con-centration of ethanol did not exceed 1% (v/v) in any case. Luciferaseactivity was measured following 72 h incubation under standard cul-ture conditions in a plate luminescence reader (Spectrafluor Plus,Tecan, Männedorf, Switzerland) after addition of LucLite cocktail(Packard Instruments, Meriden, USA). To account for cytotoxicity, afluorescamine-based assay was used to measure the protein content ineach well.
2.3. Data analysis and re-analysis of concentration-response data
Mean luminescence values of test chemicals and E2 standards werecorrected for the response of the solvent controls. Resulting values werethen divided by the maximum induction of the E2 standard (E2 max) toscale all values from 0 (solvent control) to 100% (E2 max). Averagescaled values from triplicate experiments were plotted using the soft-ware GraphPad Prism 7.01 (GraphPad, San Diego, USA) and fitted usingthe Hill function with slope parameter 1 (Eq. (2)).
=∙
+E c α c
c K( )i i i
i i (2)
where: E(ci) is the effect of a single chemical i at concentration c, αi theefficacy (% E2 max), and Ki the concentration of i causing half-maximaleffect.
Two approaches for determination of efficacy (αi), which corre-spond to the maximum achievable effect of a single chemical i, wereused to accommodate the requirements of the different modeling stra-tegies. The concentration addition model, used in the EEF approach,requires that all curves are scaled from 0 (solvent control) to 1 (E2 max,100%), while application of the GCA and IA models permitted use ofsubstance-specific efficacies. For NP isomers investigated in the presentstudy, these were not always defined by a clear upper asymptote, andwere thus set to the mean value of measurements from the greatestconcentration of the respective chemical.
2.4. Modeling of mixture effects
Effects of mixtures of NP isomers and co-exposures with E2 at 100pM (appox. EC50) or 1000 pM (approx. 100% effect), respectively, inthe MVLN assay were predicted using three models: independent action(IA), concentration addition (CA) and generalized concentration addi-tion (GCA).
Effects of mixtures of chemicals with various mechanisms of actioncan be described using the independent action (IA) model (Bliss, 1939;Eq. (3)). Since all investigated chemicals activate the ER, and thus,
share the same mechanism of action, this model is included in thepresent study only for comparison.
∏= − −=
E E c1 (1 ( ))mixi
n
i1 (3)
where: Emix (0…1) is the relative effect of a mixture of n chemicals, andE(ci) (0…1) the effect of any single chemical i present in the mixture atconcentration c.
The concentration addition (CA) model was first described byLoewe and Muischnek (1926) and can be used to describe the effects ofmixtures of chemicals with the same mechanism of action. AssumingCA, each chemical can be expressed as the dilution of any other che-mical in the mixture. It can be rearranged to result in the model de-scribed in Eq. (4) (Nweke et al., 2015.
= −+ ∑ =
E 100 1001mix
in c
K1ii (4)
where: Emix (%) is the relative effect of a mixture of n chemicals atconcentration c, and Ki the concentration of chemical i causing half-maximal effect.
A generalized version of the concentration addition model (GCA)has been developed; its main advantage over the CA model is its abilityto accurately predict effects of mixtures containing partial agonists, i.e.chemicals that have a lesser efficacy than other chemicals in the mix-ture (Howard et al., 2010; Eq. (5)). As a quantitative measure of modelperformance, the root mean squared error (RMSE) was calculated foreach of the investigated models.
=∑
+ ∑
=
=
E1mix
in α c
K
in c
K
1
1
i ii
ii (5)
where: Emix (%) is the effect of a mixture of n chemicals at concentrationc, αi the efficacy (% E2 max), and Ki the concentration of chemical icausing half-maximal effect.
2.5. Prediction of EEQs in environmental samples
Estradiol equivalent concentrations (EEQs) of 18 individual waste-water samples which were measured in the E-Screen assay were pre-dicted from analytically determined concentrations of 11 natural andsynthetic estrogens by means of the GCA model and the EEF approach(Spengler et al., 2001). This assay makes use of the ER-mediated pro-liferative effect of estrogens in the wild-type breast cancer cell lineMCF-7 to quantify the concentration of natural and synthetic estrogens(Soto et al., 1995). Potencies and efficacies data of these 11 compoundshave been previously published (Körner et al., 2001; Table 2). Con-centrations less than the limit of detection were assumed to be negli-gible and set to zero (Table 3).
In the EEF approach (Eq. (1)) EEQs of wastewaters were calculatedby use of the EEFs reported in the original publication (Körner et al.,2001; Eq. (1)). Furthermore, EEQs were calculated using the GCAmodel through a workflow (Fig. 2). Briefly, Emix of the different was-tewater samples was calculated using concentrations of individual pu-tative ER agonists (Eq. (4)). This concentration, if tested in the E-Screenassay, could be referred to as a hypothetic concentration factor of 1 (L/L, i.e. the equivalent of 1 L of extracted sample per 1 L of cell culturemedia). Measured concentrations of the 11 chemicals were then mul-tiplied by concentration factors spanning a range similar to a dilutionseries in the bioassay, and Emix calculated to generate full concentra-tion-response curves. These curves were fitted using Eq. (2) to de-termine EC50s (LL−1). The EC50 of the E2 standard (ng L−1) was di-vided by the EC50 of the curve, resulting in an EEQ in ng L−1. EEQspredicted using both approaches were compared to EEQs experimen-tally determined in the E-Screen assay (Körner et al., 2001). RMSEswere calculated as a quantitative measure of model performance.
M. Brinkmann et al. Toxicology in Vitro 46 (2018) 294–303
296

3. Results and discussion
3.1. Re-evaluation of single chemical exposure data
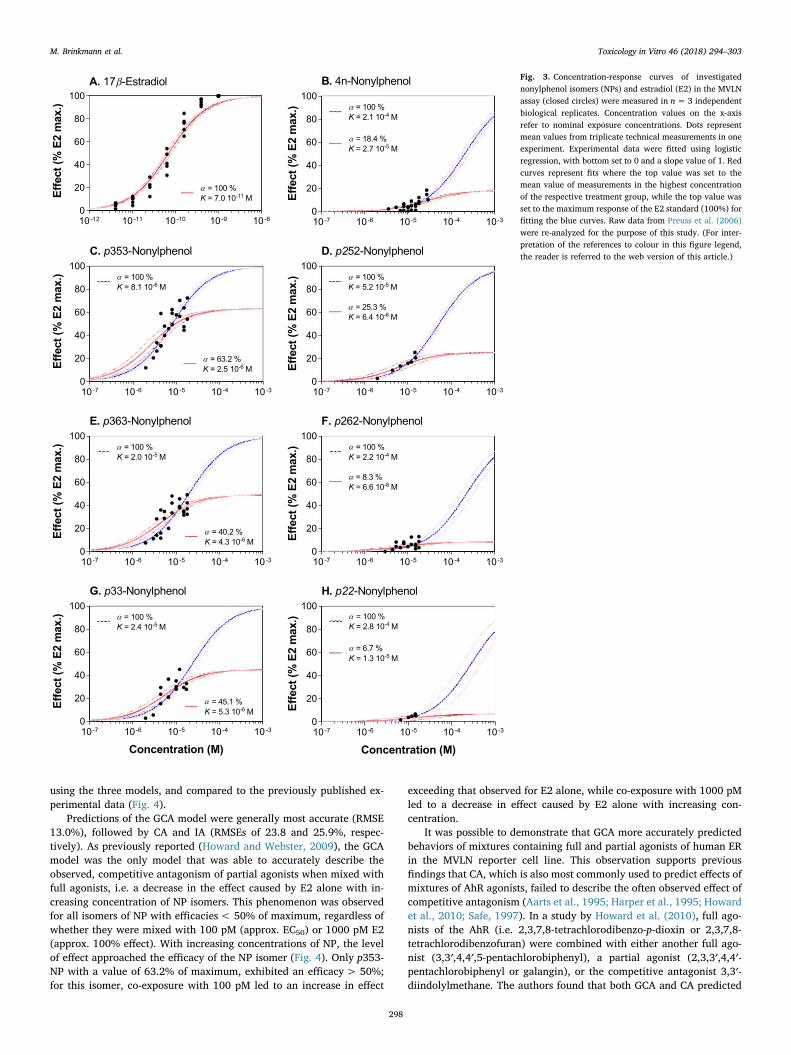
Re-evaluation of the responses of MVLN cells to exposure with E2and the NP isomers 4n–NP, p353-NP, p363-NP, p33-NP, p252-NP, p262-NP, and p22-NP that had been previously published by Preuss et al.(2006) led to differing best-fit values which accommodated demands ofthe various modeling strategies (Fig. 3). It should be noted that three ofthe investigated NP isomers (4n–NP, p262-NP, and p22-NP) did notcause measurable induction of ≥20% E2 max, which is often re-commended as a stipulated threshold for meaningful effects in mass-balance analyses (Villeneuve et al., 2000). For this reason, no EC or EEFvalues were presented in the original publication (Preuss et al., 2006).In the present study, however, these data were included in the assess-ment to achieve better comparability between the different modelingapproaches. Furthermore, responses of at least the highest tested con-centration were significantly greater compared to the solvent control
for the three chemicals (one-way ANOVA with Dunnett's post-hoc test,p ≤ 0.05).
As required for using the best-fit data to model mixture effects ac-cording to CA, curves were extrapolated to 100% E2 max regardless ofthe maximum response achieved by the chemical. The obtained EC50values were similar to the ones reported in the original publication(Fig. 3, Table 1; Preuss et al., 2006). When allowing for substance-specific efficacies while fitting the measured responses in the MVLNassay, fitted efficacies ranged from 6.70 to 63.2% E2 max (Table 1).This fitting strategy also resulted in markedly lesser estimates of po-tencies (for better differentiation termed K instead of EC50), whichdiffered by a factor of 3 (p353-NP) to 33 (p262-NP).
3.2. Mixtures of E2 with individual NP isomers and mixtures of various NPs
Using descriptors of potency and efficacy of NP isomers describedabove, effects of co-exposures of single NP isomers with fixed con-centrations of E2 (100 or 1000 pM) in the MVLN assay were predicted
Fig. 2. Proposed workflow for predicting estradiol equiva-lent concentrations (EEQs) for complex mixtures and ex-tracts of environmental samples using the generalizedconcentration addition (GCA) model.
M. Brinkmann et al. Toxicology in Vitro 46 (2018) 294–303
297
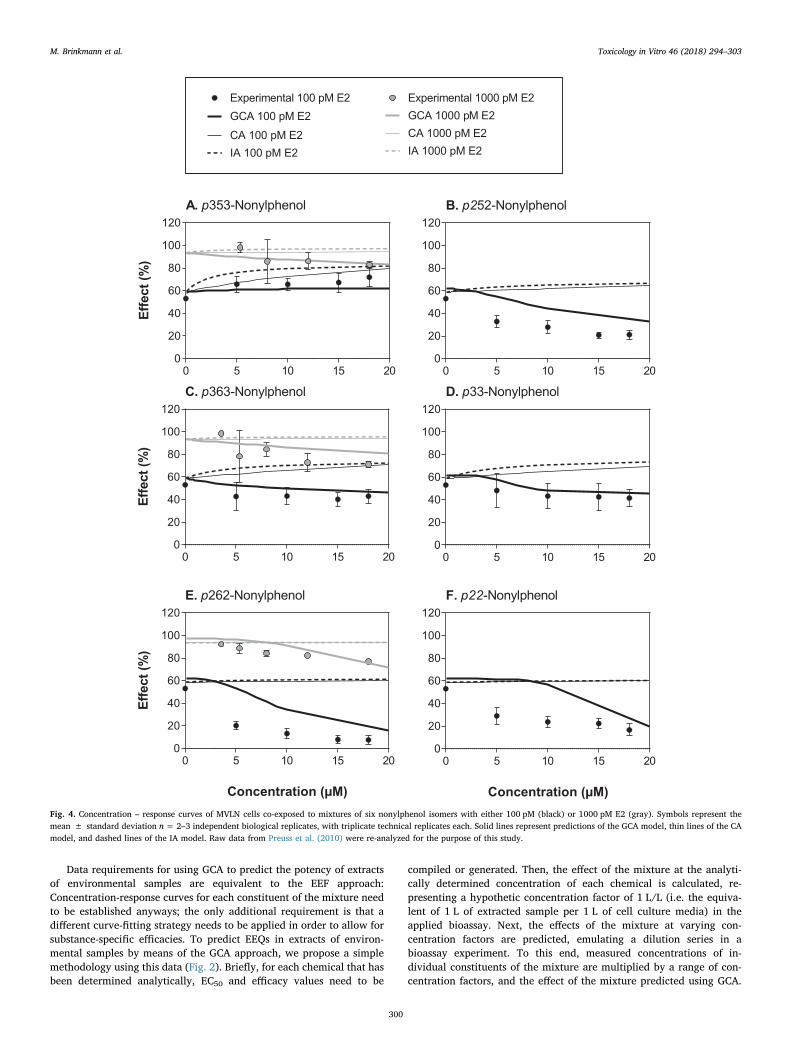
using the three models, and compared to the previously published ex-perimental data (Fig. 4).
Predictions of the GCA model were generally most accurate (RMSE13.0%), followed by CA and IA (RMSEs of 23.8 and 25.9%, respec-tively). As previously reported (Howard and Webster, 2009), the GCAmodel was the only model that was able to accurately describe theobserved, competitive antagonism of partial agonists when mixed withfull agonists, i.e. a decrease in the effect caused by E2 alone with in-creasing concentration of NP isomers. This phenomenon was observedfor all isomers of NP with efficacies< 50% of maximum, regardless ofwhether they were mixed with 100 pM (approx. EC50) or 1000 pM E2(approx. 100% effect). With increasing concentrations of NP, the levelof effect approached the efficacy of the NP isomer (Fig. 4). Only p353-NP with a value of 63.2% of maximum, exhibited an efficacy> 50%;for this isomer, co-exposure with 100 pM led to an increase in effect
exceeding that observed for E2 alone, while co-exposure with 1000 pMled to a decrease in effect caused by E2 alone with increasing con-centration.
It was possible to demonstrate that GCA more accurately predictedbehaviors of mixtures containing full and partial agonists of human ERin the MVLN reporter cell line. This observation supports previousfindings that CA, which is also most commonly used to predict effects ofmixtures of AhR agonists, failed to describe the often observed effect ofcompetitive antagonism (Aarts et al., 1995; Harper et al., 1995; Howardet al., 2010; Safe, 1997). In a study by Howard et al. (2010), full ago-nists of the AhR (i.e. 2,3,7,8-tetrachlorodibenzo-p-dioxin or 2,3,7,8-tetrachlorodibenzofuran) were combined with either another full ago-nist (3,3′,4,4′,5-pentachlorobiphenyl), a partial agonist (2,3,3′,4,4′-pentachlorobiphenyl or galangin), or the competitive antagonist 3,3′-diindolylmethane. The authors found that both GCA and CA predicted
10-12 10-11 10-10 10-9 10-8
0
20
40
60
80
100
Effect
(%
E2
max.)
A. 17 -Estradiol
= 100 %
K = 7.0 10-11
M
10-7 10-6 10-5 10-4 10-3
0
20
40
60
80
100
Effect
(%
E2
max.)
B. 4n-Nonylphenol
= 18.4 %
K = 2.7 10-5
M
= 100 %
K = 2.1 10-4
M
10-7 10-6 10-5 10-4 10-3
0
20
40
60
80
100
Effect
(%
E2
max.)
C. p353-Nonylphenol
= 63.2 %
K = 2.5 10-6
M
= 100 %
K = 8.1 10-6
M
10-7 10-6 10-5 10-4 10-3
0
20
40
60
80
100
Effect
(%
E2
max.)
D. p252-Nonylphenol
= 25.3 %
K = 6.4 10-6
M
= 100 %
K = 5.2 10-5
M
10-7 10-6 10-5 10-4 10-3
0
20
40
60
80
100
Effect
(%
E2
max.)
E. p363-Nonylphenol
= 40.2 %
K = 4.3 10-6
M
= 100 %
K = 2.0 10-5
M
10-7 10-6 10-5 10-4 10-3
0
20
40
60
80
100
Effect
(%
E2
max.)
F. p262-Nonylphenol
= 8.3 %
K = 6.6 10-6
M
= 100 %
K = 2.2 10-4
M
10-7 10-6 10-5 10-4 10-3
0
20
40
60
80
100
Concentration (M)
Effect
(%
E2
max.)
G. p33-Nonylphenol
= 45.1 %
K = 5.3 10-6
M
= 100 %
K = 2.4 10-5
M
10-7 10-6 10-5 10-4 10-3
0
20
40
60
80
100
Concentration (M)
Effect
(%
E2
max.)
H. p22-Nonylphenol
= 6.7 %
K = 1.3 10-5
M
= 100 %
K = 2.8 10-4
M
Fig. 3. Concentration-response curves of investigatednonylphenol isomers (NPs) and estradiol (E2) in the MVLNassay (closed circles) were measured in n = 3 independentbiological replicates. Concentration values on the x-axisrefer to nominal exposure concentrations. Dots representmean values from triplicate technical measurements in oneexperiment. Experimental data were fitted using logisticregression, with bottom set to 0 and a slope value of 1. Redcurves represent fits where the top value was set to themean value of measurements in the highest concentrationof the respective treatment group, while the top value wasset to the maximum response of the E2 standard (100%) forfitting the blue curves. Raw data from Preuss et al. (2006)were re-analyzed for the purpose of this study. (For inter-pretation of the references to colour in this figure legend,the reader is referred to the web version of this article.)
M. Brinkmann et al. Toxicology in Vitro 46 (2018) 294–303
298
the effects of a mixture of full agonists equally well, while in all othercases the GCA model outperformed CA. The difference between the twomodeling approaches was directly dependent on the efficacy of the
partial agonist. A similar trend was observed in the present study,where RMSEs for the predicted mixture effects of co-exposures with E2(Fig. 4) increased more drastically with decreasing efficacy for the CAmodel compared to the GCA model (data not shown).
Another aspect that had been observed previously is that GCA wasalso capable of predicting effects of pure antagonists: the effect of theAhR antagonist 3,3′-diindolylmethane, a compound that binds the re-ceptor without activating it, was accurately predicted by GCA (Howardet al., 2010). In this context, GCA might also have the potential to helpunderstanding the effects of pure antagonists of the ER which are usedas human pharmaceuticals (e.g. diethylstilbestrol, fulvestrant, and ta-moxifen) and their interaction with endogenous estrogens (Riggs andHartmann, 2003). GCA could thus also be useful in pharmacologicalresearch, for targeting drugs and predicting effects of potential co-medication.
When toxicity of ternary and quaternary mixtures of various NPisomers was assessed with the three models, CA and IA again sig-nificantly overestimated effects of mixtures, with RMSEs of 45.8 and51.0%, respectively (Fig. 5). Predictions of the GCA model were mostaccurate, with a RMSE of only 15.7%. As in all tested serial dilutionlevels mixture ratios were constant, this experiment can be consideredto reflect the situation of testing complex mixtures, e.g. extracts ofenvironmental samples. The results of these experiments suggest thatsimilarly greater predictive power of the GCA approach could also beexpected for extracts of environmental samples.
3.3. Prediction of EEQs in environmental samples
It has long been recognized that the testing of extracts of environ-mental samples using bioanalytical in vitro assays and the use of thatdata in potency-balance analyses, results in a dilemma: the CA model,or more specifically the EEF/TEF approach, requires that the curvesused in the analysis show equal efficacy and parallelism of slopes. Theserequirements are unrealistic for most mixtures and are rarely met bydata for individual agonists of the ER or AhR and in fact withoutknowledge of the concentrations of agonists in extracts of environ-mental samples cannot be verified (Giesy and Kannan, 1998). Thus, ithas been proposed and widely accepted that relative potency estimatesfor single chemicals and extracts of environmental samples shouldbetter be expressed as multiple point estimates (e.g. EC20 – EC80 ranges)(Villeneuve et al., 2000) or even probability functions (Putzrath, 1997).
Table 1Fitted estrogenic potencies K of the compounds investigated in the present study whenapplying different fitting strategies, e.g. efficacies α set to 100% E2 max (as needed for theEEF approach) and allowing for substance-specific efficacies α, respectively. All slopeswere set to 1 and all lower asymptotes to 0%. Interpolated potency values K representmean ± SEM determined from n = 3 independent biological replicates, with triplicatetechnical determinations per replicate.
Chemical Efficacy α set to 100% E2 max Efficacy α substance-specific
K (M) R2 K (M) α (%E2max)
R2
E2 7.0 ± 0.6 10−11 0.96 7.0 ± 0.6 10−11 100 0.964n–NP 2.1 ± 0.2 10−4 0.52 2.7 ± 0.5 10−5 18.4 0.52p353-NP 8.1 ± 0.8 10−6 0.60 2.5 ± 0.5 10−6 63.2 0.56p363-NP 2.0 ± 0.2 10−5 0.36 4.3 ± 0.7 10−6 40.2 0.55p33-NP 2.4 ± 0.3 10−5 0.40 5.3 ± 1.0 10−6 45.1 0.57p252-NP 5.2 ± 0.5 10−5 0.88 6.4 ± 1.9 10−6 25.3 0.71p262-NP 2.2 ± 0.4 10−4 0.17 6.6 ± 3.0 10−6 8.30 0.23p22-NP 2.8 ± 0.8 10−4 0.55 1.3 ± 0.9 10−5 6.70 0.41
Table 2Estrogenic potencies K (M), efficacies α (% E2 max), and estradiol equivalence factors(EEFs) for a range of natural and synthetic estrogens in the E-Screen assay. Table modifiedfrom Körner et al. (2001). The authors of the original publication did not report estimatesof biological variability.
Chemical K (M) α (% E2 max) EEF (−)
Estrone 6.7 10−11 112 9.6 10−2
17β–Estradiol 6.1 10−12 100 1.0 100
17α–Ethinylestradiol 5.2 10−12 105 9.1 10−1
Mestranol 2.0 10−10 100 1.3 10−2
Genistein 1.8 10−8 123 2.8 10−4
α-Endosulfane 2.0 10−7 70.0 4.8 10−6
Di-n-butylphthalate 2.5 10−5 63.0 3.4 10−7
Benzyl-n-butylphthalate 3.1 10−6 80.0 2.4 10−6
Bisphenol A 1.5 10−7 97.0 5.3 10−5
4-Nonylphenol (techn.) 9.9 10−8 105 7.6 10−5
4-nonylphenoxyacetic acid 7.3 10−7 54.0 1.4 10−5
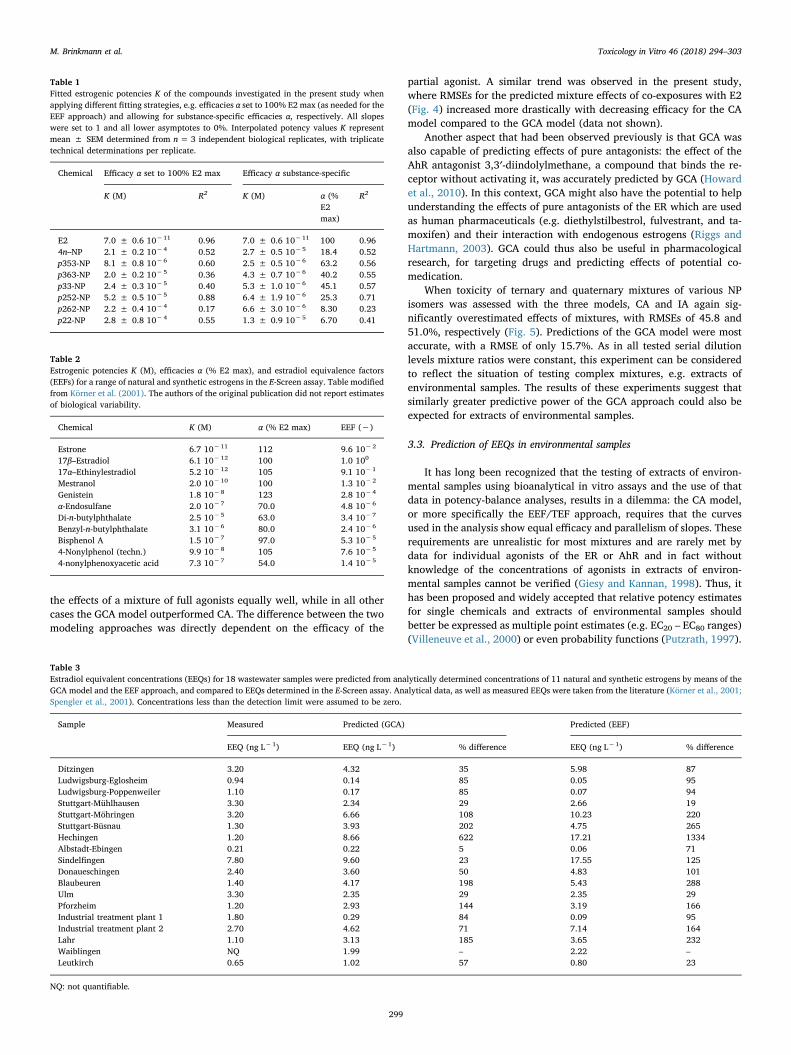
Table 3Estradiol equivalent concentrations (EEQs) for 18 wastewater samples were predicted from analytically determined concentrations of 11 natural and synthetic estrogens by means of theGCA model and the EEF approach, and compared to EEQs determined in the E-Screen assay. Analytical data, as well as measured EEQs were taken from the literature (Körner et al., 2001;Spengler et al., 2001). Concentrations less than the detection limit were assumed to be zero.
Sample Measured Predicted (GCA) Predicted (EEF)
EEQ (ng L−1) EEQ (ng L−1) % difference EEQ (ng L−1) % difference
Ditzingen 3.20 4.32 35 5.98 87Ludwigsburg-Eglosheim 0.94 0.14 85 0.05 95Ludwigsburg-Poppenweiler 1.10 0.17 85 0.07 94Stuttgart-Mühlhausen 3.30 2.34 29 2.66 19Stuttgart-Möhringen 3.20 6.66 108 10.23 220Stuttgart-Büsnau 1.30 3.93 202 4.75 265Hechingen 1.20 8.66 622 17.21 1334Albstadt-Ebingen 0.21 0.22 5 0.06 71Sindelfingen 7.80 9.60 23 17.55 125Donaueschingen 2.40 3.60 50 4.83 101Blaubeuren 1.40 4.17 198 5.43 288Ulm 3.30 2.35 29 2.35 29Pforzheim 1.20 2.93 144 3.19 166Industrial treatment plant 1 1.80 0.29 84 0.09 95Industrial treatment plant 2 2.70 4.62 71 7.14 164Lahr 1.10 3.13 185 3.65 232Waiblingen NQ 1.99 – 2.22 –Leutkirch 0.65 1.02 57 0.80 23
NQ: not quantifiable.
M. Brinkmann et al. Toxicology in Vitro 46 (2018) 294–303
299
Data requirements for using GCA to predict the potency of extractsof environmental samples are equivalent to the EEF approach:Concentration-response curves for each constituent of the mixture needto be established anyways; the only additional requirement is that adifferent curve-fitting strategy needs to be applied in order to allow forsubstance-specific efficacies. To predict EEQs in extracts of environ-mental samples by means of the GCA approach, we propose a simplemethodology using this data (Fig. 2). Briefly, for each chemical that hasbeen determined analytically, EC50 and efficacy values need to be
compiled or generated. Then, the effect of the mixture at the analyti-cally determined concentration of each chemical is calculated, re-presenting a hypothetic concentration factor of 1 L/L (i.e. the equiva-lent of 1 L of extracted sample per 1 L of cell culture media) in theapplied bioassay. Next, the effects of the mixture at varying con-centration factors are predicted, emulating a dilution series in abioassay experiment. To this end, measured concentrations of in-dividual constituents of the mixture are multiplied by a range of con-centration factors, and the effect of the mixture predicted using GCA.
Fig. 4. Concentration – response curves of MVLN cells co-exposed to mixtures of six nonylphenol isomers with either 100 pM (black) or 1000 pM E2 (gray). Symbols represent themean ± standard deviation n= 2–3 independent biological replicates, with triplicate technical replicates each. Solid lines represent predictions of the GCA model, thin lines of the CAmodel, and dashed lines of the IA model. Raw data from Preuss et al. (2010) were re-analyzed for the purpose of this study.
M. Brinkmann et al. Toxicology in Vitro 46 (2018) 294–303
300

From these effect values, a concentration-response curve of the mixturecan be established, and the EC50 determined. Predicted EEQ of samplescan then be calculated by dividing the measured EC50 of the E2 stan-dard by the predicted EC50 of the curve. These predicted EEQs can thenbe compared with experimentally determined EEQs for the samesample, and mass-balance analyses conducted to determine the fractionof measured effect explained by the analytically quantified chemicals.
To test the accuracy of this approach, a previously published datasetof concentrations of various steroidal and non-steroidal xenoestrogensin sewage treatment effluents was analyzed. Effects of extracts of thesesamples were determined in the E-Screen assay (Körner et al., 2001;Spengler et al., 2001). When EEQs of these samples were predictedusing the GCA approach for environmental samples (Fig. 2), the CAmodel/EEF approach significantly overestimated potencies of samples,when compared to EEQs estimated by use of bio-analytical techniques(RMSE of 5.3 ng L−1), while predictions of GCA were twice as accurate,with a RMSE of 2.5 ng L−1 (Fig. 6). In conclusion, the GCA modelprovides a powerful alternative to the established EEF approach, whilerequiring the same amount of experimental data for parameterization.While the EEF approach can still be considered an appropriate first-tiermodel, the resulting lower proportion of unknown effect potential whenusing the GCA model will significantly streamline the process of iden-tifying previously undescribed xenoestrogens. As this study addressed alimited chemical space and only one sample matrix, i.e. wastewater,future dedicated research will need to show whether this approach willalso be useful for analysis of data from other bioassays which focus onother nuclear receptors, e.g. the AhR, or completely different modes ofaction (e.g. mutagenicity, genotoxicity, oxidative stress response), anddifferent sample matrices, e.g. sediments, blood plasma, or tissue ex-tracts. Furthermore, it will need to be shown if the model could also beapplied to concentration-response relationships other than the four-parameter Hill curve.
4. Conclusions
In this study, we could show that the GCA model was able to con-sistently make more accurate predictions of the potency of mixtures and
extracts of environmental samples determined using in vitro assayscompared to the classical EEF approach if the samples contained partialagonists. These findings are of great relevance to mass balance analyses,and thus highly relevant to risk assessments. Being able to more accu-rately estimate the fraction of estrogenicity that remains unexplained
Fig. 5. Concentration – response curves of MVLN cellsexposed to mixtures of three to four nonylphenol isomersat fixed concentration ratios. Symbols represent the meanvalues from n= 3 independent biological replicates, withtriplicate technical replicates each. Solid lines representpredictions of the GCA model, thin lines of the CA model,and dashed lines of the IA model.
0 5 10 15 20
0
5
10
15
20
Measured EEQ (ng L-1
)
Pred
icted
EE
Q(n
gL
-1)
GCA, RMSE 2.5 ng L-1
EEF, RMSE 5.3 ng L-1
1:1 line
Fig. 6. Comparison of estradiol equivalent concentrations (EEQs) of wastewater samplesin the E-Screen assay, with EEQs predicted using generalized concentration addition(GCA, Fig. 2) and the estradiol equivalence factor (EEF) approach from analytically de-termined concentrations of 11 natural and synthetic estrogens. Each symbol correspondsto one individual wastewater sample. The root mean squared error (RMSE) of the pre-diction is provided in the legend.
M. Brinkmann et al. Toxicology in Vitro 46 (2018) 294–303
301
by chemical analyses is vital to trigger dedicated efforts to identify thecausative chemicals. Nuclear receptors other than the ER and AhR in-creasingly gain importance when dealing with the effects of CECs.Using GCA and thereby accounting not only for agonists of these re-ceptors, but also a plethora of partial agonists and antagonists in theenvironment, will lead to a better understanding of the mixture effectsof a vast number of other environmental contaminants of concern.
Transparency document
The http://dx.doi.org/10.1016/j.tiv.2017.10.022 associated withthis article can be found, in online version.
Acknowledgements
This study has been conducted in context of the SOLUTIONS projectsupported by the European Union Seventh Framework Programme(FP7-ENV-2013-two-stage Collaborative project) under grant agree-ment No. 603437. M.B. is currently a Banting Postdoctoral Fellow of theNatural Sciences and Engineering Research Council of Canada (NSERC).Prof. Giesy was supported by the Canada Research Chair Program, the2012 “High Level Foreign Experts” (#GDT20143200016) program,funded by the State Administration of Foreign Experts Affairs, the P.R.China to Nanjing University and the Einstein Professor Program of theChinese Academy of Sciences and a Distinguished Visiting Professorshipin the School of Biological Sciences of the University of Hong Kong.
References
Aarts, J.M., Denison, M.S., Cox, M.A., Schalk, M.A., Garrison, P.M., Tullis, K., de Haan,L.H., Brouwer, A., 1995. Species-specific antagonism of ah receptor action by 2, 2′, 5,5′-tetrachloro-and 2, 2′, 3, 3′, 4, 4′-hexachlorobiphenyl. Eur. J. Pharmacol. Environ.Toxicol. Pharm. 293, 463–474.
Ankley, G.T., Jensen, K.M., Kahl, M.D., Korte, J.J., Makynen, E.A., 2001. Description andevaluation of a short‐term reproduction test with the fathead minnow (Pimephalespromelas). Environ. Toxicol. Chem. 20, 1276–1290.
Behnisch, P.A., Hosoe, K., Brouwer, A., Sakai, S.-i., 2002. Screening of dioxin-like toxicityequivalents for various matrices with Wildtype and recombinant rat hepatoma H4IIEcells. Toxicol. Sci. 69, 125–130.
Bliss, C., 1939. The toxicity of poisons applied jointly1. Ann. Appl. Biol. 26, 585–615.Bolong, N., Ismail, A.F., Salim, M.R., Matsuura, T., 2009. A review of the effects of
emerging contaminants in wastewater and options for their removal. Desalination239, 229–246.
Brack, W., Dulio, V., Ågerstrand, M., Allan, I., Altenburger, R., Brinkmann, M., Bunke, D.,Burgess, R.M., Cousins, I., Escher, B.I., Hernández, F.J., Hewitt, L.M., Hilscherová, K.,Hollender, J., Hollert, H., Kase, R., Klauer, B., Lindim, C., Herráez, D.L., Miège, C.,Munthe, J., O'Toole, S., Posthuma, L., Rüdel, H., Schäfer, R.B., Sengl, M., Smedes, F.,van de Meent, D., van den Brink, P.J., van Gils, J., van Wezel, A.P., Vethaak, A.D.,Vermeirssen, E., von der Ohe, P.C., Vrana, B., 2017. Towards the review of theEuropean Union water framework management of chemical contamination inEuropean surface water resources. Sci. Total Environ. 576, 720–737.
Coors, A., Jones, P., Giesy, J., Ratte, H., 2004. Assessing the elimination of estrogenicactivity in advanced wastewater treatment with a reporter gene-based bioassay. Wat.Sci. Technol. 50, 181–188.
Di Paolo, C., Ottermanns, R., Keiter, S., Ait-Aissa, S., Bluhm, K., Brack, W., Breitholtz, M.,Buchinger, S., Carere, M., Chalon, C., Cousin, X., Dulio, V., Escher, B.I., Hamers, T.,Hilscherová, K., Jarque, S., Jonas, A., Maillot-Marechal, E., Marneffe, Y., Nguyen,M.T., Pandard, P., Schifferli, A., Schulze, T., Seidensticker, S., Seiler, T.-B., Tang, J.,van der Oost, R., Vermeirssen, E., Zounková, R., Zwart, N., Hollert, H., 2016. Bioassaybattery interlaboratory investigation of emerging contaminants in spiked water ex-tracts – towards the implementation of bioanalytical monitoring tools in waterquality assessment and monitoring. Water Res. 104, 473–484.
Eichbaum, K., Brinkmann, M., Buchinger, S., Reifferscheid, G., Hecker, M., Giesy, J.P.,Engwall, M., van Bavel, B., Hollert, H., 2014. In vitro bioassays for detecting dioxin-like activity — Application potentials and limits of detection, a review. Sci. TotalEnviron. 487, 37–48.
Giesy, J.P., Kannan, K., 1998. Dioxin-like and non-dioxin-like toxic effects of poly-chlorinated biphenyls (PCBs): implications for risk assessment. Crit. Rev. Toxicol. 28,511–569.
Hadrup, N., Taxvig, C., Pedersen, M., Nellemann, C., Hass, U., Vinggaard, A.M., 2013.Concentration addition, independent action and generalized concentration additionmodels for mixture effect prediction of sex hormone synthesis in vitro. PLoS One 8,e70490.
Harper, N., Connor, K., Steinberg, M., Safe, S., 1995. Immunosuppressive activity ofPolychiorinated biphenyl mixtures and congeners: nonadditive (antagonistic) inter-actions. Toxicol. Sci. 27, 131–139.
Hecker, M., Tyler, C.R., Hoffmann, M., Maddix, S., Karbe, L., 2002. Plasma biomarkers in
fish provide evidence for endocrine modulation in the Elbe River, Germany. Environ.Sci. Technol. 36 (11), 2311–2321.
Howard, G.J., Webster, T.F., 2009. Generalized concentration addition: a method forexamining mixtures containing partial agonists. J. Theor. Biol. 259, 469–477.
Howard, G.J., Schlezinger, J.J., Hahn, M.E., Webster, F., 2010. Generalized concentrationaddition predicts joint effects of aryl hydrocarbon receptor agonists with partialagonists and competitive antagonists. Environ. Health Perspect. 118, 666.
Jobling, S., Sumpter, J.P., Sheahan, D., Osborne, J.A., Matthiessen, P., 1996. Inhibition oftesticular growth in rainbow trout (Oncorhynchus mykiss) exposed to estrogenicalkylphenolic chemicals. Environ. Toxicol. Chem. 15 (2), 194–202.
Kidd, K.A., Blanchfield, P.J., Mills, K.H., Palace, V.P., Evans, R.E., Lazorchak, J.M., Flick,R.W., 2007. Collapse of a fish population after exposure to a synthetic estrogen. Proc.Natl. Acad. Sci. 104 (21), 8897–8901.
Kidd, K.A., Paterson, M.J., Rennie, M.D., Podemski, C.L., Findlay, D.L., Blanchfield, P.J.,Liber, K., 2014. Direct and indirect responses of a freshwater food web to a potentsynthetic oestrogen. Phil. Trans. R. Soc. B 369 (1656), 20130578.
Körner, W., Hanf, V., Schuller, W., Kempter, C., Metzger, J., Hagenmaier, H., 1999.Development of a sensitive E-screen assay for quantitative analysis of estrogenicactivity in municipal sewage plant effluents. Sci. Total Environ. 225, 33–48.
Körner, W., Spengler, P., Bolz, U., Schuller, W., Hanf, V., Metzger, J.W., 2001. Substanceswith estrogenic activity in effluents of sewage treatment plants in southwesternGermany. 2. Biological analysis. Environ. Toxicol. Chem. 20, 2142–2151.
Kunz, P.Y., Simon, E., Creusot, N., Jayasinghe, B.S., Kienle, C., Maletz, S., Schifferli, A.,Schönlau, C., Aït-Aïssa, S., Denslow, N.D., Hollert, H., Werner, I., Vermeirssen,E.L.M., 2017. Effect-based tools for monitoring estrogenic mixtures: evaluation of fivein vitro bioassays. Water Res. 110, 378–388.
Leino, R.L., Jensen, K.M., Ankley, G.T., 2005. Gonadal histology and characteristic his-topathology associated with endocrine disruption in the adult fathead minnow(Pimephales promelas). Environ. Toxicol. Pharmacol. 19 (1), 85–98.
Loewe, S., Muischnek, H., 1926. Combinated effects I announcement-implements to theproblem. In: Naunyn-Schmiedebergs Archiv Fur Experimentelle Pathologie UndPharmakologie. 114. pp. 313–326.
Nweke, C., Orji, J., Ahumibe, N., 2015. Prediction of phenolic compounds and formulatedglyphosate toxicity in binary mixtures using rhizobium species dehydrogenase ac-tivity. Advances Life Sci. 5, 27–38.
Otte, J.C., Keiter, S., Faßbender, C., Higley, E.B., Rocha, P.S., Brinkmann, M.,Wahrendorf, D.-S., Manz, W., Wetzel, M.A., Braunbeck, T., 2013. Contribution ofpriority PAHs and POPs to ah receptor-mediated activities in sediment samples fromthe river Elbe estuary, Germany. PLoS One 8, e75596.
Pawlowski, S., Van Aerle, R., Tyler, C.R., Braunbeck, T., 2004. Effects of 17α-ethinyles-tradiol in a fathead minnow (Pimephales promelas) gonadal recrudescence assay.Ecotoxicol. Environ. Saf. 57 (3), 330–345.
Petrović, M., Gonzalez, S., Barceló, D., 2003. Analysis and removal of emerging con-taminants in wastewater and drinking water. TrAC Trends Anal. Chem. 22, 685–696.
Pojana, G., Gomiero, A., Jonkers, N., Marcomini, A., 2007. Natural and synthetic endo-crine disrupting compounds (EDCs) in water, sediment and biota of a coastal lagoon.Environ. Int. 33, 929–936.
Preuss, T.G., Gehrhardt, J., Schirmer, K., Coors, A., Rubach, M., Russ, A., Jones, P.D.,Giesy, J.P., Ratte, H.T., 2006. Nonylphenol isomers differ in estrogenic activity.Environ. Sci. Technol. 40, 5147–5153.
Preuss, T.G., Gurer-Orhan, H., Meerman, J., Ratte, H.T., 2010. Some nonylphenol isomersshow antiestrogenic potency in the MVLN cell assay. Toxicol. in Vitro 24, 129–134.
Putzrath, R.M., 1997. Estimating relative potency for receptor-mediated toxicity: re-evaluating the toxicity equivalence factor (TEF) model. Regul. Toxicol. Pharmacol.25, 68–78.
Riggs, B.L., Hartmann, L.C., 2003. Selective estrogen-receptor modulators—mechanismsof action and application to clinical practice. N. Engl. J. Med. 348, 618–629.
Ruß, A.S., Vinken, R., Schuphan, I., Schmidt, B., 2005. Synthesis of branched para-non-ylphenol isomers: occurrence and quantification in two commercial mixtures.Chemosphere 60, 1624–1635.
Safe, S., 1997. Limitations of the toxic equivalency factor approach for risk assessment ofTCDD and related compounds. Teratog. Carcinog. Mutagen. 17, 285–304.
Snyder, S.A., Villeneuve, D.L., Snyder, E.M., Giesy, J.P., 2001. Identification and quan-tification of estrogen receptor agonists in wastewater effluents. Environ. Sci. Technol.35, 3620–3625.
Snyder, S.A., Westerhoff, P., Yoon, Y., Sedlak, D.L., 2003. Pharmaceuticals, personal careproducts, and endocrine disruptors in water: implications for the water industry.Environ. Eng. Sci. 20, 449–469.
Soto, A.M., Sonnenschein, C., Chung, K.L., Fernandez, M.F., Olea, N., Serrano, F.O., 1995.The E-SCREEN assay as a tool to identify estrogens: an update on estrogenic en-vironmental pollutants. Environ. Health Perspect. 103, 113–122.
Spengler, P., Körner, W., Metzger, J.W., 2001. Substances with estrogenic activity in ef-fluents of sewage treatment plants in southwestern Germany. 1. Chemical analysis.Environ. Toxicol. Chem. 20, 2133–2141.
Triebskorn, R., Amler, K., Blaha, L., Gallert, C., Giebner, S., Güde, H., Henneberg, A.,Hess, S., Hetzenauer, H., Jedele, K., Jung, R.-M., Kneipp, S., Köhler, H.-R., Krais, S.,Kuch, B., Lange, C., Löffler, H., Maier, D., Metzger, J., Müller, M., Oehlmann, J.,Osterauer, R., Peschke, K., Raizner, J., Rey, P., Rault, M., Richter, D., Sacher, F.,Scheurer, M., Schneider-Rapp, J., Seifan, M., Spieth, M., Vogel, H.-J., Weyhmüller,M., Winter, J., Wurm, K., 2013. SchussenAktivplus: reduction of micropollutants andof potentially pathogenic bacteria for further water quality improvement of the riverSchussen, a tributary of Lake Constance, Germany. Environ. Sci. Eur. 25, 2.
Villeneuve, D.L., Blankenship, A.L., Giesy, J.P., 2000. Derivation and application of re-lative potency estimates based on in vitro bioassay results. Environ. Toxicol. Chem.19, 2835–2843.
Vinken, R., Schmidt, B., Schäffer, A., 2002. Synthesis of tertiary 14C-labelled nonylphenol
M. Brinkmann et al. Toxicology in Vitro 46 (2018) 294–303
302

isomers. J. Label. Compd. Radiopharm. 45, 1253–1263.Wernersson, A.-S., Carere, M., Maggi, C., Tusil, P., Soldan, P., James, A., Sanchez, W.,
Dulio, V., Broeg, K., Reifferscheid, G., Buchinger, S., Maas, H., Van Der Grinten, E.,O'Toole, S., Ausili, A., Manfra, L., Marziali, L., Polesello, S., Lacchetti, I., Mancini, L.,Lilja, K., Linderoth, M., Lundeberg, T., Fjällborg, B., Porsbring, T., Larsson, D.J.,
Bengtsson-Palme, J., Förlin, L., Kienle, C., Kunz, P., Vermeirssen, E., Werner, I.,Robinson, C.D., Lyons, B., Katsiadaki, I., Whalley, C., den Haan, K., Messiaen, M.,Clayton, H., Lettieri, T., Carvalho, R.N., Gawlik, B.M., Hollert, H., Di Paolo, C., Brack,W., Kammann, U., Kase, R., 2015. The European technical report on aquatic effect-based monitoring tools under the water framework directive. Environ. Sci. Eur. 27, 7.
M. Brinkmann et al. Toxicology in Vitro 46 (2018) 294–303
303