GENERAL SURGERY PROFILE - CMA · PDF filesurgeons may do gynecologic, urologic, orthopedic and...
21
GENERAL SURGERY PROFILE GENERAL INFORMATION (Sources: Pathway Evaluation Program, the Canadian Medical Residency Guide, Royal College) The general surgeon is trained to provide surgical care for the whole patient. This includes making a diagnosis; preoperative, operative and postoperative management of the patient; and the surgical treatment of the: • alimentary tract; • abdomen and its contents, including the pelvis; • breast, skin and soft tissue; and • endocrine system. It includes head and neck surgery, pediatric surgery, surgical critical care, surgical oncology, trauma and burns, transplants and vascular surgery. The exact profile of a general surgeon’s practice may vary depending on whether the practice is in an academic centre, an urban community or a more rural centre. In rural practice, some surgeons may do gynecologic, urologic, orthopedic and ENT surgeries. In some academic centres, a general surgeon might limit his/her practice to one subspecialty.
Transcript of GENERAL SURGERY PROFILE - CMA · PDF filesurgeons may do gynecologic, urologic, orthopedic and...

GENERAL SURGERY PROFILE
GENERAL INFORMATION (Sources: Pathway Evaluation Program, the Canadian Medical Residency Guide, Royal College) The general surgeon is trained to provide surgical care for the whole patient. This includes making a diagnosis; preoperative, operative and postoperative management of the patient; and the surgical treatment of the: • alimentary tract; • abdomen and its contents, including the pelvis; • breast, skin and soft tissue; and • endocrine system. It includes head and neck surgery, pediatric surgery, surgical critical care, surgical oncology, trauma and burns, transplants and vascular surgery. The exact profile of a general surgeon’s practice may vary depending on whether the practice is in an academic centre, an urban community or a more rural centre. In rural practice, some surgeons may do gynecologic, urologic, orthopedic and ENT surgeries. In some academic centres, a general surgeon might limit his/her practice to one subspecialty.

General surgery tends to be a varied specialty, where the activities of a general surgeon involve time in the operating room, office, emergency department and the intensive care unit. General surgical practice requires expertise in communication and collaboration, teaching and research, health care management and continuing professional development. After completing medical school, to become a general surgeon requires an additional 5 years of training in an Royal College-approved program. Some schools offer a 6-year program, while others offer an optional PGY6 year. The resident must acquire a thorough knowledge of the theoretical basis of general surgery, including its foundations in the basic medical sciences and research. Training should incorporate the principle of graded increasing responsibility. This must include at least 36 months of general surgery rotations, of which at least one year must be spent as a senior or chief resident. For more detailed information on the specialty training requirements go to: For more detailed training requirements go to: http://www.royalcollege.ca/portal/page/portal/rc/credentials/start/routes/traditional_route Canadian Association of General Surgeons www.cags-accg.ca
GENERAL SURGERY PROFILE

Number of physicians and physicians/100,000 population for General Surgery in Canada, 2015
Source: 2015 CMA Masterfile
Province/Territory Physicians Phys/100k pop'n
Newfoundland/Labrador 42 8.0
Prince Edward Island 11 7.5
Nova Scotia 69 7.3
New Brunswick 47 6.2
Quebec 576 7.0
Ontario 793 5.8
Manitoba 77 6.0
Saskatchewan 67 5.9
Alberta 184 4.4
British Columbia 293 6.3
Territories 7 6.0
CANADA 2166 6.1

Physicians/100,000 population for General Surgery in Canada, 1995 to 2015
Source: CMA Masterfile
5.2
5.4
5.6
5.8
6.0
6.2
6.4
6.6
1995 1997 1999 2001 2003 2005 2007 2009 2011 2013 2015

General Surgeons by gender and year in Canada, 1995 to 2015
0
500
1000
1500
2000
2500
1995 1997 1999 2001 2003 2005 2007 2009 2011 2013 2015
Total Males Females
Source: CMA Masterfile

General Surgeons by age and gender in Canada, 2015
Source: 2015 CMA Masterfile
Female 24%
Male 76%
Gender
34 and under 6%
35 - 44 27%
45 - 54 28%
55 - 64 22%
65 and over 17%
Age Group

General Surgeons by age and gender in Canada, 2015
Source: 2015 CMA Masterfile
61
213
143
66
14
70
360
444
384
346
34 and Under
35-44
45-54
55-64
65 and over
Female Male

Main work setting of General Surgeons in Canada, 2014
Source: 2014 National Physician Survey. CFPC, CMA, Royal College
42%
27%
13%
12%
1%
1%
1%
Community Hospital
Academic Health Sciences Centre
Private Office/Clinic
Non-AHSC Teaching Hospital
Admin/Corp office
Free-standing Lab/Diag Clinic
Other Hospital

Practice organization for General Surgeons in Canada, 2014
Source: 2014 National Physician Survey. CFPC, CMA, Royal College
29%
8%
3%
59%
1%
Solo Practice
Group Practice
Interprofessional Practice
Hospital-based Practice
NR

Hours worked per week (excluding on-call) by General Surgeons in Canada, 2014
Source: 2014 National Physician Survey. CFPC, CMA, Royal College
Activity Hours worked per week
Direct patient care without teaching component 26.4
Direct patient care with teaching component 9.7
Teaching without patient care 2.1
Indirect patient care 5.7
Health facility committees 1.1
Administration 2.6
Research 0.8
Managing practice 2.1
Continued professional development 3.0
Other 0.7
TOTAL HOURS PER WEEK 54.3

Time spent on call in direct patient care = 63 hrs./month
On-call duty hours spent per month by General Surgeons in Canada, 2014
Source: 2014 National Physician Survey. CFPC, CMA, Royal College
43%
29%
16%
10%
2%
Up to 120 hrs/month
More than 120, up to 180 hrs/month
More than 180, up to 240 hrs/month
More than 240 hrs/month
No response

Remuneration for General Surgeons in Canada
60%
4%
7%
26%
4%
Primary payment method1 in 2013
90% + fee-for-service 90% + salary
90% + other* Blended
NR
* Other includes capitation, sessional, contract and other methods
Average gross clinical earnings for General Surgery in 2013/14 (those earning at least $60,000) = $420,4842
Average percent overhead reported by all surgeons in 2010 = 28.4%3
1 National Physician Survey, 2013, CFPC, CMA, Royal College 2 National Physician Database, 2013/14, CIHI 3 National Physician Survey, 2010, CFPC, CMA, Royal College

Satisfaction among General Surgeons in Canada, 2013
9%
9%
3%
4%
10%
19%
10%
22%
50%
35%
19%
11%
Currentprofessional life
Balance ofpersonal &
professionalcommitments
NR Very dissatisfied Dissatisfied
Neutral Satisfied Very satisfied
Source: 2013 National Physician Survey. CFPC, CMA, Royal College

General Surgeons who are Royal College, CFPC or CMQ certified in Canada, 2015
99%
1%
18% 10%
Royal College CFPC CMQ Outside Canada
Note: Subset of those who reported a certification. Physicians could indicate more than one certification body.
Source: 2014 National Physician Survey. CFPC, CMA, Royal College

Number of General Surgeons who retired during the THREE year period of 2012 to 2014
Source: CMA Masterfile – year over year comparisons Note: “Retired” is based on giving up licence and is therefore excludes those who have retired from clinical practice but are still licensed; it includes physicians who have temporarily given up their licence but may return to practice at a later date.
3 3
82 88
1 1 4 6
< 35 35-44 45-54 55-64 65 + Total
Age Group
Males Females

Faculty of Medicine
Ministry funded
Total Faculty of Medicine
Ministry funded
Total
Memorial U N&L 18 18 McMaster U 44 64
Dalhousie U 33 35 UWO 27 34
U Laval 28 31 NOSM 10 10
U Sherbrooke 28 28 U Manitoba 22 28
U Montréal 47 50 U Sask 24 26
McGill U 26 64 U Alberta 46 55
U Ottawa 38 43 U Calgary 33 40
Queens U 18 21 UBC 42 53
U Toronto 77 112 Canada 562 712
Total and Ministry funded postgraduate MD trainees in 2014/15 – General surgery
Source: 2014/15 Annual Census of Post-MD Trainees, CAPER
*Includes pediatric general surgery

45 41
50
36
0
50
100
First year Exits frompostgrad
Female
Male86
60
9
17
0
50
100
First year Postgradexits
IMG
GCMS
First year and exiting postgraduate-MD trainees in 2014/15 – General Surgery
Source: 2014/15 Annual Census of Post-MD Trainees, CAPER
IMG – International Medical Graduates GCMS – Graduates of Canadian Medical Schools

• Total of 95 first year General Surgery trainees representing 17% of all General Surgery trainees.
• Total of 562 General Surgery trainees representing 4% of all Ministry funded trainees.
• Total of 91 visa trainees in General Surgery.
• Total of 77 General Surgery trainees completed postgraduate training in 2014.
Postgraduate-MD trainees in 2014/15 – General Surgery
Source: 2014/15 Annual Census of Post-MD Trainees, CAPER
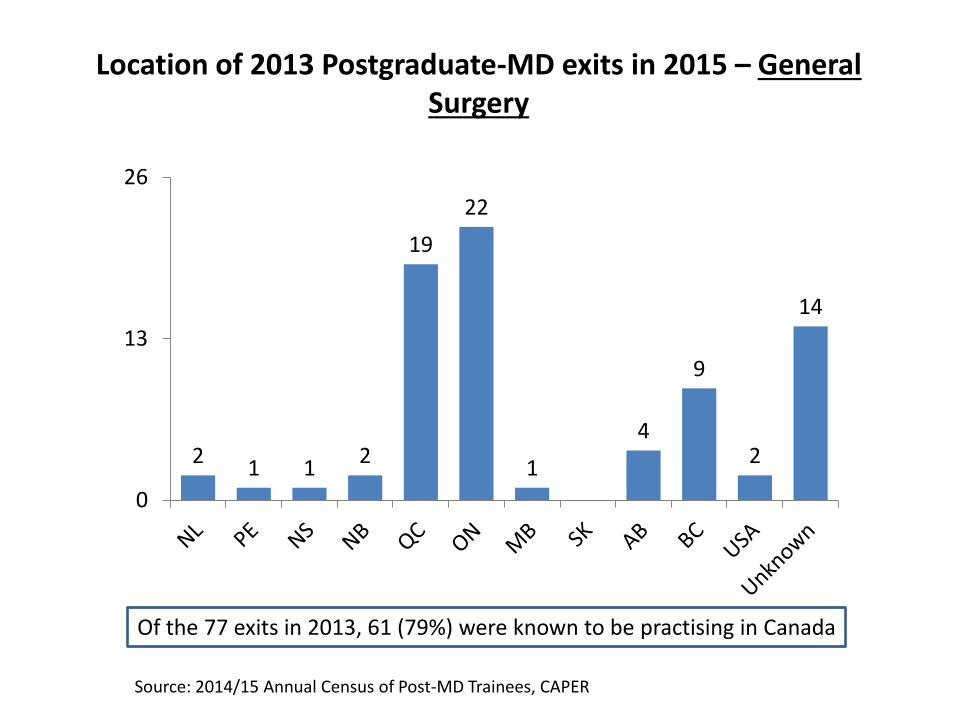
2 1 1
2
19
22
1
4
9
2
14
0
13
26
Location of 2013 Postgraduate-MD exits in 2015 – General Surgery
Of the 77 exits in 2013, 61 (79%) were known to be practising in Canada
Source: 2014/15 Annual Census of Post-MD Trainees, CAPER

Stress associated with finding employment at end of residency
6%
7%
20%
43%
50%
42%
25%
8%
Other spec res
FM resident
NR/NA Not stressful Somewhat stressful Very stressful
Source: 2012 National Physician Survey of residents. CFPC, CMA, Royal College

National Physician Survey http://www.nationalphysiciansurvey.ca Canadian Medical Association http://www.cma.ca/pdc Association of Faculties of Medicine of Canada http://www.caper.ca/ Royal College of Physicians and Surgeons of Canada http://www.royalcollege.ca/portal/page/portal/rc/credentials/start/routes/traditional_route
College of Family Physicians of Canada http://www.cfpc.ca Canadian Institute for Health Information http://www.cihi.ca
Links to the organizations supplying information for this document