General overview of the Baikal Lake : history, functioning and environmental problems Eugene A....
90
General overview of the Baikal Lake : history, functioning and environmental problems Eugene A. Silow UNESCO Chair of Water Resources Institute of Biology Irkutsk State University Irkutsk, Russia
-
Upload
gwendolyn-freeman -
Category
Documents
-
view
217 -
download
1
Transcript of General overview of the Baikal Lake : history, functioning and environmental problems Eugene A....

General overview of the Baikal Lake :
history, functioning and environmental problems
Eugene A. SilowUNESCO Chair of Water Resources
Institute of BiologyIrkutsk State University
Irkutsk, Russia

General Characteristics of the Lake Baikal

Name of the Lake A, km2
Superior (Canada/USA) 82,367
Victoria (Uganda/Kenya/Tanzania) 68,800
Huron (Canada/USA) 59,500
Michigan (USA) 58,016
Tanganyika(Burundi/Zaire/Tanzania/Zambia) 32,000
Baikal (Russia) 31,500
Great Bear (Canada) 31,326
Lake Nyasa [=Malawi] (Tanzania/Malawi/Mozambique)
30,800
Great Slave (Canada) 28,568
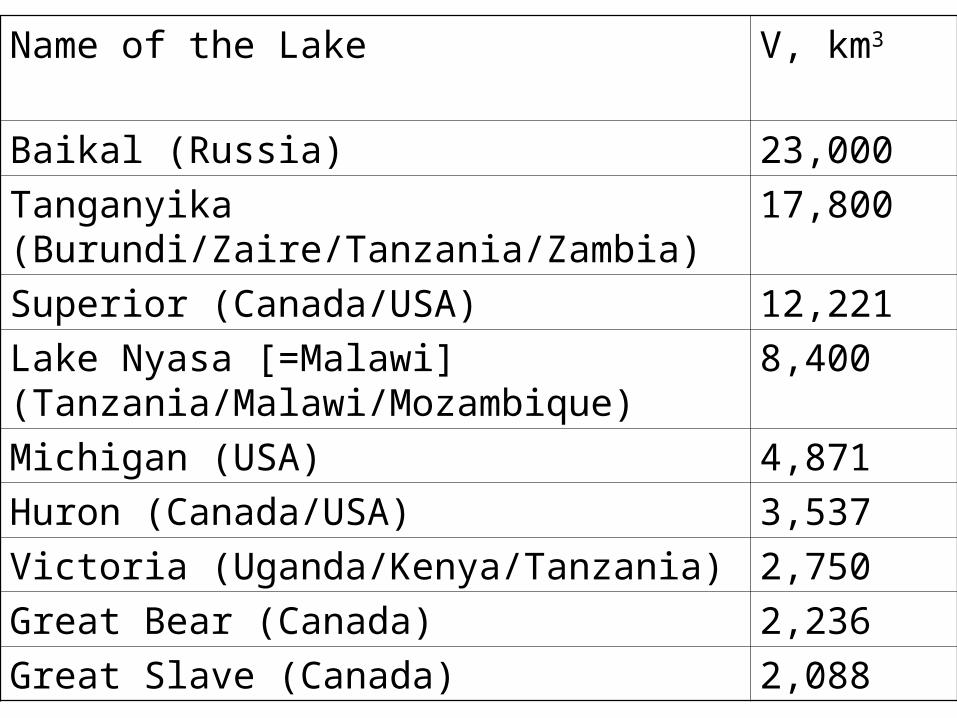
Name of the Lake V, km3
Baikal (Russia) 23,000
Tanganyika (Burundi/Zaire/Tanzania/Zambia)
17,800
Superior (Canada/USA) 12,221
Lake Nyasa [=Malawi] (Tanzania/Malawi/Mozambique)
8,400
Michigan (USA) 4,871
Huron (Canada/USA) 3,537
Victoria (Uganda/Kenya/Tanzania) 2,750
Great Bear (Canada) 2,236
Great Slave (Canada) 2,088

Name of the Lake zm , m
Baikal (Russia) 1,630
Tanganyika (Burundi/Zaire/Tanzania/Zambia)
1,470
Lake Nyasa [=Malawi] 758
Great Slave (Canada) 614
Lake Crater (USA) 588
Lake Tahoe (USA) 505
Great Bear (USA) 446
Superior (Canada/USA) 406
Lago Maggiore (Italy) 370
Lac Léman [=Lake Geneva] (Switzerland/France)
310

Lakes Name V A Zm “Rating”
Baikal (Asia) 1 6 1 1
Tanganyika (Africa) 2 5 2 2
Superior (N. America) 3 1 8 3
Lake Nyasa (Africa) 4 8 3 4
Michigan (N. America) 5 4 >10 5-7
Huron (N. America) 6 3 >10 5-7
Victoria (Africa) 7 2 >10 5-7
Great Slave (N. America) 9 9 4 8/9
Great Bear (N. America) 8 7 7 8/9

Lakes Name V A Zm
Baikal (Asia) 23,000 31,500 1,630
Lac Léman 89 584 310
Lac du Bourget 3.6 44.5 145
Lac d’Annecy 1.12 27.6 64.7
Lake Baikal and Alp lakes

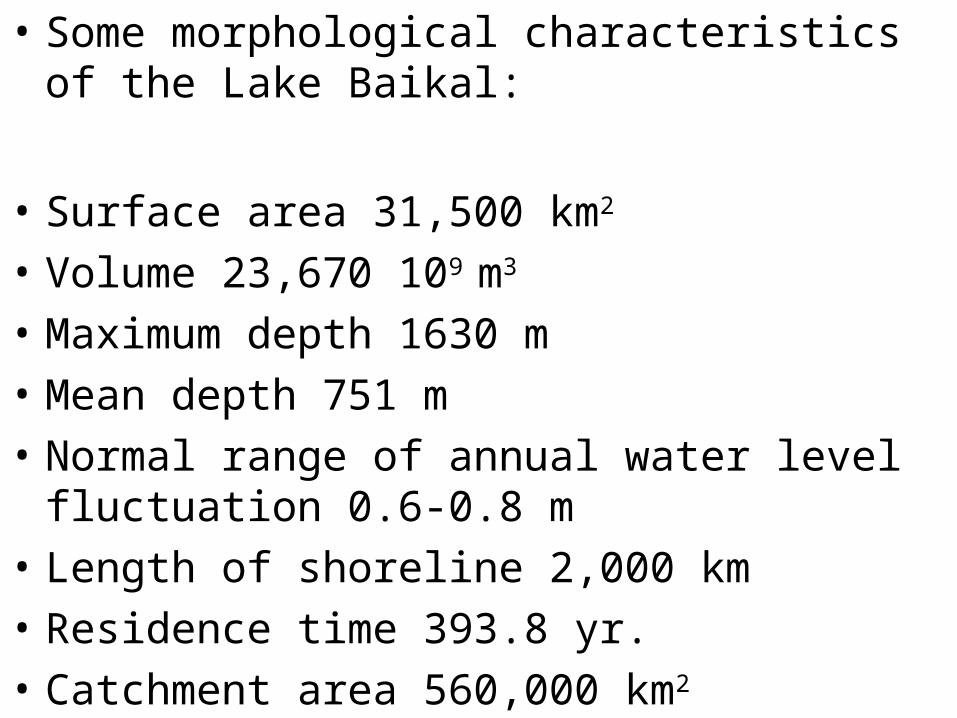
• Some morphological characteristics of the Lake Baikal:
• Surface area 31,500 km2
• Volume 23,670 109 m3
• Maximum depth 1630 m
• Mean depth 751 m
• Normal range of annual water level fluctuation 0.6-0.8 m
• Length of shoreline 2,000 km
• Residence time 393.8 yr.
• Catchment area 560,000 km2

• The winds at the Lake Baikal are enormously strong.
• The velocity of them can reach 50 m/sec and even more.
• The water of the lake is extremely clean and extremely “fresh”.
• The transparency of it is up to 40 m, and mineral content is 96 mg/l (international standard is about 400 mg/l)

Lake Baikal,2007 06.12
MERIS
Lake Baikal,2006 02.01
MERIS
Summer Winter

Lake Baikal was designated as a UNESCO World Heritage site in
December, 1996
• More than 1,000 species of animals and about 500 species of plants inhabiting Baikal are endemic. Lake Baikal is a home of viviparous transparent fishes belonging to endemic family Comephoridae, more than 250 species of Gammaridae, the only freshwater seal and many other creatures.

Lake Origin

• Lake Baikal is supposed to be one of the oldest lakes in the world. Its age is about 25 millions years, though in the present form it exists about 1 million years.
• Baikal can be an example of typical lake of rift origin. It lays in the rift valley 1,500 km long and 7 km deep (the height from the stony bottom to the top of mountains is 10 km).

TTHHEE SSTTRRUUCCTTUURREE OOFF TTHHEE RRIIFFTT
ANOMALOUS MAGMA
VOVEMENT

Lake ecosystem functioning

Light Littoral zone Pelagic zone Littoral zone Water surface Photic zone Aphotic zone

1. Biogenic materials turnover
2. Sedimentation and exchange processes
3. Exchange between water and atmosphere
4. Inputs due to precipitation
5. Adsorption and desorption
6. Inflow and outflow
3 4
5 1 2

What are Habitat & Ecological Niche?
• Habitat of the organism is the place, where it lives, while ecological niche is its functional role in the community together with the position related with conditions of existence.
• In other words: Habitat is an “address” of organism, while niche is its “occupation”.

There are three main habitats in the lake:
• The water mass itself.
• Two boundaries:
1. Air/water.
2. Water/bottom.

Water Mass
The community of water mass (from the ecological point of view) consists of :
• Producents (algae)
• Consuments (animals)
• Reducents (microorganisms)
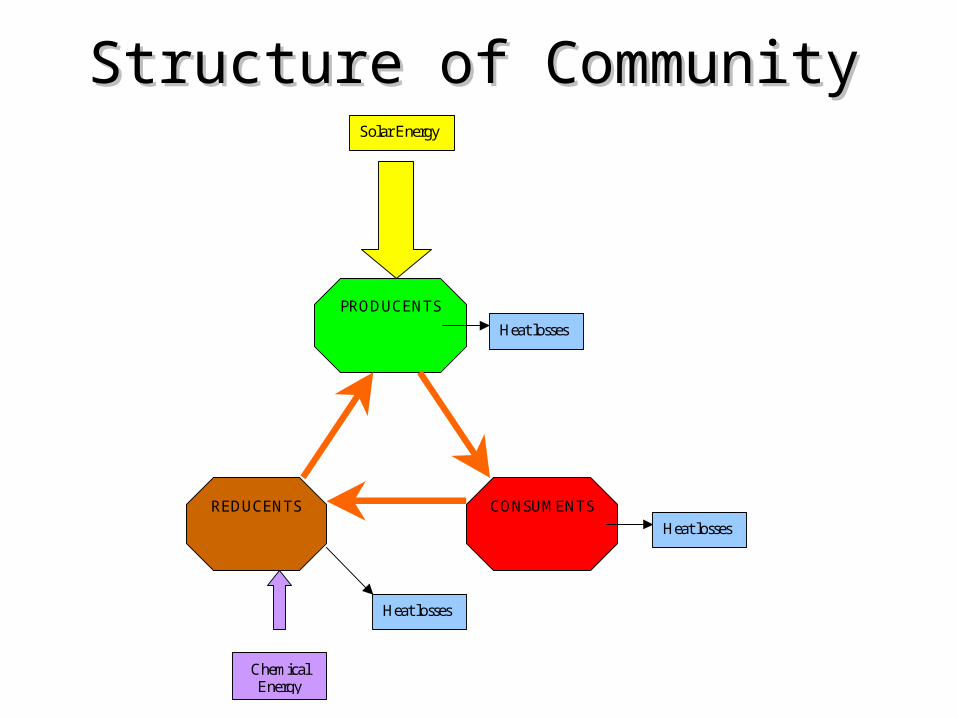
PRODUCENTS
CONSUMENTS REDUCENTS
Heat losses
Heat losses
Heat losses
Solar Energy
Chemical Energy
Structure of CommunityStructure of Community

Water Mass
From the limnological point of view the community of water mass consists of :
• Plankton – floating or weakly swimming organisms on the mercy of water current.
• Nekton – swimming animals, that inhabit pelagic zone and can master their position in water.

Water Mass
Plankton is subdivided into:
• Phytoplankton – microscopic (mainly) algae.
• Zooplankton – Protozoa, Rotifers, Crustaceans, Insects (often larvae).
• Bacterioplankton.


Plankton Complex of the Lake Baikal
ENDEMIC• Diatom
Phytoplankton
• Winter Rotifers• Epischura
NON-ENDEMIC• Blue-green
Phytoplankton• Green Algae• Summer Rotifers• Cyclops• Cladocerans

Bacterioplankton, Bacteria in sediments
Zoo-plankton
Zoo-benthos
Phyto-plankton
Phyto-benthos
Nekton

“Normal” Annual Behaviour for Temperate Lake :
4 oC
20 oC
SUMMER
4 oC
AUTUMN
4 oC
1 oC
WINTER
4 oC
SPRING

Annual dynamics (average) of water temperature at point #1
(1948-2002)
0,0
2,0
4,0
6,0
8,0
10,0
12,0
14,0
Янв
арь
Фев
рал
ь
Мар
т
Апр
ель
Май
Ию
нь
Ию
ль
Авг
уст
Сен
тяб
рь
Окт
ябрь
Ноя
брь
Дек
абрь
t, °C
0 м 5 м 10 м 20 м 30 м 50 м 100 м 150 м 200 м 250 м 300 м

Annual dynamics (average) of water temperature at point #1
(1948-2002)0
50
100
150
200
250
300
0,0 2,0 4,0 6,0 8,0 10,0 12,0 14,0
t, °C
H, м
Январь Февраль Март Апрель
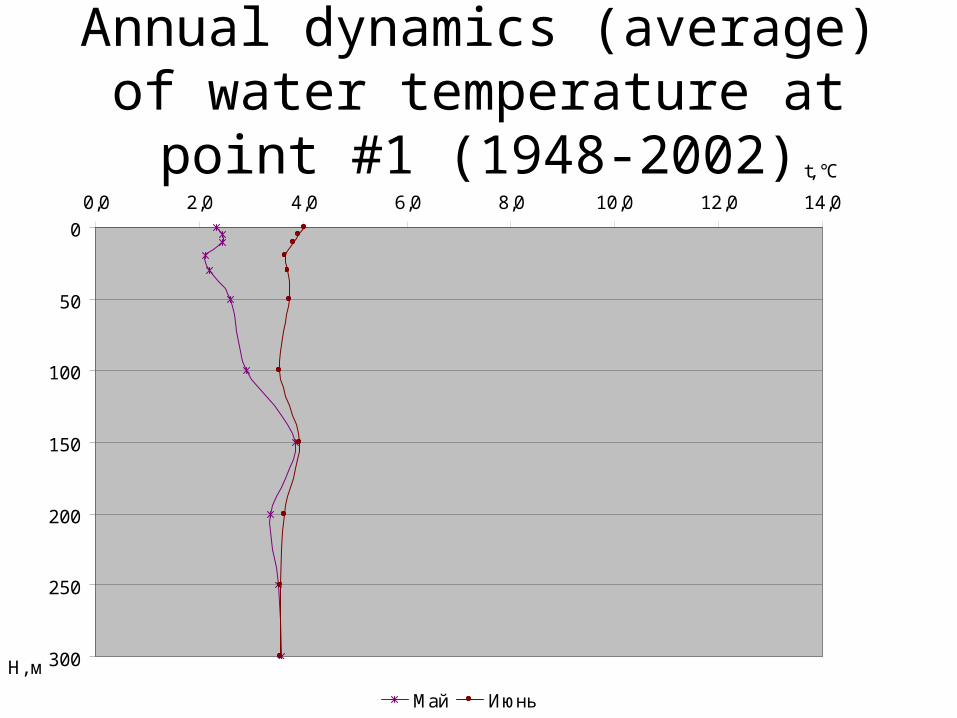
Annual dynamics (average) of water temperature at point #1
(1948-2002)0
50
100
150
200
250
300
0,0 2,0 4,0 6,0 8,0 10,0 12,0 14,0
t, °C
H, м
Май Июнь

Annual dynamics (average) of water temperature at point #1
(1948-2002)0
50
100
150
200
250
300
0,0 2,0 4,0 6,0 8,0 10,0 12,0 14,0
t, °C
H, м
Июль Август Сентябрь

Annual dynamics (average) of water temperature at point #1
(1948-2002)
0
50
100
150
200
250
300
0,0 2,0 4,0 6,0 8,0 10,0 12,0 14,0
t, °C
H, м
Октябрь Ноябрь Декабрь

Annual dynamics of phytoplankton (according to chlorophyll a) at point
#1 (2002) I II III IV V V I V II V III IX X X I X II
-2 5 0
-2 0 0
-1 5 0
-1 0 0
-5 0
0
Глу
бин
а, м
М еся ц ы
0 .00
0 .25
0 .50
0 .75
1 .00
1 .25
1 .50
1 .75
2 .00
2 .25
2 .50
С х л . "а " , м г м -3

Annual dynamics of phytoplankton (according to chlorophyll a) at point
#1 (2005)
-2 5 0
-2 0 0
-1 5 0
-1 0 0
-5 0
0
Глу
бина
, м
0 .00
0 .20
0 .40
0 .60
0 .80
1 .00
1 .20
1 .40
1 .60
1 .80
2 .00
2 .20
2 .40
2 .60
С х л . "а " , м г м-3
I II III IV V V I V II V III IX X X I X II М еся ц ы

Annual dynamics of zooplankton number at point #1
0
50
100
150
200
250
0 20 40 60 80 100
численность, тыс.экз.м-3
глуб
ин
а, м
10.02.1998
17.02.1998
25.02.1998
03.03.1998
09.03.1998
18.03.1998
25.03.1998
01.04.1998
08.04.1998

Annual dynamics of zooplankton number at point #1
0
50
100
150
200
250
0 20 40 60 80 100
численность, тыс.экз.м-3
глуб
ин
а, м
08.05.1998
18.05.1998
25.05.1998
01.06.1998
08.06.1998
15.06.1998
23.06.1998
29.06.1998

Annual dynamics of zooplankton number at point #1
0
50
100
150
200
250
0 20 40 60 80 100
численность, тыс.экз.м-3
глуб
ин
а, м
06.07.1998
10.07.1998
19.07.1998
28.07.1998
03.08.1998
11.08.1998
17.08.1998
25.08.1998
01.09.1998
07.09.1998
16.09.1998
24.09.1998

Annual dynamics of zooplankton number at point #1
0
50
100
150
200
250
0 20 40 60 80 100
численность, тыс.экз.м-3
глуб
ин
а, м
01.10.1998
09.10.1998
16.10.1998

Annual dynamics of zooplankton number at point #1
0
50
100
150
200
250
0 20 40 60 80 100
численность, тыс. экз. м-3
глуб
ин
а, м
16.02.2005
24.02.2005
02.03.2005
10.03.2005
16.03.2005
25.03.2005

Annual dynamics of zooplankton number at point #1
0
50
100
150
200
250
0 20 40 60 80 100
численность, тыс.экз.м-3
глуб
ин
а, м
19.05.2005
31.05.2005
08.06.2005
18.06.2005
26.06.2005

Annual dynamics of zooplankton number at point #1
0
50
100
150
200
250
0 100 200 300 400 500 600
численность, тыс.экз.м-3
глуб
ин
а, м
06.07.2005
12.07.2005
21.07.2005
27.07.2005
02.08.2005
09.08.2005
21.08.2005
28.08.2005
06.09.2005
25.09.2005
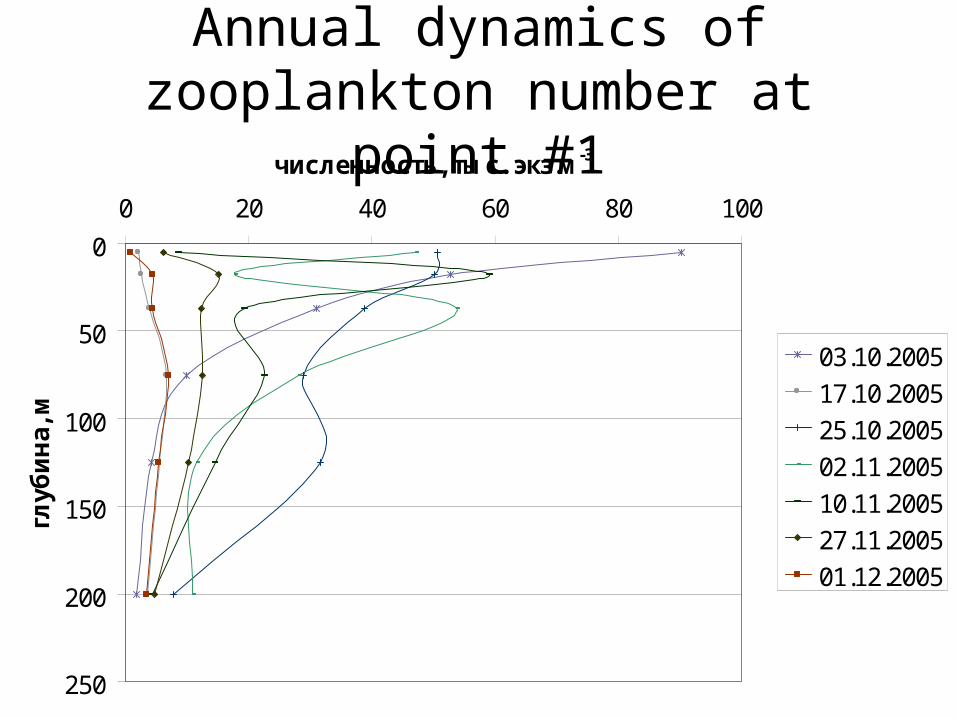
Annual dynamics of zooplankton number at point #1
0
50
100
150
200
250
0 20 40 60 80 100
численность, тыс. экз.м-3
глуб
ин
а, м
03.10.2005
17.10.2005
25.10.2005
02.11.2005
10.11.2005
27.11.2005
01.12.2005

Annual dynamics of zooplankton number at point #1 (Epischura
baicalensis), 103 spec.m-2
0
500
1000
1500
2000
2500
3000
3500
1 2 3 4 5 6 7 8 9 10 11 12
months
Nu
mb
er
1989
1990
1991
1992
1993
1994
1995
1996
1997
1998

Annual dynamics of zooplankton number at point #1 (Cyclops
kolensis), 103 spec.m-2
Cyclops kolensis
0
500
1000
1500
2000
1 2 3 4 5 6 7 8 9 10 11 12
months
Nu
mb
er
1989
1990
1991
1992
1993
1994
1995
1996
1997
1998

Annual dynamics of zooplankton number at point #1 (Rotifers), 103
spec.m-2
Keratella quadrata
0
200400
600800
1000
12001400
1600
1 2 3 4 5 6 7 8 9 10 11 12
месяцы
чи
слен
но
сть
1989
1990
1991
1992
1993
1994
1995
1996
1997
1998

Annual dynamics of zooplankton number at point #1 (Rotifers), 103
spec.m-2
Notholca grandis+N.intermedia
0
10
20
30
40
50
1 2 3 4 5 6 7 8 9 10 11 12
months
nu
mb
er
1989
1990
1991
1992
1993
1994
1995
1996
1997
1998

Annual Dynamics of Phytoplankton
Structure of water body Inverted stratification
Spring homothermy,
mixing
Direct stratification
Autumn homothermy,
mixing Month
February-April May-June July-September October-
November Ice +++ + +
Complex of algae: Aulacoseira baicalensis, A. skvortzowii, Stephanodiscus meyeri, Cyclotella baicalensis, Synedra ulna, S.
acus, Gymnodinium baicalense, Peridinium baicalense, Dinobryon cylindricum
+++ + + +
Complex of algae: Monoraphidium pseudomirabile, Chrysochromulina parva, Rhodomonas pusilla, Cyclotella
minuta, Asterionella formosa, Dinobryon sociale, Synechocystis limnetica
+ + +++ +
+ Observed, ++ Developed, +++ Mass development

Annual Dynamics of Zooplankton
Structure of water body Inverted stratification
Spring homothermy, mixing
Direct stratification Autumn homothermy, mixing
Month February-April May-June July-September October-November Ice +++ + +
Epischura baicalensis +++ + +++ + Cyclops kolensis + + +++ +
Synchaeta pachypoda, Notholca grandis, Notholca intermedia
+++
Keratella quadrata, K. cochlearis, Kellicottia longispina, Filinia terminalis
++ + ++ +
Rotif
ers
Synchaeta stylata, S. grandis, Asplanchna priodonta, Collotheca
mutabilis +++ +
Zoop
lankt
on
Cladocerans +++ + + Observed, ++ Developed, +++ Mass development
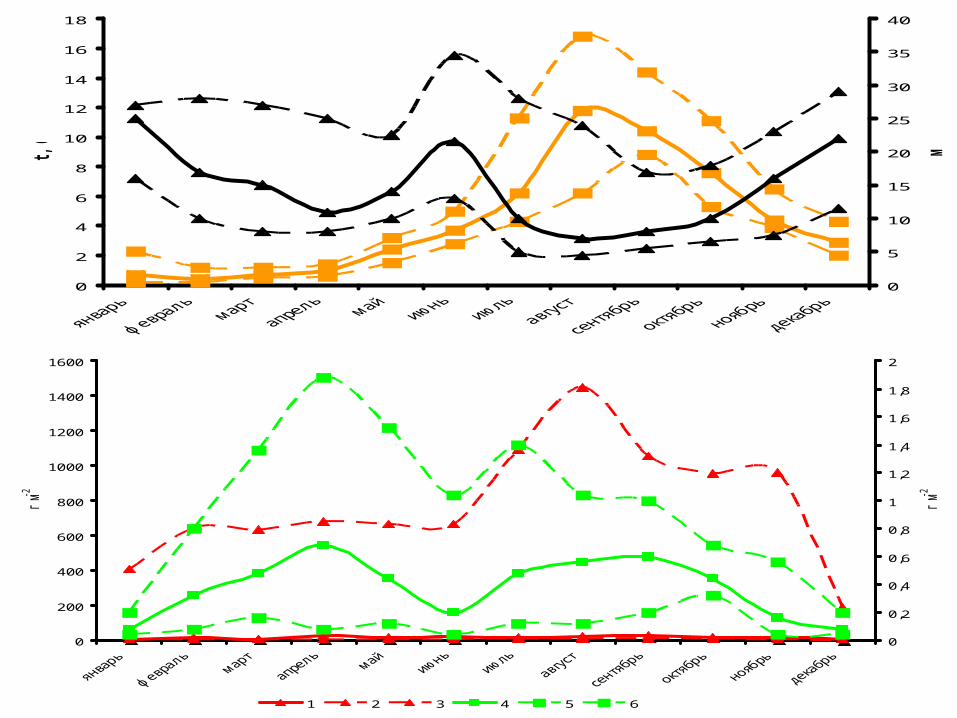
0
2
4
6
8
10
12
14
16
18
t, C
0
5
10
15
20
25
30
35
40
м
1 2 3 4 5 6
0
200
400
600
800
1000
1200
1400
1600
г м
-2
0
0,2
0,4
0,6
0,8
1
1,2
1,4
1,6
1,8
2
г м
-2
1 2 3 4 5 6

0
200
400
600
800
1000
1200
1400
1600
г м
-2
0
0,2
0,4
0,6
0,8
1
1,2
1,4
1,6
1,8
2
г м
-2
1 2 3 4 5 6
0
20
40
60
80
100
120
140
160
мг м-3
0
5
10
15
1 2 3 4 5 6

0
200
400
600
800
1000
1200
1400
1600
г м
-2
0
0,2
0,4
0,6
0,8
1
1,2
1,4
1,6
1,8
2
г м
-2
1 2 3 4 5 6
0,01
0,1
1
10
100
1000
10000
г м
-2
4 5 6 3 1 2

Long-term dynamics of plankton (1951-1999)
0,00
100,00
200,00
300,00
400,00
500,00
600,00
700,00
800,00
1951 1956 1961 1966 1971 1976 1981 1986 1992 1997
года
би
ом
асса,
мг
м-3
фитопланктон зоопланктон

Long-term dynamics of Epischura baicalensis
Epischura baicalensis
0
500
1000
1500
2000
2500
3000
3500
4000
4500
5000
10.0
2.5
5
10.0
2.5
7
10.0
2.5
9
10.0
2.6
1
10.0
2.6
3
10.0
2.6
5
10.0
2.6
7
10.0
2.6
9
10.0
2.7
1
10.0
2.7
3
10.0
2.7
5
10.0
2.7
7
10.0
2.7
9
10.0
2.8
1
10.0
2.8
3
10.0
2.8
5
10.0
2.8
7
10.0
2.8
9
10.0
2.9
1
10.0
2.9
3
10.0
2.9
5
10.0
2.9
7
10.0
2.9
9
10.0
2.0
1
10.0
2.0
3
тыс.э
кз.м-2
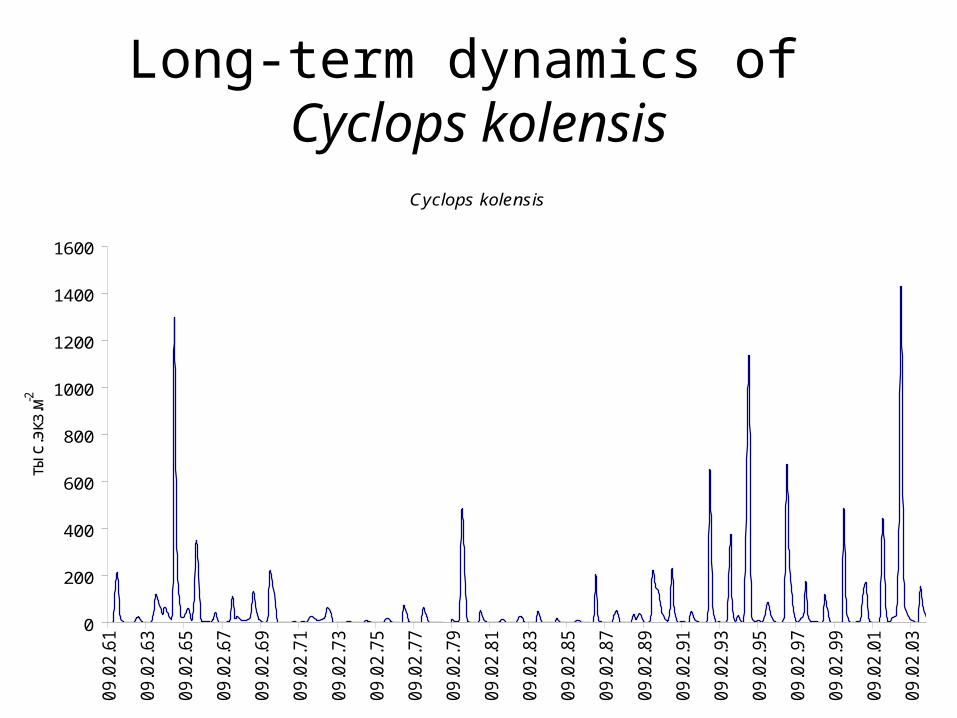
Long-term dynamics of Cyclops kolensis
Cyclops kolensis
0
200
400
600
800
1000
1200
1400
1600
09.0
2.6
1
09.0
2.6
3
09.0
2.6
5
09.0
2.6
7
09.0
2.6
9
09.0
2.7
1
09.0
2.7
3
09.0
2.7
5
09.0
2.7
7
09.0
2.7
9
09.0
2.8
1
09.0
2.8
3
09.0
2.8
5
09.0
2.8
7
09.0
2.8
9
09.0
2.9
1
09.0
2.9
3
09.0
2.9
5
09.0
2.9
7
09.0
2.9
9
09.0
2.0
1
09.0
2.0
3
тыс.
экз
.м-2

Long-term dynamics of Rotifers and Cladocera
0,00
100,00
200,00
300,00
400,00
500,00
600,00
700,00
198
1
198
2
198
3
198
4
198
5
198
6
198
7
198
8
198
9
199
0
199
1
199
2
199
3
199
4
199
5
199
6
199
7
199
8
199
9
200
0
200
1
200
2
200
3
200
4
200
5
200
6
200
7
тыс.
экз
.м-2
Cladocera Rotifera

Anthropogenic Impact

Several Stages in Economic Activity on and Around Baikal Can Be Distinguished :

The native peoples of Siberia (Mongols, Buryat, Evenki, Yakut) not influenced the lake Baikal ecosystem at all, or human pressure was minimal before arrival of Russian settlers. Before the middle of XIX century the human influence on the lake Baikal watershed was restricted to fishing, forest fires, forest cutting for fuel, building materials and for clearing pastures, land ploughing. The main negative result of it was slow increase of mineral compounds content in basin waters.
Pre-industrial stage (till the second half of XIX century).

Started with the building of railroads, industrial enterprises, ports at the lake, beginning of navigation. Human pressure gradually increases with the development of agriculture and industry, population growth in the water basin.
Early industrial stage (end of XIX – middle of XX century).

The most noticeable events during this stage were significant growth of fishery during the Second World war, building of Irkutsk Power Station dam and Baikalsk Pulp and Paper Combine (BPPC).
The stage of industrial development rate increase (middle of XX
century).

It was characterized by intensive use of mineral fertilizers, pesticides (restricted in 1980th), the river Selenga pollution, increase of passengers and cargo transportation across the lake, including log rafting, building of new enterprises (including Selenginsk Pulp and Cardboard Combine), growth of mining activity, mastering of Northern part of lake and its basin, building of Baikal-Amur Railroad, explosive increase of population in the basin, beginning of mass tourism.
The intensification of economic activity in the basin (1970th –
1990th).

There were, from one hand, decrease of both industrial and agricultural production, causing decrease of pollution, from the another hand, common weakening of environmental quality control and general chaos caused by the simultaneous rampancy of “democracy” (more exact – criminal power together with ochlocracy) and gangsterism during the 1990th in the Lake Baikal basin.
The newest stage.

The last two give rise to predatory exploitation of basin resources and significant pressure on the environment. There is explosive development of wild tourism, building boom in the region and along the coasts of the lake.

As the reaction to these processes we can point the strengthening of law protection of the lake and its basin, inclusion of the lake into the list of UNESCO World Heritage sites.
During the 2000th with the restraint of, at least, gangsterism (unfortunately – not “democracy”), ecological situation became more stable, though it is evident, we are far from the cardinal solution of the problem of the lake Baikal basin nature conservation.

Water level of Baikal
455
455,2
455,4
455,6
455,8
456
456,2
456,4
456,6
456,8
457
1900
1906
1912
1918
1924
1930
1936
1942
1948
1954
1960
1966
1972
1978
1984
1990
1996
2002
2008

• 600 km2 of shoreline was flooded,
• 1200 km2 are flooded periodically.
• 500 103 t per year of materials are coming into lake.

The main sources of the lake pollution

Navigation
• 100 years ago there were 15 ships• Now – more than 300 ships and 8000
boats• Due to navigation (per year): • > 250 t of oil products, • 30 t of fecal organics, • 8 t of soluble N and 3 t P,• 2,5 103 t of garbage.

Tourists
• 1.5–2.0 mln tourists per year
• They produce:
• 780 103 t of wastes,
• 6 103 t dry fecal mass,
• N – 1.5 103 t
• P – 0.3 103 t.

Baikalian Pulp and Paper Combine (BPPC)
• For 42 year discharged from 34 to 69 106 t year-1,
• Average – 46,5 106 t year-1,
• In 2005–2008: 29 – 44 106 t year-1,

Watershed Basin
• There are 1 300 000 people,
• 1 860 000 caws, • 1 348 000 horses, • 1 164 000 sheep and• 232 000 goats.
• They produce 500 103 t of dry fecal matter,
• N – 125 103 t, • P – 25 103 t.

Watershed Basin
There are 9 103 km2 of agricultural soils.
Every year
N - 118 103 t,
P - 39 103 t,
K - 79 103 t
are extracted from soil to water and transported to lake Baikal.
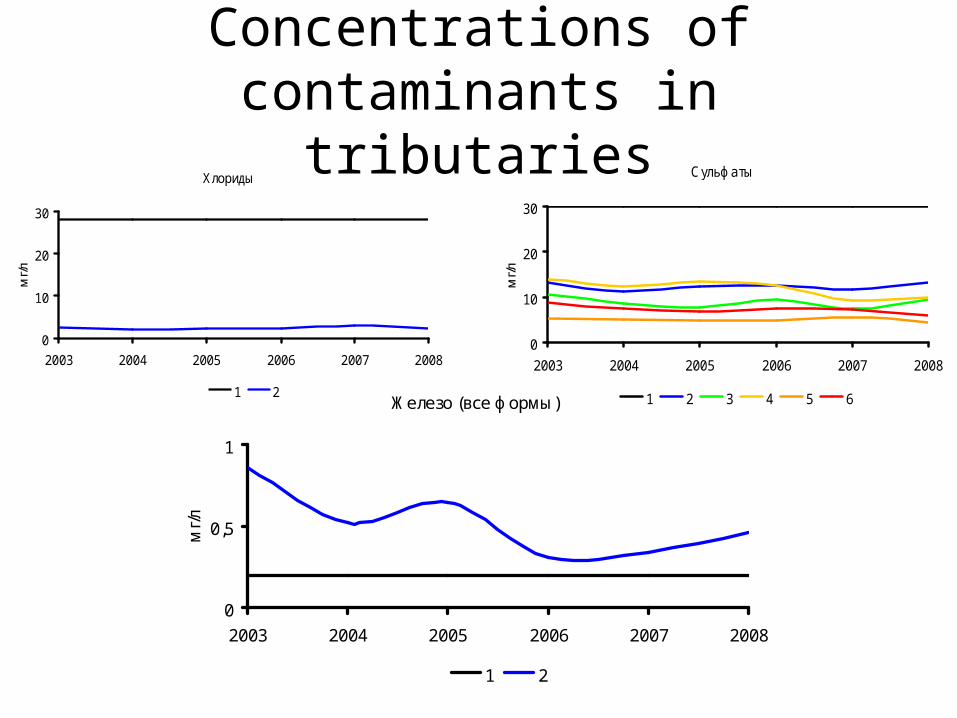
Concentrations of contaminants in tributaries
Хлориды
0
10
20
30
2003 2004 2005 2006 2007 2008
мг/
л
1 2
Сульфаты
0
10
20
30
2003 2004 2005 2006 2007 2008
мг/
л
1 2 3 4 5 6Железо (все формы)
0
0,5
1
2003 2004 2005 2006 2007 2008
мг/
л
1 2

Concentrations of toxicants in tributaries
СПАВ
0,005
0,015
2003 2004 2005 2006 2007 2008
мг/л
1 2 3 4 5 6
Медь
0
0,003
0,006
2003 2004 2005 2006 2007 2008
мг/л
1 2 3 4 5 6
Нефтепродукты
0
0,05
0,1
2003 2004 2005 2006 2007 2008
мг/л
1 2 3 4 5 6
Фенольные соединения
0
0,0025
0,005
2003 2004 2005 2006 2007 2008
мг/л
1 2 3 4 5 6

Concentrations of contaminants in tributaries
Взвешенные вещества
0
10
20
30
40
2003 2004 2005 2006 2007 2008
мг/л
1 2 3 4 5 6
Легкоокисляемое органическое вещество (по БПК5)
0
1
2
3
2003 2004 2005 2006 2007 2008
мг
О2 /
л
2 3 4 5 6
Трудноокисляемое органическое вещество (по ХПК)
05
101520253035
2003 2004 2005 2006 2007 2008
мгО
2 /л
1 2 3 4 5 6

Concentrations of nutrients in tributaries
Аммонийный азот
0
0,05
0,1
0,15
2003 2004 2005 2006 2007 2008
мг/л
2 3 4 5 6
Нитритный азот
0
0,03
0,06
2003 2004 2005 2006 2007 2008
мг/л
1 2 3 4 5 6
Нитратный азот
0
0,05
0,1
2003 2004 2005 2006 2007 2008
мг/л
2 3 4 5 6
Минеральный фосфор
0
0,005
0,01
2003 2004 2005 2006 2007 2008
мг/л
2

• Another major source of pollution for the lake is transport of contaminants with air masses

• During winter this giant water body has higher temperature (3-4 oC) comparing with the temperature of surrounding territories (from –15 to –50 oC).
• It produces the constant vertical flow of the air above the lake up to higher layers of atmosphere.
• The place of uplifted air mass becomes occupied by new masses, which in their turn repeat this manoeuvre.
• Particles of dust carried by water masses can not turn up and precipitate at the surface of the lake.

Per year:
• 45-50 kg km-2 Fe,
• 25-30 kg km-2 Al,
• 1-1,5 kg km-2 Pb,
• Up to 100 g km-2 Hg,
• Up to 50 g km-2 U .


Минеральный азот
0,00
0,50
1,00
1,50
1999 2000 2001 2002 2003 2004 2005 2006 2007 2008
т км
-2 г
од-1
1 2 3 4
Органические вещества
0,00
10,00
20,00
30,00
1999 2000 2001 2002 2003 2004 2005 2006 2007 2008
т км
-2 г
од-1
1 2 3 4
Сульфаты
0,00
5,00
10,00
15,00
1999 2000 2001 2002 2003 2004 2005 2006 2007 2008
т км
-2 г
од-1
1 2 3 4
Труднорастворимые вещества
0,00
25,00
50,00
75,00
1999 2000 2001 2002 2003 2004 2005 2006 2007 2008
т км
-2 г
од-1
1 2 3 4
Сумма минеральных веществ
0,00
30,00
60,00
1999 2000 2001 2002 2003 2004 2005 2006 2007 2008
т км
-2 г
од-1
1 2 3 4
Суммарные выпадения
0,00
50,00
100,00
1999 2000 2001 2002 2003 2004 2005 2006 2007 2008
т км
-2 г
од-1
1 2 3 4

Income of toxicants from various sources 1 – BPPC, 2 – navigation, 3 – tourism, 4 - towns, 5 - tributaries, 6 –
atmospheric precipitations
Тяжелые металлы 4
5
6
Фенольные соединения 1
4
5
6
Нефтепродукты 123456
СПАВ 3
4
5

Income of nutrients from various sources 1 – BPPC, 2 – navigation, 3 – tourism, 4 - towns, 5 - tributaries, 6 –
atmospheric precipitations
Минеральный азот 2
3
4
5
6
Минеральный фосфор 2
3
4
5
6
Легкоразложимые органические вещества 1
2
3
4
5

Income of contaminants from various sources 1 – BPPC, 2 – navigation, 3 – tourism, 4 - towns, 5 - tributaries, 6 –
atmospheric precipitations
Серосодержащие органические вещества1
5
Сульфаты 1
4
5
6
Трудноразложимые органические вещества1
5

Income of pollutants from various sources 1 – BPPC, 2 – navigation, 3 – tourism, 4 - towns, 5 - tributaries, 6 –
atmospheric precipitations
Минерализация 1
4
5
6
Органические вещества 1
3
4
5
6
Взвешенные вещества 123456
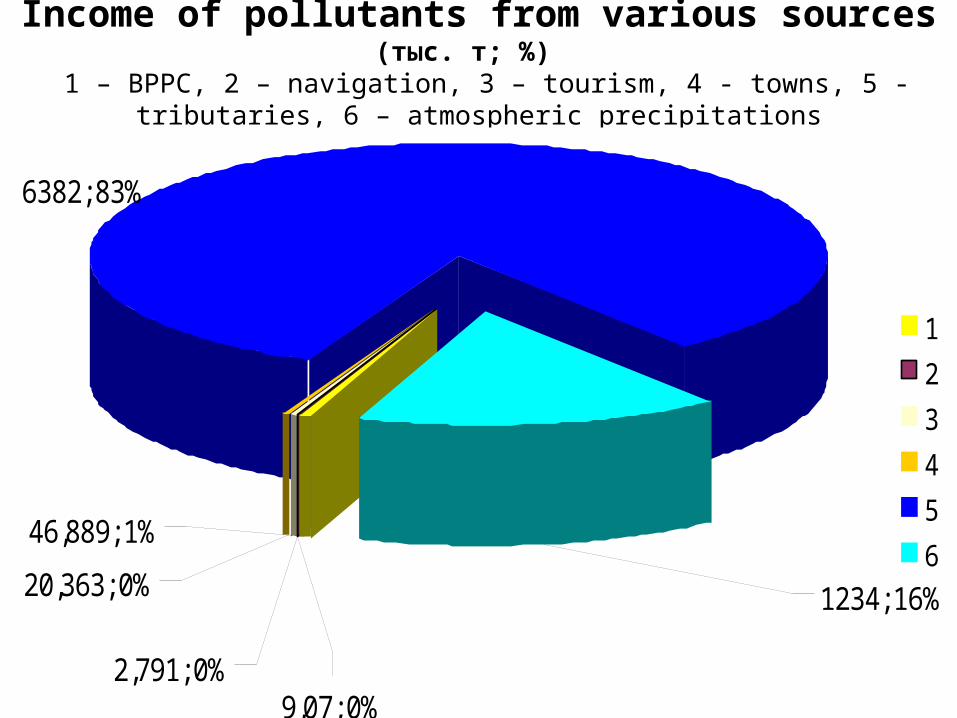
Income of pollutants from various sources (тыс. т; %) 1 – BPPC, 2 – navigation, 3 – tourism, 4 - towns, 5 - tributaries, 6 –
atmospheric precipitations
46,889; 1%
2,791; 0%
20,363; 0%
9,07; 0%
1234; 16%
6382; 83%
1
2
3
4
5
6
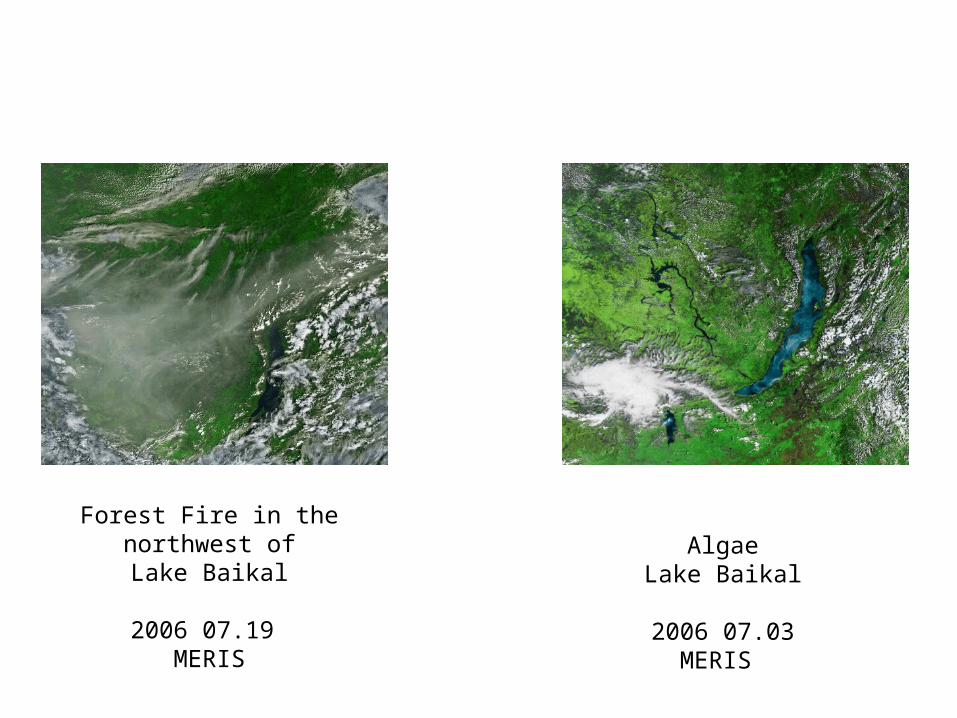
Forest Fire in thenorthwest ofLake Baikal
2006 07.19 MERIS
AlgaeLake Baikal
2006 07.03
MERIS

• Nevertheless, the Lake Baikal remains the largest reservoir and producer of the most clean and fresh drinking water on Earth, containing more than 50% of available liquid fresh drinking water.