General Outline: 1 – Species & Speciation the Modern
50
General Outline: 1 – Species & Speciation the Modern Synthesis & Now 2 – Reality of Species 3 – Biodiversity – How Many Species? 4 – Species Definitions/Concepts 5 – Speciation (short version) 6 – Species Delimitation 7 – Multi-species Phylogeography 8 – Conserving Evolutionary Processes
Transcript of General Outline: 1 – Species & Speciation the Modern

General Outline:
1 – Species & Speciation the Modern Synthesis & Now
2 – Reality of Species
3 – Biodiversity – How Many Species?
4 – Species Definitions/Concepts
5 – Speciation (short version)
6 – Species Delimitation
7 – Multi-species Phylogeography
8 – Conserving EvolutionaryProcesses

Explicit treeExplicit tree--based methods; are based methods; are sequence data the answer?sequence data the answer?
• Probably not...– Gene tree - species tree incongruence– Paraphyletic nature of speciation pattern
and process– What is the contextual framework?
Step 1. Catch the LizardStep 2. Extract DNAStep 3. Sequence DNA
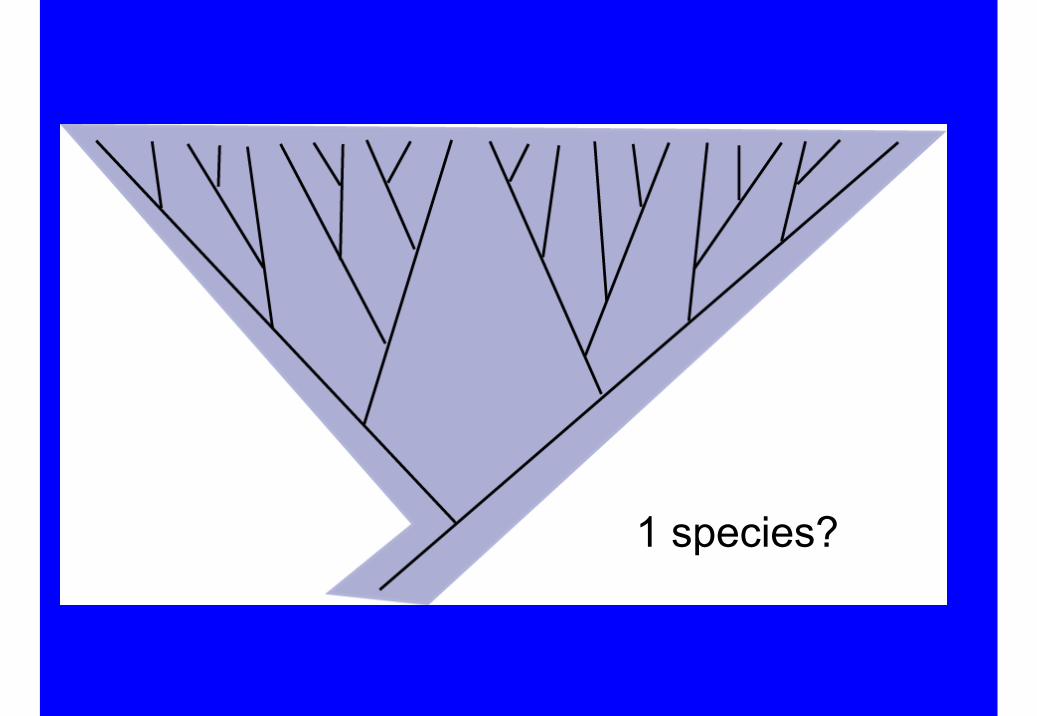
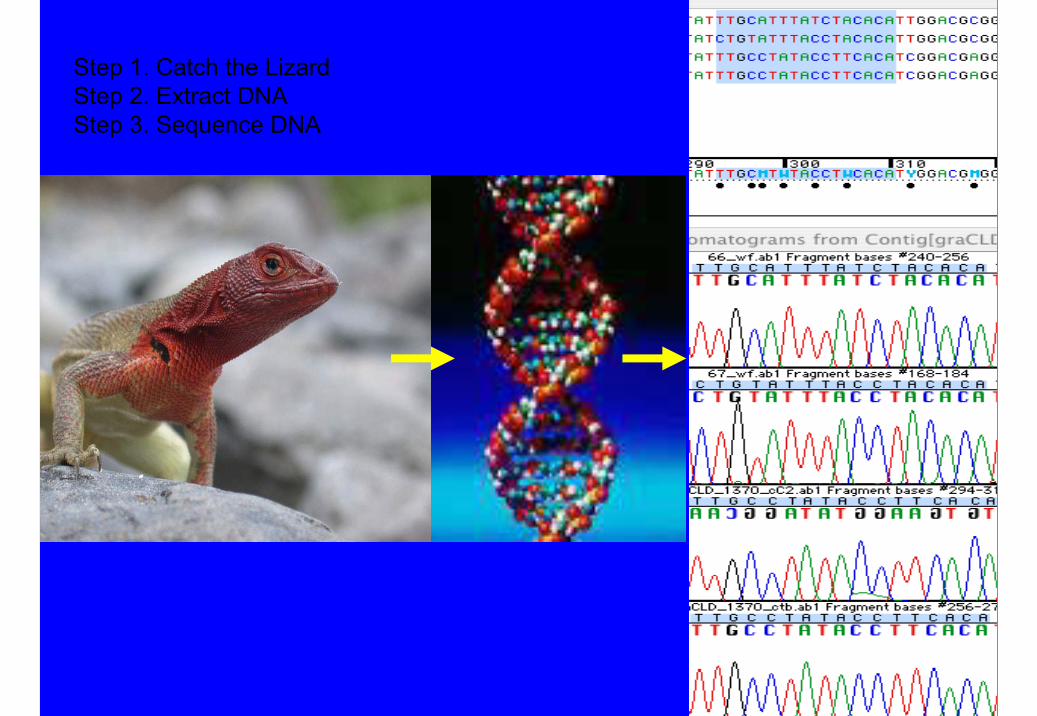
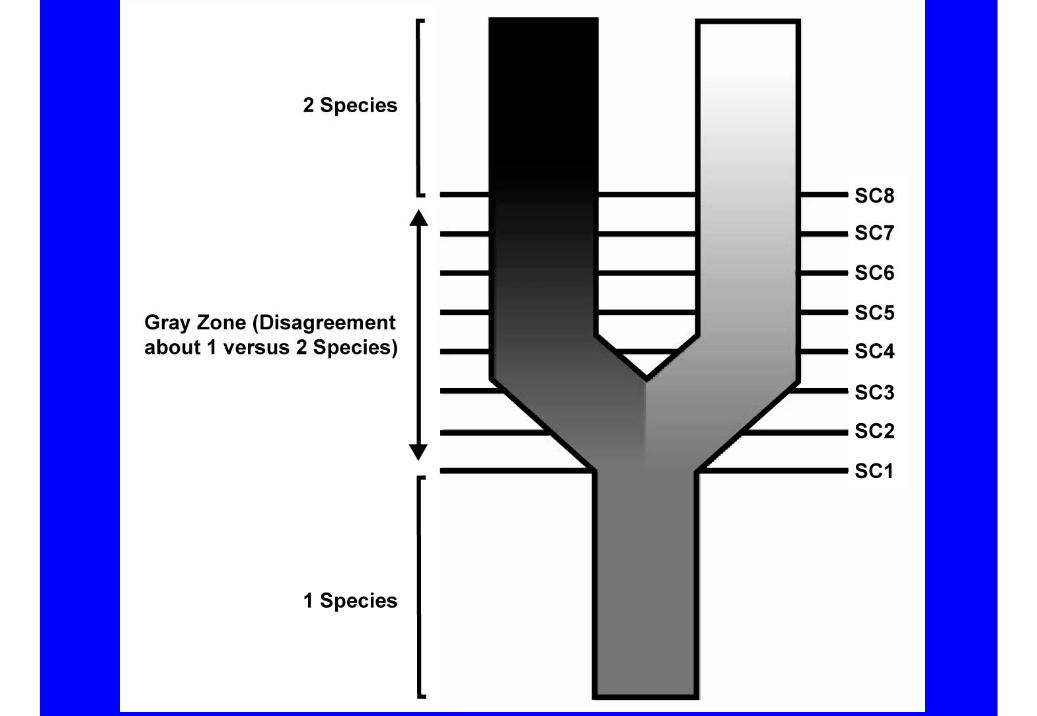
1 species?
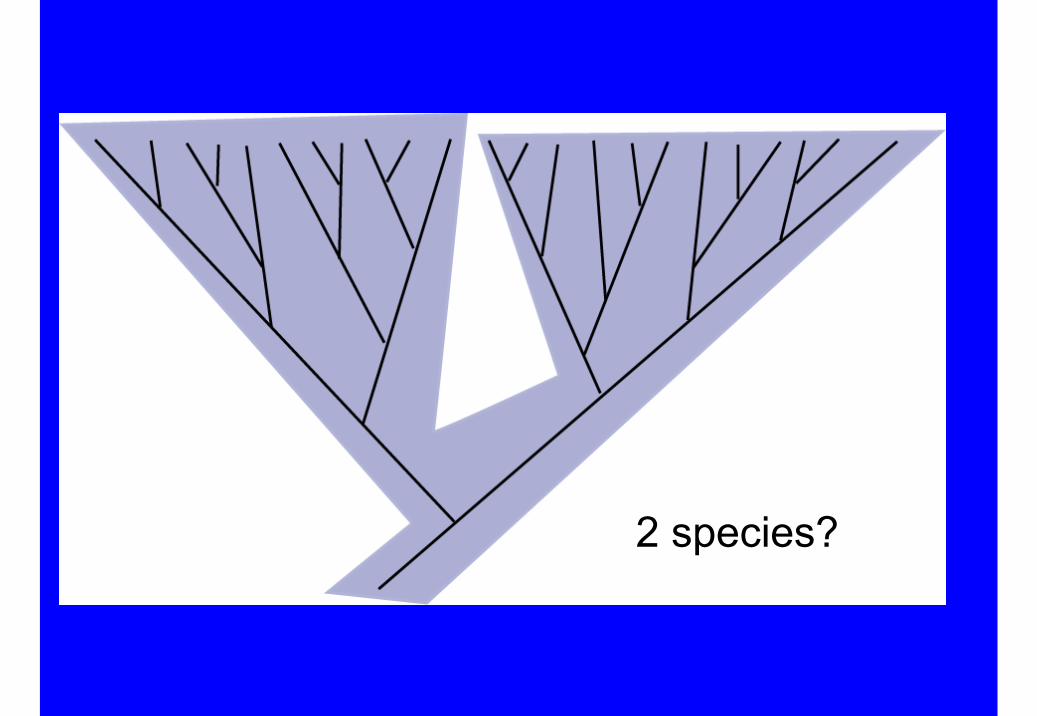
2 species?

4 species?
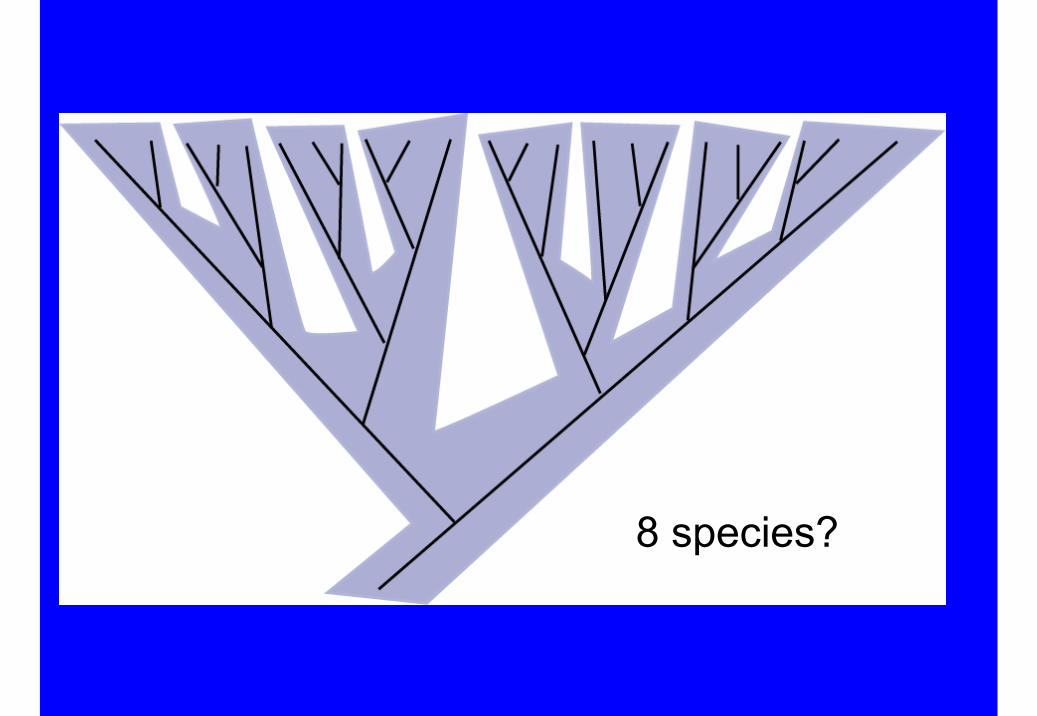
8 species?

16 species?
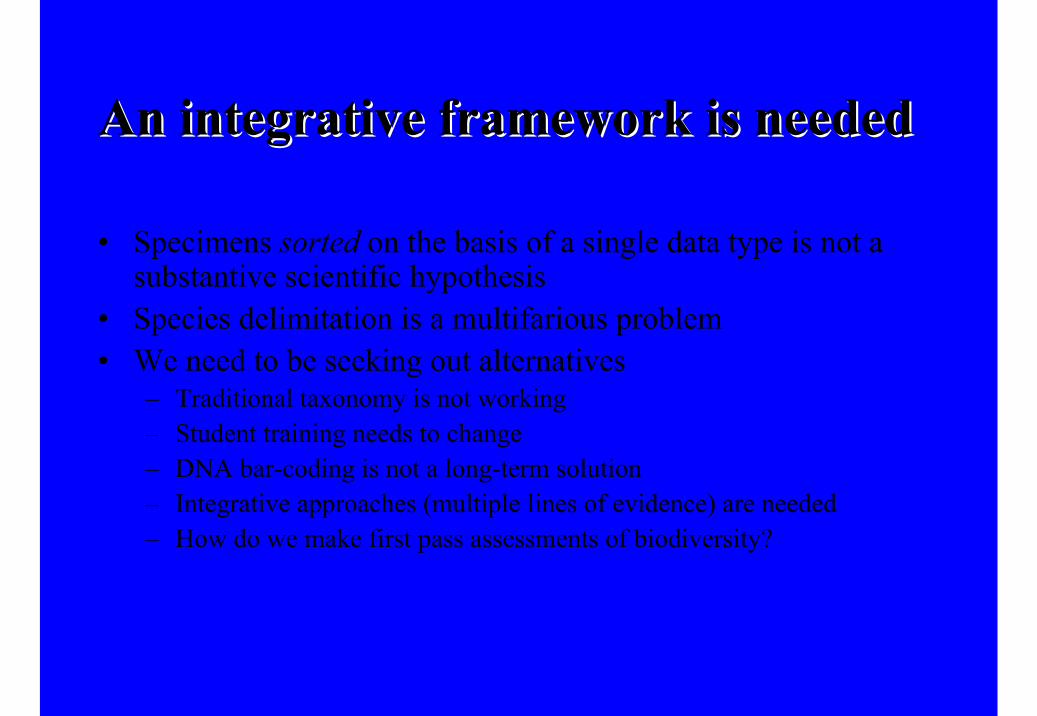
An integrative framework is neededAn integrative framework is needed
• Specimens sorted on the basis of a single data type is not a substantive scientific hypothesis
• Species delimitation is a multifarious problem• We need to be seeking out alternatives
– Traditional taxonomy is not working– Student training needs to change – DNA bar-coding is not a long-term solution– Integrative approaches (multiple lines of evidence) are needed– How do we make first pass assessments of biodiversity?

Some Tree-based Methods:
- Geographical concordance (Wiens & Penkrot, 2002)
- Genealogical exclusivity (Baum & Shaw 1995)
- Independent Networks (Cardoso & Vogler 1995)
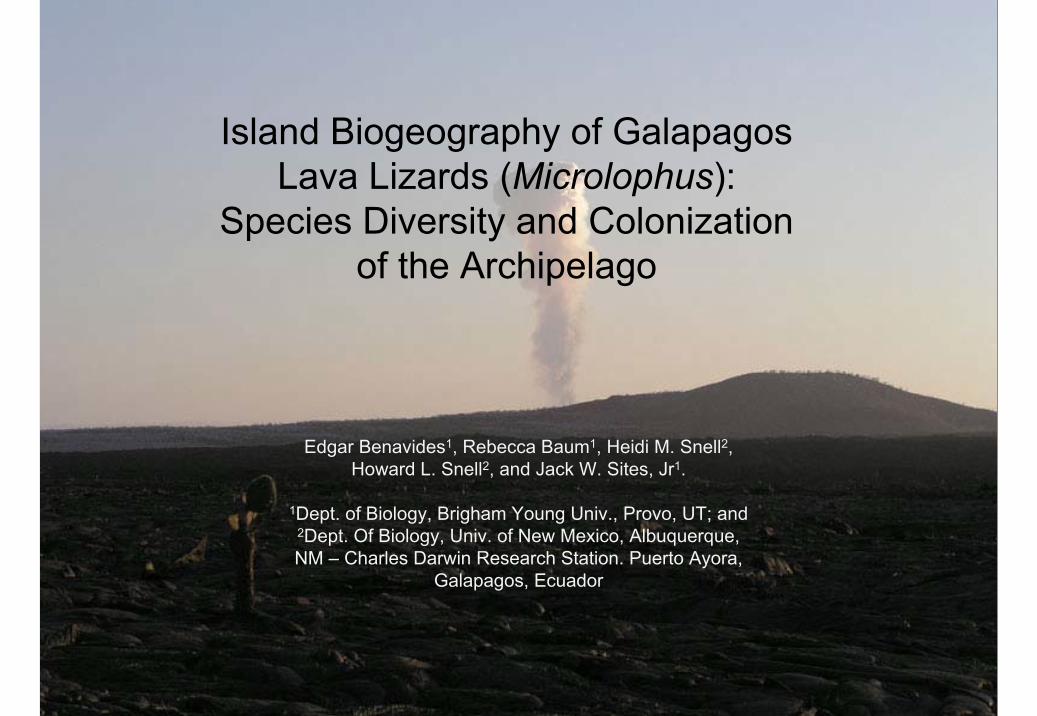
Edgar Benavides1, Rebecca Baum1, Heidi M. Snell2, Howard L. Snell2, and Jack W. Sites, Jr1.
1Dept. of Biology, Brigham Young Univ., Provo, UT; and 2Dept. Of Biology, Univ. of New Mexico, Albuquerque, NM – Charles Darwin Research Station. Puerto Ayora,
Galapagos, Ecuador
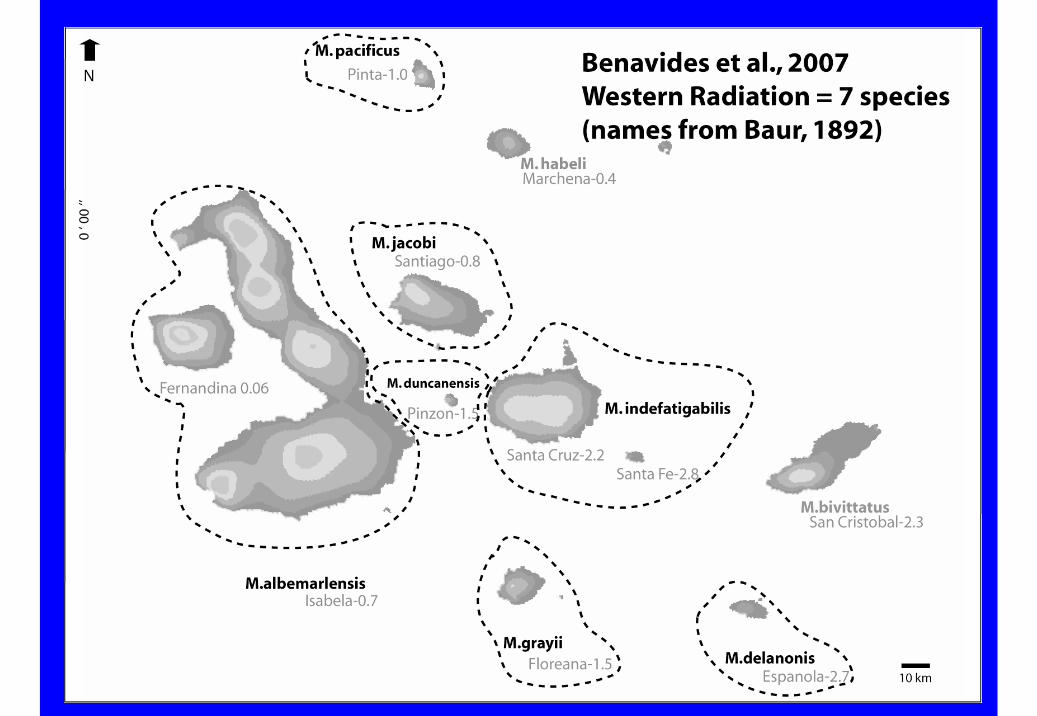
Island Biogeography of Galapagos Lava Lizards (Microlophus):
Species Diversity and Colonization of the Archipelago

Introduction0.5 Myr 3.5 Myr1.5 Myr 2.5 Myr
Fernandina
Isabela
Santiago
Santa Cruz
Floreana Espanola
Pinta
Duncan
San Cristobal
Marchena
Santa Fe

Why study LAVA LIZARDS (Microlophus)?
2 colonizations from S.A.
inhabit almost all islands
single species per island
no recorded extinctions
should retain “signature” of evolutionary history that can be reconstructed withgenetic markers
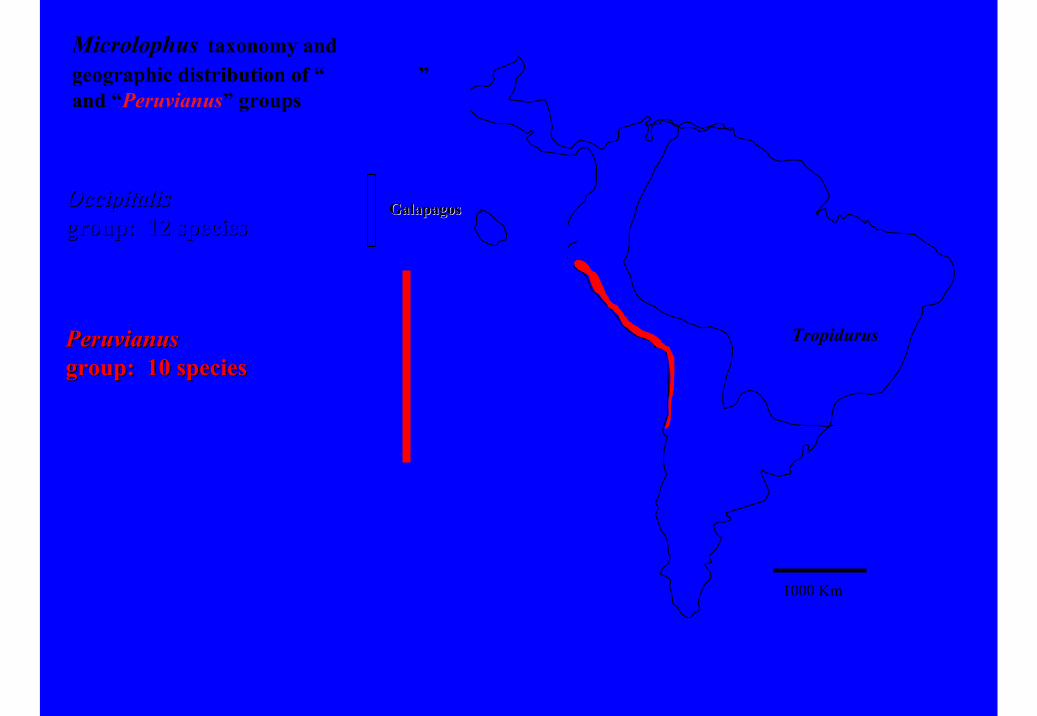
Tropidurus
1000 Km
OccipitalisOccipitalisgroup: 12 speciesgroup: 12 species
GalapagosGalapagos
Microlophus taxonomy andgeographic distribution of “Occipitalis”and “Peruvianus” groups
PeruvianusPeruvianusgroup: 10 speciesgroup: 10 species

Multigenephylogeny[Benavides et al. 2007. Syst.Biol. 56:776-797]
Phylogeny
Mainla nd
Mi crol oph us
M. occipitalisJEQM. occipitalisSRMM. occipitalisK777NM. occipitalisTAL
Eastern Galapagos
Eastern Galapagos 2 Islands + Northern Peru Microlophus occipitalis
Western G
alapagosWestern Galapagos Microlophus + probably extinct mainland taxon
= 1.0 PP, 100 BV

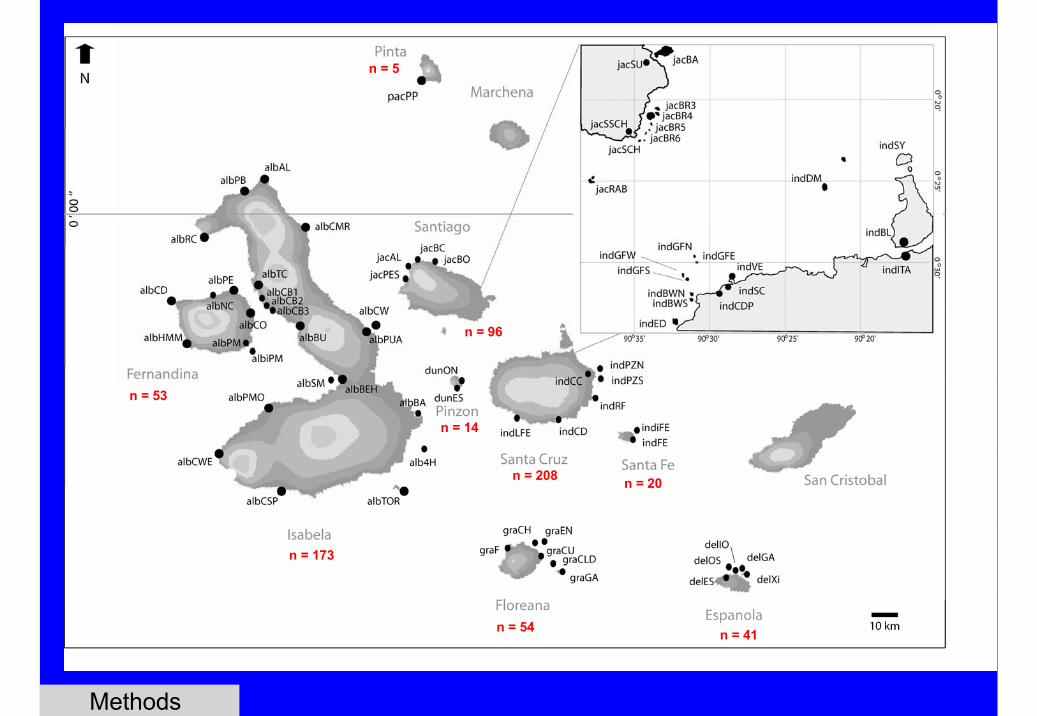
Methods
n = 96
n = 5
n = 53
n = 173
n = 208
n = 54
n = 20
n = 41
n = 14


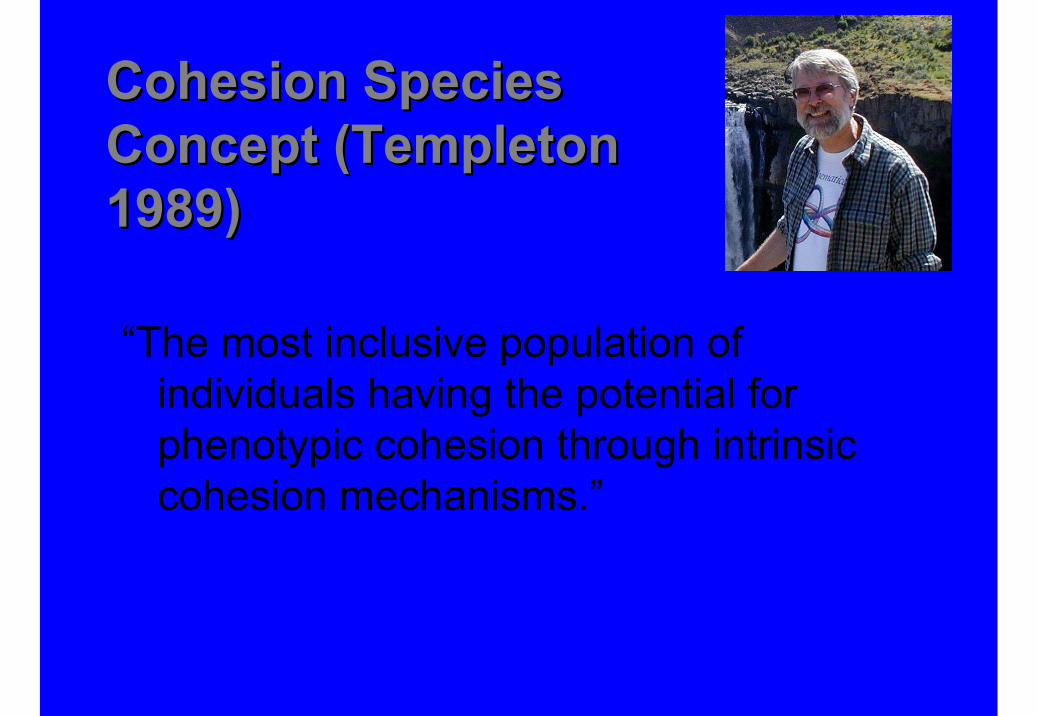
Cohesion Species Cohesion Species Concept (Templeton Concept (Templeton 1989)1989)
“The most inclusive population of individuals having the potential for phenotypic cohesion through intrinsic cohesion mechanisms.”
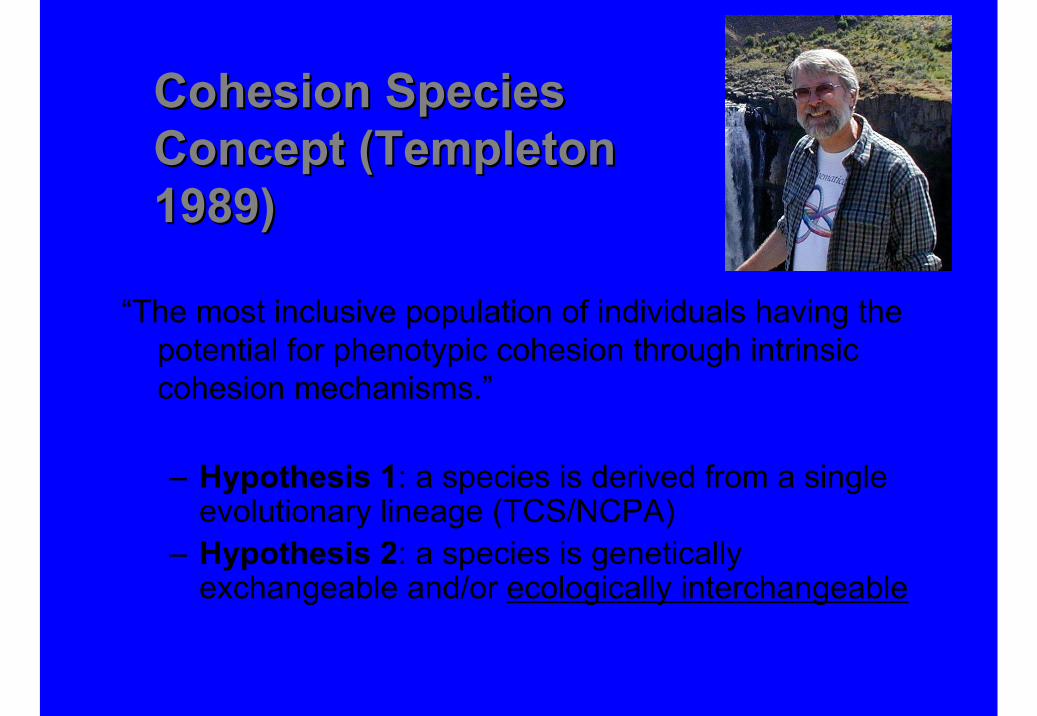
Cohesion Species Cohesion Species Concept (Templeton Concept (Templeton 1989)1989)
“The most inclusive population of individuals having the potential for phenotypic cohesion through intrinsic cohesion mechanisms.”
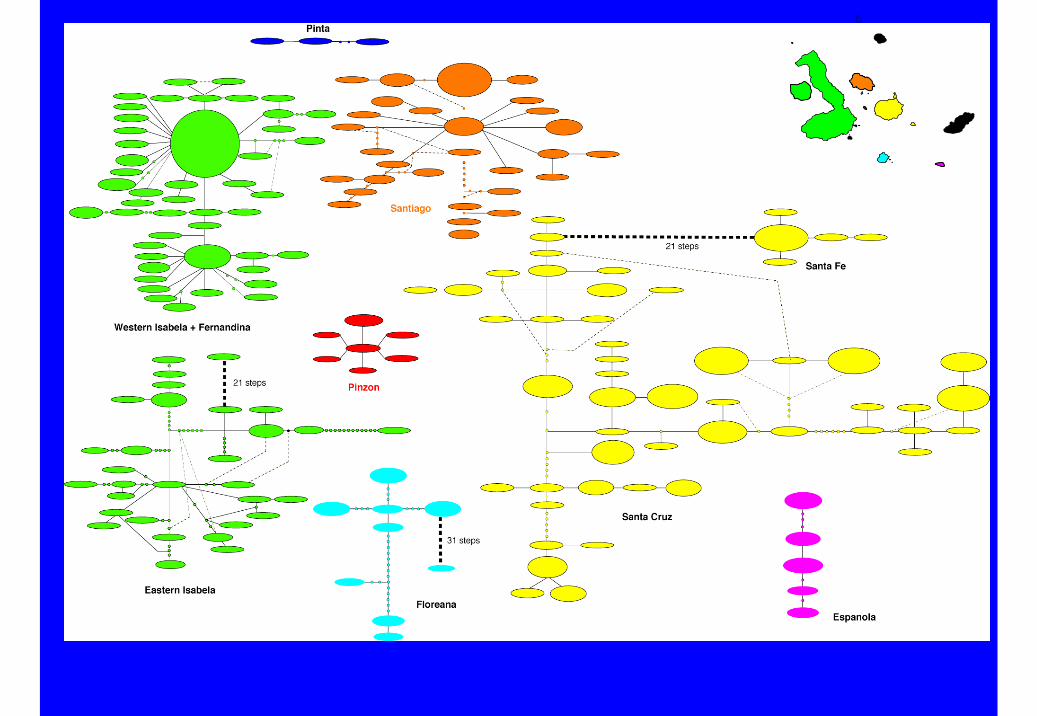
– Hypothesis 1: a species is derived from a single evolutionary lineage (TCS/NCPA)
– Hypothesis 2: a species is genetically exchangeable and/or ecologically interchangeable
Rader et. al. 2005Rader et. al. 2005
• What is ecological exchangeability?• traits related to growth, size, fecundity, mortality
• How can it be tested? • Reciprocal transplant experiments• Common environment experiments• Both needed to distinguish between phenotypic plasticity and
local adaptation
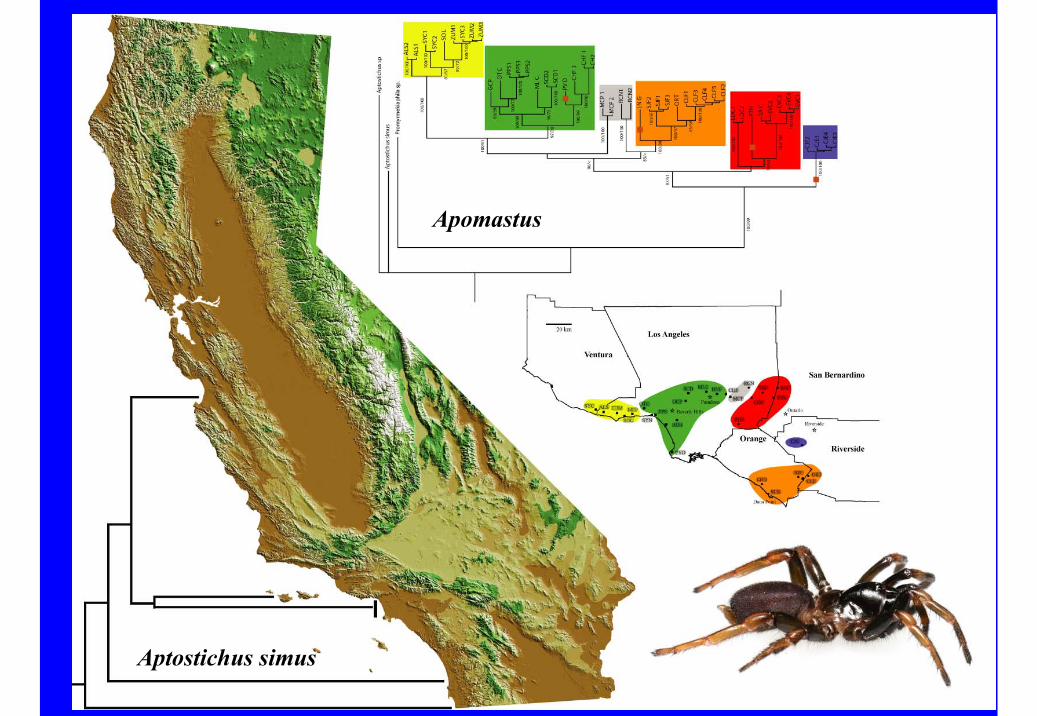
ApomastusApomastus
Aptostichus simusAptostichus simus

Species delimitation problemsSpecies delimitation problems
• These taxa represent one end of the spectrum– Extreme geographic structuring - every sampling locality is
genetically unique– High levels of divergence (e.g., intra:10 - 14%; inter 14 - 24%)– Analytically problematic - geographical concordance - NCA, etc.
(Hedin & Wood 2002)– Phylogeographic breaks stochastic (Irwin 2002, Kuo and Avise
2005)– Species boundaries become highly arbitrary - no objective means
for basal delineation– Lack requisite characteristics often used - cryptic species problem
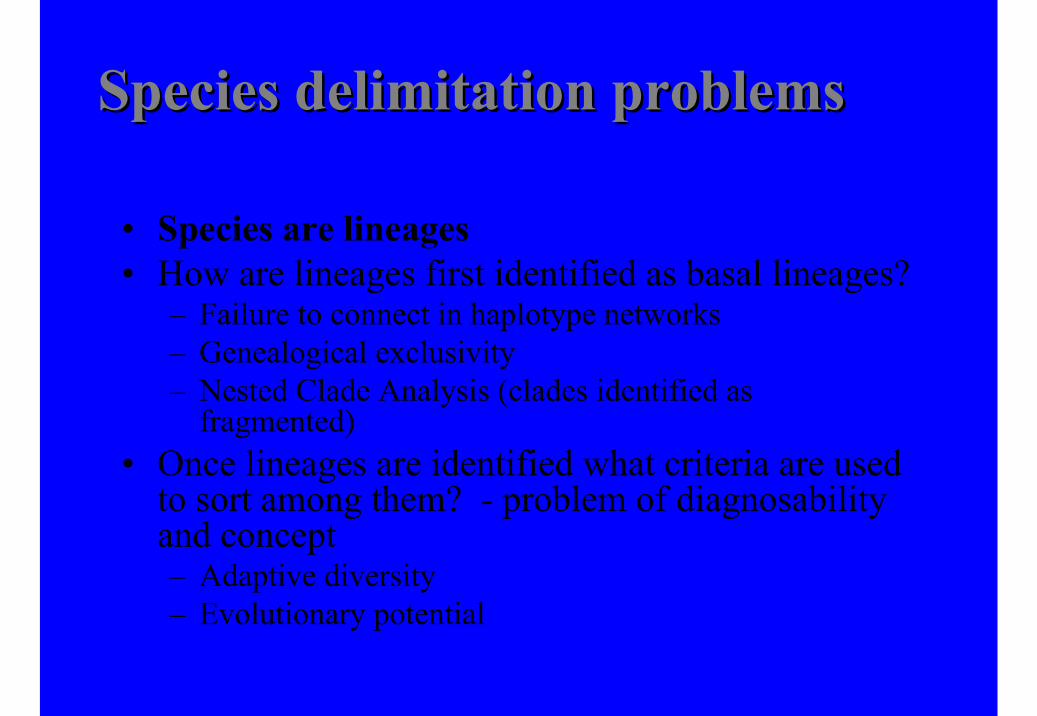
Species delimitation problemsSpecies delimitation problems
• Species are lineages• How are lineages first identified as basal lineages?
– Failure to connect in haplotype networks– Genealogical exclusivity– Nested Clade Analysis (clades identified as
fragmented)• Once lineages are identified what criteria are used
to sort among them? - problem of diagnosability and concept– Adaptive diversity– Evolutionary potential
Niche-Based Distribution Modeling
• species distributions (Rotenberry et al. 2006)• new species (Raxworthy et al. 2003)• speciation mechanisms (Graham et al. 2004)• historical patterns of species richness (Graham et al. 2006)• areas for new sampling (Stockman et al. 2006)• extinction patterns (Bond et al. 2006)• future range shifts due to climate change (Iverson et al. 1999)• areas susceptible to invasive species (Underwood et al. 2004)• areas susceptible to disease transmission (Costa et al. 2002)

Spider not to scale
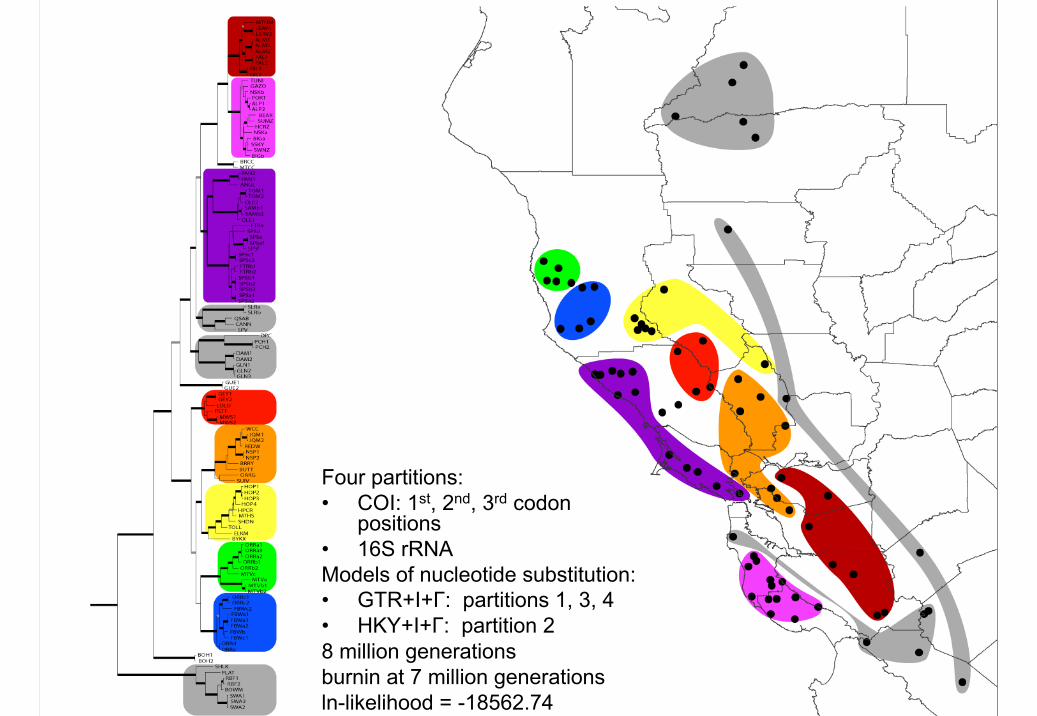
Four partitions:• COI: 1st, 2nd, 3rd codon
positions• 16S rRNAModels of nucleotide substitution:• GTR+I+Γ: partitions 1, 3, 4• HKY+I+Γ: partition 28 million generationsburnin at 7 million generationsln-likelihood = -18562.74

GeneticExchangeability
EcologicalInterchangeabilityNO
YES
Stop -1 species
NO2 methods
YES
Stop -1 species
Stop -MultipleSpecies
Stop -1 species
NO1 method

MaxEnt• Phillips et al. 2006• maximum entropy• environmental parameters:
– elevation– annual precipitation– precipitation driest month– precipitation wettest month– max T warmest month– min T coldest month– mean monthly T range– Central Valley– temperature seasonality– precipitation seasonality
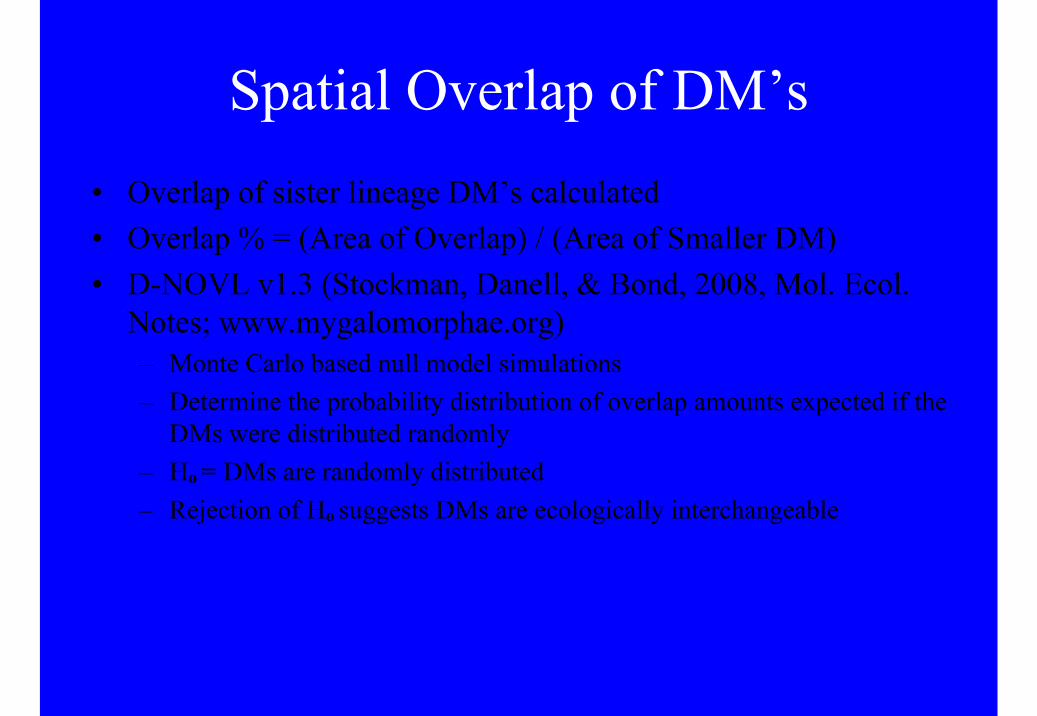
Spatial Overlap of DM’s• Overlap of sister lineage DM’s calculated• Overlap % = (Area of Overlap) / (Area of Smaller DM)• D-NOVL v1.3 (Stockman, Danell, & Bond, 2008, Mol. Ecol.
Notes; www.mygalomorphae.org)– Monte Carlo based null model simulations– Determine the probability distribution of overlap amounts expected if the
DMs were distributed randomly– Ho = DMs are randomly distributed– Rejection of Ho suggests DMs are ecologically interchangeable

Rotated Component MatrixComponent
1 2
Annual precipitation 0.959 -0.060
Precipitation of wettest quarter 0.939 -0.036
Precipitation of driest quarter 0.937 -0.082
Precipitation of coldest quarter 0.932 -0.030
Precipitation of warmest quarter 0.914 -0.080
Precipitation of wettest month 0.904 -0.036
Annual mean temperature -0.887 0.348
Precipitation of driest month 0.837 -0.188
Temperature annual range -0.311 0.945
Mean monthly temperature range -0.172 0.938
Minimum temperature of coldest month -0.206 -0.935
Temperature seasonality -0.406 0.909
Mean temperature of wettest quarter -0.363 -0.895
Maximum temperature of warmest month -0.458 0.880
Mean temperature of coldest quarter -0.473 -0.834
Mean temperature of driest quarter -0.630 0.760
Isothermality 0.540 -0.736
Mean temperature of warmest quarter -0.664 0.730
Total Variance Explained
Component
Rotation Sums of Squared Loadings
Total % of VarianceCumulative
%
1 8.715 48.418 48.418
2 7.570 42.057 90.475
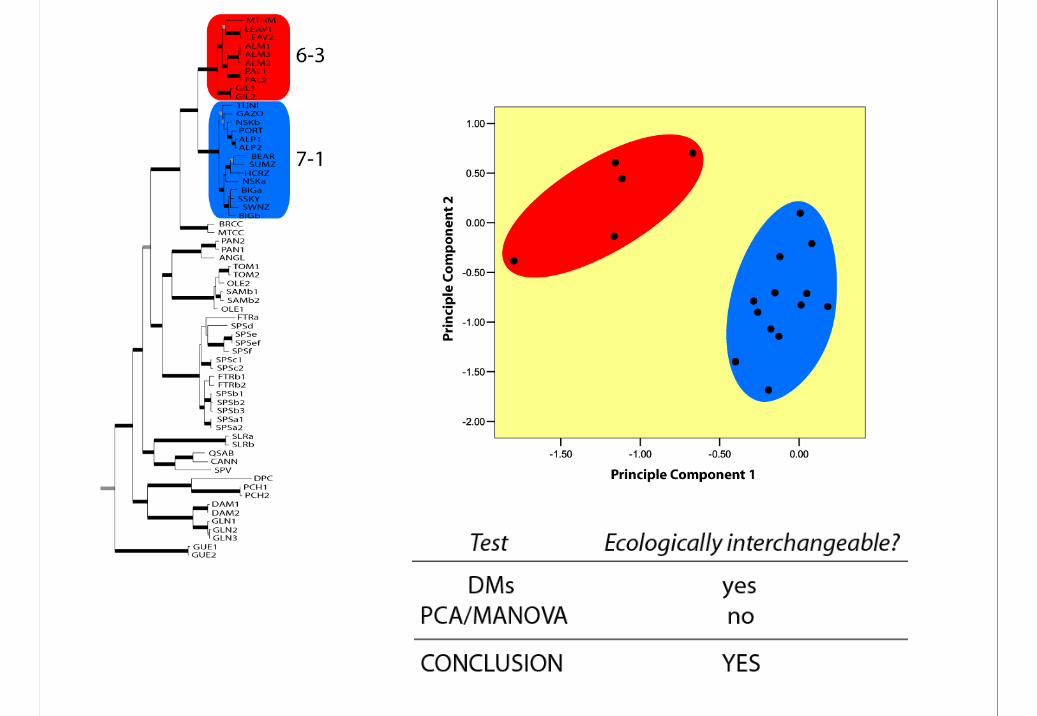
Principle Components Analysis & MANOVA(sensu Graham et al. 2004)
• PCA
• MANOVA– test for significant difference of PC
scores– clade = fixed factor– PCs = dependent variables– equality of covariance matrices -
Box’s M– overall F statistic


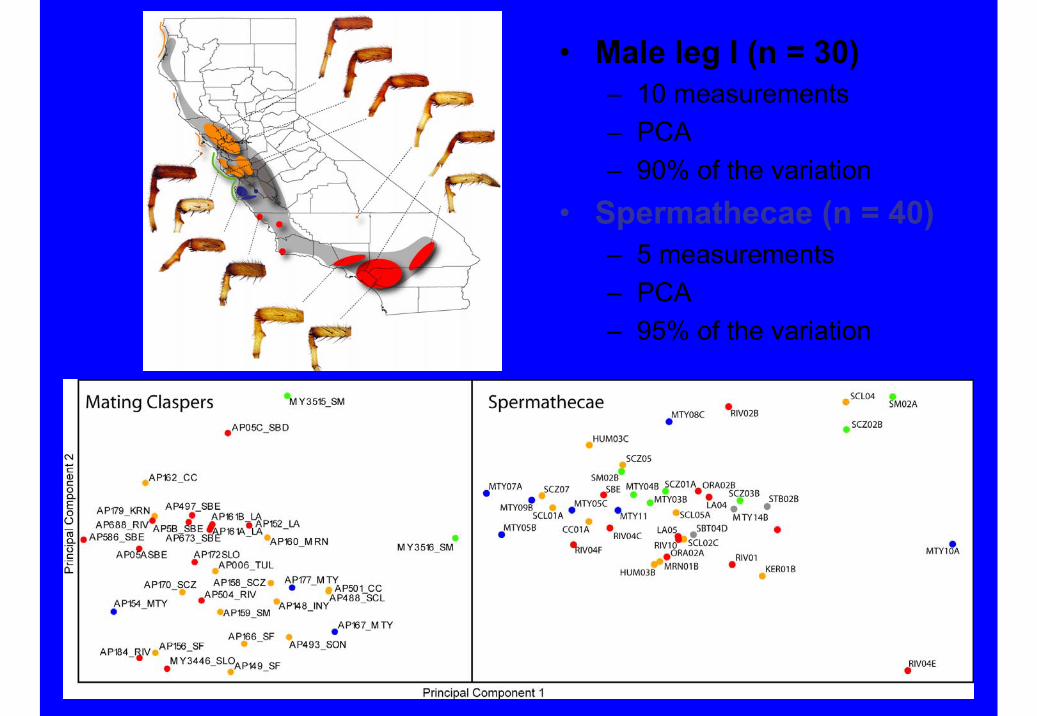
• Male leg I (n = 30)– 10 measurements– PCA– 90% of the variation
• Spermathecae (n = 40)– 5 measurements– PCA– 95% of the variation
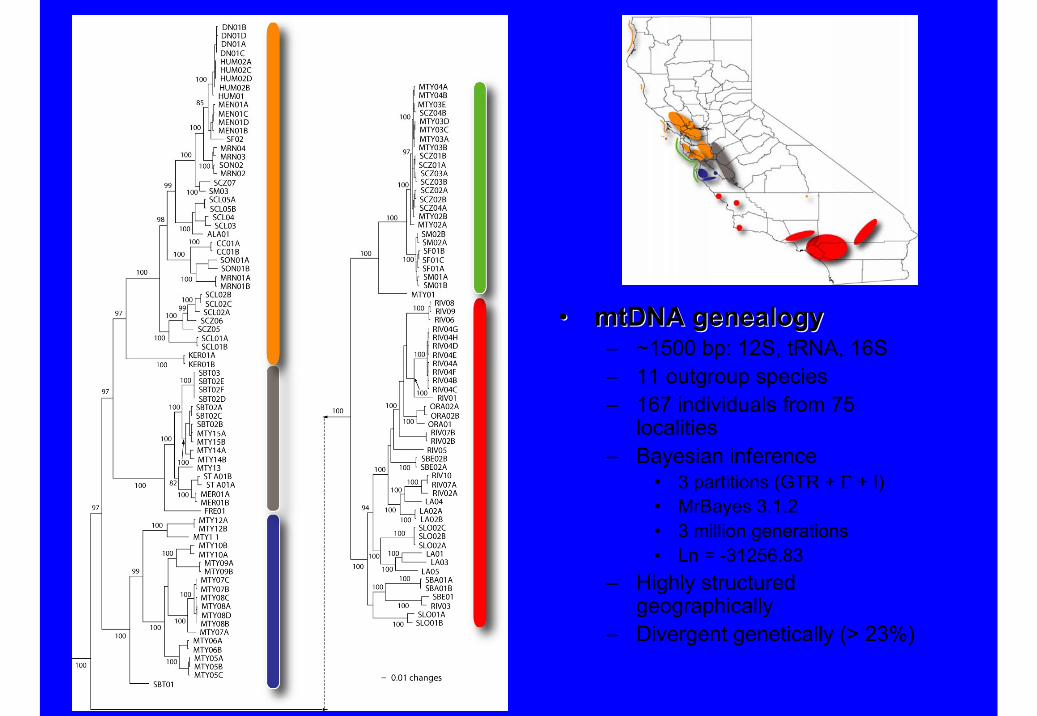
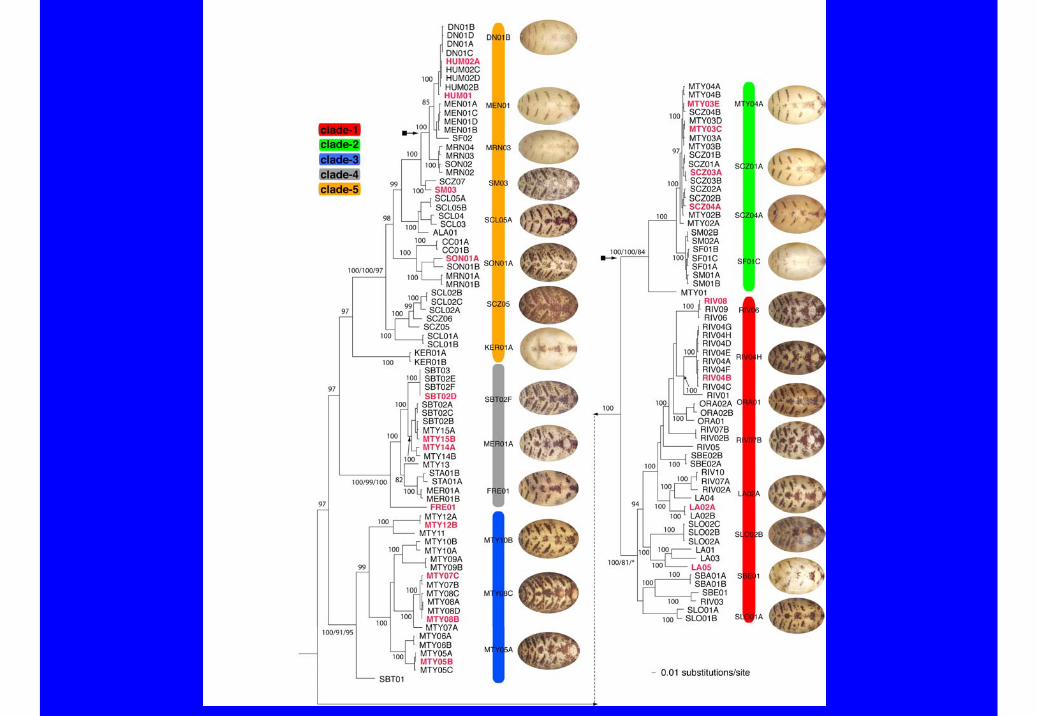
•• mtDNAmtDNA genealogygenealogy– ~1500 bp: 12S, tRNA, 16S– 11 outgroup species– 167 individuals from 75
localities– Bayesian inference
• 3 partitions (GTR + Γ + I)• MrBayes 3.1.2• 3 million generations• Ln = -31256.83
– Highly structured geographically
– Divergent genetically (> 23%)


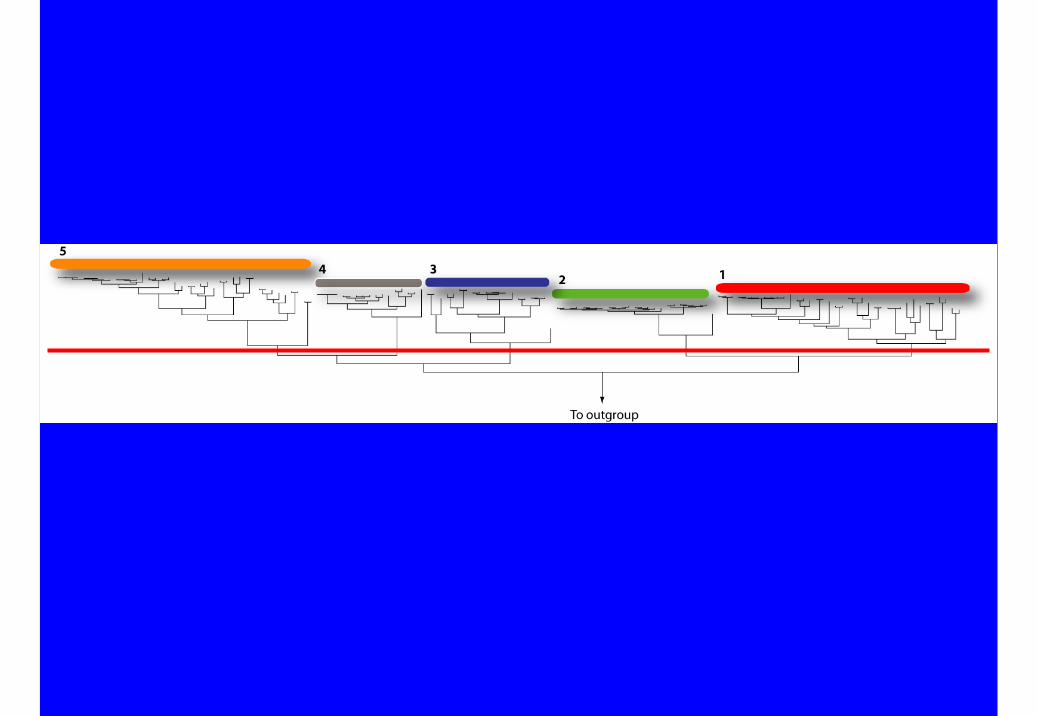
Species delimitation• Focal taxon genealogically exclusive• Geographic structuring, clades divergent with
strong support• Divergence and structuring exceed limitations of
TCS and NCA (60 sp. min.)• 15 - 20 species (conservatively) using
geographical concordance of mtDNA lineages

Bond & Stockman 2008 (Sys. Bio.)
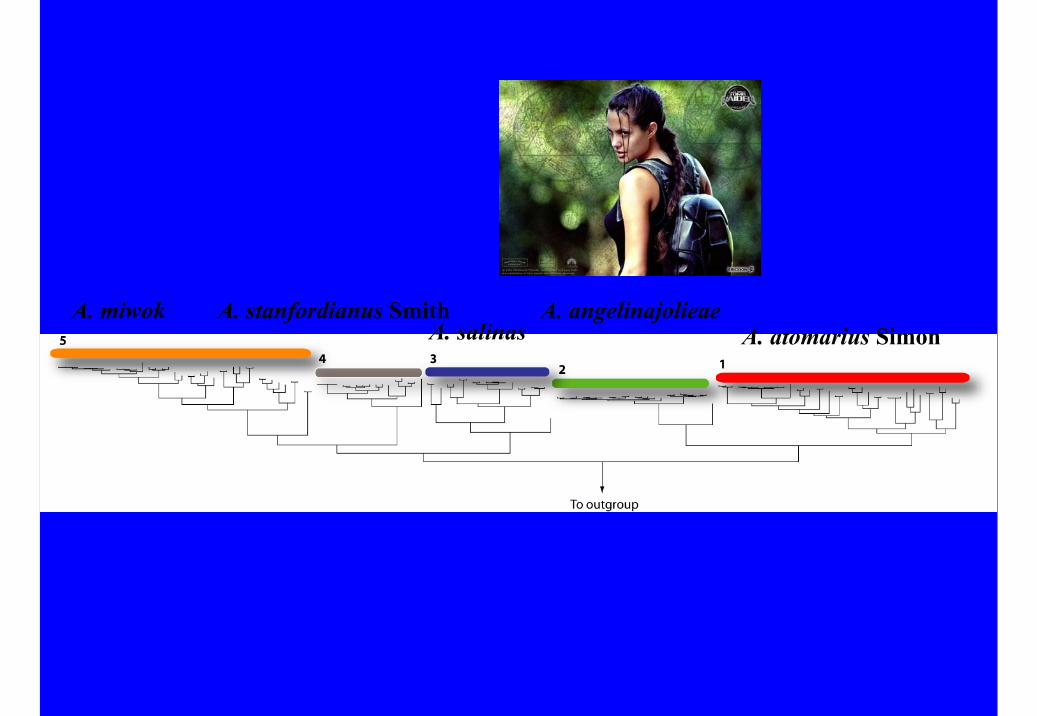
A. atomarius SimonA. angelinajolieaeA. miwok
A. salinasA. stanfordianus Smith

BREAK