![INDEX [] · n.r.i questionnaire 3 keyman questionnaire with annexures 5 employer-employee scheme questionnaire 11 personal financial questionnaire 12 general occupation questionnaire](https://static.fdocuments.us/doc/165x107/5e7f0927f331ad3020486c35/index-nri-questionnaire-3-keyman-questionnaire-with-annexures-5-employer-employee.jpg)
General Heallh Questionnaire
18
73 5 General Health Questionnaire SUMMARY § The GHQ12 is a good measure of psychological well being in the population and was asked of half of the respondents to the Northern Ireland Health and Social Wellbeing Survey. 27.6% respondents had a GHQ12 score of 3 or more and 21.3% had a score of 4 or more. Women were more likely than men to have poor psychological health. Unlike the self- reported measures of health there was no general decline in psychological wellbeing with age. § The prevalence of psychological morbidity was higher in Northern Ireland than in either England or Scotland. § Those who were widowed, separated or divorced generally had the worst mental health though the relationship between marital status and mental health varied by age and sex, for example, in middle age marriage was associated with best mental health for men but amongst women it was those who were single who faired better. § Catholics tended to have higher GHQ-12 scores (worst mental health) than Protestants, the differences between the two communities being most marked at younger ages. § Those who were living alone or who suffered a perceived lack of social support tended to have worse mental health. § Being of lower socio-economic status was also associated with poorer mental health and these differences were generally most pronounced in the middle age range. § GHQ caseness was closely associated with other measures of self reported ill health especially general health, while it was thought that much of the variation in mental health in Northern Ireland was secondary to variations in physical health the possibility of overlap in the questions was also considered.
-
Upload
pablo-perez-diaz -
Category
Documents
-
view
226 -
download
1
Transcript of General Heallh Questionnaire

73
5 General Health Questionnaire
SUMMARY
��The GHQ12 is a good measure of psychological well being in the population and was asked
of half of the respondents to the Northern Ireland Health and Social Wellbeing Survey.
27.6% respondents had a GHQ12 score of 3 or more and 21.3% had a score of 4 or more.
Women were more likely than men to have poor psychological health. Unlike the self-
reported measures of health there was no general decline in psychological wellbeing with
age.
��The prevalence of psychological morbidity was higher in Northern Ireland than in either
England or Scotland.
��Those who were widowed, separated or divorced generally had the worst mental health
though the relationship between marital status and mental health varied by age and sex, for
example, in middle age marriage was associated with best mental health for men but
amongst women it was those who were single who faired better.
��Catholics tended to have higher GHQ-12 scores (worst mental health) than Protestants, the
differences between the two communities being most marked at younger ages.
��Those who were living alone or who suffered a perceived lack of social support tended to
have worse mental health.
��Being of lower socio-economic status was also associated with poorer mental health and
these differences were generally most pronounced in the middle age range.
��GHQ caseness was closely associated with other measures of self reported ill health
especially general health, while it was thought that much of the variation in mental health in
Northern Ireland was secondary to variations in physical health the possibility of overlap in
the questions was also considered.
74
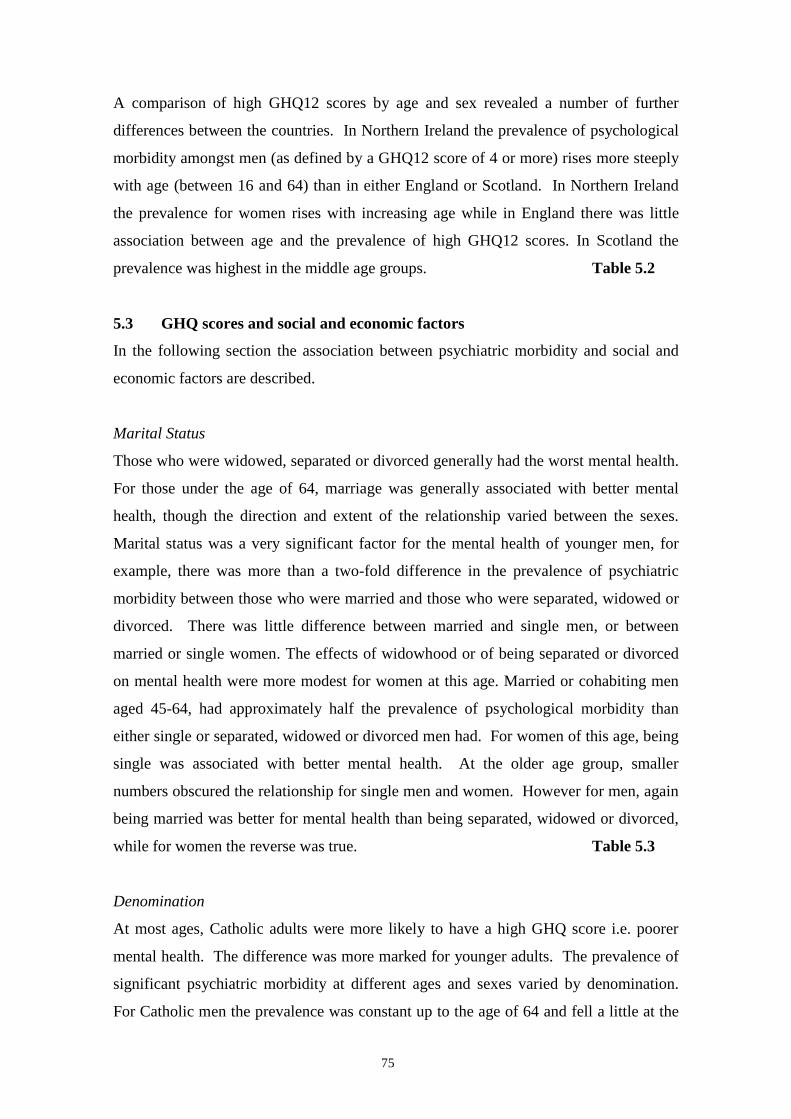
5.1 Introduction
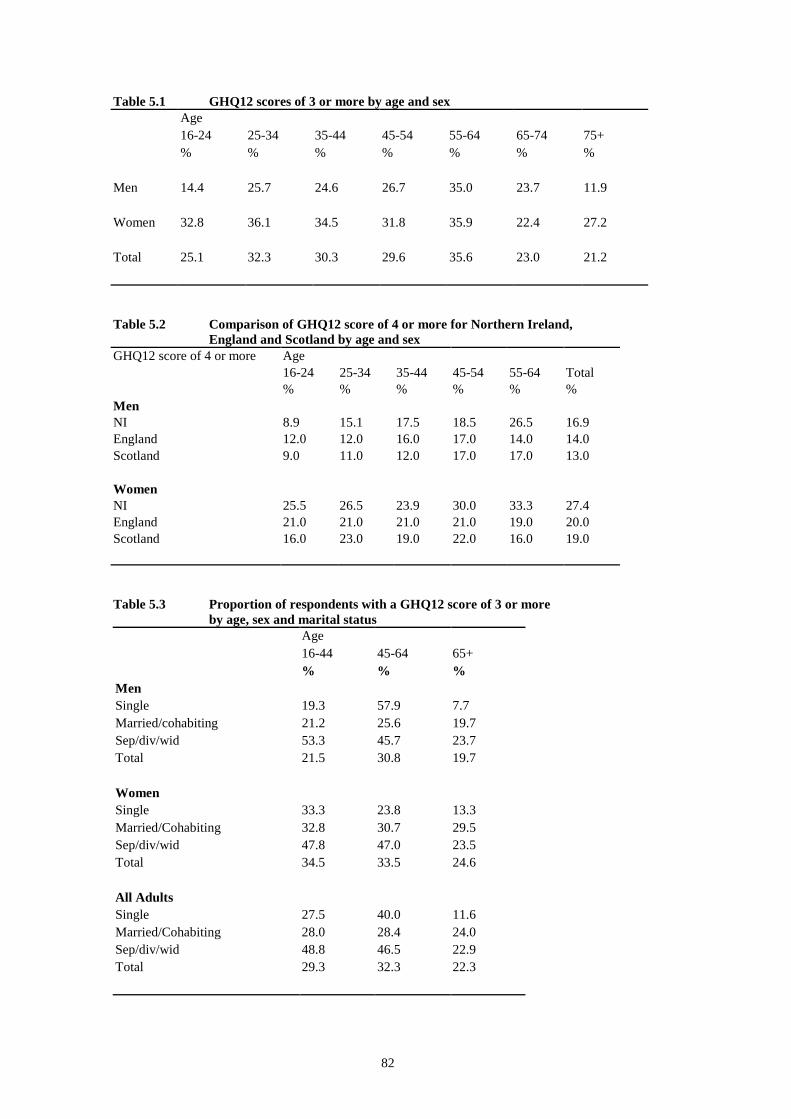
A total of 2093 respondents completed the GHQ12 questions in the survey. 27.6%
(578) of the respondents had a GHQ12 score of 3 or more and 21.3% (445) had a score
of 4 or more. Women were more likely than men to have an elevated GHQ12 score.
The difference between men and women was greatest for those aged 16-24, at this age
the percentage of women with a GHQ12 score of 3 or more was more than twice that of
men. Table 5.1
For men both the youngest (16-24) and the oldest age groups (75+) were the least likely
to have high GHQ12 scores. In the middle age groups the prevalence was highest
amongst women with the exception of the 55-64 age group in which the prevalence was
higher for men. The prevalence of psychiatric morbidity in women, though highest in
those aged 25-34, was fairly constant between the ages of 16 to 55.
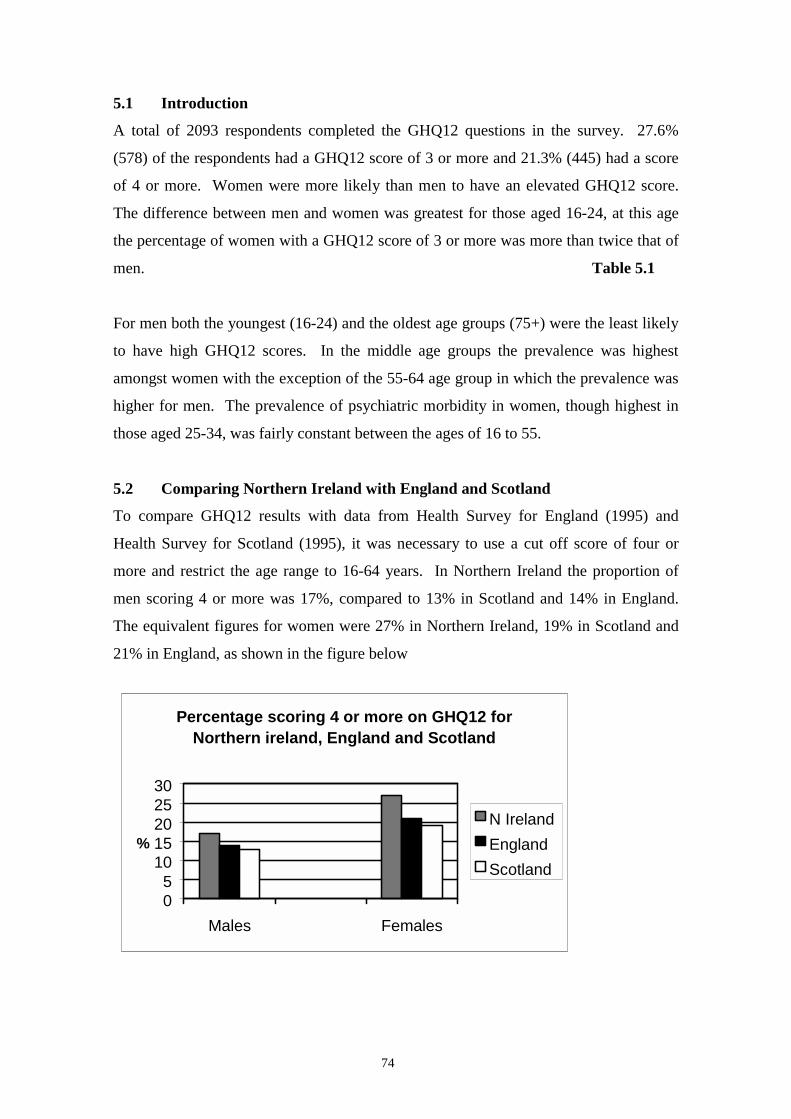
5.2 Comparing Northern Ireland with England and Scotland
To compare GHQ12 results with data from Health Survey for England (1995) and
Health Survey for Scotland (1995), it was necessary to use a cut off score of four or
more and restrict the age range to 16-64 years. In Northern Ireland the proportion of
men scoring 4 or more was 17%, compared to 13% in Scotland and 14% in England.
The equivalent figures for women were 27% in Northern Ireland, 19% in Scotland and
21% in England, as shown in the figure below
Percentage scoring 4 or more on GHQ12 for Northern ireland, England and Scotland
05
1015202530
Males Females
%N IrelandEnglandScotland
75
A comparison of high GHQ12 scores by age and sex revealed a number of further
differences between the countries. In Northern Ireland the prevalence of psychological
morbidity amongst men (as defined by a GHQ12 score of 4 or more) rises more steeply
with age (between 16 and 64) than in either England or Scotland. In Northern Ireland
the prevalence for women rises with increasing age while in England there was little
association between age and the prevalence of high GHQ12 scores. In Scotland the
prevalence was highest in the middle age groups. Table 5.2
5.3 GHQ scores and social and economic factors
In the following section the association between psychiatric morbidity and social and
economic factors are described.
Marital Status
Those who were widowed, separated or divorced generally had the worst mental health.
For those under the age of 64, marriage was generally associated with better mental
health, though the direction and extent of the relationship varied between the sexes.
Marital status was a very significant factor for the mental health of younger men, for
example, there was more than a two-fold difference in the prevalence of psychiatric
morbidity between those who were married and those who were separated, widowed or
divorced. There was little difference between married and single men, or between
married or single women. The effects of widowhood or of being separated or divorced
on mental health were more modest for women at this age. Married or cohabiting men
aged 45-64, had approximately half the prevalence of psychological morbidity than
either single or separated, widowed or divorced men had. For women of this age, being
single was associated with better mental health. At the older age group, smaller
numbers obscured the relationship for single men and women. However for men, again
being married was better for mental health than being separated, widowed or divorced,
while for women the reverse was true. Table 5.3
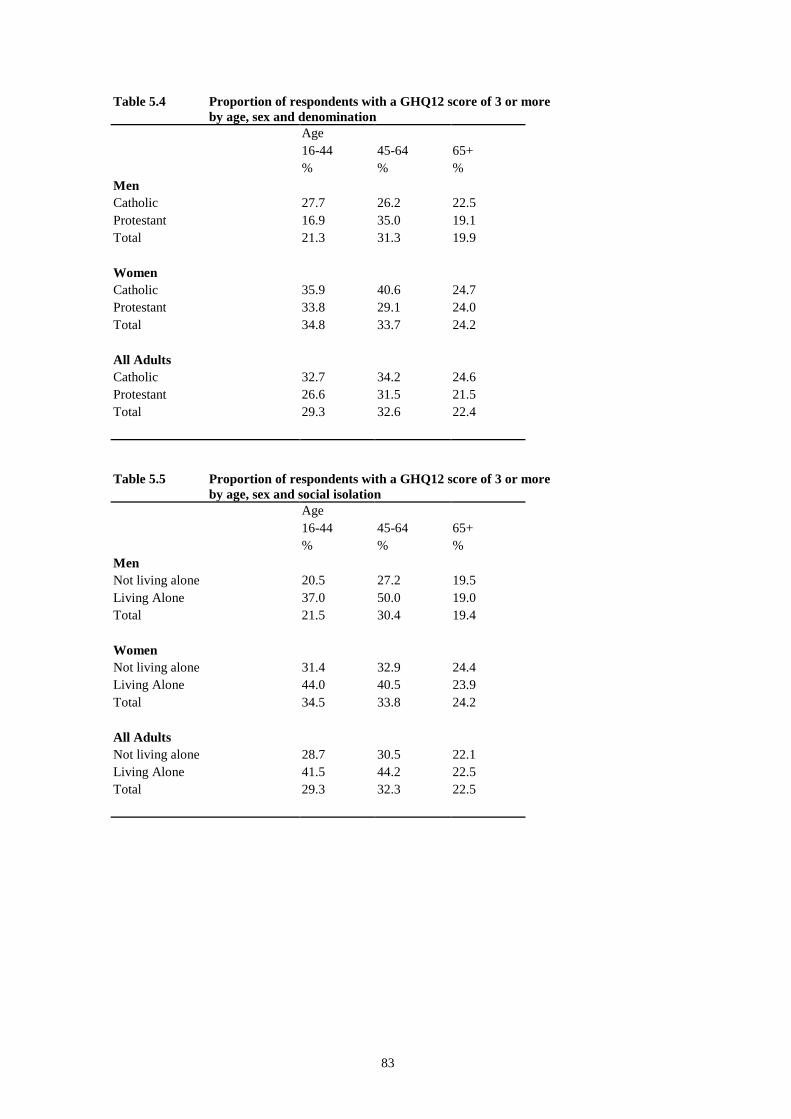
Denomination
At most ages, Catholic adults were more likely to have a high GHQ score i.e. poorer
mental health. The difference was more marked for younger adults. The prevalence of
significant psychiatric morbidity at different ages and sexes varied by denomination.
For Catholic men the prevalence was constant up to the age of 64 and fell a little at the
76
older ages. Protestant men had a low prevalence at both the younger and older ages but
a high prevalence between the ages of 45-64. For women the pattern was almost
reversed, with Catholic women showing an increase in prevalence between 45-64, while
Protestant women showed improving mental health with increasing age. The difference
between the denominations was greatest for men aged 16-44 and women aged 45-64.
There was little difference in mental health between denominations for both sexes at the
oldest age group (65+). Table 5.4
Social isolation – lone person households
Adults who were living alone were more likely to have a high GHQ score of 3 than
those who were not living alone. This was most evident at the younger ages. There was
a moderate difference at the youngest age group for both men and women. The
difference in psychiatric morbidity between those living alone and those who were not
was particularly marked for men between the ages of 45-64 but not so marked for
women. At the oldest age group there was relatively little difference in GHQ score by
social isolation for both men and women. Table 5.5
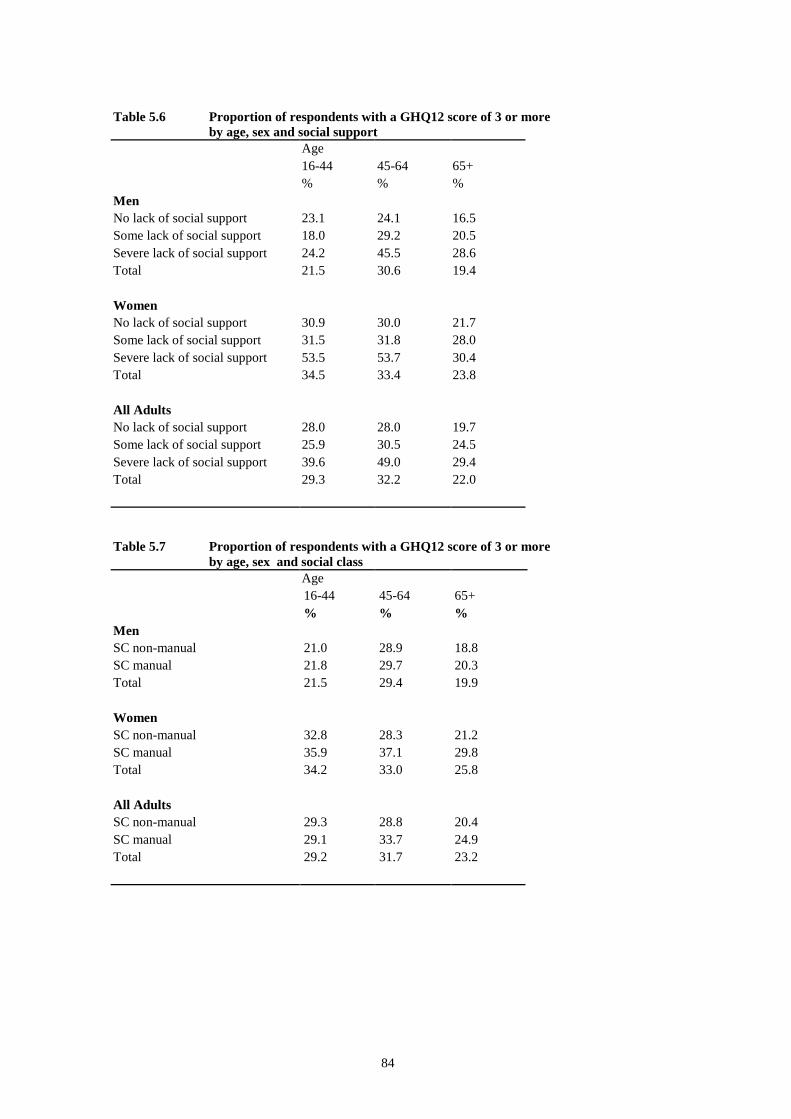
Perceived social support
The social support scale was derived by assigning a score from a scale where one
denoted lack of support to three - no lack of support for each of seven questions. A
maximum score of 21 indicated no lack of social support, a score of 18 to 20 signified
some lack of support, while a score under 18 indicated a severe lack of social support.
Respondents with a severe lack of social support were more likely to have a GHQ score
of 3 or more than those with some or no lack of social support. For those aged 16-44
there was a marked difference between categories for women, though for men the
differences were small. There was a large difference at age 45-64 for both men and
women and the difference decreased for both sexes at the oldest age group.
Table 5.6
Social Class
In general there was a higher prevalence of psychiatric morbidity among those in the
manual social classes (IIIM to V) than those in non-manual social classes (I to IIINM),
though at the youngest age group there was little difference in mental health between
the social classes. This was true for both men and women. The largest difference was
77
at ages 45-64, though only for women. By age 65+ the difference between the social
classes for both sexes was once again attenuated. Table 5.7
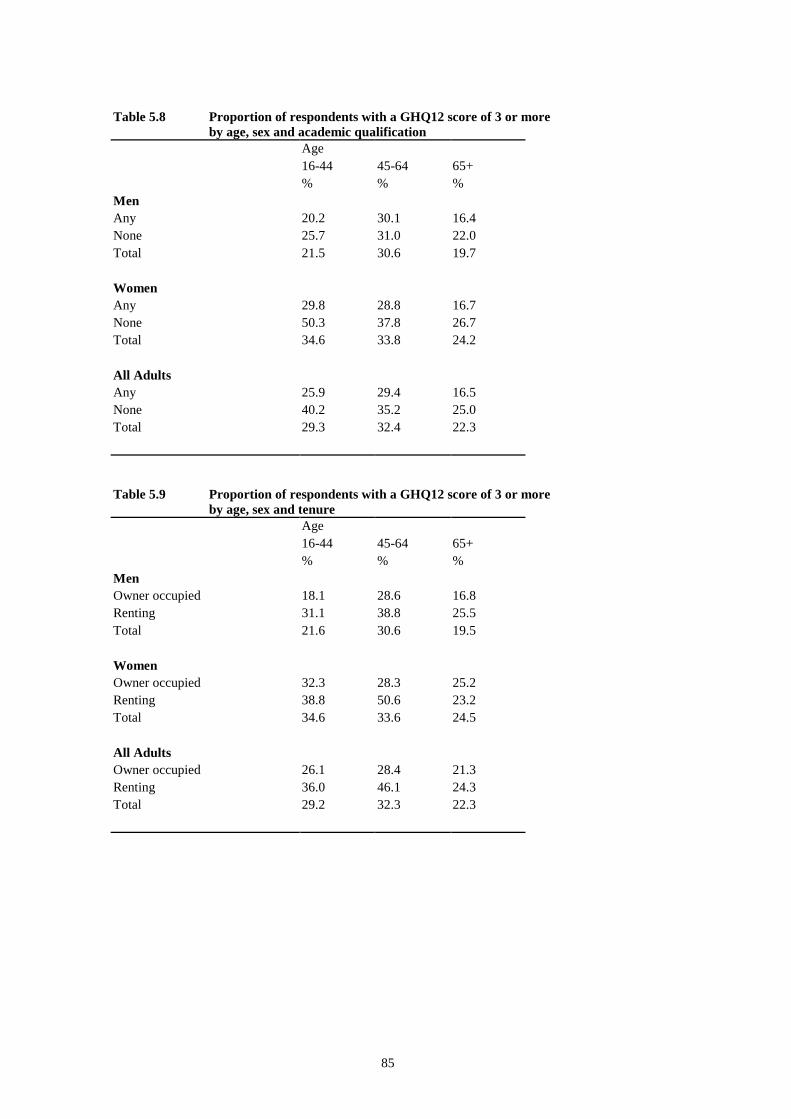
Qualification
At all ages and for both sexes, those who have some formal educational qualifications
had better mental health than those who had no such qualifications. The difference
between these two categories was more pronounced at the youngest age group. For men
there was a modest difference between those with and without a qualification in relation
to their mental health. While those with no qualification reported a higher prevalence of
psychiatric morbidity in the youngest and oldest age groups, the differences were small
and there was no difference at age 45-64. There was, however, a marked difference for
women across the three age bands, which was much more apparent at the youngest age
group. Table 5.8
Tenure
Respondents living in rented accommodation were more likely to have a high GHQ
score than those in owner occupied homes. Overall, there were moderate differences
between the categories at age 16-44 and relatively little difference for those over the age
of 65. The greatest difference was at age 45-64. For men, the difference in mental
health between renting and living in owner occupied housing appeared to be greatest at
16-44, while for women those in the youngest and oldest age groups showed relatively
little difference in mental health between types of tenures; however, there appeared to
be a substantial difference in levels of psychiatric morbidity at age 45-64 between those
renting and those in owner occupied housing. Table 5.9
Car Availability
Adults without access to a car recorded higher levels of psychiatric morbidity than those
who had access to a car. There was a moderate difference at the youngest age, a large
difference at 45-64 and again relatively little difference over the age of 65. The
difference in psychiatric morbidity between those with and without access to a car
between the ages of 45-64 was particularly marked for men. Table 5.10
78
Household Income
In general, respondents in higher income categories were less likely to have a GHQ
score of 3 or more. For those aged 16-44 there was an almost two-fold difference
between categories for men, though for women the differences were not as marked. At
age 45-64 for men again the difference was almost two-fold and there was a three-fold
difference between income categories for women. Smaller numbers obscured the
relationship between the lowest and highest categories among the oldest age group.
Table 5.11
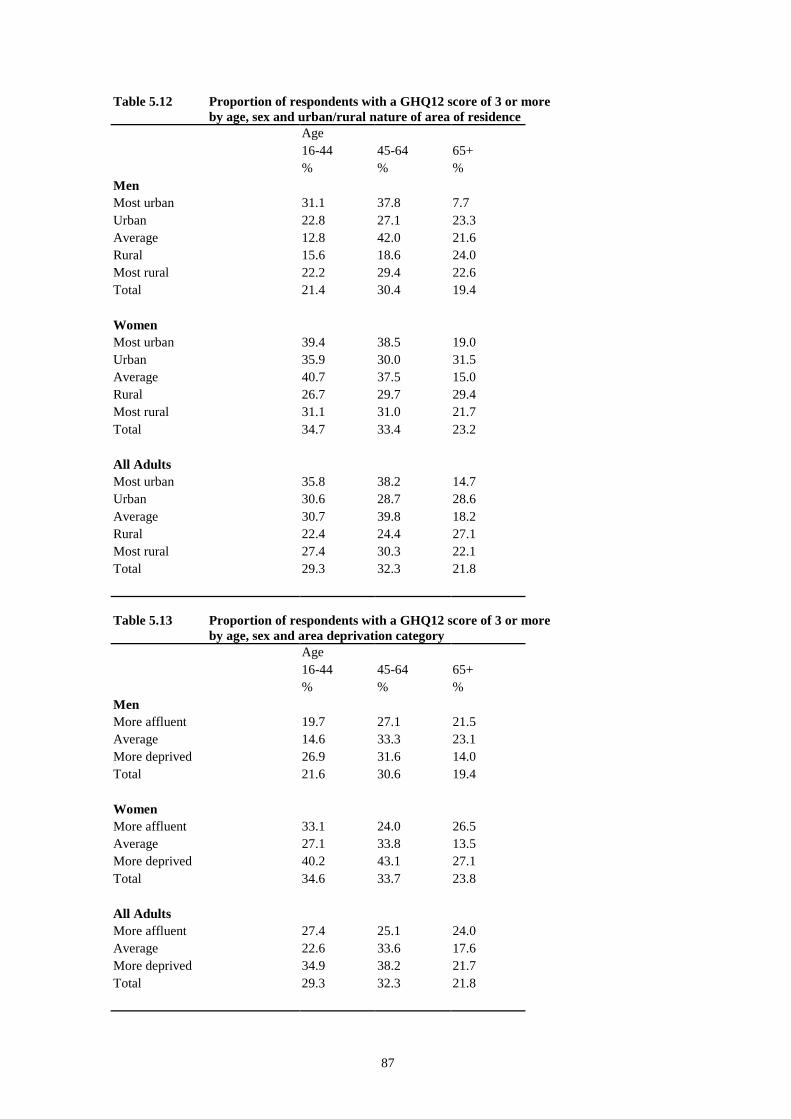
Urban/Rural Areas
In general, respondents in the most urban areas were more likely to have a high GHQ12
score than those in rural and most rural areas. However, it was difficult to discern any
overall trend in the prevalence of psychiatric morbidity from most urban to most rural
areas, though in those aged less than 65, there was a lower prevalence in the urban areas
compared to the most urban areas which may perhaps reflect the more affluent suburbs.
Table 5.12
Deprivation at area level
Generally respondents living within the most deprived category were more likely to
have a GHQ12 score over 3. There was a moderate difference at the youngest age
group, a greater difference at age 45-64 and once again the difference weakened among
the oldest age group. The greatest difference was for women at age 45-64 where those
in the most deprived group were twice as likely to have a high GHQ12 score than those
in the most affluent group. At the oldest age group smaller numbers obscured the
pattern. Interestingly, at the youngest and oldest ages mental health appears to be better
in the ‘average’ than in the ‘affluent’ areas. Table 5.13
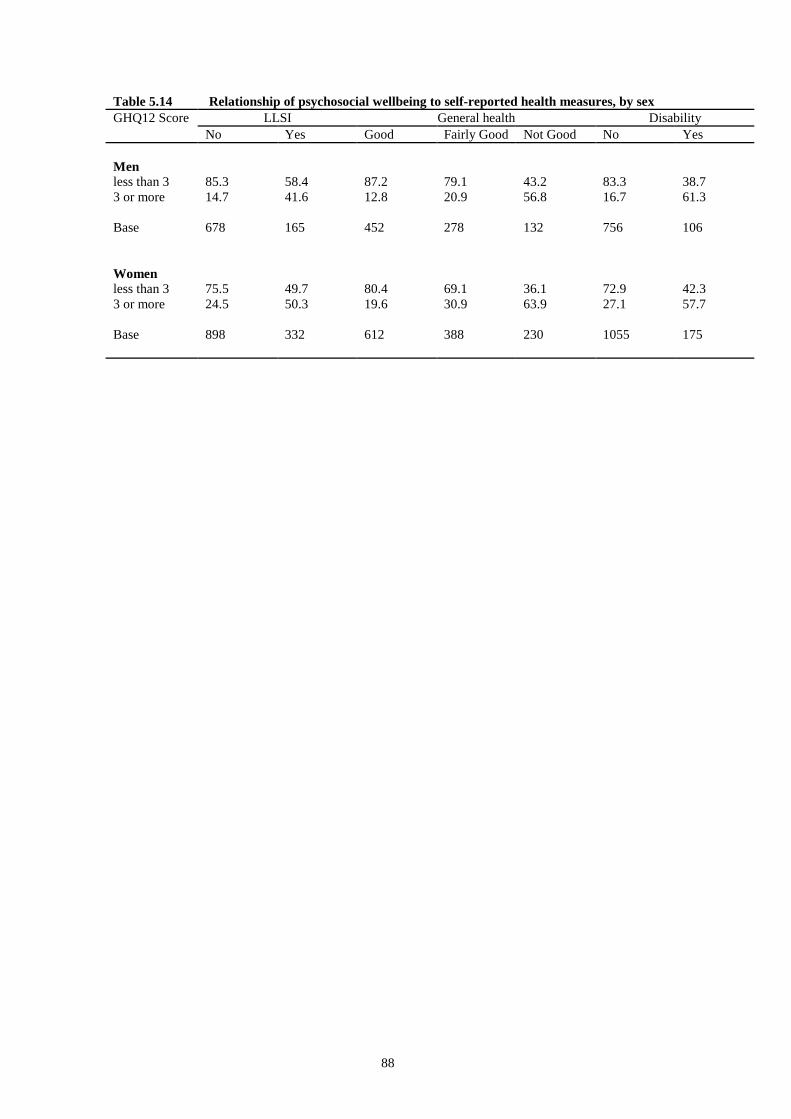
5.4 Relationship with self reported health measures
The Health Survey included a number of questions about respondents’ perception of
their own health, for example their general health, limiting long standing illness and
disability. This section looks at the relationship between these measures of self reported
health and the respondents GHQ12 scores.
79
GHQ12 and limiting long standing illness
Large differences were evident when comparing those respondents who reported having
a limiting long-standing illness and those who had not. Among the former 41.6% of
men and 50.3% of women had a GHQ score of over 3, while the equivalent figures for
the latter were 14.7% of men and 24.5% of women (see Table 5.14).
GHQ12 and self reported general health
Table 5.14 shows a clear and linear relationship between quality of self-reported general
health and prevalence of high GHQ12 scores. Among those who said that their health
was ‘good’, 12.8% of men and 19.6% of women had a high GHQ12 score. By contrast,
among those who rated their general health as ‘not good’, 56.8% of men and 63.9% of
women had a high GHQ12 score.
GHQ12 and disability
There was also a clear relationship between the presence of any disability and GHQ12
score. Respondents who reported having a disability were more likely than those who
did not to have a GHQ12 score of over 3. For men, the figures were 61.3% and 16.7%
respectively and for women they were 57.7% and 27.1% (see Table 5.14).
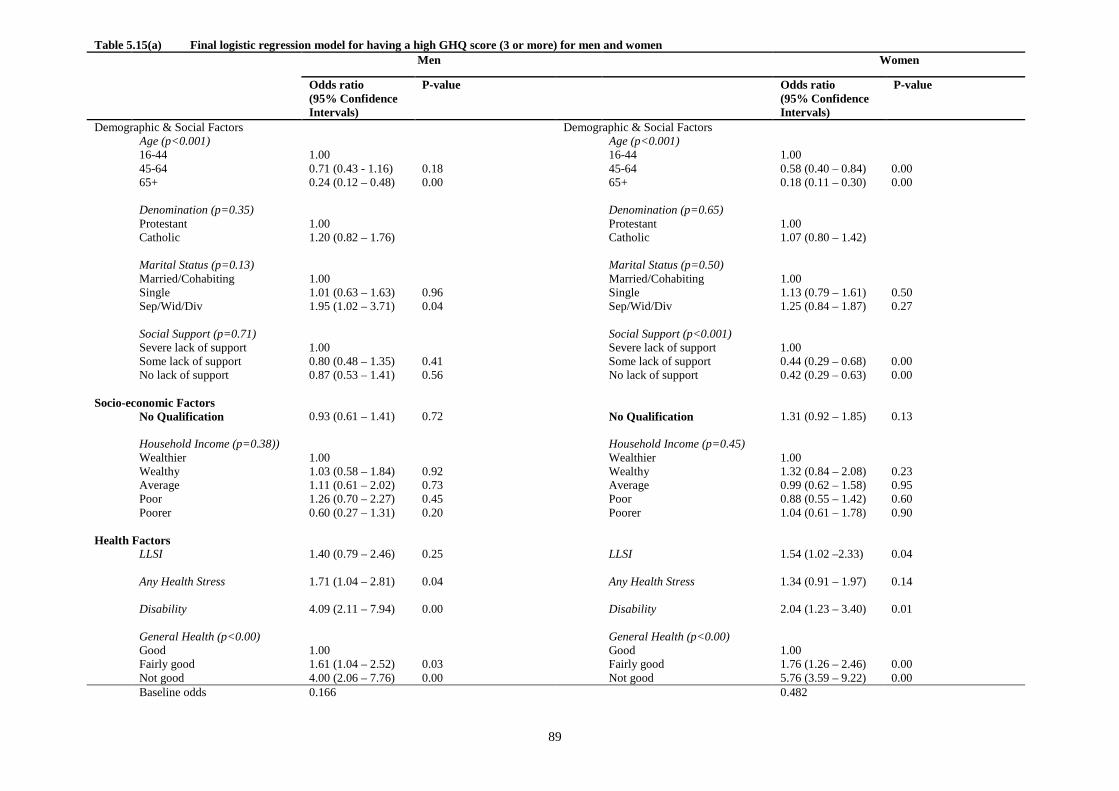
5.5 Logistic regression
The main social and economic factors were included in a logistic regression for GHQ12,
for men and women separately (see Table 5.15(a)). Logistic regression allowed us to
examine which social and economic factors affected the odds of having a high score on
the GHQ12.
When all other factors (principally health factors) were controlled for, the odds of
having significant psychiatric morbidity fell with increasing age, in both men and
women. For men only age and health factors were associated with poor mental health,
for women the likelihood of psychiatric morbidity increased if perceived social support
was felt to be lacking.
The major determinant of mental health of the population at all ages was the presence or
absence of physical ill health or (for men) exposure to health stresses in the last year.
80
(Health stresses included the deterioration of an existing medical condition, serious
health problem of a family member or friend or the death of a family member or friend).
There is a potential problem with including health factors in the regression models.
While it is reasonable to include measures of purely physical health, it would be wrong
to include another measure of mental health as this would simply produce a tautological
statement and swamp the influence of other social or economic variables. A difficulty
arises as we were not sure if some of these measures related solely to the physical
aspects of health. However we interpreted the three health measures as primarily
representing physical health for the following reasons:
1. The disability questions very evidently related to aspects of physical health and the
spectrum of disability ranged from an inability to walk 200 yards without stopping
or discomfort to the inability to get out of bed or a chair without difficulty.
2. Limiting long-standing illness is known to be a poor indication of mental or
emotional health1 being much more closely aligned with physical aspects of health.
3. The proposed census question likewise, has been shown to be more associated with
the physical aspects of health.
When the analysis was rerun without including the census’ general health question, the
effects of the other indicators of physical health were strengthened and LLSI question
was now an insignificant predictor of mental health for men as were health stresses in
the last year for women. This adds further support to the contention that the general
health question was reflecting the physical aspects of health.
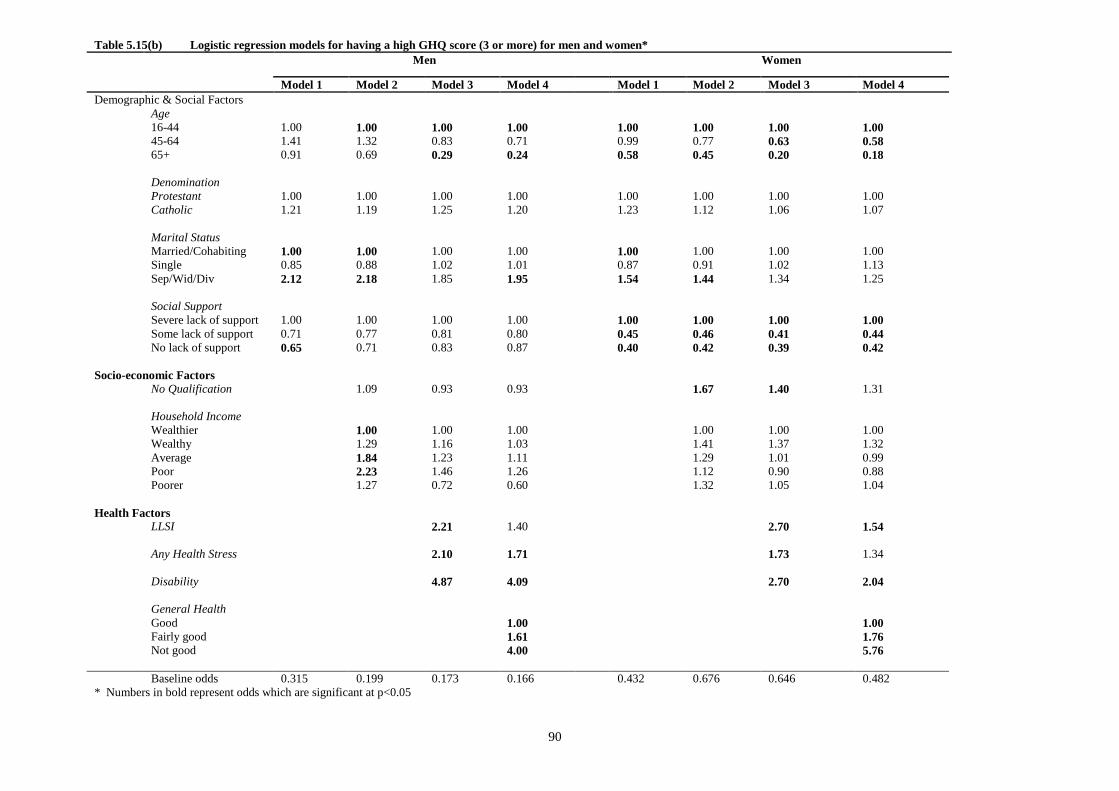
Rerunning the analysis in stages (see Table 5.15(b)), starting with demographic and
social factors, then adding the measures of socio-economic status before finally adding
indicators of physical health, enabled us to understand a little more of the interplay of
these factors. Initially only marital status was significantly associated with GHQ
caseness for men. The improvement in mental health with increasing age and social
support was evident in women. Although there was a tendency for Catholics to have
1 Cohen, J., Forbes, J. and Garroway, M. (1995). Interpreting self reported limiting long term illness. British Medical Journal. 311, 722-724
81
poorer mental health this did not reach conventional levels of statistical significance.
For both men and women, those who were widowed, separated or divorced had between
one and a half and twice the risk of having significant psychiatric morbidity. The
additions of socio-economic factors modified this picture somewhat. For men age was
now associated with mental health, (though there was no evidence of a trend) and there
was some indication that the likelihood of poorer mental health increased as household
income fell. Women without academic qualifications had an increased risk of poor
mental health, and the inclusion of socio-economic factors reduced the relationship
between marital status and mental health. Neither tenure, social class nor car
availability were associated with mental health in either men or women.
The further addition of physical health factors reduced to non-significance many of the
remaining associations between social and economic factors and mental health. Again
the inference is that physical health is a major determinant of mental health and that
many of the associations between social and socio-economic status and poor mental
health are mediated though their associations with poorer physical health. For women,
social support remained important throughout and its relationship to mental health status
was unaffected by social or economic factors. It is possible that, in women, good social
support increases personal resilience and, other things being equal, reduces the risks of
poor mental health.
Neither area deprivation factors, Board of residence or the urban/rural nature of where
the respondent lived were significantly associated with mental health status.
Conclusion:
Much of the poorer mental health, as measured by the GHQ12, in Northern Ireland was
associated with poorer physical health. There was evidence of an inherent tendency
towards better mental health with advancing age, though with the age-related decline in
physical function, the overall effect was to keep the prevalence of significant
psychological morbidity fairly constant across the age bands. Most of the socio-
economic effects on mental health in Northern Ireland appeared to be mediated through
the association between socio-economic standing and physical ill-health. Good levels
of social support mitigated against the likelihood of poor mental health in women.
82
Table 5.1 GHQ12 scores of 3 or more by age and sex Age 16-24 25-34 35-44 45-54 55-64 65-74 75+ % % % % % % % Men 14.4 25.7 24.6 26.7 35.0 23.7 11.9 Women 32.8 36.1 34.5 31.8 35.9 22.4 27.2 Total 25.1 32.3 30.3 29.6 35.6 23.0 21.2 Table 5.2 Comparison of GHQ12 score of 4 or more for Northern Ireland,
England and Scotland by age and sex GHQ12 score of 4 or more Age 16-24 25-34 35-44 45-54 55-64 Total % % % % % % Men NI 8.9 15.1 17.5 18.5 26.5 16.9 England 12.0 12.0 16.0 17.0 14.0 14.0 Scotland 9.0 11.0 12.0 17.0 17.0 13.0 Women NI 25.5 26.5 23.9 30.0 33.3 27.4 England 21.0 21.0 21.0 21.0 19.0 20.0 Scotland 16.0 23.0 19.0 22.0 16.0 19.0 Table 5.3 Proportion of respondents with a GHQ12 score of 3 or more
by age, sex and marital status Age 16-44 45-64 65+ % % % Men Single 19.3 57.9 7.7 Married/cohabiting 21.2 25.6 19.7 Sep/div/wid 53.3 45.7 23.7 Total 21.5 30.8 19.7 Women Single 33.3 23.8 13.3 Married/Cohabiting 32.8 30.7 29.5 Sep/div/wid 47.8 47.0 23.5 Total 34.5 33.5 24.6 All Adults Single 27.5 40.0 11.6 Married/Cohabiting 28.0 28.4 24.0 Sep/div/wid 48.8 46.5 22.9 Total 29.3 32.3 22.3
83
Table 5.4 Proportion of respondents with a GHQ12 score of 3 or more by age, sex and denomination
Age 16-44 45-64 65+ % % % Men Catholic 27.7 26.2 22.5 Protestant 16.9 35.0 19.1 Total 21.3 31.3 19.9 Women Catholic 35.9 40.6 24.7 Protestant 33.8 29.1 24.0 Total 34.8 33.7 24.2 All Adults Catholic 32.7 34.2 24.6 Protestant 26.6 31.5 21.5 Total 29.3 32.6 22.4 Table 5.5 Proportion of respondents with a GHQ12 score of 3 or more
by age, sex and social isolation Age 16-44 45-64 65+ % % % Men Not living alone 20.5 27.2 19.5 Living Alone 37.0 50.0 19.0 Total 21.5 30.4 19.4 Women Not living alone 31.4 32.9 24.4 Living Alone 44.0 40.5 23.9 Total 34.5 33.8 24.2 All Adults Not living alone 28.7 30.5 22.1 Living Alone 41.5 44.2 22.5 Total 29.3 32.3 22.5
84
Table 5.6 Proportion of respondents with a GHQ12 score of 3 or more
by age, sex and social support Age 16-44 45-64 65+ % % % Men No lack of social support 23.1 24.1 16.5 Some lack of social support 18.0 29.2 20.5 Severe lack of social support 24.2 45.5 28.6 Total 21.5 30.6 19.4 Women No lack of social support 30.9 30.0 21.7 Some lack of social support 31.5 31.8 28.0 Severe lack of social support 53.5 53.7 30.4 Total 34.5 33.4 23.8 All Adults No lack of social support 28.0 28.0 19.7 Some lack of social support 25.9 30.5 24.5 Severe lack of social support 39.6 49.0 29.4 Total 29.3 32.2 22.0 Table 5.7 Proportion of respondents with a GHQ12 score of 3 or more
by age, sex and social class Age 16-44 45-64 65+ % % % Men SC non-manual 21.0 28.9 18.8 SC manual 21.8 29.7 20.3 Total 21.5 29.4 19.9 Women SC non-manual 32.8 28.3 21.2 SC manual 35.9 37.1 29.8 Total 34.2 33.0 25.8 All Adults SC non-manual 29.3 28.8 20.4 SC manual 29.1 33.7 24.9 Total 29.2 31.7 23.2
85
Table 5.8 Proportion of respondents with a GHQ12 score of 3 or more
by age, sex and academic qualification Age 16-44 45-64 65+ % % % Men Any 20.2 30.1 16.4 None 25.7 31.0 22.0 Total 21.5 30.6 19.7 Women Any 29.8 28.8 16.7 None 50.3 37.8 26.7 Total 34.6 33.8 24.2 All Adults Any 25.9 29.4 16.5 None 40.2 35.2 25.0 Total 29.3 32.4 22.3 Table 5.9 Proportion of respondents with a GHQ12 score of 3 or more
by age, sex and tenure Age 16-44 45-64 65+ % % % Men Owner occupied 18.1 28.6 16.8 Renting 31.1 38.8 25.5 Total 21.6 30.6 19.5 Women Owner occupied 32.3 28.3 25.2 Renting 38.8 50.6 23.2 Total 34.6 33.6 24.5 All Adults Owner occupied 26.1 28.4 21.3 Renting 36.0 46.1 24.3 Total 29.2 32.3 22.3

86
Table 5.10 Proportion of respondents with a GHQ12 score of 3 or more
by age, sex and car availability Age 16-44 45-64 65+ % % % Men One or more 19.6 27.5 20.8 None 31.1 50.0 16.7 Total 21.5 30.6 19.5 Women One or more 33.0 31.0 21.8 None 39.2 44.6 26.7 Total 34.5 33.6 24.2 All Adults One or more 27.3 29.3 21.3 None 36.6 46.5 23.5 Total 29.3 32.2 22.2 Table 5.11 Proportion of respondents with a GHQ12 score of 3 or more
by age, sex and household income category Age 16-44 45-64 65+ % % % Men More wealthy 14.9 24.2 20.0 Average 24.2 25.0 20.5 More poor 25.2 40.5 20.0 Total 21.9 30.0 20.3 Women More wealthy 28.8 14.3 7.1 Average 32.5 33.8 32.3 More poor 40.9 41.7 18.9 Total 34.6 32.5 24.0 All Adults More wealthy 22.2 19.0 8.7 Average 29.1 30.3 27.6 More poor 35.2 41.2 19.4 Total 29.4 31.3 22.4
87
Table 5.12 Proportion of respondents with a GHQ12 score of 3 or more by age, sex and urban/rural nature of area of residence
Age 16-44 45-64 65+ % % % Men Most urban 31.1 37.8 7.7 Urban 22.8 27.1 23.3 Average 12.8 42.0 21.6 Rural 15.6 18.6 24.0 Most rural 22.2 29.4 22.6 Total 21.4 30.4 19.4 Women Most urban 39.4 38.5 19.0 Urban 35.9 30.0 31.5 Average 40.7 37.5 15.0 Rural 26.7 29.7 29.4 Most rural 31.1 31.0 21.7 Total 34.7 33.4 23.2 All Adults Most urban 35.8 38.2 14.7 Urban 30.6 28.7 28.6 Average 30.7 39.8 18.2 Rural 22.4 24.4 27.1 Most rural 27.4 30.3 22.1 Total 29.3 32.3 21.8 Table 5.13 Proportion of respondents with a GHQ12 score of 3 or more
by age, sex and area deprivation category Age 16-44 45-64 65+ % % % Men More affluent 19.7 27.1 21.5 Average 14.6 33.3 23.1 More deprived 26.9 31.6 14.0 Total 21.6 30.6 19.4 Women More affluent 33.1 24.0 26.5 Average 27.1 33.8 13.5 More deprived 40.2 43.1 27.1 Total 34.6 33.7 23.8 All Adults More affluent 27.4 25.1 24.0 Average 22.6 33.6 17.6 More deprived 34.9 38.2 21.7 Total 29.3 32.3 21.8
88
Table 5.14 Relationship of psychosocial wellbeing to self-reported health measures, by sex GHQ12 Score LLSI General health Disability No Yes Good Fairly Good Not Good No Yes Men less than 3 85.3 58.4 87.2 79.1 43.2 83.3 38.7 3 or more 14.7 41.6 12.8 20.9 56.8 16.7 61.3 Base 678 165 452 278 132 756 106 Women less than 3 75.5 49.7 80.4 69.1 36.1 72.9 42.3 3 or more 24.5 50.3 19.6 30.9 63.9 27.1 57.7 Base 898 332 612 388 230 1055 175
89
Table 5.15(a) Final logistic regression model for having a high GHQ score (3 or more) for men and women Men Women
Odds ratio (95% Confidence Intervals)
P-value Odds ratio (95% Confidence Intervals)
P-value
Demographic & Social Factors Demographic & Social Factors Age (p<0.001) Age (p<0.001) 16-44 1.00 16-44 1.00 45-64 0.71 (0.43 - 1.16) 0.18 45-64 0.58 (0.40 – 0.84) 0.00 65+ 0.24 (0.12 – 0.48) 0.00 65+ 0.18 (0.11 – 0.30) 0.00
Denomination (p=0.35) Denomination (p=0.65) Protestant 1.00 Protestant 1.00 Catholic 1.20 (0.82 – 1.76) Catholic 1.07 (0.80 – 1.42) Marital Status (p=0.13) Marital Status (p=0.50) Married/Cohabiting 1.00 Married/Cohabiting 1.00 Single 1.01 (0.63 – 1.63) 0.96 Single 1.13 (0.79 – 1.61) 0.50 Sep/Wid/Div 1.95 (1.02 – 3.71) 0.04 Sep/Wid/Div 1.25 (0.84 – 1.87) 0.27 Social Support (p=0.71) Social Support (p<0.001) Severe lack of support 1.00 Severe lack of support 1.00 Some lack of support 0.80 (0.48 – 1.35) 0.41 Some lack of support 0.44 (0.29 – 0.68) 0.00 No lack of support 0.87 (0.53 – 1.41) 0.56 No lack of support 0.42 (0.29 – 0.63) 0.00 Socio-economic Factors
No Qualification 0.93 (0.61 – 1.41) 0.72 No Qualification 1.31 (0.92 – 1.85) 0.13
Household Income (p=0.38)) Household Income (p=0.45) Wealthier 1.00 Wealthier 1.00 Wealthy 1.03 (0.58 – 1.84) 0.92 Wealthy 1.32 (0.84 – 2.08) 0.23 Average 1.11 (0.61 – 2.02) 0.73 Average 0.99 (0.62 – 1.58) 0.95 Poor 1.26 (0.70 – 2.27) 0.45 Poor 0.88 (0.55 – 1.42) 0.60 Poorer 0.60 (0.27 – 1.31) 0.20 Poorer 1.04 (0.61 – 1.78) 0.90 Health Factors LLSI 1.40 (0.79 – 2.46) 0.25 LLSI 1.54 (1.02 –2.33) 0.04 Any Health Stress 1.71 (1.04 – 2.81) 0.04 Any Health Stress 1.34 (0.91 – 1.97) 0.14 Disability 4.09 (2.11 – 7.94) 0.00 Disability 2.04 (1.23 – 3.40) 0.01 General Health (p<0.00) General Health (p<0.00) Good 1.00 Good 1.00 Fairly good 1.61 (1.04 – 2.52) 0.03 Fairly good 1.76 (1.26 – 2.46) 0.00 Not good 4.00 (2.06 – 7.76) 0.00 Not good 5.76 (3.59 – 9.22) 0.00 Baseline odds 0.166 0.482
90
Table 5.15(b) Logistic regression models for having a high GHQ score (3 or more) for men and women* Men Women
Model 1 Model 2 Model 3 Model 4 Model 1 Model 2 Model 3 Model 4 Demographic & Social Factors Age 16-44 1.00 1.00 1.00 1.00 1.00 1.00 1.00 1.00 45-64 1.41 1.32 0.83 0.71 0.99 0.77 0.63 0.58 65+ 0.91 0.69 0.29 0.24 0.58 0.45 0.20 0.18
Denomination Protestant 1.00 1.00 1.00 1.00 1.00 1.00 1.00 1.00 Catholic 1.21 1.19 1.25 1.20 1.23 1.12 1.06 1.07 Marital Status Married/Cohabiting 1.00 1.00 1.00 1.00 1.00 1.00 1.00 1.00 Single 0.85 0.88 1.02 1.01 0.87 0.91 1.02 1.13 Sep/Wid/Div 2.12 2.18 1.85 1.95 1.54 1.44 1.34 1.25 Social Support Severe lack of support 1.00 1.00 1.00 1.00 1.00 1.00 1.00 1.00 Some lack of support 0.71 0.77 0.81 0.80 0.45 0.46 0.41 0.44 No lack of support 0.65 0.71 0.83 0.87 0.40 0.42 0.39 0.42 Socio-economic Factors No Qualification 1.09 0.93 0.93 1.67 1.40 1.31
Household Income Wealthier 1.00 1.00 1.00 1.00 1.00 1.00 Wealthy 1.29 1.16 1.03 1.41 1.37 1.32 Average 1.84 1.23 1.11 1.29 1.01 0.99 Poor 2.23 1.46 1.26 1.12 0.90 0.88 Poorer 1.27 0.72 0.60 1.32 1.05 1.04 Health Factors LLSI 2.21 1.40 2.70 1.54 Any Health Stress 2.10 1.71 1.73 1.34 Disability 4.87 4.09 2.70 2.04 General Health Good 1.00 1.00 Fairly good 1.61 1.76 Not good 4.00 5.76 Baseline odds 0.315 0.199 0.173 0.166 0.432 0.676 0.646 0.482 * Numbers in bold represent odds which are significant at p<0.05