General equations for Biomass Properties · General equations for Biomass Properties Nadège...
31
1 General equations for Biomass Properties Nadège Richard 1,2 , Henrik Thunman 1 1 Department of Energy Conversion, 2 Department of Energy and Environment, Chalmers University of Technology, National Institute of Applied Sciences (INSA), S-412 96 Gothenburg, Sweden 69 621 Villeurbanne, France August, 2002 1. Introduction The problem to be treated is to investigate if general equations can be used to define properties of biomass fuels. The following properties were selected: - the amount of char (Y char ) - the composition of char (X’ C,char , X’ H,char , X’ O,char ) - the heating value of char (H char ) - the amount of tar (Y tar ) - the composition of tar (X C,tar , X H,tar , X O,tar ) - the heating value of tar (H tar ) - the heat of devolatilisation (H devol ) - the heating value of volatiles (H vol ). These properties depend of many parameters, such as temperature, particle size, residence time, heating rate and composition. In this work, in order to simplify the problem, only the temperature dependence, considered to be the main parameter, has been taken in account. So, empirical correlations have to be found between these properties and the input data which are: - the temperature of devolatilisation reactor (T) - the heating value of biomass (H wood ) - the ash content in biomass (Y ash ) As small particles are considered, the temperature expressed in this report in Kelvin is the temperature of the reactor, assumed to be almost the same as the temperature of devolatilisation and the temperature of the particle during pyrolysis. These empirical correlations are found by curve fitting (see appendix). Different equations (linear, quadratic, cubic, quadric, or nth-degree equation) and a regression model were tested. The results are presented in this paper. 2. Method Curve fitting was used to find empirical correlations. The real problem is to decide how the data points should be represented. Individual judgment can often be used, the freehand method of curve fitting. This method has the disadvantage that different observers can obtain different curves and equations. A more scientific approach is the use of the least square method. However, for the quantitative analysis of data, nothing can replace experience, and the qualitative knowledge of the phenomenon representing data. Special attention should be given to the fact that the regression found is often valid between the limits (or near to them) of the data analysed. In this report, both methods will be used. Some of the equations have been made using the freehand method of fitting curve, some with the least square method [1].
Transcript of General equations for Biomass Properties · General equations for Biomass Properties Nadège...

1
General equations for Biomass Properties
Nadège Richard1,2, Henrik Thunman1
1Department of Energy Conversion, 2Department of Energy and Environment, Chalmers University of Technology, National Institute of Applied Sciences (INSA), S-412 96 Gothenburg, Sweden 69 621 Villeurbanne, France
August, 2002 1. Introduction
The problem to be treated is to investigate if general equations can be used to define properties of biomass fuels. The following properties were selected:
- the amount of char (Ychar) - the composition of char (X’C,char , X’ H,char, X’O,char) - the heating value of char (Hchar ) - the amount of tar (Ytar) - the composition of tar (XC,tar, XH,tar, XO,tar) - the heating value of tar (Htar) - the heat of devolatilisation (Hdevol) - the heating value of volatiles (Hvol).
These properties depend of many parameters, such as temperature, particle size, residence time, heating rate and composition. In this work, in order to simplify the problem, only the temperature dependence, considered to be the main parameter, has been taken in account. So, empirical correlations have to be found between these properties and the input data which are: - the temperature of devolatilisation reactor (T)
- the heating value of biomass (Hwood) - the ash content in biomass (Yash)
As small particles are considered, the temperature expressed in this report in Kelvin is the temperature of the reactor, assumed to be almost the same as the temperature of devolatilisation and the temperature of the particle during pyrolysis.
These empirical correlations are found by curve fitting (see appendix). Different equations (linear, quadratic, cubic, quadric, or nth-degree equation) and a regression model were tested. The results are presented in this paper. 2. Method
Curve fitting was used to find empirical correlations. The real problem is to decide how the data points should be represented. Individual judgment can often be used, the freehand method of curve fitting. This method has the disadvantage that different observers can obtain different curves and equations. A more scientific approach is the use of the least square method. However, for the quantitative analysis of data, nothing can replace experience, and the qualitative knowledge of the phenomenon representing data. Special attention should be given to the fact that the regression found is often valid between the limits (or near to them) of the data analysed. In this report, both methods will be used. Some of the equations have been made using the freehand method of fitting curve, some with the least square method [1].
2
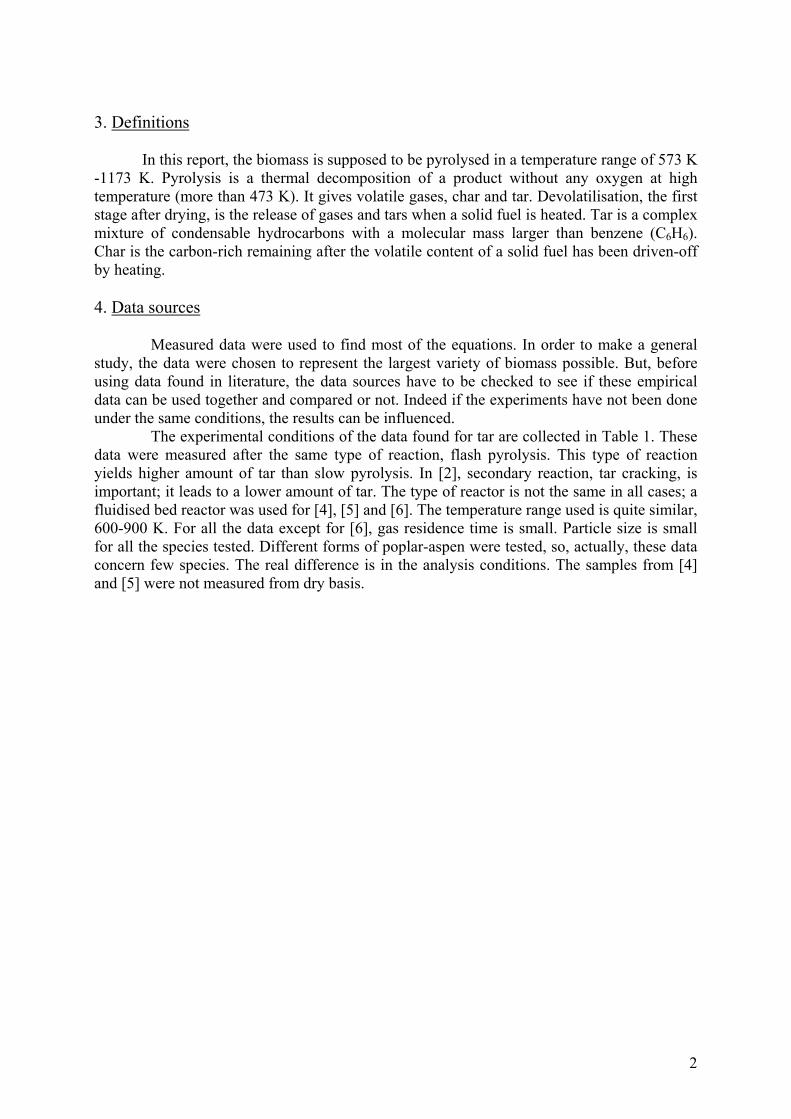
3. Definitions
In this report, the biomass is supposed to be pyrolysed in a temperature range of 573 K -1173 K. Pyrolysis is a thermal decomposition of a product without any oxygen at high temperature (more than 473 K). It gives volatile gases, char and tar. Devolatilisation, the first stage after drying, is the release of gases and tars when a solid fuel is heated. Tar is a complex mixture of condensable hydrocarbons with a molecular mass larger than benzene (C6H6). Char is the carbon-rich remaining after the volatile content of a solid fuel has been driven-off by heating. 4. Data sources
Measured data were used to find most of the equations. In order to make a general study, the data were chosen to represent the largest variety of biomass possible. But, before using data found in literature, the data sources have to be checked to see if these empirical data can be used together and compared or not. Indeed if the experiments have not been done under the same conditions, the results can be influenced.
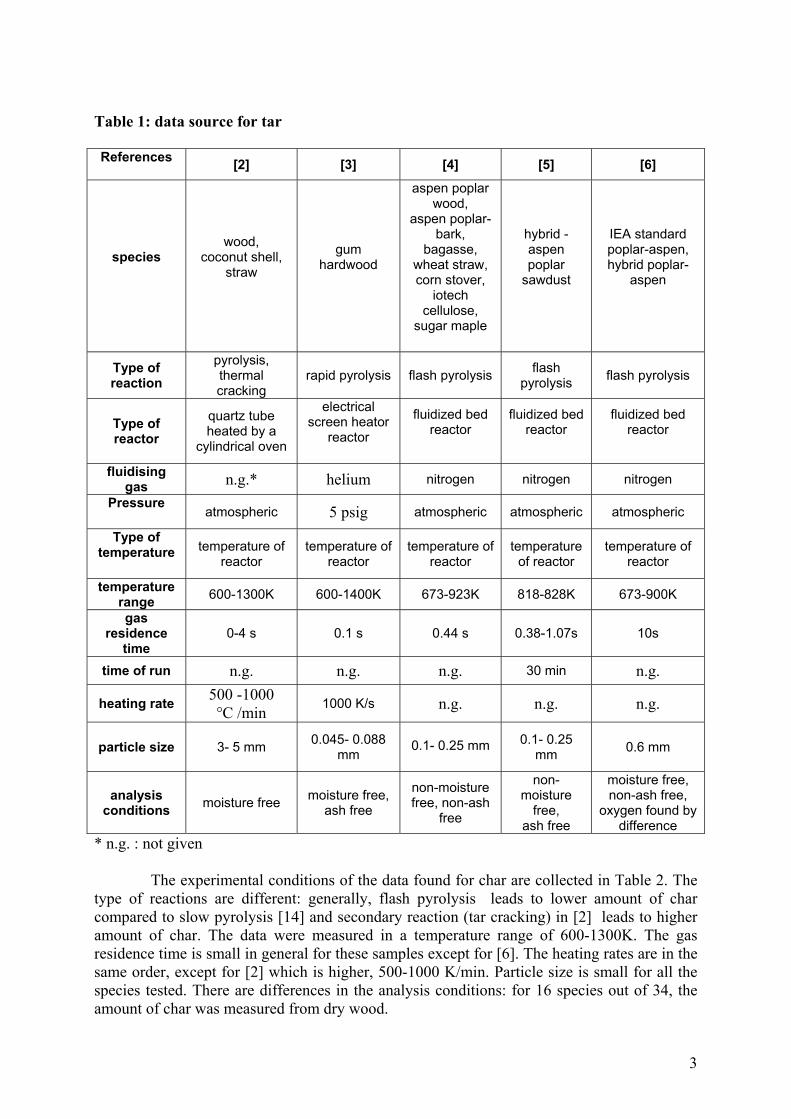
The experimental conditions of the data found for tar are collected in Table 1. These data were measured after the same type of reaction, flash pyrolysis. This type of reaction yields higher amount of tar than slow pyrolysis. In [2], secondary reaction, tar cracking, is important; it leads to a lower amount of tar. The type of reactor is not the same in all cases; a fluidised bed reactor was used for [4], [5] and [6]. The temperature range used is quite similar, 600-900 K. For all the data except for [6], gas residence time is small. Particle size is small for all the species tested. Different forms of poplar-aspen were tested, so, actually, these data concern few species. The real difference is in the analysis conditions. The samples from [4] and [5] were not measured from dry basis.
3
Table 1: data source for tar References
[2] [3] [4] [5] [6]
species
wood, coconut shell,
straw
gum hardwood
aspen poplar wood,
aspen poplar-bark,
bagasse, wheat straw, corn stover,
iotech cellulose,
sugar maple
hybrid -aspen poplar
sawdust
IEA standard poplar-aspen, hybrid poplar-
aspen
Type of reaction
pyrolysis, thermal cracking
rapid pyrolysis flash pyrolysis flash pyrolysis flash pyrolysis
Type of reactor
quartz tube heated by a
cylindrical oven
electrical screen heator
reactor
fluidized bed reactor
fluidized bed reactor
fluidized bed reactor
fluidising
gas n.g.* helium nitrogen nitrogen nitrogen Pressure
atmospheric 5 psig atmospheric atmospheric atmospheric Type of
temperature
temperature of reactor
temperature of reactor
temperature of reactor
temperature of reactor
temperature of reactor
temperature range 600-1300K 600-1400K 673-923K 818-828K 673-900K gas
residence time
0-4 s 0.1 s 0.44 s 0.38-1.07s 10s
time of run n.g. n.g. n.g. 30 min n.g.
heating rate 500 -1000 ±C /min 1000 K/s n.g. n.g. n.g.
particle size 3- 5 mm 0.045- 0.088 mm
0.1- 0.25 mm
0.1- 0.25
mm 0.6 mm
analysis conditions moisture free moisture free,
ash free non-moisture free, non-ash
free
non-moisture
free, ash free
moisture free, non-ash free,
oxygen found by difference
* n.g. : not given The experimental conditions of the data found for char are collected in Table 2. The
type of reactions are different: generally, flash pyrolysis leads to lower amount of char compared to slow pyrolysis [14] and secondary reaction (tar cracking) in [2] leads to higher amount of char. The data were measured in a temperature range of 600-1300K. The gas residence time is small in general for these samples except for [6]. The heating rates are in the same order, except for [2] which is higher, 500-1000 K/min. Particle size is small for all the species tested. There are differences in the analysis conditions: for 16 species out of 34, the amount of char was measured from dry wood.

4
Table 2: data source for char (1) References
[2] [4] [6] [7] [8] [9]
species
wood, coconut
shell, straw, hybrid poplar aspen, white
spruce
aspen poplar wood, aspen
poplar-bark, bagasse,
wheat straw,
corn stover, iotech
cellulose, sugar maple
IEA standard poplar-aspen, hybrid poplar-aspen, wheat straw, maple
eucalyptus wood wood chips
almond shells,
sawdust, straw,
rice husks, olives
stones, grapes stones,
compost
type of reaction
pyrolysis, thermal cracking
flash pyrolysis
flash pyrolysis carbonisation pyrolysis flash
pyrolysis
type of reactor
quartz tube heated by a cylindrical
oven
fluidized bed reactor
fluidized bed reactor
horizontal tube furnace
radiant furnace
fluidized bed reactor
fluidising gas n.g.* nitrogen nitrogen N2 nitrogen nitrogen
Pressure atmospheric atmospheric atmospheric n.g. n.g. atmospheric
type of temperature
temperature
of reactor temperature
of reactor temperature
of reactor temperature
of reactor bed
temperaturetemperature
of reactor temperature
range 600-1300K 673-923K 673-900K 673-1073K 650-1000K 873-1173K gas
residence time
0 -4 s 0.44 s 10 s n.g. n.g. n.g.
time of run n.g. n.g. n.g. n.g. n.g. n.g.
heating rate 500-1000 ±C/min n.g. n.g. 10K/min 25K/min n.g.
particle size 3- 5 mm 0.1-0.25 mm
0.6 mm
0.5- 0.8mm 0.2- 3mm 0.15-0.5mm
analysis conditions
moisture free
non-moisture
free, non-ash
free
moisture free, non-ash free, oxygen
found by difference
moisture free, ash free
moisture free
non-moisture free, ash
free
*n.g.: not given

5
Table 2: data source for char (2) References
[10] [11] [12] [13] [14] [15]
species
Brocville poplar, white
spruce, red maple, IEA
poplar
holm-oak wood
sawdust
mixed wood waste
pine wood
oil palm
shell (biomass)
cellulosa
type of reaction
flash
pyrolysis pyrolysis flash pyrolysis
slow pyrolysis pyrolysis pyrolysis
type of reactor
fluidized bed reactor
cylindrical stainless
steel reactor
fluidized bed reactor
static batch reactor
fluidized bed reactor n.g.*
fluidising gas n.g. n.g. nitrogen nitrogen nitrogen n.g.
Pressure n.g. atmospheric n.g. n.g. n.g. n.g. type of
temperature
temperature of reactor
temperature of reactor
temperature of reactor
pyrolysis temperature
temperature of reactor
temperature of reactor
temperature range 720-820K 573-1173K 673-823K 573-1000K 673-873K 573-773K gas
residence time
0.7s n.g. 2.5s n.g. 1.48s at 773 K n.g.
time of run n.g. 30 min n.g. 2 h n.g. 5 min heating rate n.g. n.g. n.g. 5-80 K/min n.g. n.g.
particle size 1mm diameter
0.65-1mm
n.g. 1cm3 cubes 0.2-0.4 mm n.g.
analysis conditions
moisture free
non-moisture
free, non-ash
free
non-moisture free, non-ash free,
oxygen by difference
non-moisture
free, non-ash
free
moisture free
non-moisture
free, ash free
*n.g.: not given
The experimental conditions of the data found for the composition of char, after
pyrolysis, are collected in Table 3. The data were measured in a range of temperature of 623-1123K. The heating rates are in the same order, about 10K/min. Particle size is small for all the species tested. The time of a run is different; it varies from 5 minutes to 1 hour for certain species. But, the main difference is in the analysis conditions: the composition of char was measured from moisture and ash-free basis for 4 species.

6
Table 3: data source for char composition References
[7] [15] [16] [17] [18] [19]
species
eucalyptus wood
cellulosa
straw and stalk of
rapeseed plant
Argentinean hardwood species
almond shells, hazelnut shells,
beech wood
olive stones
type of reaction carbonisation pyrolysis pyrolysis pyrolysis pyrolysis pyrolysis
type of reactor
horizontal tube furnace n.g.*
stainless steel tubular
reactor fixed bed reactor n.g. n.g.
fluidising gas N2 n.g. nitrogen nitrogen nitrogen nitrogen
pressure n.g. n.g. n.g. n.g. n.g. n.g. type of
temperature
temperature of reactor n.g. n.g. temperature
of reactor final pyrolysis temperature
final pyrolysis temperature
temperature range 673-1073 K 573-773 K 673-1173 K 623 K or 1123
K 573-1123 K 623-1123 K gas
residence time
n.g. n.g. n.g. n.g. n.g. n.g.
time of run n.g. 5min 30 min 3h or 1h n.g. 1h heating rate
10 K/min n.g. 5 C/min 5 K/min 20 C/min 10 K/min particle size
0.5- 0.8 mm n.g. 1 mm 1.2- 1.4 mm 0.91 mm 0.04-0.045 mm
analysis conditions
moisture free, ash free
non-moisture free, ash
free
non-moisture free, non-ash free
moisture free, ash free
non-moisture free,
non-ash free
moisture free, ash free,
oxygen by difference
*n.g.: not given
Other data for the composition of char are collected in Table 4. They were used to check the general equations found from the data of Table 3. The type of reaction of this sample is not the same: flash pyrolysis for [4], [6], [12], pyrolysis and thermal cracking of tar for [2], pyrolysis for [7], [15] and carbonisation for [11]. The data were measured for a maximal temperature range of 573-1300K. The residence time for [6] is quite long: 10s. The two heating rates mentioned are different. Particle size is small for all the species tested. There are differences in the analysis conditions, as the composition of char was measured from moisture free basis for 6 species out of 11.

7
Table 4: data source for the checking of the amount of char
References [2] [4] [6] [7] [11] [12] [15]
species wood,
coconut shell, straw,
Poplar aspen
with lime added
standard poplar-aspen, hybrid poplar-aspen, wheat straw,
Gum hardwood
holm-oak wood
mixed wood waste
cellulosa
type of reaction
pyrolysis, thermal cracking
flash pyrolysis
flash pyrolysis
carbonisation pyrolysis flash
pyrolysis pyrolysis
type of reactor
quartz tube heated by
a cylindrical
oven
fluidized bed
reactor
fluidized bed
reactor
horizontal tube
furnace
cylindrical stainless
steel reactor
fluidized bed
reactor n.g.
fluidising gas n.g.* nitrogen nitrogen N2 n.g. nitrogen n.g. pressure atm* atm atm n.g. atm n.g. n.g. type of
temperature
temp of reactor
temp of reactor
temp of reactor
temp of reactor
temp of reactor
temp of reactor n.g.
temperature range
600-1300K 673-923
K 673-900K 673-1073K 573-1173K 673-823
K 573-773
K gas
residence time
0 -4 s 0.44 s 10 s n.g. n.g. 2.5s n.g.
time of run n.g. n.g. n.g. n.g. 30 min n.g. 5min
heating rate 500-1000 ±C/min n.g. n.g. 10K/min n.g. n.g. n.g.
particle size 3- 5 mm 0.1-0.25
mm
0.6 mm
0.5- 0.8mm 0.65-1mm n.g. n.g.
analysis conditions
moisture free,
non-ash free
non-moisture
free, non-ash
free
moisture free, non-ash free,
oxygen by difference
moisture free, ash
free
non-moisture
free, non-ash
free
non-moisture free, non-ash free,
oxygen by difference
non-moisture free, ash
free
*n.g.: not given * atm: atmospheric pressure
5. Results
Empirical correlations have been established based on the data found in literature. For some properties, the lack of data prevents from producing an accurate regression model. So, in such cases, equations were taken directly from literature. Some of the data are collected in Tables 5 and 6, the reference of the others are quoted in the Figures 2, 3, 4, 6, 7 and 8.

8
5.1 Composition of tar For the amount of tar (Ytar), a sample of 14 species with 4 or 5 points each time was
found (see Table 5). Figure 1 shows that the amount of tar increases with temperature until 773 K and then starts to decrease. It was difficult to establish an equation which fits the data. Samolada and Vasalos [2] proposed an empirical equation. This correlation has the same shape but seems to correspond to higher amount of tar. However, the conditions of measurements of this sample are not exactly the same (see Table 1). Species measured from non-moisture free basis, [4] and [5], seem to lead to higher amount of tar in Figure 1. Not the same reactions occur; flash pyrolysis in [3], [4], [5] and [6] leads to high amount of tar, whereas thermal tar cracking in [2] leads to lower amount of tar. The type of reactor can also influence the results as for [4], [5] and [6], a fluidised bed was used. So, the correlation of Samolada and Vasalos [2] can be used if flash pyrolysis in a fluidised bed reactor is considered:
Ytar = 55.19 – 11.5 T* - 21.69 T* 2 (1) T* = (T-833) / 160
where T* is a dimensionless temperature and T the temperature of the reactor in Kelvin.
Figure 1: Mass % of tar of the combustible part of the fuel related to temperature
0
10
20
30
40
50
60
70
80
90
100
600 700 800 900 1000 1100 1200Temperature (Kelvin)
mas
s %
of t
ar o
f the
com
bust
ible
par
tof
the
fuel
poplar-aspen sawdust [5]
gum hardwood [3]
aspen poplar wood [4]
aspen poplar bark [4]
corn stover [4]
iotech cellulose [4]
sugar maple [4]
wheat straw [4]
bagasse [4]
IEA standard poplar aspen [6]
hybrid poplar-aspen [6]
wood [2]
coconut [2]
straw [2]
average curve
Samolada and Vasalos [2]
For the tar composition, not enough data were found to establish a relationship with
temperature. The carbon, hydrogen and oxygen contents in tar don’t seem to vary with temperature (see Figures 2, 3 and 4), but only a sample of four species with just few points was available as a support for this judgement. The mass percentage of carbon in tar remains approximately at 54.5 %, the percentage of hydrogen at 6.5 % and the percentage of oxygen was about 39 %.
XC,tar = 54.5 (2) XH,tar = 6.5 (3) XO,tar = 39 (4)

9
Figure 2 : Mass % of carbon in tar related to temperature
0
10
20
30
40
50
60
70
80
90
100
650 700 750 800 850 900 950Temperature (Kelvin)
mas
s %
of c
arbo
n in
tar
poplar-aspen sawdust [5]
aspen poplar [4]
wheat straw [4]
IEA standard poplar aspen [6]
linear model
Figure 3: Mass % of hydrogen in tar related to temperature
0
1
2
3
4
5
6
7
8
9
10
650 700 750 800 850 900 950
Temperature (kelvin)
mas
s %
of h
ydro
gen
in ta
r
poplar-aspen sawdust [5]
aspen poplar [4]
wheat straw [4]
IEA standard poplar aspen [6]
linear model

10
Figure 4: Mass % of oxygen in tar related to temperature
0
5
10
15
20
25
30
35
40
45
50
650 700 750 800 850 900 950
Temperature (celcius)
mas
s %
of o
xyge
n in
tar
poplar-aspen sawdust [5]aspen poplar [4]wheat straw [4]IEA standard poplar aspen [6] linear model
These values can be considered as approximations of carbon, hydrogen and oxygen contents in tar.
5.2 Heating value of tar A general assumption [20] for the heating value of tar is that the composition of tar is
close to that of wood between 673 K and 923 K, so the heating value of tar is between 22 and 26 MJ/kg (combustible substance), and between 973 K and 1273 K, the composition is close to that of lumped hydrocarbons, whose heating value is about 40 MJ/kg. However, no further data were found to make a model. So, initially, it was thought that the heating value of tar could be determined from the heating value of its components, but the different substances present in tar and their amount were too difficult to find. Finally, a general correlation of Mason and Gandhi [3] was adopted:
HHV = 146.58 XC,tar + 568.78 XH,tar – 51.53 XO,tar (5)
where HHV, the high heating value, is expressed in Btu/lb. As 1 Btu/lb = 2.326 kJ/kg, it becomes in kJ/kg:
HHV = 340.95 XC,tar + 1322.98 XH,tar – 119.86 XO,tar (6) 5.3 Composition of char
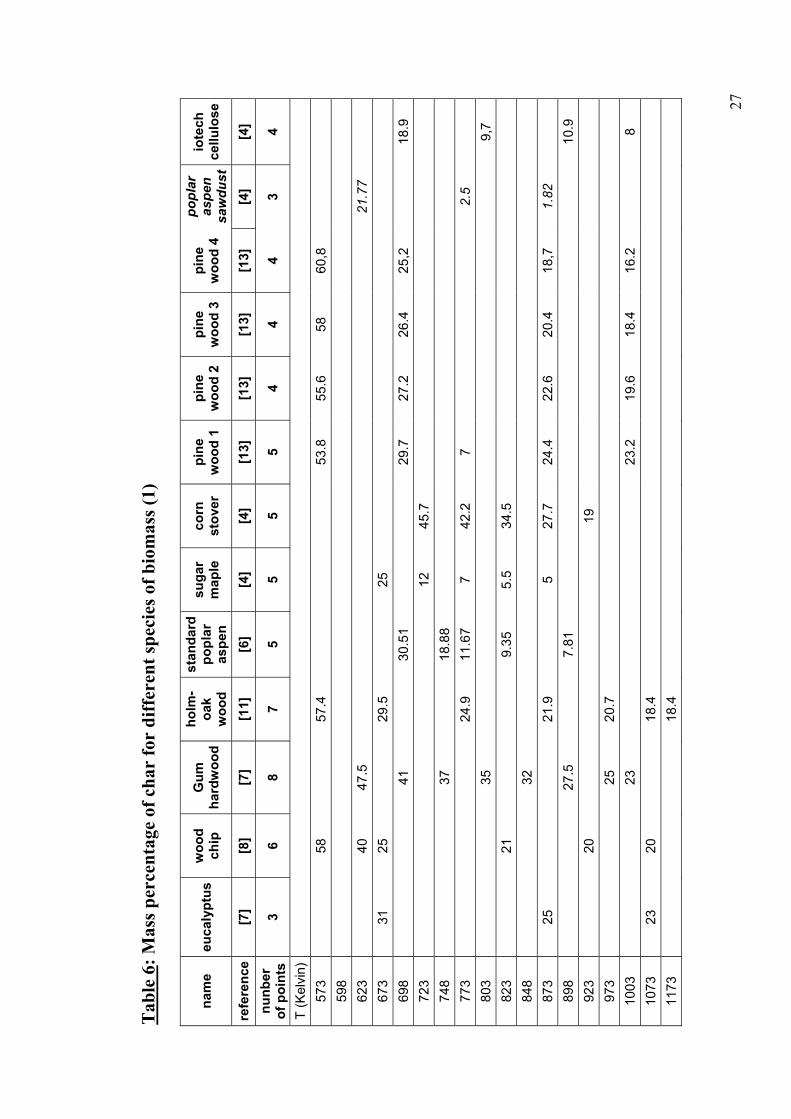
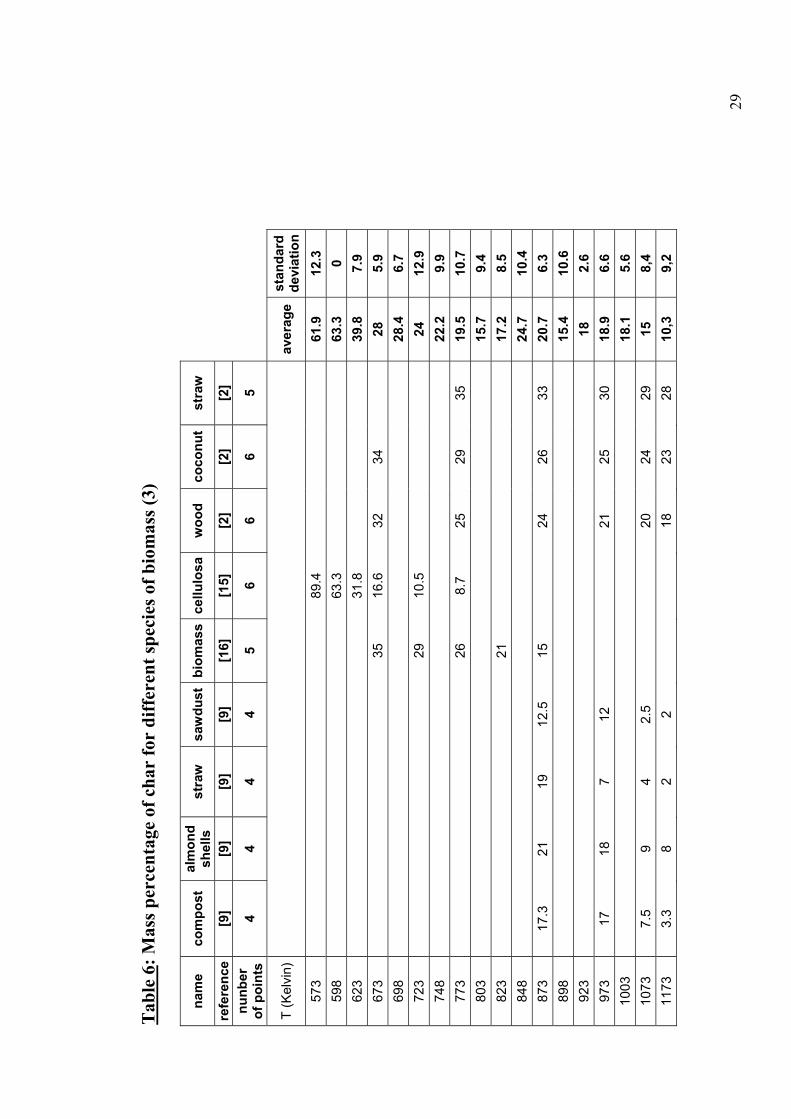
More data are available for char (see Table 6). The amount of char formed during pyrolysis seems to decrease exponentially when the surrounding temperature increases (see Figure 5).
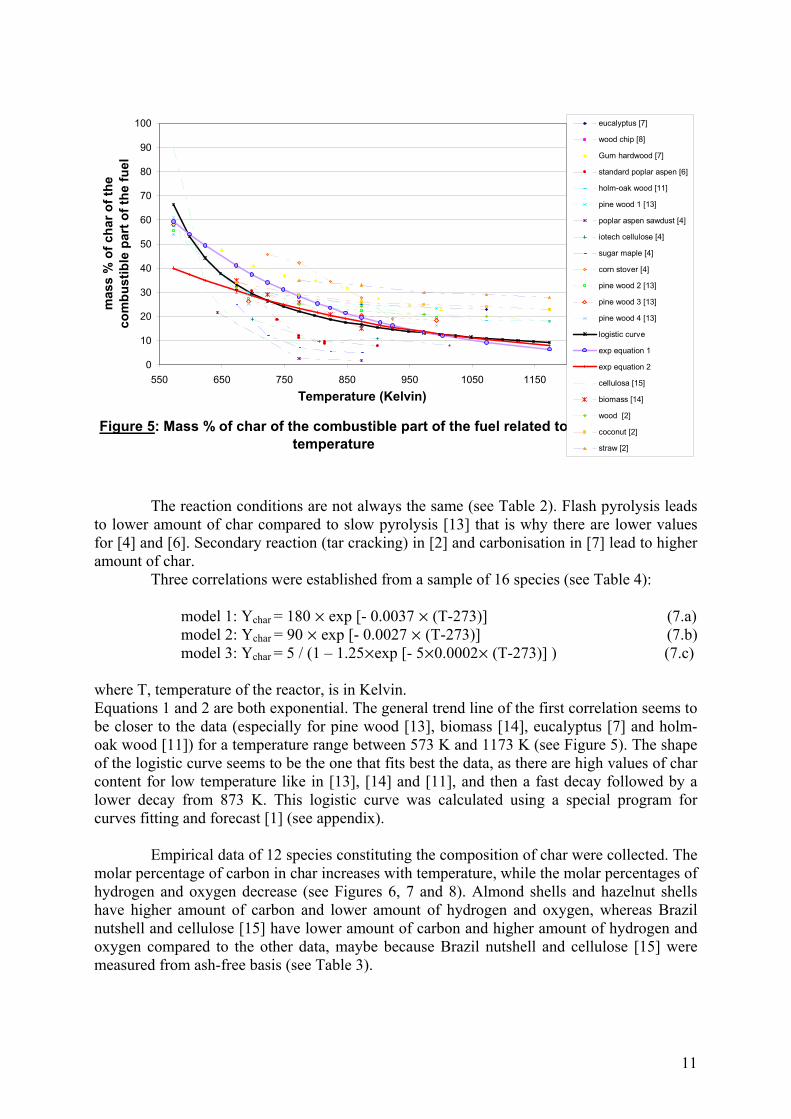
11
Figure 5: Mass % of char of the combustible part of the fuel related to temperature
0
10
20
30
40
50
60
70
80
90
100
550 650 750 850 950 1050 1150
Temperature (Kelvin)
mas
s %
of c
har o
f the
co
mbu
stib
le p
art o
f the
fuel
eucalyptus [7]
wood chip [8]
Gum hardwood [7]
standard poplar aspen [6]
holm-oak wood [11]
pine wood 1 [13]
poplar aspen sawdust [4]
iotech cellulose [4]
sugar maple [4]
corn stover [4]
pine wood 2 [13]
pine wood 3 [13]
pine wood 4 [13]
logistic curve
exp equation 1
exp equation 2
cellulosa [15]
biomass [14]
wood [2]
coconut [2]
straw [2]
The reaction conditions are not always the same (see Table 2). Flash pyrolysis leads to lower amount of char compared to slow pyrolysis [13] that is why there are lower values for [4] and [6]. Secondary reaction (tar cracking) in [2] and carbonisation in [7] lead to higher amount of char.
Three correlations were established from a sample of 16 species (see Table 4):
model 1: Ychar = 180 µ exp [- 0.0037 µ (T-273)] (7.a) model 2: Ychar = 90 µ exp [- 0.0027 µ (T-273)] (7.b) model 3: Ychar = 5 / (1 – 1.25µexp [- 5µ0.0002µ (T-273)] ) (7.c)
where T, temperature of the reactor, is in Kelvin. Equations 1 and 2 are both exponential. The general trend line of the first correlation seems to be closer to the data (especially for pine wood [13], biomass [14], eucalyptus [7] and holm-oak wood [11]) for a temperature range between 573 K and 1173 K (see Figure 5). The shape of the logistic curve seems to be the one that fits best the data, as there are high values of char content for low temperature like in [13], [14] and [11], and then a fast decay followed by a lower decay from 873 K. This logistic curve was calculated using a special program for curves fitting and forecast [1] (see appendix).
Empirical data of 12 species constituting the composition of char were collected. The
molar percentage of carbon in char increases with temperature, while the molar percentages of hydrogen and oxygen decrease (see Figures 6, 7 and 8). Almond shells and hazelnut shells have higher amount of carbon and lower amount of hydrogen and oxygen, whereas Brazil nutshell and cellulose [15] have lower amount of carbon and higher amount of hydrogen and oxygen compared to the other data, maybe because Brazil nutshell and cellulose [15] were measured from ash-free basis (see Table 3).

12
Once again, three models fitting the empirical data for carbon content were found:
model 1: X’C,char = 0.069 µ (T-273) + 28.38 (8.a) model 2: X’C,char = 98 µ (1- 0.7 µ exp [- 0.0018 µ (T-273)] ) (8.b) model 3: X’C,char = 98 / (1+ exp [-98 µ 0.00035 µ (T-273)] ) (8.c)
where T, the temperature of the reactor, is in Kelvin. The first model is linear, it fits the data correctly (see Figure 6), but it doesn’t correspond to reality, the carbon content can’t be higher than 100 %. The second model is exponential, it seems better than the linear one as the growth slows down at high temperatures, but it doesn’t follow exactly the general shape of the data, this equation represents too high values. The third model seems to be the best one; it was made with the same program as for the amount of char [1-4], it fits correctly the data and has a mathematical asymptote at 100%.
Figure 6: Molar % of carbon in char related to temperature
0
10
20
30
40
50
60
70
80
90
100
250 350 450 550 650 750 850 950 1050 1150
Temperature (Kelvin)
mol
ar %
of c
arbo
n in
cha
r
eucalyptus [7]
wood 1 [17]
wood 2 [17]
olive stone [19]
raps [16]
Brazil nut shells
almond shells [18]
hazelnut shells[18]beech wood [18]
birch [21]
spruce [21]
cellulosa [15]
linear equation
exp equation
logistic curve
For the hydrogen content, two relations have been established (T is in kelvin): model 1: X’ H,char = - 0.048 µ (T-273) + 50 (9.a) model 2: X’ H,char = 53 µ exp [- 0.00177 µ (T-273)] (9.b)
Even if model 1 fits correctly the data, it doesn’t correspond to reality as it gives negative values for temperatures higher than 1173 K (see Figure 7). The second, which is exponential, also fits the data correctly, but it decreases slowly at high temperatures, so it is better.

13
Figure 7:Molar % of hydrogen in char related to temperature
0
10
20
30
40
50
60
70
80
90
100
250 450 650 850 1050
Temperature (Kelvin)
mol
ar %
of h
ydro
gen
in c
har
eucalyptus [7]
wood 1 [17]
wood 2 [17]
olive stone [19]
raps [16]
Brazil nut shells
almond shells [18]
hazelnut shells[18]beech wood [18]
birch [21]
spruce [21]
cellulosa [15]
linear equation
exp equation
For the oxygen content, only an exponential model, closer to reality, was studied (see Figure 8):
model : X’O,char = 25 µ exp [ - 0.0027 µ (T-273)] (10)
From the Figure 8, it is seen that spruce and birch [21] represent higher molar percentage of oxygen, but only two points were available, one at 273 K and one at 1173 K that is why it is represented by a linear relationship.

14
Figure 8: Molar % of oxygen in char related to temperature
0
5
10
15
20
25
30
35
40
45
50
250 450 650 850 1050
Temperature (Kelvin)
mol
ar %
of o
xyge
n in
cha
reucalyptus [7]
wood 1 [17]
wood 2 [17]
olive stone [19]
raps [16]
Brazil nut shells
almond shells[18]hazelnut shells[18]beech wood [18]
birch [21]
spruce [21]
cellulosa [15]
exp equation
5.4 Heating value of char No empirical data on char heating value were found, so models from the literature
were chosen. The first one relates the heating value to the amount of char [20]: Hchar = 16700 + 2930 / Ychar for Ychar > 0.7 (11.a)
Hchar = 34 000 for Ychar < 0.7 (11.b)
This expression is not very convenient, since if one of the relations found for the amount of char (7) is used; from a temperature of 973 K, the heating value of char remains constant at 34 MJ/kg. So, another one from literature, which is related with the composition of char, was used [22]: HHV = 318.1 XC,char + 142.3 X H,char + 154 XO,char (12) This equation shows the advantage of using other general equations (8.c), (9.b) and (10) which are quite reliable.
5.5 Heat of devolatilisation The heat of devolatilisation (Hdevol) is generally taken to be equal to -200 kJ/kg at the
temperature of devolatilisation. Devolatilisation occurs in the temperature range 700- 900 K [20]. The literature values are generally given at the temperature of devolatilisation but it can be interesting to calculate the heating value of devolatilisation related to the reference temperature (273 K):
H±devol = Hdevol + ∫Tdev
Tref( cp,wood – ( Ychar + Yash ) µ cp,char – cp,vol ) dT (13)

15
To calculate this heating value, the amount of ash (Yash), char (Ychar) and the specific heat of wood (cp,wood), char (cp,char), and volatiles (cp,vol) are necessary. The amount of ash is known as it is an input data and the amount of char is calculated with equation (7.c). For the specific heat of wood, one of these three relations [20], which give nearly the same result, can be used: cp,wood = 4.206 T -37.7 (14.a) cp,wood = 4.607 T -132.8 (14.b) cp,wood = 3.867 T + 103.1 (14.c) For char, one of these two can be chosen, as they also give the same trend line: [20] cp,char = -334 + 4.41 T – 3160.10-6 T2 + 1010.10-9 T3 – 119.10-12 T4 (15.a) [23] cp,char = 420 + 2.09 T – 6.85.10-4 T2 (15.b) For the volatile gases, the specific heat is estimated from the composition of the volatile gases given in literature [20]: cp,vol = S gi cp,i where S gi =1 (16) if the volatile gases are assumed to be composed of light hydrocarbons, carbon monoxide, carbon dioxide, vapour of water, hydrogen and lumped hydrocarbons.
5.6 Heating value of volatile gases The heating value of wood can be divided into two parts: one belonging to the char,
on to the volatiles (including the heat of devolatilisation) [20]:
Hwood = Ychar µ Hchar + ( Yvol Hvol – H±devol) (17)
Consequently, the heating value of volatiles can be deduced easily:
Hvol = ( Hwood - Ychar µ Hchar + H±devol ) / (1-Ychar ) (18)
The heating value of wood (Hwood) is an input value. The amount of char (Ychar) can be calculated with the equation (7.c). The heating value of char is given by equation (12) and the heat of devolatilisation by equation (13).
6. Discussion
In this part, the purpose is to check the equations found, in order to determine their validity for a large variety of biomass materials.
6.1 Composition of tar Apparently, the composition of tar doesn’t vary with the temperature, so these values
can be compared with others from literature. In literature [20], the composition of lumped hydrocarbons is given as C6H6.2-8O0.1-1. From the mass percentages found in the present work, C4.5H6.5O2.4 is obtained for tar. These compositions are quite similar, except for oxygen; the value found seems twice as high as the one we are supposed to find, but this value concerns
16
wood and not biomass in general. Thus, the mass percentages found just give an idea of the composition of tar.
However, the composition of tar cannot be expressed only as a function of temperature. The residence time and the heating rate of devolatilisation are also parameters that influence the tar composition. The best assumption that can be made is to consider the tar composition to be the same as that of wood for low temperature of devolatilisation, and the same as that of lumped hydrocarbons for high temperature of devolatilisation.
6.2 Heating value of tar If the values of carbon, hydrogen and oxygen in tar determined above are used
(equations 2, 3 and 4), a constant tar heating value of 21MJ/kg is obtained. This value is lower than that for lumped hydrocarbons (26MJ/kg – 40MJ/kg) [20]. However, there is not a great difference considering the approximation made for the mass percentages of tar composition; the amount is nearly the same. So, the correlation of Mason and Gandhi found in literature can be retained.
6.3 Composition of char Once the equations (8), (9) and (10) for char composition were found, data
concerning the composition of other types of biomass can be found in literature (see Table 4). On the Figures 9, 10 and 11, the data of Table 7 are represented together with the general equation found for char composition (equations 8.c, 9.b and 10). The equations established just fit correctly a part of the data ([2] and [11]). Flash pyrolysis in [4], [6] and [12] lead to lower amount of char, so it may explain why these values have such a low carbon molar percentage and so high hydrogen and oxygen molar percentage. Furthermore, the data of [7] and [15] were measured from ash-free basis. However, some of the data may be not very significant, as only few points are available in a narrow temperature range 673- 823 K. Thus, the equations (8.c, 9.b and 10) can be considered to be correct for a large variety of biomass.

17
Figure 9: Comparison with the equation found for the mass % of carbon in char
0
20
40
60
80
100
120
500 600 700 800 900 1000 1100 1200Temperature (Kelvin)
mas
s %
of C
arbo
nhybrid poplar aspen [6]
wheat straw [6]
standard poplar aspen[6]holm-oak wood [11]
Gum hardwood [7]
mixed wood waste [12]
cellulosa [15]
poplar-aspen with limeadded [4]wood [2]
coconut [2]
straw [2]
% Carbon model
Figure 10: Comparison with the equation found for the mass % of Hydrogen in char
0
1
2
3
4
5
6
7
8
9
10
500 600 700 800 900 1000 1100 1200Temperature (Kelvin)
mas
s %
of H
ydro
gen
hybrid poplar aspen [6]
wheat straw [6]
holm-oak wood [11]
standard poplar aspen[6]Gum hardwood [7]
mixed wood waste [12]
cellulosa [15]
poplar-aspen with limeadded [4]wood [2]
coconut [2]
straw [2]
% Hyfrogen model

18
Figure 11: Comparison with the equation found for the mass % of Oxygen in char
0
10
20
30
40
50
60
70
80
90
100
500 600 700 800 900 1000 1100 1200
Temperature (Kelvin)
mas
s %
of O
xyge
n hybrid poplar aspen [6]
wheat straw [6]
standard poplar aspen[6]holm-oak wood [11]
Gum hardwood [7]
mixed wood waste [12]
cellulosa [15]
poplar-aspen with limeadded [4]wood [2]
coconut [2]
straw [2]
% Oxygen model
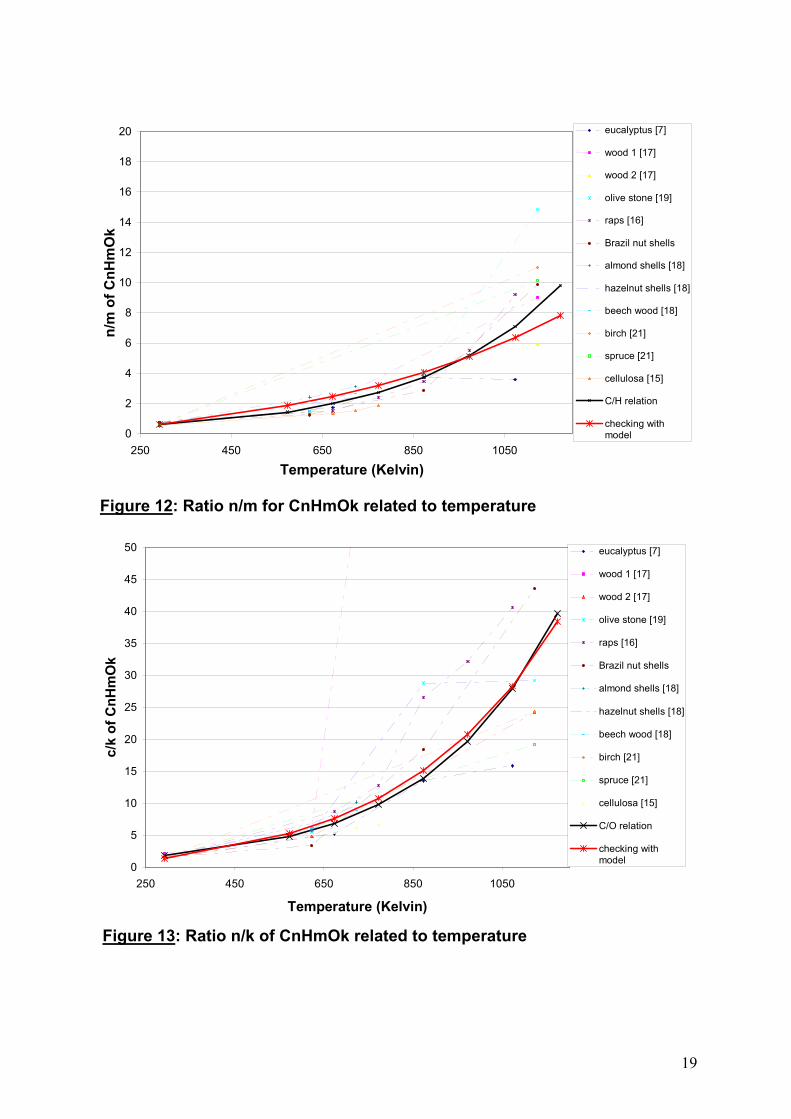
Another manner to check the validity is to work with the molar ratios of carbon to
hydrogen and carbon to oxygen, as usually it is another manner to work. A sufficient range of species of biomass is available for the composition of char (Table 3). So, equations which relate these two ratios with the temperature can be found. The correlations established are (see Figures 12 and 13):
charH
charC
XX
,
,
'´ = 0.55 µ exp [ 0.0032 µ (T-273)] (19)
charO
charC
XX
,
,
'' = 1.7 µ exp [ 0.0035 µ (T-273)] (20)
The relations found by making the quotient of equations (8.c) and (9.b), and the quotient of equations (8.c) and (10) can be graphically compared with curves drawn from the relationships (19) and (20). The comparisons are found in the Figures 12 and 13. For some species, not enough points (sometimes just two for birch and spruce [21]) were available, that is why some results seem not to follow the general trend line. However, the two curves are nearly similar; so the correlations established (8.c, 9.b and 10) are once again validated.
19
Figure 12: Ratio n/m for CnHmOk related to temperature
0
2
4
6
8
10
12
14
16
18
20
250 450 650 850 1050
Temperature (Kelvin)
n/m
of C
nHm
Ok
eucalyptus [7]
wood 1 [17]
wood 2 [17]
olive stone [19]
raps [16]
Brazil nut shells
almond shells [18]
hazelnut shells [18]
beech wood [18]
birch [21]
spruce [21]
cellulosa [15]
C/H relation
checking withmodel
Figure 13: Ratio n/k of CnHmOk related to temperature
0
5
10
15
20
25
30
35
40
45
50
250 450 650 850 1050
Temperature (Kelvin)
c/k
of C
nHm
Ok
eucalyptus [7]
wood 1 [17]
wood 2 [17]
olive stone [19]
raps [16]
Brazil nut shells
almond shells [18]
hazelnut shells [18]
beech wood [18]
birch [21]
spruce [21]
cellulosa [15]
C/O relation
checking withmodel
20
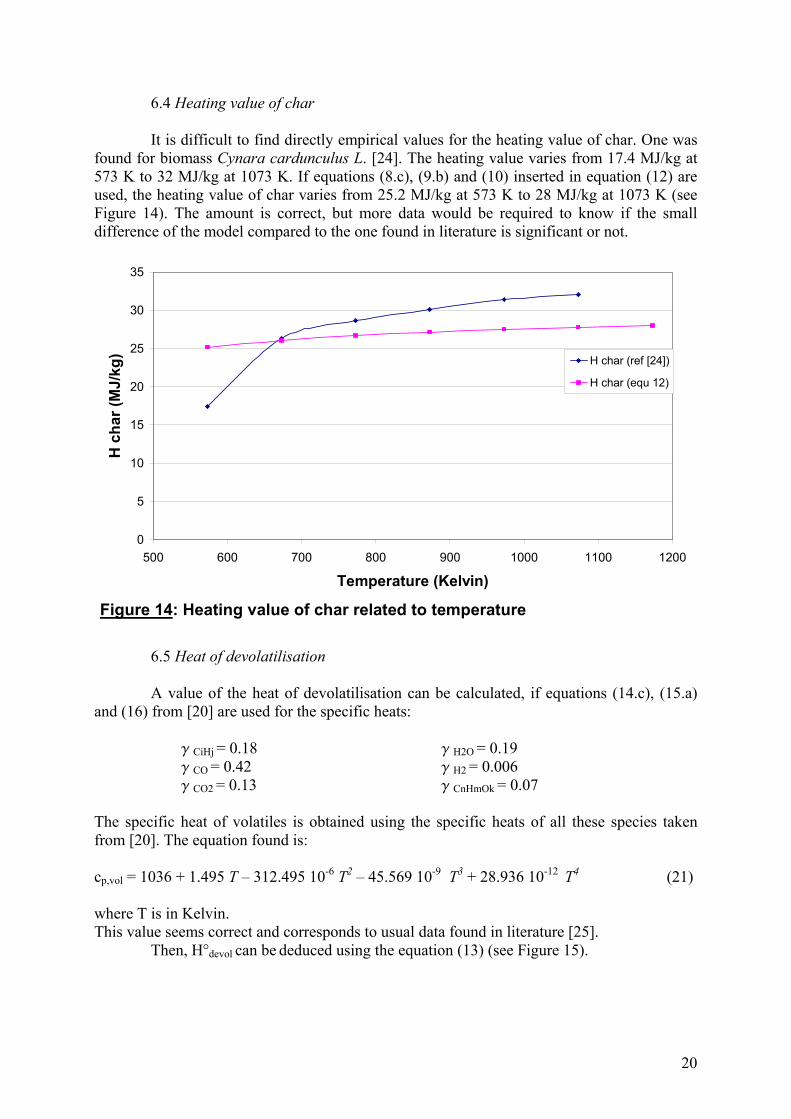
6.4 Heating value of char It is difficult to find directly empirical values for the heating value of char. One was
found for biomass Cynara cardunculus L. [24]. The heating value varies from 17.4 MJ/kg at 573 K to 32 MJ/kg at 1073 K. If equations (8.c), (9.b) and (10) inserted in equation (12) are used, the heating value of char varies from 25.2 MJ/kg at 573 K to 28 MJ/kg at 1073 K (see Figure 14). The amount is correct, but more data would be required to know if the small difference of the model compared to the one found in literature is significant or not.
Figure 14: Heating value of char related to temperature
0
5
10
15
20
25
30
35
500 600 700 800 900 1000 1100 1200
Temperature (Kelvin)
H c
har (
MJ/
kg) H char (ref [24])
H char (equ 12)
6.5 Heat of devolatilisation A value of the heat of devolatilisation can be calculated, if equations (14.c), (15.a)
and (16) from [20] are used for the specific heats:
g CiHj = 0.18 g H2O = 0.19 g CO = 0.42 g H2 = 0.006 g CO2 = 0.13 g CnHmOk = 0.07
The specific heat of volatiles is obtained using the specific heats of all these species taken from [20]. The equation found is: cp,vol = 1036 + 1.495 T – 312.495 10-6 T2 – 45.569 10-9 T3 + 28.936 10-12 T4 (21) where T is in Kelvin. This value seems correct and corresponds to usual data found in literature [25].
Then, H±devol can be deduced using the equation (13) (see Figure 15).

21
Figure 15: Heat of devolatilization at 273 K (T ref) considering different temperature of devolatilization
-250,0
-200,0
-150,0
-100,0
-50,0
0,0
50,0
100,0
700 720 740 760 780 800 820 840 860 880 900
Temperature of devolatilization (Kelvin)
Ho d
evol
(kJ/
kg)
Hd l
If devolatilisation is considered to occur between 700 and 900 K and if the heat
(Hdevol) keeps a constant value in this temperature range, the heat of devolatilisation at the reference temperature (H±devol) increases from -186 kJ/kg at 700 K to 59.5 kJ/kg at 900 K. These results seem strange in first sight, as usually H±devol is not so far from Hdevol.
6.6 Heating value of volatiles Using the models established in this report for Ychar (7.c), Hchar (12) and H±devol (13),
the heating value of volatiles can be determined using the equation (18). It varies from 13.8 MJ/kg at 673 K to 18.6MkJ/kg at 973 K (see Figure 16). These values can be compared with those of literature. The gas mixture generated by the pyrolysis of Cynara cardunculus L. [24] has a medium-low heating value between 6.91 MJ/m3
n at 673 K and 12.57 MJ/m3n at 973 K.
To compare these two values, the units should be the same. The density of volatiles can be calculated using the mass ratios gi in [20] and the density of each gas, ri:
rvol = S ri µ gi (22)
ri = Mi / Vm (23) Vm = Voµ T / To (24)
where Mi is the molar mass of the component and Vm is the molar volume calculated with the equation (24) according to the gas temperature T in Kelvin [20]. This gives a heating value of gas for Cynara cardunculus L. [24], which varies between 11.1 MJ/kg at 673 K and 20.3 MJ/kg at 973 K. So, the values found using the equations (18) of this report are correct.

22
Figure 16: Heating value of volatiles related to the temperature of devolatilization
0
5
10
15
20
25
30
650 700 750 800 850 900 950 1000
Temperature of devolatilization (Kelvin)
H v
ol (M
J/kg
)
H vol calculated [MJ/kg]
H vol (reference [24]) [MJ/kg of gas]
7. Conclusion
The purpose of this work is to find general equations expressing biomass properties. Only temperature dependence has been taken in account. A large amount of empirical data were collected, and curve fitting was used to find these equations. The equations found for the amount of tar (1), the heating value of tar (5), the amount of char (7.c), the composition of char (8.c), (9.b), (10) and the heating value of char (12) can be considered as reliable and have been checked in Section 4 as being valid for a large variety of biomass. However, more information would have been necessary to determine if the values obtained with the equation (13) for heat of devolatilisation and (17) for heating value of volatiles are in accordance with the reality or not. At last, the lack of data found for the composition of tar prevents from finding accurate models, equations (2), (3) and (4) which show a relationship with temperature.
In a future work, it could be interesting to try to improve some of these models finding more empirical data for the composition of tar related to the temperature, and to establish general equations from empirical data for the heating values of char and tar. It should be a good thing too, to study the influence of other parameters such as the size of the particle, the heating rate and the type of wood or biomass on these properties, to see if the temperature remains the main parameter. Thus, new models which include not only the temperature dependence could be built.

23
Nomenclature: cp [J/kg.K]: specific heat (related to subscript) H [kJ/kg]: lower heating value (related to subscript) HHV [kJ/kg]: high heating value (related to subscript) M [kg/mol]: molar mass m3
n [-]: normal m3 (at 273 K and 101325 Pa) T [K]: temperature T* [-]: dimensionless temperature To [K]: reference temperature (273 K) Vo [m3/mol]: molar volume at To (0.0224 m3/mol) Vm [m3/mol]: molar volume at T X [-]: mass fraction based on ash-free substance X’ [-]: molar fraction based on ash-free substance Y [-]: mass fraction based on dry ash-free wood Greek Ω [-]: mass ratio of two gas species in the volatiles gases gi [-]: mass fraction in the volatile gases Subscript C, H, O: carbon, hydrogen, oxygen CiHj: light hydrocarbons CnHmOk: lumped hydrocarbons ash: ash char: char dev: devolatilisation i: species vol: volatiles wood: dry wood References: [1] G. Maldonado, The Logistic Growth Curve, Reviewed, Programmed and its application to energy forecasting, (in Spanish), Report EEQ88-01, CTH, Energy conversion Department, Chalmers, Sweden,1988, 5-6 [2] L. Fagbemi, L. Khezami, R. Capart, Pyrolysis products from different biomasses: application to the thermal cracking of tar, Applied Energy, 2001, 69, 293-306 [3] T. R. Nunn, J.B. Howard, J.P. Longwell, W. A. Peters; Product Compositions and Kinetics in the Rapid Pyrolysis of Sweet Gum Hardwood, Ind. Eng. Chem. Process Des. Dev., 1985, 24, 3, 836-844 [4] D. Scott, J. Piskorz, D. Radlein; Liquid Products from the Continuous Flash Pyrolysis of Biomass, Ind. Eng. Chem. Process Des. Dev., 1985, 24, 581-588 [5] D. Scott, J. Piskorz; The Flash Pyrolysisof Aspen-Poplar Wood, The Canadian Journal of Chemical Engineering, 1982, 60, 666-674 [6] D. Scott, J. Piskorz; The Continous Flash Pyrolysis of Biomass, The Canadian Journal of Chemical Engineering, 1984, 62, 404-412

24
[7] N. Tancredi, T. Cordero, J. Rodrìguez-Mirasol, J. J. Rodrìguez; Activated carbons from Uruguayan eucalyptus wood, Fuel, 1996, 75, 15, 1701-1706 [8] C. Di Blasi, G. Signorelli, C. Di Russo, G. Rea; Product Distribution from Pyrolysis of Wood and Agricultural Residues, Ind. Eng. Chem. Res., 1999, 38, 2216-2224 [9] R. El Asri, J. De Ruyck, J. Arauzo, G. Gea; Fluidized Bed Flash Pyrolysis of Biomass,121-127 [10] J. Piskorz, D. S. Scott, D. Radlein; Chapter 16, Composition of Oils Obtained by Fast Pyrolysis of Different Woods, In: Pyrolysis Oils from Biomass, Producing, Analyzing and Upgrading, Ed J Soltes, Thomas A. Milne, American Chemical Society, Washington, DC, 1988, 168-169 [11] J. L. Figueiredo, C. Valenzuela, A. Bernalte, J. M. Encinar; Pyrolysis of holm-oak wood : influence of temperature and particle size, Fuel, 1989, 68, 1012-1016 [12] P. A. Horne, P. T. Williams; Influence of temperature on the products from the flash pyrolysis of biomass, Fuel, 1996, 75, 9, 1051-1059 [13] P. T. Williams, S. Besler; The Influence of Temperature and Heating rate on the Slow Pyrolysis of Biomass, Renewable Energy, 1996, 7, 3, 233-250 [14] M. Nurul Islam, R. Zailani, F. Nasir Ani, Pyrolytic oil from fluidised bed pyrolysis of oil palm shell and its characterisation, Renewable Energy, 1999, 17, 73-84 [15] The late Fred Shafizadeh, Pyrolytic Reactions and Products of Biomass, Wood Chemistry Laboratory, University of Montana, Missoula, Montana, USA [16] F. Karaosmanoglu, A. Igigigur-Ergudenler, A. Sever; Biochar from the Straw-Stalk of Rapeseed Plant, Energy Fuels, 2000, 14, 2, 336-339 [17] P. A. Della Rocca, E. G. Cerrella , P. R. Bonelli, A. L. Cukierman; Pyrolysis of hardwoods residues: on kinetics and chars characterisation, Biomass and Bionenergy, 1999, 16, 79-88 [18] S. Balci, T. Dogu, H. Yucel, Pyrolysis Kinetics of Lignocellulosic Materials, Ind. Eng. Chem. Res., 1993, 32, 2573-2579 [19] P.A. Della Rocca, G. I. Horowitz, P.R. Bonelli, C. Cassanello, A.L. Cukierman; Olive Stones Pyrolysis: Chemical, Textural and Kinetics Characterisation, In: Developments in Thermochemical Biomass Conversion, Vol 1, Bridgwater A.V., Boocock D.G.B., Blackie Academic & Professional, an imprint of Chapman & Hall, 2-6 Boundary Row, London SEI 8HN, UK [20] H. Thunman, F. Niklasson, F. Johnsson, B. Leckner; Composition of Volatiles Gases and Thermochemical Properties of Wood for Modelling of Fixed or Fluidized Beds, Energy & Fuels, 2001, 15, 1488-1497 [21] Experimental work of Mathias Johansson, SP Swedish National Testing and Research Institute, Borås, Sweden, 2001 [22] A. Demirbas, Properties of charcoal derived from hazelnut shell and the production of briquettes using pyrolytic oil, Energy, 1999, 24, 141-150 [23] K. M. Hansson, B. Leckner, J. Samuelsson, H. Persson, C. J. Tullin, Carbon Release from Biomass Pellets-Experiments and Modelling, Nordic Seminar on Small Scale Wood Combustion, 17-18 February, 2000, Nådendal, Finland, 1-9 [24] J.M. Encinar, J.F. Gonzàlez, J. Gonzàlez; Fixed-bed pyrolysis of Cynara cardunculus L. Products yields and compositions, Fuel Processing Technology, 2000, 68, 209-222 [25] K.M. Hansson, Pyrolysis of Large Particles of biomass- Experiments and Modelling, Thesis for the degree of licentiate of engineering, Department of Energy Conversion, Chalmers University of Technology, Göteborg, Sweden, 2000

25
Appendix:
1. Curve fitting Curve fitting expresses the relationship that exists between two (or more) variables in
a mathematical form. To determine an equation that connects the variables, the first step is to plot the values on a rectangular coordinate system. The resulting set of values, often called a scatter diagram, is visualized in a smooth curve that approximates the data - the approximate curve. The resulting curve is called a regression curve of Y on X, since Y is estimated from X.
2. program for curves fitting and forecast [4] This program is a combination of regression – for the curve fitting - and a Fibonacci
search for forecasting to the equation below. The structure of the part of the program for regression is very flexible and permits to be used with any type of data. In this application, only this part of the program was used. The function is defined by a differential equation; there are two cases according to the growth or the decay of the experimental data:
( )aYbdT
dYY
charchar
char−×=⋅1 a>Ychar (9.a)
( )charchar
charYab
dTdY
Y−×=⋅1 a<Ychar (9.b)
where a is the minimum or the maximum value of the sample, and b is a constant, proportional to the quotient of the variation of the amount of char and of the difference between the constant a and the temperature at the same point. If these equations are integrated, two solutions are obtained:
)exp(1 baTAaYchar
−⋅+= a>Ychar (10.a)
)exp(1 baTAaYchar
−⋅−= a<Ychar (10.b)
where A is the constant of the integration. These results can be written as:
baTAY
achar
−=
− ln1ln a>Ychar (11.a)
baTAY
achar
−=
− ln1ln a<Ychar (11.b)
For each empirical value (T, Ychar), this program creates the corresponding point (Ti, Ychar i),
calculating Ti,
−1ln
charYa or Ti,
−
charYa1ln .

26
Tab
le 5
: mas
s per
cent
age
of ta
r fo
r di
ffer
ent s
peci
es o
f bio
mas
s
nam
e po
plar
-as
pen
saw
dust
gu
m
hard
woo
d as
pen
popl
ar
woo
d
aspe
n po
plar
ba
rk
corn
st
over
iote
ch
cellu
lose
suga
r m
aple
whe
at
stra
w
baga
sse
IEA
st
anda
rd
popl
ar
aspe
n
hybr
id
popl
ar-
aspe
n w
ood
coco
nut
stra
w
ref
[5]
[3]
[4]
[4]
[4]
[4]
[4]
[4]
[4]
[6]
[6]
[2]
[2]
[2]
num
ber
of p
oint
s 5
3 5
5 5
4 5
4 4
5 3
6 6
5
T (K
elvi
n)
aver
age
stan
dard
de
viat
ion
673
47
36
21
19
30.7
5 13
.23
698
46
.9
26
.3
36.6
14
.57
723
50.8
56
38
19.9
55
50
30
.69
20.9
7
40.1
7 14
.9
773
58.9
22
.9
54
40
25.5
56
35
58
24.7
2 37
.79
35
21
21
37.6
8 14
.65
823
55.1
50
36
29.7
50
.4
51
42
44
28.3
6 25
.41
41
.2
10.7
1 87
3 45
.5
39
31
29
.4
38
42
37
29
18
16
32
.49
9.77
89
8
52.5
41.4
37.8
43
.9
7.66
92
3 35
.9
25
22
32
28.7
3 6.
36
973
19
10
14
14
.33
4.51
10
14
29
29
0
1073
10
5 9
8 2.
65
1173
8 3
5 5.
33
1.41
13
55
50
.2
50.2
0
27
Tab
le 6
: Mas
s per
cent
age
of c
har
for
diff
eren
t spe
cies
of b
iom
ass (
1)
nam
e eu
caly
ptus
w
ood
chip
G
um
hard
woo
d ho
lm-
oak
woo
d
stan
dard
po
plar
as
pen
suga
r m
aple
co
rn
stov
er
pine
w
ood
1 pi
ne
woo
d 2
pine
w
ood
3 pi
ne
woo
d 4
popl
ar
aspe
n sa
wdu
st
iote
ch
cellu
lose
refe
renc
e [7
] [8
] [7
] [1
1]
[6]
[4]
[4]
[13]
[1
3]
[13]
[1
3]
[4]
[4]
nunb
er
of p
oint
s 3
6 8
7 5
5 5
5 4
4 4
3 4
T (K
elvi
n)
573
58
57.4
53.8
55
.6
58
60,8
59
8
623
40
47
.5
21.7
7
673
31
25
29
.5
25
698
41
30
.51
29.7
27
.2
26.4
25
,2
18
.9
723
12
45
.7
748
37
18
.88
773
24
.9
11.6
7 7
42.2
7
2.
5
803
35
9,
7 82
3
21
9.35
5.
5 34
.5
848
32
873
25
21.9
5 27
.7
24.4
22
.6
20.4
18
,7
1.82
898
27.5
7.81
10.9
92
3
20
19
973
25
20.7
1003
23
23
.2
19.6
18
.4
16.2
8 10
73
23
20
18
.4
11
73
18
.4

28
Tab
le 6
: Mas
s per
cent
age
of c
har
for
diff
eren
t spe
cies
of b
iom
ass (
2)
nam
e br
ockv
ille
popl
ar
red
map
le
hybr
id
popl
ar
aspe
n w
hite
sp
ruce
ie
a po
plar
m
aple
1m
aple
2m
ixed
w
ood
was
te
whe
at
stra
w
whe
at
stra
w 2
gr
ape
ston
es
oliv
es
ston
es
rice
husk
s
refe
renc
e [1
0]
[10]
[6
] [1
0]
[10]
[6
] [6
] [1
2]
[6]
[4]
[9]
[9]
[9]
nunb
er
of p
oint
s 2
2 3
3 1
1 3
4 4
4 4
4 4
T (K
elvi
n)
573
59
8
623
67
3
24.1
698
72
3
25
.46
21.4
748
16
.3
16.6
5
77
3 15
.45
12.9
13
.21
12.2
10
.53
10
.92
18.9
22
.13
37
80
3
9
12.3
13,8
9.
57
20
.51
823
10.6
10,6
4
17
.03
19.1
3 23
848
17.3
87
3
18
24
25
12.5
89
8
923
15
973
22.5
17
.5
11
1003
1073
18
11
8
1173
11
7
3
29
Tab
le 6
: Mas
s per
cent
age
of c
har
for
diff
eren
t spe
cies
of b
iom
ass (
3)
nam
e co
mpo
st
alm
ond
shel
ls
stra
w
saw
dust
bi
omas
s ce
llulo
saw
ood
coco
nut
stra
w
refe
renc
e [9
] [9
] [9
] [9
] [1
6]
[15]
[2
] [2
] [2
]
nu
nber
of
poi
nts
4 4
4 4
5 6
6 6
5
T (K
elvi
n)
aver
age
stan
dard
de
viat
ion
573
89
.4
61
.9
12.3
59
8
63.3
63.3
0
623
31
.8
39
.8
7.9
673
35
16.6
32
34
28
5.9
698
28
.4
6.7
723
29
10.5
24
12.9
74
8
22.2
9.
9 77
3
26
8.
7 25
29
35
19
.5
10.7
80
3
15.7
9.
4 82
3
21
17
.2
8.5
848
24
.7
10.4
87
3 17
.3
21
19
12.5
15
24
26
33
20.7
6.
3 89
8
15.4
10
.6
923
18
2.
6 97
3 17
18
7
12
21
25
30
18.9
6.
6 10
03
18
.1
5.6
1073
7.
5 9
4 2.
5
20
24
29
15
8,
4 11
73
3.3
8 2
2
18
23
28
10
,3
9,2

30
Tab
le 7
: Mas
s per
cent
age
of c
har
com
pone
nts f
or d
iffer
ent s
peci
es o
f bio
mas
s (1)
nam
e G
um h
ardw
ood
mix
ed w
ood
was
te
stan
dard
pop
lar
aspe
n ho
lm-o
ak w
ood
hybr
id p
opla
r as
pen
cellu
losa
num
ber o
f po
ints
2
4 5
7 3
6
ref
[7]
[7]
[6]
[11]
[6
] [1
5]
mas
s %
of
com
pone
nts
C %
H
%
O %
C
%
H %
O
%
C %
H
%
O %
C
%
H %
O
%
C %
H
%
O %
C
%
H %
O
%
T (k
elvi
n)
573
58
.5
5 36
.5
44
6.
4 49
.6
598
47
.9
6 46
.1
610
50.1
6.
2 42
.2
62
3
59.9
5.
2 34
.9
673
68
.1
3.23
28
.2
73
.8
3.4
22.8
76.5
4.
7 18
.8
698
55.1
3 5.
48
39.3
9
723
71
.9
3.16
24
.2
53.8
4 4.
83
41.3
378
.8
4.3
16.9
73
8
59
.28
5.25
35
.47
77
3
73
3.17
22
.9
66.7
7 3.
9 29
.33
80.2
2.
4 17
.4
60.2
2 2.
97
36.8
180
.4
3.6
16
793
810
51.5
6.
1 39
.7
81
4
69
.99
2.8
27.2
1
823
71
.6
2.65
24
.,4
848
873
82
.2
1.6
16.2
59
.77
2.81
37
.42
89
8
72
.45
6.49
21
.06
97
3
84.8
1.
3 13
.9
1073
87.2
0.
8 12
11
73
89
.2
0.6
10.2

31
Tab
le 7
: Mas
s per
cent
age
of c
har
com
pone
nts f
or d
iffer
ent s
peci
es o
f bio
mas
s (2)
nam
e po
plar
-asp
en w
ith
lime
adde
d w
heat
str
aw
woo
d co
conu
t st
raw
num
ber o
f po
ints
4
3 3
3 3
ref
[4]
[6]
[2]
[2]
[2]
mas
s %
of
com
pone
nts
C %
H
%
O %
C
%
H %
O %
C
%
H %
O %
C %
H
%
O %
C
%
H %
O %
T (k
elvi
n)
57
3
598
61
0
623
67
3 56
.87
4.94
38
.19
698
72
3 63
.93
4.35
31
.72
738
77
3 63
.1
3.62
33
.28
57.2
63.
17
39.5
7 88
.51
2.78
8.12
87.0
9 2.
6 8.
88
69.3
8 2.
23
9.82
79
3
57.7
72.
63
39.6
810
81
4
823
71.5
6 3.
28
25.1
6
84
8
55.0
12.
1 42
.89
87
3
898
97
3
93
.22
1.09
4.6
9.83
1.
05
5.71
71
.7
1.07
13
.12
1073
1173
93
.18
0.62
5.1
92.0
2 0.
7 5.
55
71.6
3 1.
15
9.86