General Circulation & Thermal Wind AOS 101 Lecture 11.
54
General Circulation & Thermal Wind AOS 101 Lecture 11
-
Upload
reynold-gaines -
Category
Documents
-
view
216 -
download
0
Transcript of General Circulation & Thermal Wind AOS 101 Lecture 11.

General Circulation & Thermal Wind
AOS 101
Lecture 11

General Circulation• What is the global picture?• The average flow on the globe...

General Circulation: Hadley Cell• Thermally-driven convection:
– Warm air rises and cold air sinks, creating circulation

General Circulation: 3 Cells• Hadley: Thermally driven circulation confined to tropics
• Ferrell: Mid-latitude circulation cell (subtropics to polar front)
• Polar: Sinking air at the poles
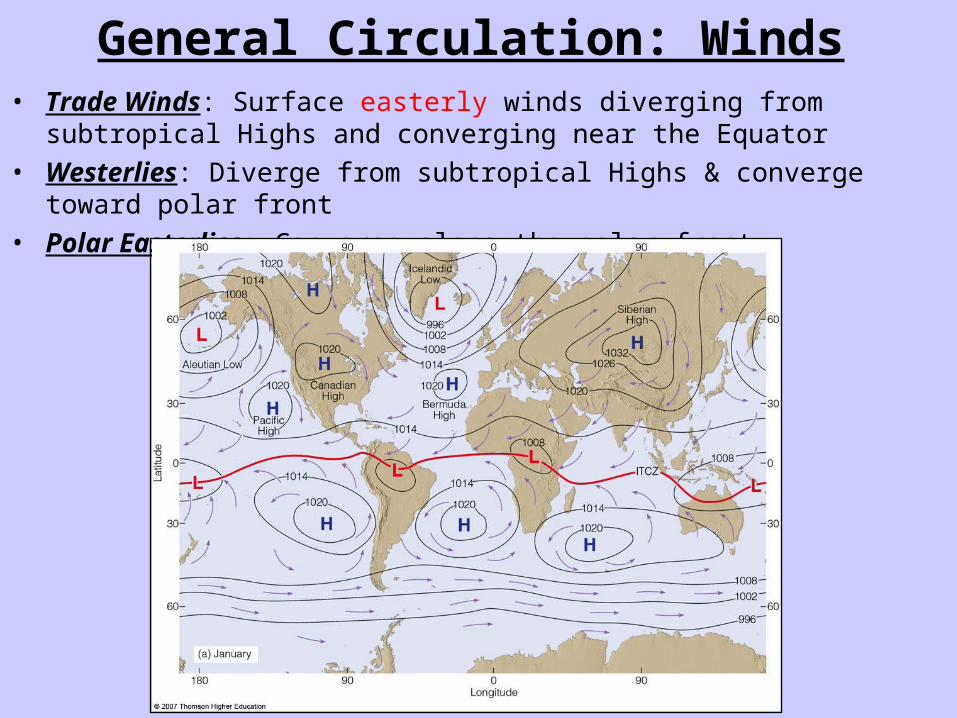
General Circulation: Winds• Trade Winds: Surface easterly winds diverging from subtropical Highs and
converging near the Equator
• Westerlies: Diverge from subtropical Highs & converge toward polar front
• Polar Easterlies: Converge along the polar front
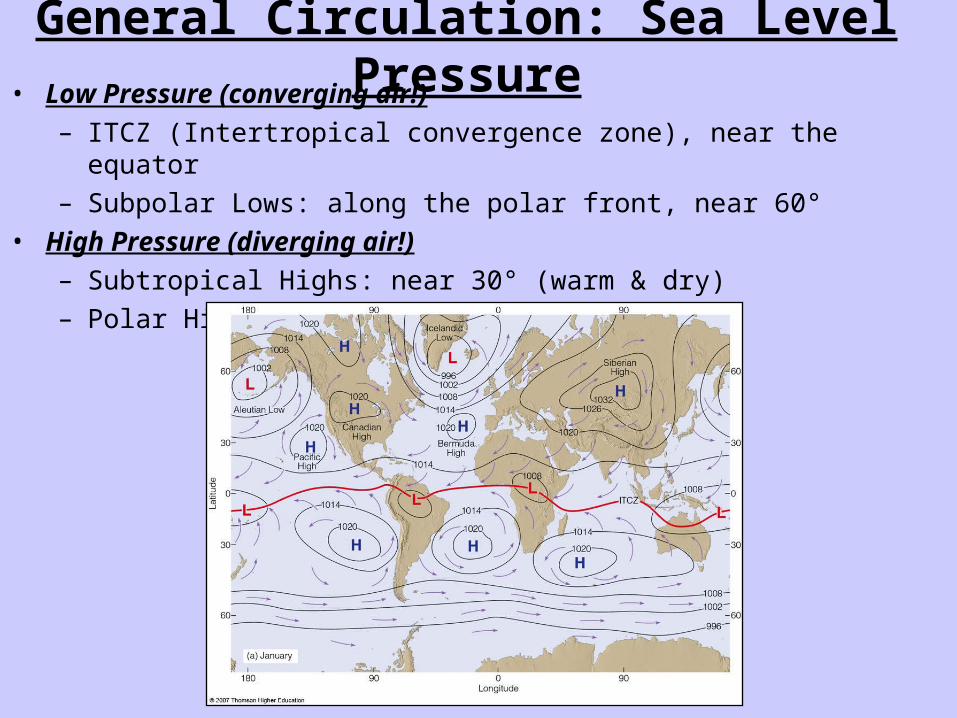
General Circulation: Sea Level Pressure• Low Pressure (converging air!)
– ITCZ (Intertropical convergence zone), near the equator
– Subpolar Lows: along the polar front, near 60°
• High Pressure (diverging air!)
– Subtropical Highs: near 30° (warm & dry)
– Polar High: at the pole (cold & dry)
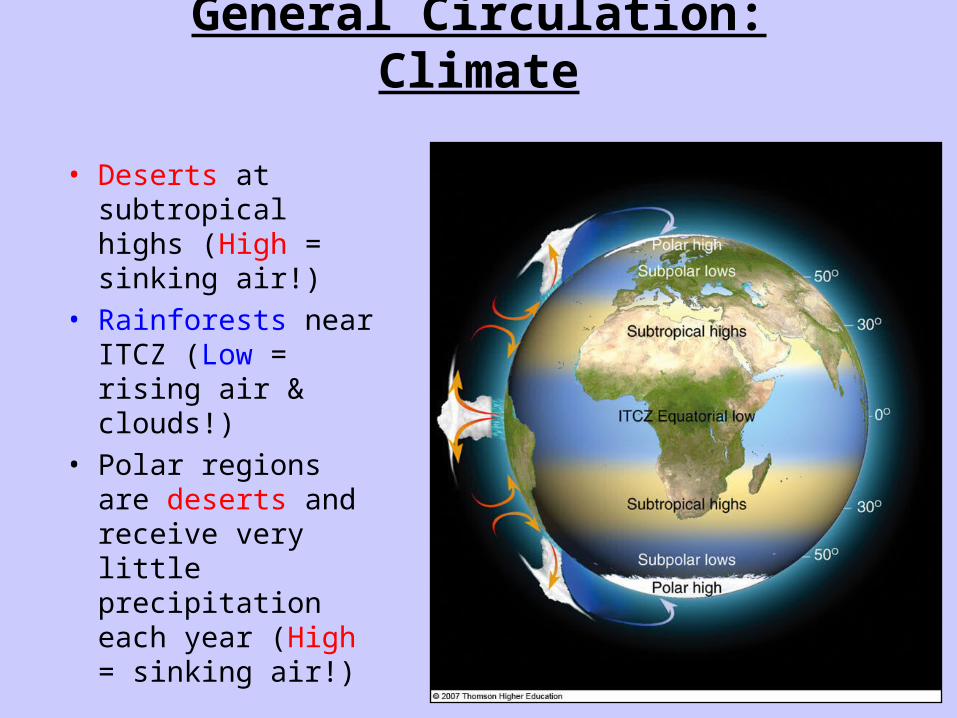
General Circulation: Climate
• Deserts at subtropical highs (High = sinking air!)
• Rainforests near ITCZ (Low = rising air & clouds!)
• Polar regions are deserts and receive very little precipitation each year (High = sinking air!)
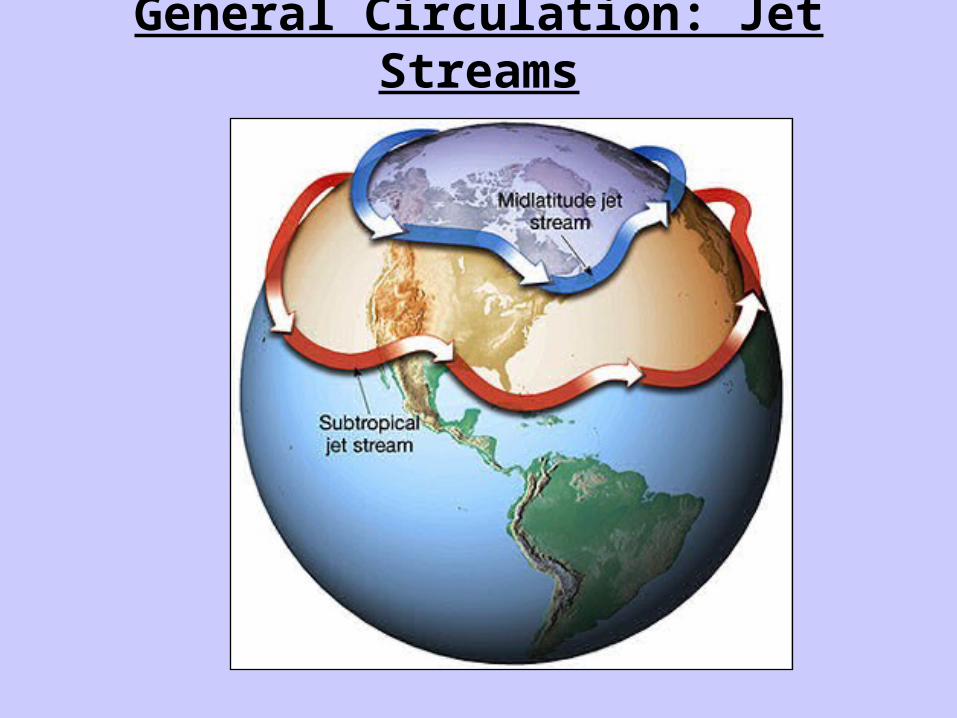
General Circulation: Jet Streams

Pressure
• Pressure is the weight of air molecules ABOVE you
• Pressure decreases with altitude because there are less air molecules above you as your rise
• As a result of pressure changes, Temperature, Density, and Volume change too as you rise
http://www.srh.noaa.gov/jetstream//atmos/images/mb_heights.jpg

Upper Tropospheric Pressure Surfaces
The height of a The height of a pressure surface pressure surface above ground is above ground is analogous to the analogous to the pressure.pressure.
As an example, a low As an example, a low height of the 500 mb height of the 500 mb surface is analogous to surface is analogous to lower pressure. This lower pressure. This will be very important will be very important when we analyze when we analyze upper tropospheric upper tropospheric data.data. Figure: A 3-dimensional representation
of the height of the 500 mb surface (in meters)

Thickness...
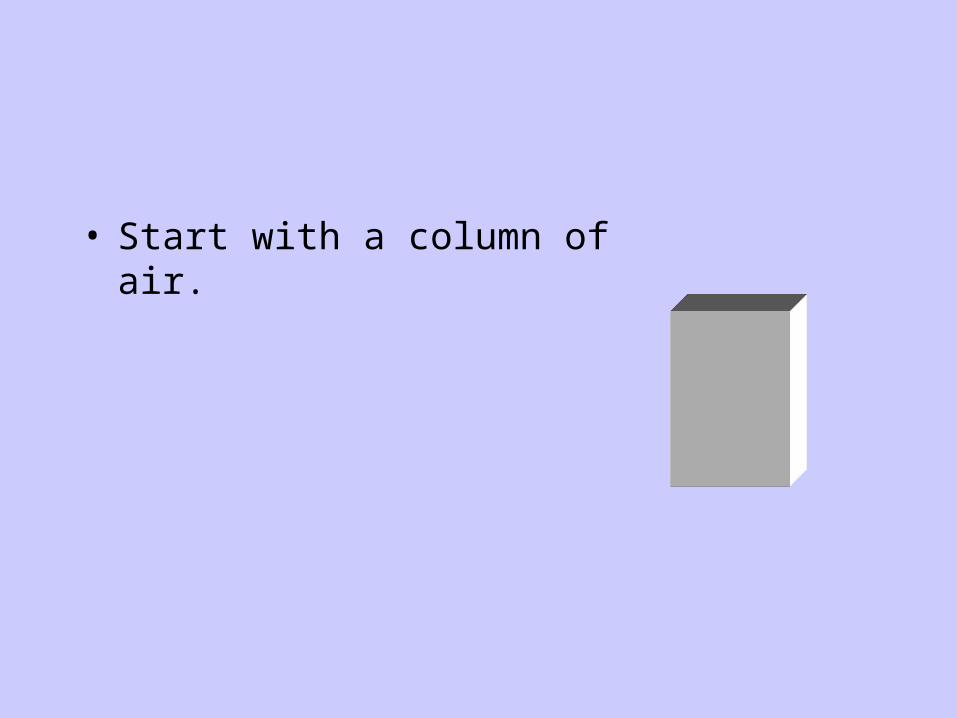
• Start with a column of air.
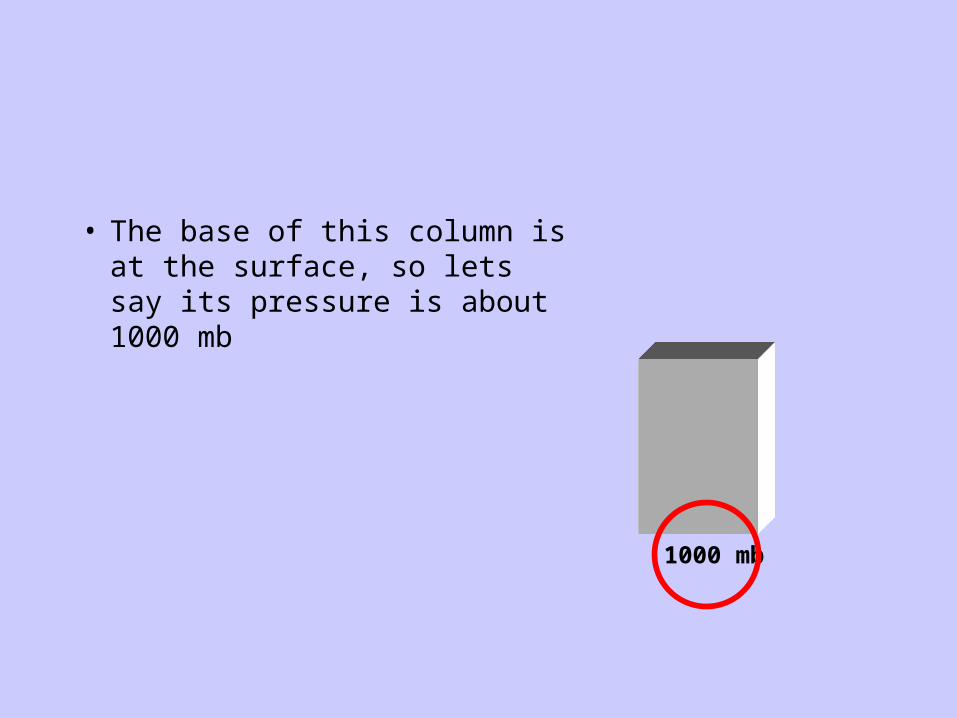
• The base of this column is at the surface, so lets say its pressure is about 1000 mb
1000 mb

• The top of this column is quite high—let’s say that its pressure is 500 mb
1000 mb
500 mb

• This column has some thickness: it is some distance between 1000 mb and 500 mb
1000 mb
500 mb
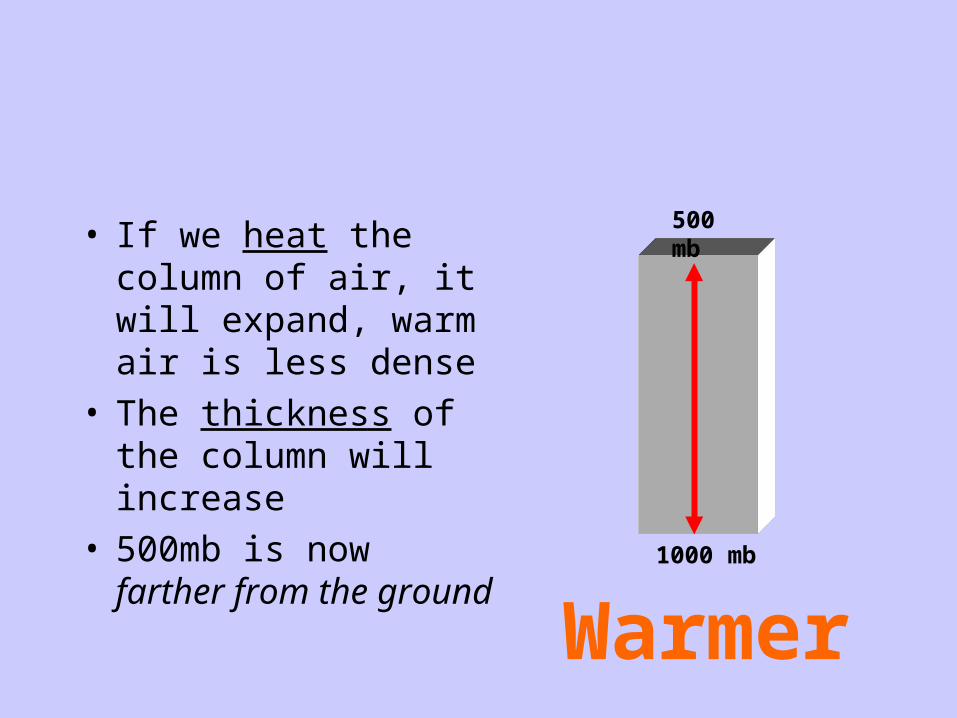
• If we heat the column of air, it will expand, warm air is less dense
• The thickness of the column will increase
• 500mb is now farther from the ground
1000 mb
500 mb
Warmer
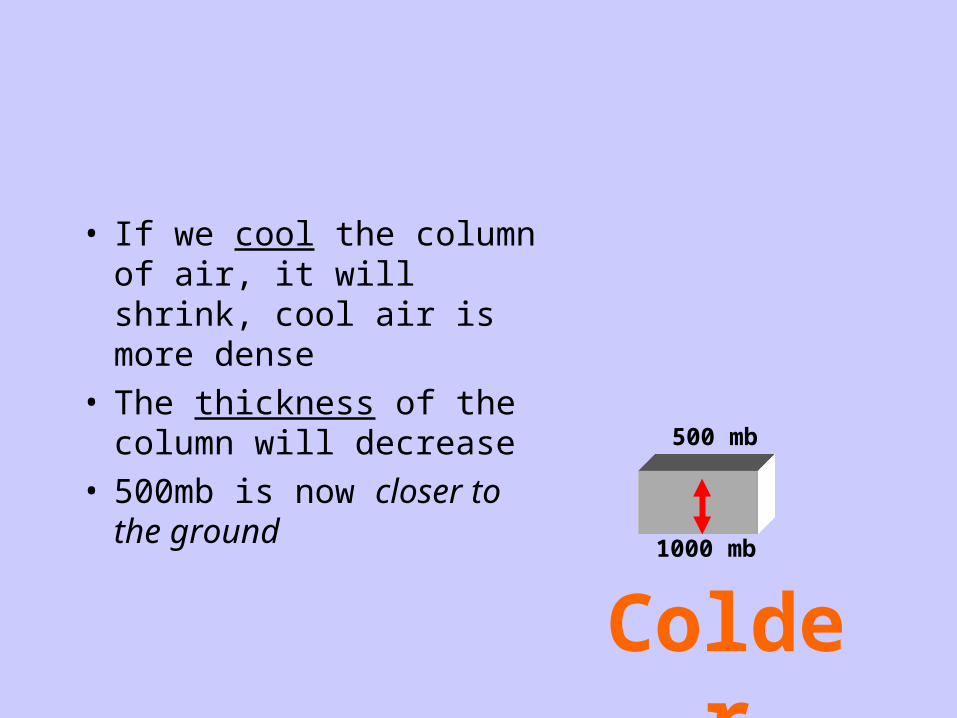
• If we cool the column of air, it will shrink, cool air is more dense
• The thickness of the column will decrease
• 500mb is now closer to the ground
1000 mb
500 mb
Colder
Thickness
• In fact, temperature is the ONLY factor in the atmosphere that determines the thickness of a layer
• It wouldn’t have mattered which pressure we had chosen. They are all higher above the ground when it is warmer….
Thickness
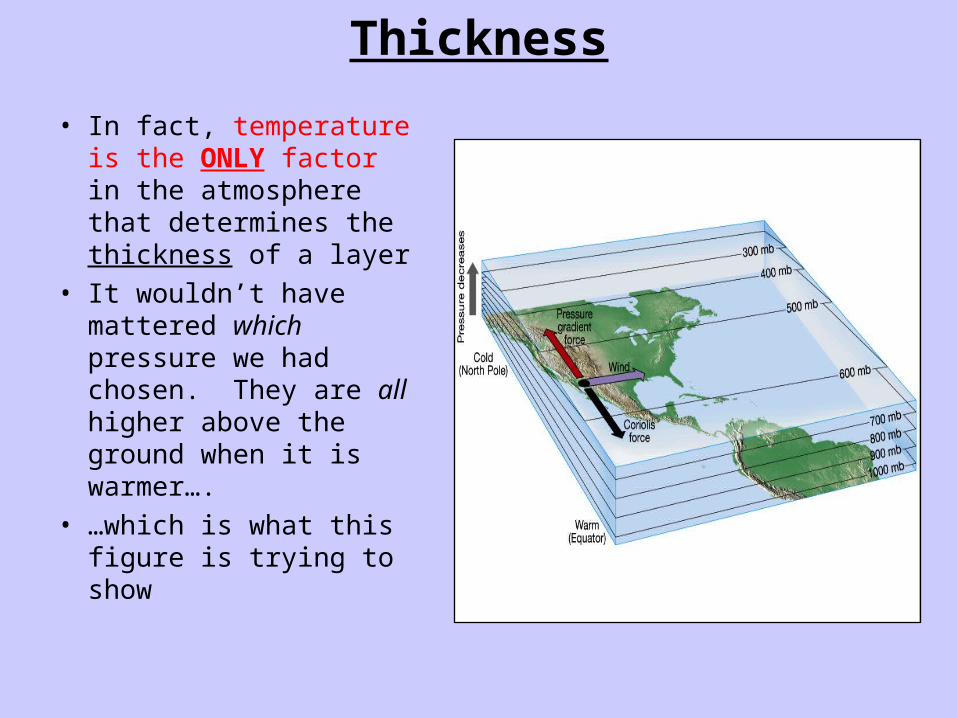
• In fact, temperature is the ONLY factor in the atmosphere that determines the thickness of a layer
• It wouldn’t have mattered which pressure we had chosen. They are all higher above the ground when it is warmer….
• …which is what this figure is trying to show

Thickness
• At the poles, 700 mb is quite low to the ground
• These layers are not very “thick”
• In the tropics, 700mb is much higher above the ground
• See how “thick” these layers are

General Circulation!
Let’s think about what thickness means near a polar front, where cold air and warm air are meeting

This is a cross section of the atmosphere
North
COLDSouth
WARM

Cold air is coming from the north. This air comes from the polar vortex near the North Pole
North
COLDSouth
WARM

Warm air is coming from the south. This air comes from the subtropical high near 30°N
North
COLDSouth
WARM
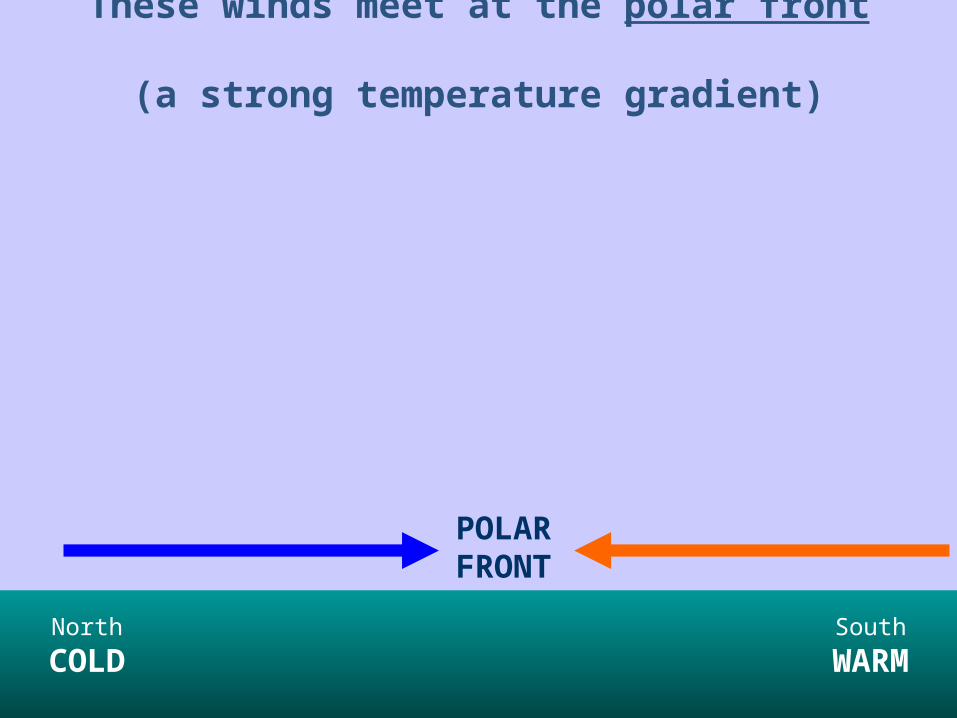
These winds meet at the polar front (a strong temperature gradient)
North
COLDSouth
WARM
POLAR FRONT
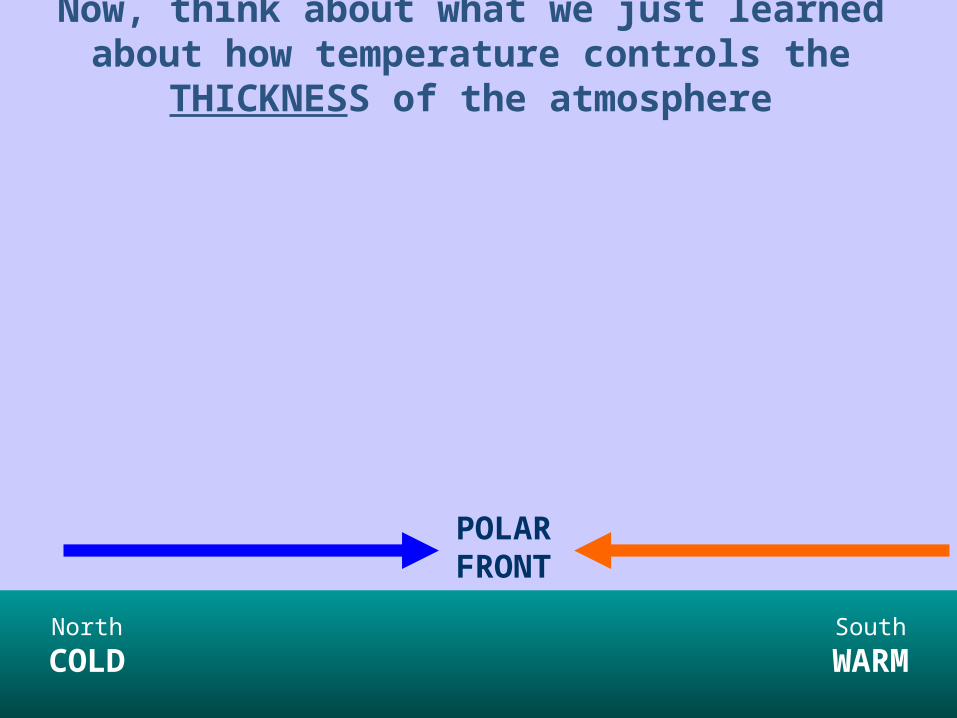
Now, think about what we just learned about how temperature controls the THICKNESS of the atmosphere
North
COLDSouth
WARM
POLAR FRONT

On the warm side of the front, pressure levels like 500mb and 400mb are going to be very high above the ground
North
COLDSouth
WARM
POLAR FRONT
500mb
400mb

On the cold side of the front, pressure levels like 500mb and 400mb are going to be very low to the ground
North
COLDSouth
WARM
POLAR FRONT
500mb
400mb
500mb
400mb
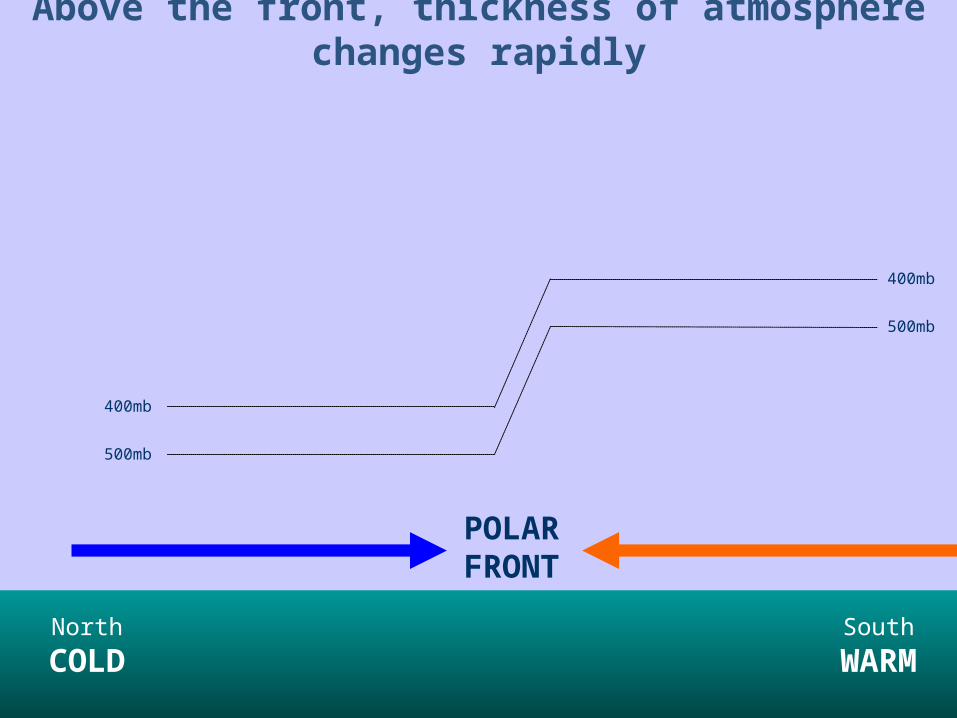
Above the front, thickness of atmosphere changes rapidly
North
COLDSouth
WARM
POLAR FRONT
500mb
400mb
500mb
400mb
Now, what about the PGF above the front?
North
COLDSouth
WARM
POLAR FRONT
500mb
400mb
500mb
400mb

Let’s draw a line between the cold side of the front and the warm side
North
COLDSouth
WARM
POLAR FRONT
500mb
400mb
500mb
400mb
A B
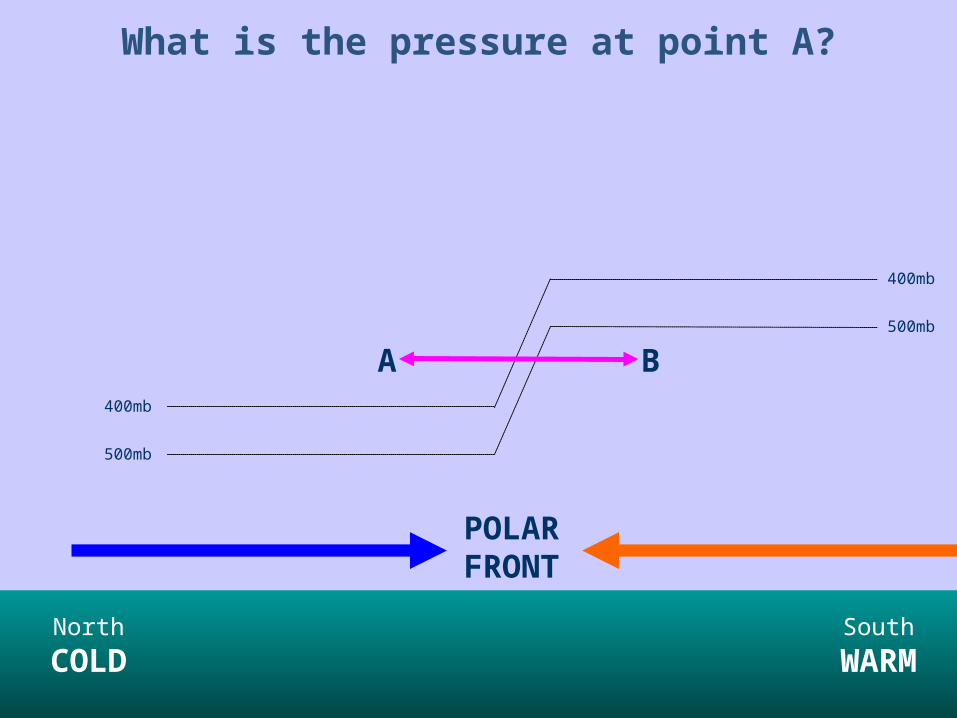
What is the pressure at point A?
North
COLDSouth
WARM
POLAR FRONT
500mb
400mb
500mb
400mb
A B
The pressure at point A is less than 400mb, since it is higher than the 400mb isobar on this plot. Let’s estimate
the pressure as 300mb
North
COLDSouth
WARM
POLAR FRONT
500mb
400mb
500mb
400mb
A B300mb

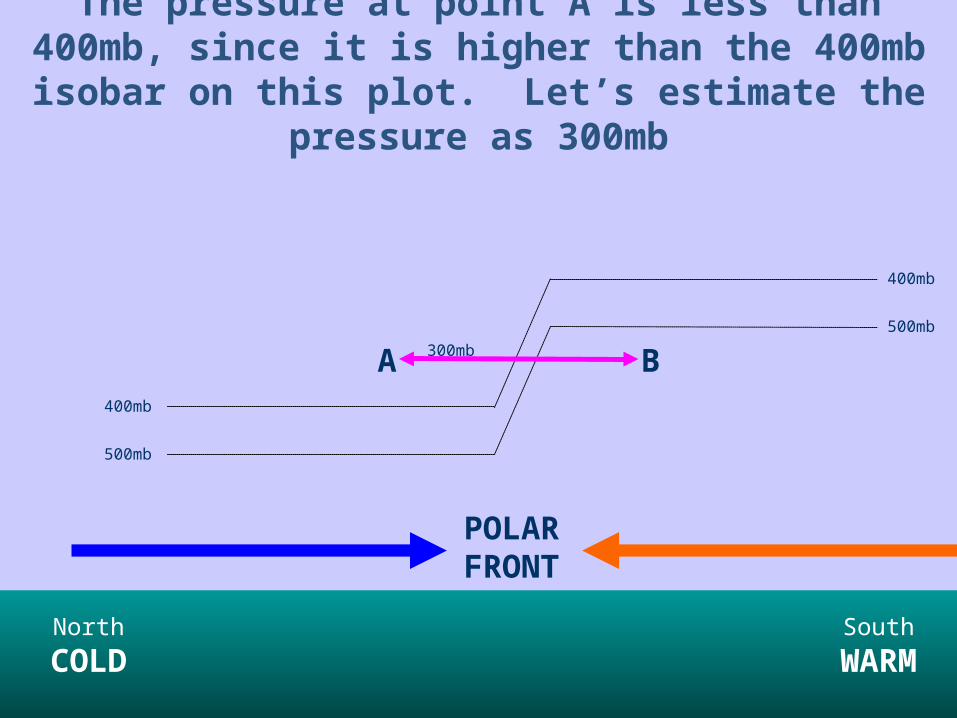
What is the pressure at point B?
North
COLDSouth
WARM
POLAR FRONT
500mb
400mb
500mb
400mb
A B300mb
The pressure at point B is more than 500mb, since it is lower than the 500mb isobar on this plot. Let’s estimate
the pressure as 600mb
North
COLDSouth
WARM
POLAR FRONT
500mb
400mb
500mb
400mb
A B300mb 600mb
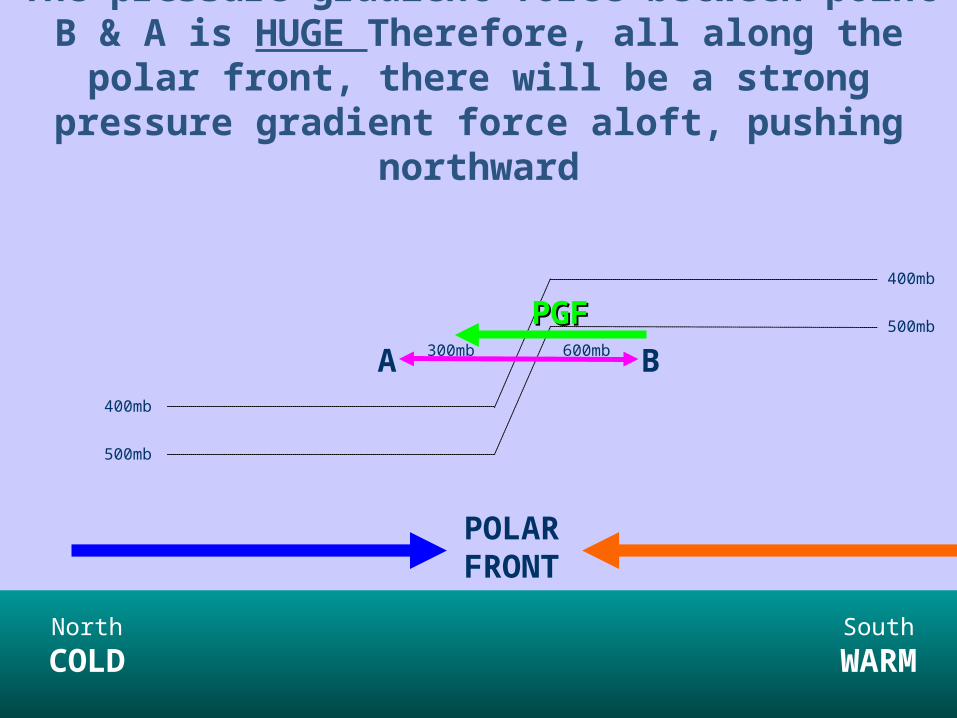
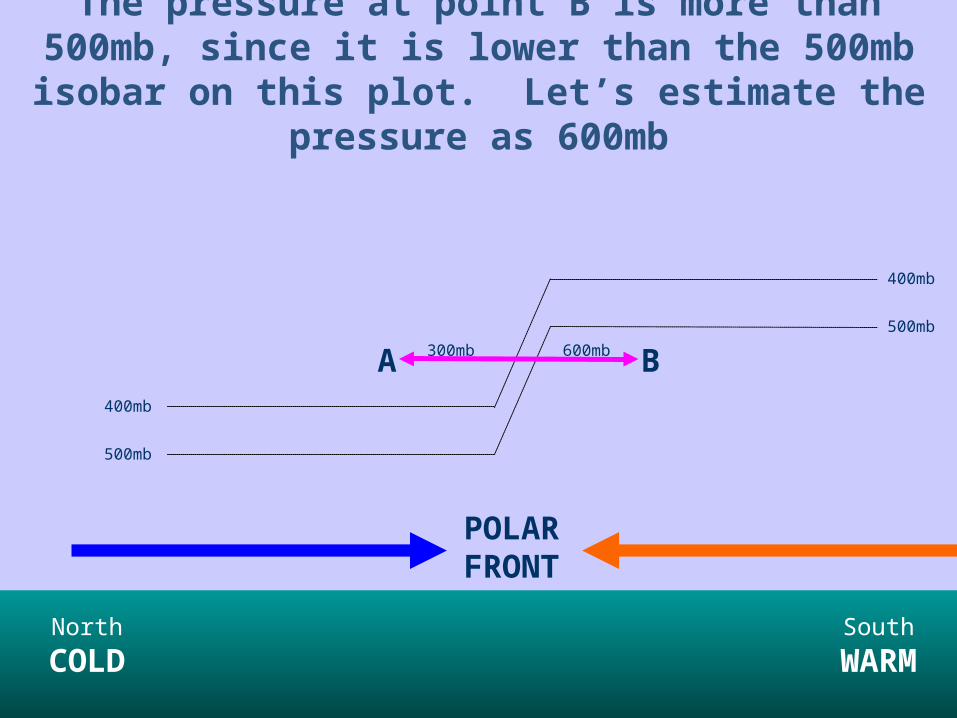
The pressure gradient force between point B & A is HUGE Therefore, all along the polar front, there will be a strong
pressure gradient force aloft, pushing northward
North
COLDSouth
WARM
POLAR FRONT
500mb
400mb
500mb
400mb
A B300mb 600mb
PGFPGF
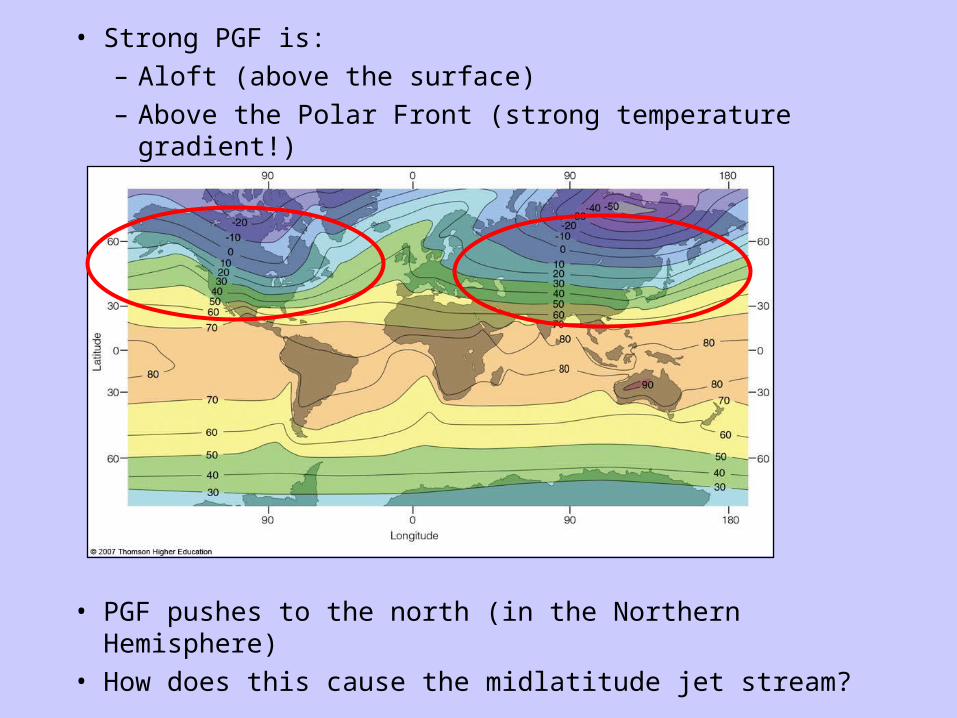
• Strong PGF is:
– Aloft (above the surface)
– Above the Polar Front (strong temperature gradient!)
• PGF pushes to the north (in the Northern Hemisphere)
• How does this cause the midlatitude jet stream?
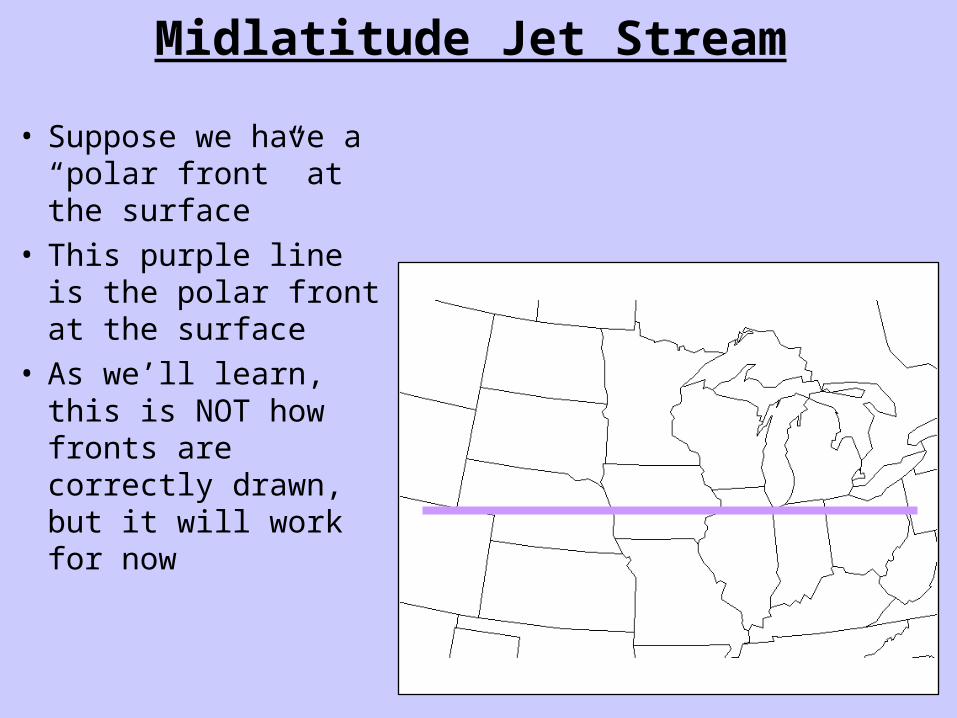
Midlatitude Jet Stream
• Suppose we have a “polar front” at the surface
• This purple line is the polar front at the surface
• As we’ll learn, this is NOT how fronts are correctly drawn, but it will work for now
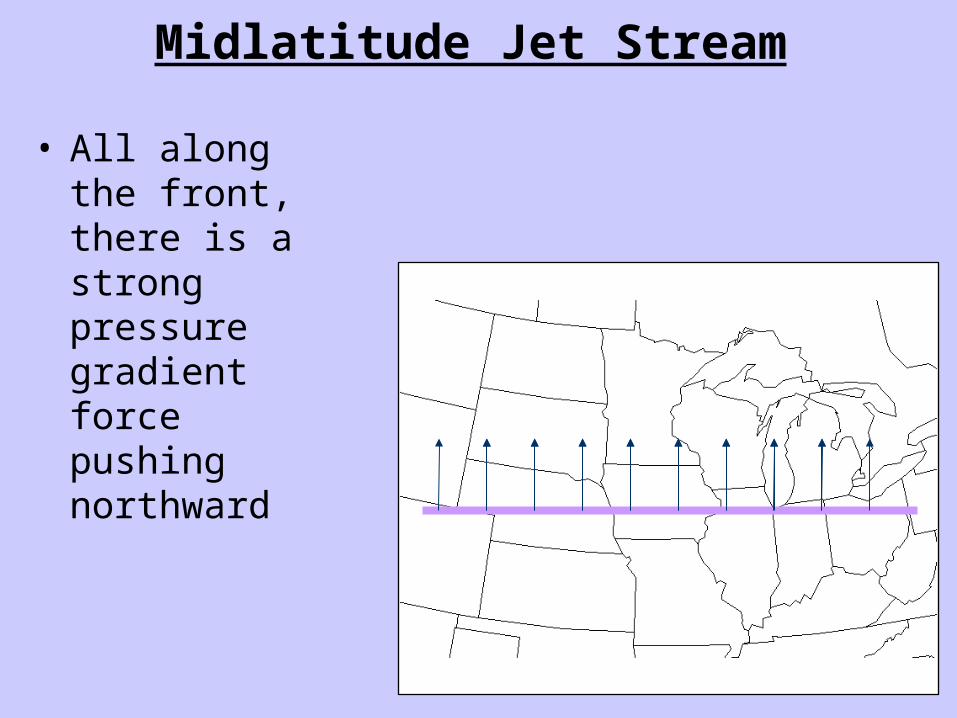
Midlatitude Jet Stream
• All along the front, there is a strong pressure gradient force pushing northward

Midlatitude Jet Stream
• Winds aloft are in geostrophic balance…
Midlatitude Jet Stream
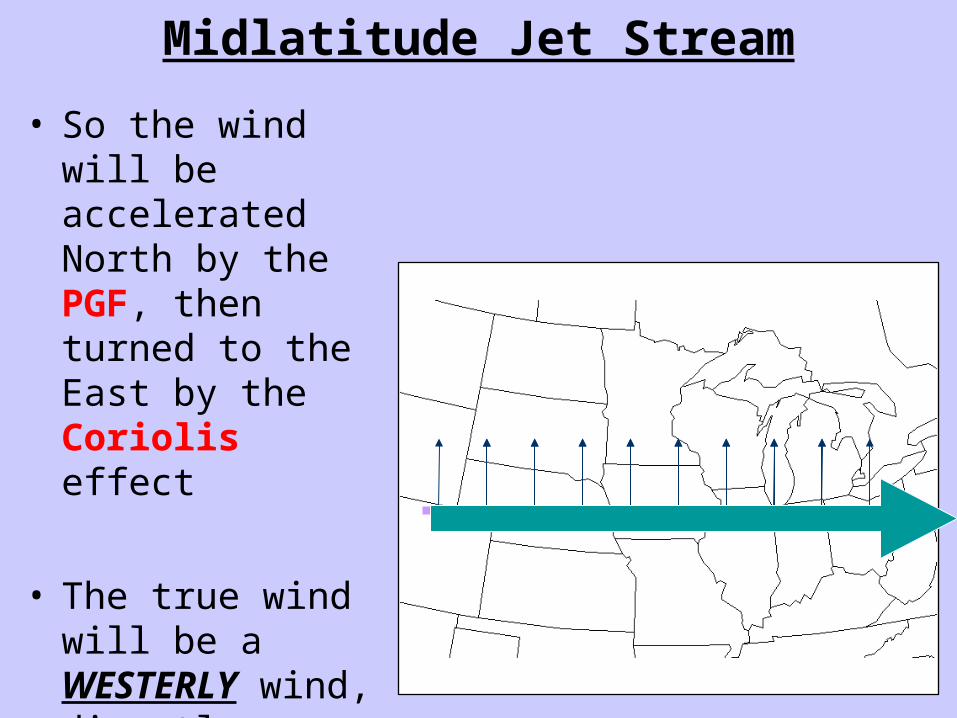
• So the wind will be accelerated North by the PGF, then turned to the East by the Coriolis effect
• The true wind will be a WESTERLY wind, directly above the “polar front”
Midlatitude Jet Stream
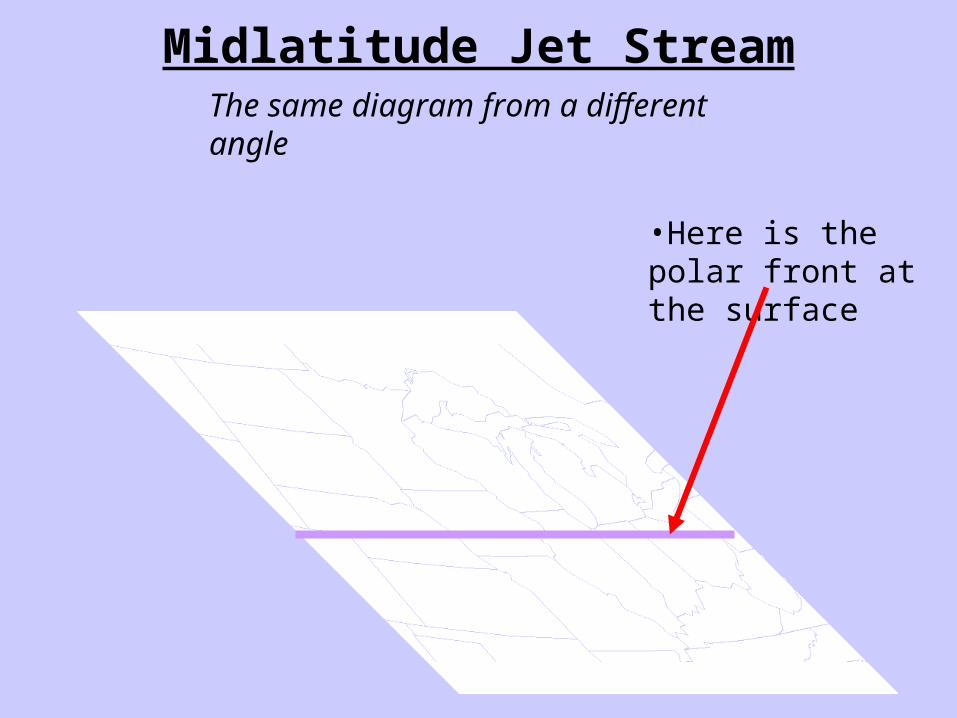
•Here is the polar front at the surface
The same diagram from a different angle

Midlatitude Jet Stream
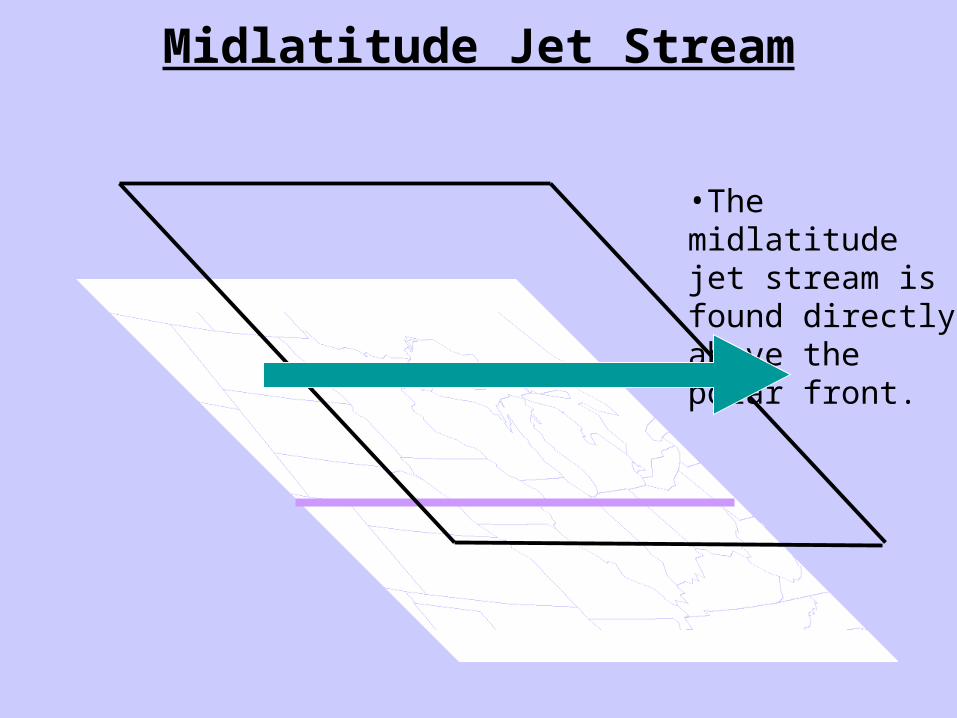
•Remember, it’s a polar front because it is where warm air from the south meets cold air from the north.
Midlatitude Jet Stream
•The midlatitude jet stream is found directly above the polar front.
Midlatitude Jet Stream
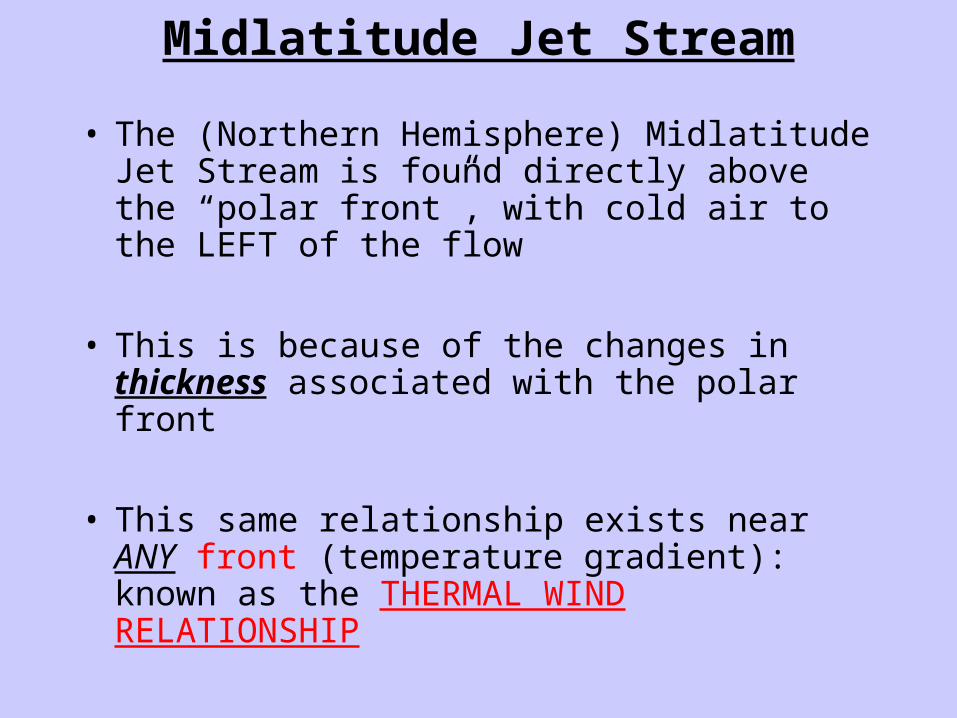
• The (Northern Hemisphere) Midlatitude Jet Stream is found directly above the “polar front”, with cold air to the LEFT of the flow
• This is because of the changes in thickness associated with the polar front
• This same relationship exists near ANY front (temperature gradient): known as the THERMAL WIND RELATIONSHIP
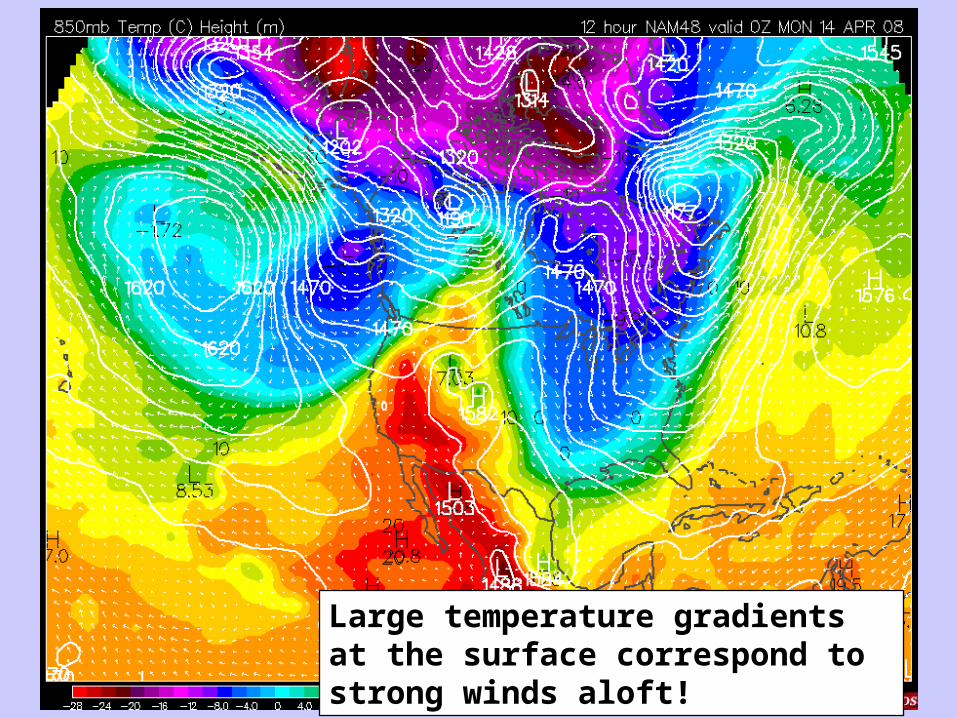
Large temperature gradients at the surface correspond to strong winds aloft!

Large temperature gradients at the surface correspond to strong winds aloft!

Thermal Wind
• Upper-level winds will be much stronger than low-level winds (i.e. thermal wind will be very close to upper-level wind)
• Equal to the SHEAR of the geostrophic wind (i.e. change of geostrophic wind with height)
• Not an actual wind• Stronger temperature gradients imply
stronger thermal wind• “Blows” along thickness contours with
(low thickness) air to the leftUpper level geostrophic wind
Lower Level Geostrophic Wind
Thermal Wind

Thermal Wind
VVTT
Lower Level Geostrophic Wind
Upper level geostrophic wind
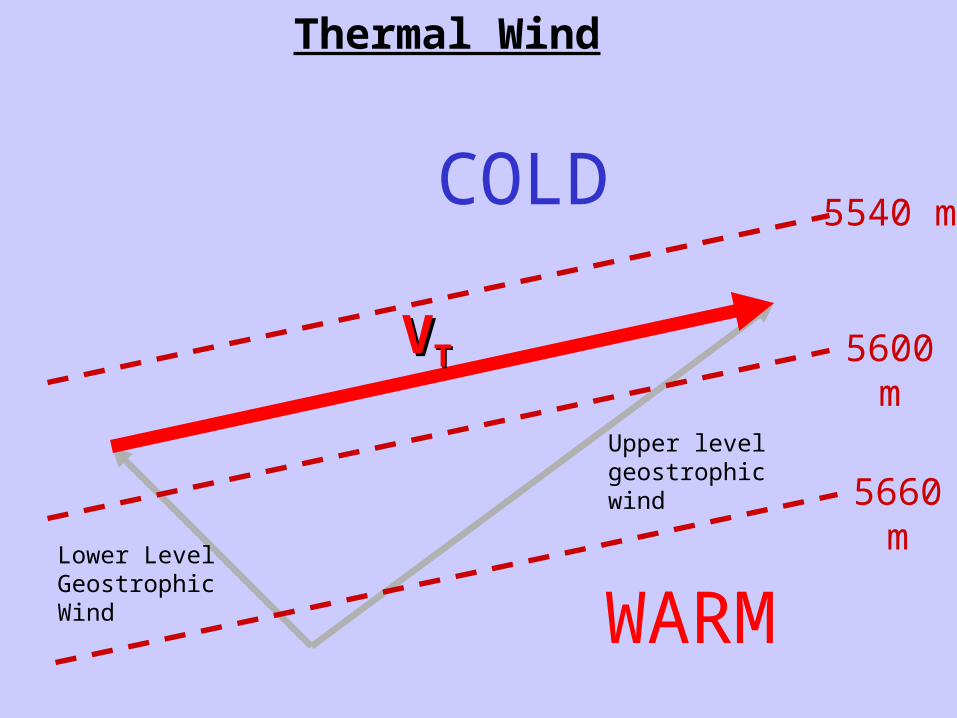
Thermal Wind
VVTT
COLD
WARM
5600 m
5540 m
5660 m
Lower Level Geostrophic Wind
Upper level geostrophic wind
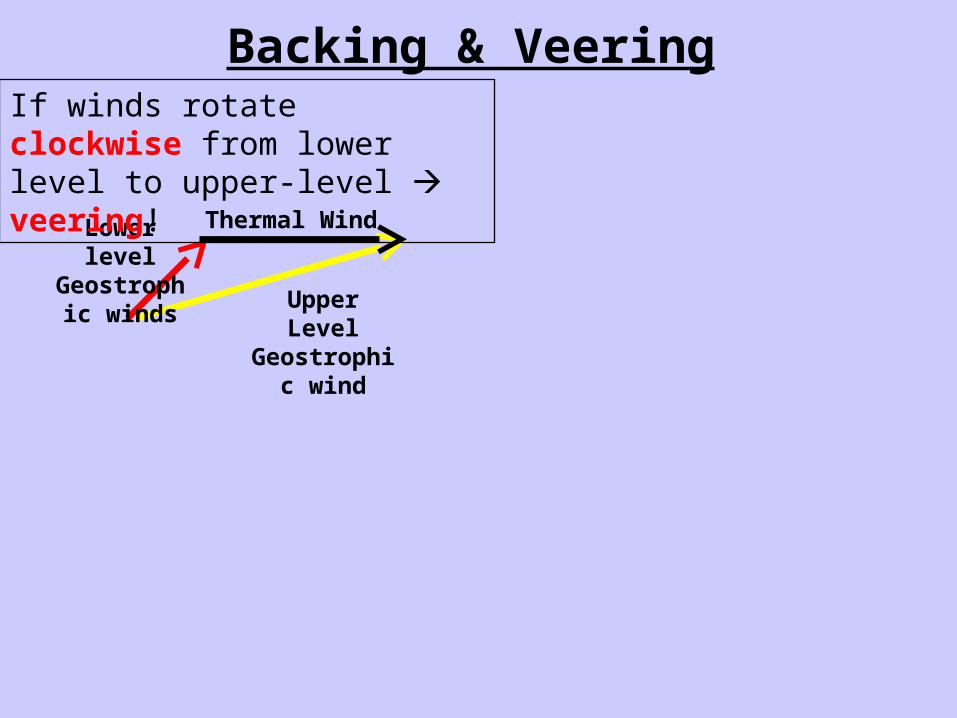
Backing & Veering
Lower levelGeostrophic
windsUpper LevelGeostrophic
wind
Thermal Wind
If winds rotate clockwise from lower level to upper-level veering!
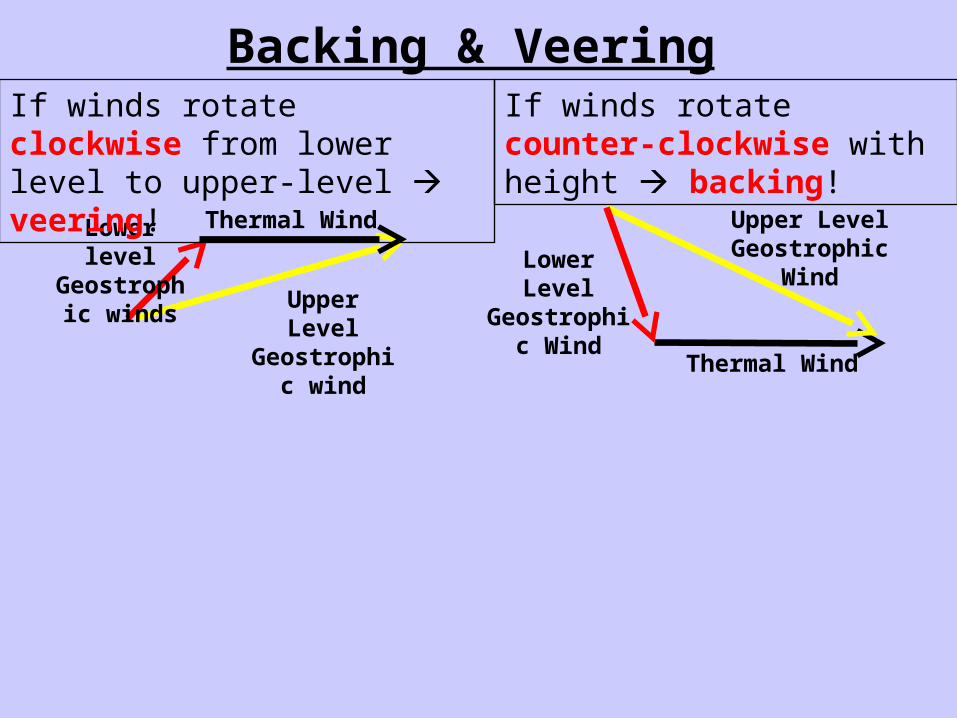
Backing & Veering
Lower levelGeostrophic
windsUpper LevelGeostrophic
wind
Thermal Wind
If winds rotate clockwise from lower level to upper-level veering!
Thermal Wind
Upper Level Geostrophic
WindLower LevelGeostrophic
Wind
If winds rotate counter-clockwise with height backing!

Backing & Veering
Lower levelGeostrophic
windsUpper LevelGeostrophic
wind
Thermal Wind
If winds rotate clockwise from lower level to upper-level veering!
Thermal Wind
Upper Level Geostrophic
WindLower LevelGeostrophic
Wind
If winds rotate counter-clockwise with height backing!

Backing & Veering
Lower levelGeostrophic
windsUpper LevelGeostrophic
wind
Thermal Wind
If winds rotate clockwise from lower level to upper-level veering!
Thermal Wind
Upper Level Geostrophic
WindLower LevelGeostrophic
Wind
If winds rotate counter-clockwise with height backing!
Warm Air Advection! Cold Air Advection!